Atmos. Chem. Phys., 16, 5623–5639, 2016
www.atmos-chem-phys.net/16/5623/2016/
doi:10.5194/acp-16-5623-2016
© Author(s) 2016. CC Attribution 3.0 License.
Atmospheric mercury speciation dynamics at the high-altitude
Pic du Midi Observatory, southern France
Xuewu Fu1,2, Nicolas Marusczak1, Lars-Eric Heimbürger1,3, Bastien Sauvage4, François Gheusi4, Eric M. Prestbo5,
and Jeroen E. Sonke1
1Observatoire Midi-Pyrénées, Laboratoire Géosciences Environnement Toulouse, CNRS/IRD/Université de Toulouse,
14, Avenue Édouard Belin, 31400 Toulouse, France2State Key Laboratory of Environmental Geochemistry, Institute of Geochemistry, Chinese Academy of Sciences,
46 Guanshui Road, 550002 Guiyang, China3Mediterranean Institute of Oceanography, Campus de Luminy,13288 Marseille, France4Observatoire Midi-Pyrénées, Laboratoire d’Aérologie, CNRS/IRD/Université de Toulouse, 14, Avenue Édouard Belin,
31400 Toulouse, France5Tekran Research and Development, 330 Nantucket Blvd., Toronto, ON, M1P2P4, Canada
Correspondence to: Xuewu Fu ([email protected]) and Jeroen E. Sonke ([email protected])
Received: 17 October 2015 – Published in Atmos. Chem. Phys. Discuss.: 2 February 2016
Revised: 6 April 2016 – Accepted: 20 April 2016 – Published: 4 May 2016
Abstract. Continuous measurements of atmospheric gaseous
elemental mercury (GEM), particulate bound mercury
(PBM) and gaseous oxidized mercury (GOM) at the
high-altitude Pic du Midi Observatory (PDM Observatory,
2877 m a.s.l.) in southern France were made from November
2011 to November 2012. The mean GEM, PBM and GOM
concentrations were 1.86 ng m−3, 14 pg m−3 and 27 pg m−3,
respectively and we observed 44 high PBM (peak PBM val-
ues of 33–98 pg m−3) and 61 high GOM (peak GOM val-
ues of 91–295 pg m−3) events. The high PBM events oc-
curred mainly in cold seasons (winter and spring) whereas
high GOM events were mainly observed in the warm sea-
sons (summer and autumn). In cold seasons the maximum
air mass residence times (ARTs) associated with high PBM
events were observed in the upper troposphere over North
America. The ratios of high PBM ARTs to total ARTs over
North America, Europe, the Arctic region and Atlantic Ocean
were all elevated in the cold season compared to the warm
season, indicating that the middle and upper free troposphere
of the Northern Hemisphere may be more enriched in PBM
in cold seasons. PBM concentrations and PBM / GOM ra-
tios during the high PBM events were significantly anti-
correlated with atmospheric aerosol concentrations, air tem-
perature and solar radiation, suggesting in situ formation
of PBM in the middle and upper troposphere. We identi-
fied two distinct types of high GOM events with the GOM
concentrations positively and negatively correlated with at-
mospheric ozone concentrations, respectively. High GOM
events positively correlated with ozone were mainly related
to air masses from the upper troposphere over the Arctic re-
gion and middle troposphere over the temperate North At-
lantic Ocean, whereas high GOM events anti-correlated with
ozone were mainly related to air masses from the lower free
troposphere over the subtropical North Atlantic Ocean. The
ARTs analysis demonstrates that the lower and middle free
troposphere over the North Atlantic Ocean was the largest
source region of atmospheric GOM at the PDM Observatory.
The ratios of high GOM ARTs to total ARTs over the sub-
tropical North Atlantic Ocean in summer were significantly
higher than those over the temperate and sub-arctic North At-
lantic Ocean as well as that over the North Atlantic Ocean in
other seasons, indicating abundant in situ oxidation of GEM
to GOM in the lower free troposphere over the subtropical
North Atlantic Ocean in summer.
Published by Copernicus Publications on behalf of the European Geosciences Union.
5624 X. Fu et al.: Atmospheric mercury speciation dynamics
1 Introduction
Transformations of mercury (Hg) in the atmosphere play a
crucial role in the global Hg cycle (Selin et al., 2007; Driscoll
et al., 2013). Gaseous elemental mercury (GEM) is the pre-
dominant form emitted by anthropogenic and natural sources
(Pirrone et al., 2010). GEM is then transformed to gaseous
oxidized mercury (GOM) and particulate bound mercury
(PBM) by oxidation. Atmospheric Hg deposition occurs by
wet deposition and dry deposition pathways. Models suggest
global GEM dry deposition to be potentially important, yet
lack broad observational evidence (Selin et al., 2008). On the
other hand, GOM and PBM are readily scavenged from the
atmosphere by wet deposition and dry deposition pathways.
Due to its fast dry deposition velocities, GOM is thought to
be mainly scavenged from the atmosphere by dry deposition,
whereas wet deposition plays a more important role in the
removal of PBM in the atmosphere (Lee et al., 2001; Zhang
et al., 2009; Lin et al., 2010). Hence, conversion of GEM to
GOM and PBM is a crucial process in the removal of Hg in
the atmosphere, which in turn affects the loading of Hg to
terrestrial and marine ecosystems.
Conversion of GEM to GOM and PBM is potentially oc-
curring throughout the global atmosphere, but the rates of
conversion are thought to vary and are dependent on the lev-
els of atmospheric oxidants and environmental factors. Cur-
rent modeling studies suggested that conversion of GEM to
GOM and PBM produces approximately 8000 tons of GOM
and PBM annually, which explains at least 90 % of the total
sources of GOM and PBM in the atmosphere (Holmes et al.,
2010). However, it is still unclear where the majority of the
conversion takes place, by what mechanism and which ma-
jor oxidants and environmental factors are involved. Over the
last decade, studies have been carried out to measure atmo-
spheric Hg speciation at high-altitude sites in the USA and
Asia and on research flights. A study at the Mount Bache-
lor observatory (MBO, USA) showed elevated GOM (up to
600 pg m−3) and low GEM in the free troposphere, suggest-
ing in situ oxidation (Swartzendruber et al., 2006). Observa-
tions at Storm Peak laboratory (SPL, USA) and Lulin Atmo-
spheric Background Station (LABS, Taiwan) showed simi-
lar, though less elevated, GOM events in free tropospheric
air masses (Fain et al., 2009; Sheu et al., 2010). Long-term
Hg speciation observations at MBO suggest GEM oxidation
to be enhanced in long-range Asian pollution plumes, but
also in marine boundary layer (MBL) air masses originat-
ing over the Pacific Ocean (Timonen et al., 2013). INTEX-
B in-flight observations of GEM in the tropopause region
(8–12 km) have shown low GEM levels, sometimes down
to zero, indicative of rapid oxidation (Talbot et al., 2007).
CARIBIC in-flight observations of total gaseous Hg (TGM
∼GEM+GOM) showed lower TGM levels in the south-
ern hemisphere, TGM depletion in the extratropical lower-
most stratosphere and a general negative correlation between
TGM and ozone (Slemr et al., 2009, 2014). In-flight, in situ
analyses of stratospheric aerosols suggest that the upper tro-
posphere and lower stratosphere depletion in GEM is bal-
anced by abundant PBM (Murphy et al., 1998, 2006). Recent
in-flight measurements provided the first simultaneous obser-
vations of both GEM and the combined GOM+PBM frac-
tions at an altitude above 6 km (Lyman and Jaffe, 2012). The
study showed elevated GOM+PBM levels in stratospheric
air masses and confirmed the importance of stratospheric
GEM oxidation. The findings of all these studies indicate that
the free troposphere and lower stratosphere are important re-
gions for conversion of GEM to GOM and PBM.
A recent study reviewed mountain-top studies of free tro-
posphere Hg dynamics and compared observations to the
GEOS-Chem atmospheric Hg chemistry and transport model
(Weiss-Penzias et al., 2015). The model intercompared Hg
oxidation by Br against OH-ozone pathways and was able to
only marginally reproduce observations, indicating the need
to improve both measurement techniques and models. Ad-
ditional long-term observations of GEM, GOM, and PBM
are therefore necessary to map out regions and altitudes that
favor GEM oxidation, and provide insight into the oxida-
tion mechanisms. In the present study, we carried out 1 year
of continuous measurements of speciated atmospheric mer-
cury at the Pic du Midi (PDM) Observatory, a high-altitude
site (2877 m a.s.l.) in the French Pyrenees mountains. This is
the first year-around study of atmospheric Hg speciation at
a mid-latitude high-altitude site. This study may help to bet-
ter understand the seasonal patterns of high GOM and PBM
events and the mechanisms underlying the transformations of
atmospheric Hg in the free troposphere over the lower, mid-
dle and high latitudes.
2 Materials and methods
2.1 Site description
The Pic du Midi (PDM) Observatory (0.142◦ E, 42.937◦ N,
2877 m a.s.l.) is a high-altitude monitoring station situated
on top of an isolated peak (elevated approximately 1300 m
relative to the surrounding terrain) on the northern edge of
the central Pyrenees mountains, southwest France. It is ap-
proximately 150 km to the east of the North Atlantic coast
and 210 km to west of the Mediterranean Sea. The PDM Ob-
servatory frequently receives free tropospheric air from the
North Atlantic and Europe (Henne et al., 2010). The station
may also be partly influenced by boundary layer air trans-
ported by plain-to-mountain winds from southwest France
or through regional transport from Spain under southerly or
south-westerly synoptic wind conditions (Gheusi et al., 2011;
Tsamalis et al., 2014). There are no point sources around the
station or in the surrounding areas. The two nearest cities are
Pau and Tarbes which are respectively located 60 and 30 km
northwest to the station and may influence the observations
via upslope transport.
Atmos. Chem. Phys., 16, 5623–5639, 2016 www.atmos-chem-phys.net/16/5623/2016/
X. Fu et al.: Atmospheric mercury speciation dynamics 5625
2.2 Measurements of speciated atmospheric mercury
and ancillary parameters
Speciated atmospheric Hg is continuously measured at the
PDM Observatory using the Tekran 2537/1130/1135 system
(Tekran Inc., Canada). The period analyzed in this study goes
from 18 November 2011 to 17 November 2012. The Tekran
system has been widely used and described in detail else-
where (Landis et al., 2002; Lindberg et al., 2002). Briefly,
GOM, PBM, and GEM in ambient air were collected onto
KCl-coated annular denuder, regenerable quartz fiber filter
and dual gold cartridges in sequence. The system was pro-
grammed to collect GOM and PBM at 1 h intervals at a volu-
metric flow rate of 10 L min−1; and GEM was collected at
5 min intervals at a volumetric flow rate of 1.07 L min−1.
Once collected, Hg is thermally decomposed from each unit
and detected by cold vapor atomic fluorescence spectroscopy
(CVAFS) as Hg0. GEM concentrations were directly mea-
sured by the Tekran 2537 Analyzer. Recent studies have sug-
gested that the biased integration of small mercury loads
(e.g. <∼ 10 pg) may lead to a low bias of GOM and PBM
concentrations (Slemr et al., 2016; Swartzendruber et al.,
2009). In this study, final GOM and PBM concentrations
were calculated following the method proposed by the At-
mospheric Mercury Network (AMNet) quality control (Stef-
fen et al., 2012). Concentrations of GEM are expressed in
ng m−3 (STP) and GOM and PBM are expressed in pg m−3
(STP) with standard temperature of 273.14 K and pressure
of 1013 hPa. KCl-coated denuder, Teflon coated glass inlet,
and impactor plate were replaced bi-weekly and quartz fil-
ters were replaced monthly. Denuders and quartz filters were
prepared and cleaned before field sampling following the
methods in Tekran technical notes. The Tekran 2537B an-
alyzer was routinely calibrated using its internal permeation
source at a 47 h interval, and was also cross-calibrated ev-
ery 3 months against an external temperature controlled Hg
vapor standard. Due to the frequent extreme weather con-
ditions at the PDM Observatory, the system was installed in-
side a temperature-controlled laboratory. Ambient air was in-
troduced into the Tekran unit using the Tekran 1004 Teflon
coated manifold, which is similar as that used at the MBO,
USA (Swartzendruber et al., 2006). The inlet of the Tekran
1104 manifold was about 0.5 m from the outside wall of
the laboratory and oriented to the southwest (the local pre-
dominant wind direction) of the laboratory. Temperature of
the Tekran 1104 manifold was kept at 70 ◦C and air flow
through the manifold was about 100 L min−1. Blanks of
Tekran unit and manifold were quantified at the beginning
and end of each maintenance (bi-weekly) using Hg-free am-
bient air. The annual mean GEM blank of the Tekran unit
was 0.04± 0.03 ng m−3 (1 SD) and detection limit of GEM
was estimated to be 0.1 ng m−3.
Measurement of GOM and PBM is challenging due to the
typical low part per quadrillion (ppq) concentrations, reactiv-
ity and potential for species interconversion, and the need to
pre-concentrating on a surface. In addition the lack of un-
derstanding of the specific forms and accepted calibration
standards of GOM and PBM hinders the ability to obtain in-
field quality assurance measurements, like dynamic spiking
under changing atmospheric conditions. Recently, uncertain-
ties regarding the accuracy of GOM measurements have been
discovered related to O3 and water vapor levels suggesting a
potential for low GOM bias under certain atmospheric condi-
tions (Lyman et al., 2010; Gustin et al., 2013). Another study
suggested that GOM concentrations measured by cation ex-
change membranes were 1.3 to 3.7 times higher than that
measured by KCl-coated denuders, but was only a compari-
son of two differing methods, with neither one challenged in
real time by standard spiking under atmospheric conditions
(Huang et al., 2013). On the other hand, the potential for the
PBM to be biased has not been thoroughly studied and un-
derstood, for the reasons mentioned above, however the bias
would likely be positive due to GEM uptake as the regen-
erable filter ages and becomes more reactive. At the PDM
Observatory, similar to other high-altitude studies, we do not
observe simultaneous increases of PBM during high GOM
events suggesting no significant GOM breakthrough or GEM
uptake on the filter (Malcolm and Keeler, 2007; Swartzen-
druber et al., 2006; Fain et al., 2009). Similarly GOM loss
from denuders has been suggested to relate to high humidity
levels (McClure et al., 2014). The elevated free tropospheric
PBM and GOM events discussed in this study occur predom-
inantly in low humidity air masses (median humidity of 21
and 28 % respectively) limiting GOM losses. Therefore, as
most of the discussion in the present study is based on the
relative variations of GOM and PBM, we assume the poten-
tial sampling artifacts may bring a minimal uncertainty to the
overall findings. Most importantly, the method used in this
study and others is “state of the art” at this time and has re-
sulted in profound discoveries that are scientifically coherent
(Schroeder and Munthe, 1998; Laurier et al., 2003; Lindberg
et al., 2002; Swartzendruber et al., 2006; Steffen et al., 2008;
Sprovieri et al., 2010; Fu et al., 2015). Currently, there is no
better method to routinely separate and quantify low, part-
per-quadrillion concentrations of the mercury fractions with
hourly time resolution, than the use of a fully heated sample
train that rejects large particles (> 2.5 µm) by impaction, cap-
ture of “sticky” GOM species on a laminar flow, coated annu-
lar denuder, which rejects both PBM and GEM, followed by
a quartz fiber filter to collect PBM, which rejects GEM so it
can pass to a sensitive monitor for continuous detection. The
operationally defined method to quantify atmospheric mer-
cury fractions is similar to well established methods used for
other “sticky gases” ammonia and nitric acid.
Atmospheric CO and ozone concentrations were continu-
ously measured using the TEI 48CTL gas filter correlation
analyzers and 49C Ozone analyzer (Thermo Environmen-
tal Instruments Inc. USA), respectively. Detailed informa-
tion regarding the principle of the instruments, calibrations,
and measurement uncertainties can be found in a previous
www.atmos-chem-phys.net/16/5623/2016/ Atmos. Chem. Phys., 16, 5623–5639, 2016
5626 X. Fu et al.: Atmospheric mercury speciation dynamics
study (Gheusi et al., 2011). The standard uncertainties asso-
ciated with CO and ozone data sets (15 min averaged data)
were reported to be 6.6 and 1.2 ppbv, respectively (Gheusi
et al., 2011). Atmospheric aerosol number concentration in
PM10 particles (i.e. of diameter < 10 µm) was measured at
the PDM Observatory using a condensation particle counter
(CPC), Model 3010 by TSI Inc. The particles are detected by
condensing butanol vapor onto the particles, causing them
to grow into droplets. These particles (in the droplet form)
are then counted by optical absorption (Gheusi et al., 2011).
CO and ozone mole fractions, as well as atmospheric aerosol
number concentration and standard meteorological variables
at the PDM Observatory were obtained as 5 min averages
from the PAES (French acronym for atmospheric pollution
at synoptic scale; http://paes.aero.obs-mip.fr/) network.
2.3 Simulations of back trajectories, air masses
residence times and potential source regions
In the present study, we calculated 10-day back normal tra-
jectory for high PBM events and 7-day back normal trajec-
tory for high GOM events, respectively using the NOAA
Hysplit trajectory model and gridded meteorological data
(Global Data Assimilation System, GDAS1; Rolph, 2016),
which are close to the upper range of the lifetime of GOM
and PBM in the atmosphere (Schroeder and Munthe, 1998;
Driscoll et al., 2013). The GDAS1 has a horizontal reso-
lution of 1 degree (360× 180 grid cells) with 23 vertical
levels from 1000 hPa to 20 hPa. The trajectories ended at
the PDM Observatory at a height of 3000 m a.s.l. (approxi-
mately 100 m above the sampling site). In addition, we also
used the Flexpart Lagrangian particle dispersion model ver-
sion 9.0 (Stohl et al., 2005) to simulate the 20 days back tra-
jectories for two special events (high PBM event #12 and
#19) and to make a comparison with Hysplit. The Flexpart
model is driven by wind fields provided by the European
Centre for Medium-Range Weather Forecast (ECMWF) with
a temporal resolution of 3 h (analyses at 00:00, 06:00, 12:00,
18:00 UTC; forecasts at 03:00, 09:00, 15:00, 21:00 UTC)
and with horizontal resolution of 32k˙m. The model output
refers to the time, in seconds, the released particles spent in
each output grid box before reaching the PDM Observatory.
Flexpart residence times are output every 3 h on a uniform
grid of 0.5◦ latitude× 0.5◦ longitude in 40 vertical layers
from mean sea level to a height of 20 km above sea level.
In the present study, we analyzed how air masses from dif-
ferent sublayers in the troposphere affect atmospheric PBM
and GOM concentrations at the PDM Observatory. We sub-
divide the troposphere into four sublayers: boundary layer
(> 900 hPa), lower free troposphere (700–900 hPa), middle
free troposphere (500–700 hPa) and upper free troposphere
(200–500 hPa).
Air mass residence times (ARTs) were calculated on the
basis of the simulations of 7-day backward trajectories end-
ing at the PDM Observatory. The studied domain covered
by the trajectories was divided into 3590 grid cells of 2.5◦
latitude× 2.5◦ longitude. To reduce the “central conver-
gence” effect and highlight the long-range transport pro-
cesses (Cuevas et al., 2013), we adjusted the residence times
using the geometric adjustment factor as proposed by Poirot
and Wishinski (1986).
The potential source regions of PBM and GOM were
simulated using a Potential Source Contribution Function
(PSCF) approach (Zeng and Hopke, 1989). The PSCF value
indicates the probability that a source area contributed to the
receptor site and is defined as
PSCFij =Mij
Nij
×Wij . (1)
Mij is the total number of trajectory segment endpoints
(Each trajectory segment endpoint represents the estimated
position of the air mass every 1 h back in time from the
receptor) in a grid cell associated to PBM and GOM con-
centrations at the PDM Observatory higher than the annual
means, Nij is the total number of trajectory segment end-
points in a grid cell, and Wij is a weighting function used to
minimize the uncertainties of a small Nij and described by
Polissar et al. (2001). For the PBM and GOM PSCF analy-
sis, 7-day back trajectories ending at the PDM Observatory
were calculated every 2 h throughout the whole study period.
The total trajectory endpoints in the boundary layer, lower
free troposphere, and middle and upper troposphere in the
studied domain were 152 025, 285 726, and 250 557, respec-
tively. The studied domain was divided into 5566 grid cells
of 2.0◦ latitude× 2.0◦ longitude. Areas with high PSCF val-
ues are likely enriched in atmospheric PBM and GOM and
probably contribute to the elevated PBM and GOM concen-
trations at the PDM Observatory. We caution, due to the tra-
jectory innate spatial uncertainty, meteorological parameters
(e.g. precipitation, humidity), “trailing effect”, etc, that PSCF
analysis could have some uncertainties in identification of
source regions (Engstrom and Magnusson, 2009; Cheng et
al., 2015). In this study, these factors were not evaluated and
therefore the identified source regions of GOM and PBM by
PSCF analysis should be regarded as a qualitative indication.
3 Results and discussion
3.1 Annual, seasonal, and diel trends
Averaged atmospheric GEM, PBM, and GOM concentra-
tions at the PDM Observatory during the study period were
1.86± 0.27 ng m−3, 14± 10 pg m−3, and 27± 34 pg m−3,
respectively (time series of GEM, PBM and GOM concen-
trations are in Fig. S1 in the Supplement). The level of GEM
at the PDM Observatory was slightly higher than the pre-
vious observations at remote sites in Europe (means: 1.66–
1.82 ng m−3; Slemr and Scheel, 1998; Lee et al., 1998; Kock
et al., 2005) and North America (means: 1.32–1.72 ng m−3;
Atmos. Chem. Phys., 16, 5623–5639, 2016 www.atmos-chem-phys.net/16/5623/2016/
X. Fu et al.: Atmospheric mercury speciation dynamics 5627
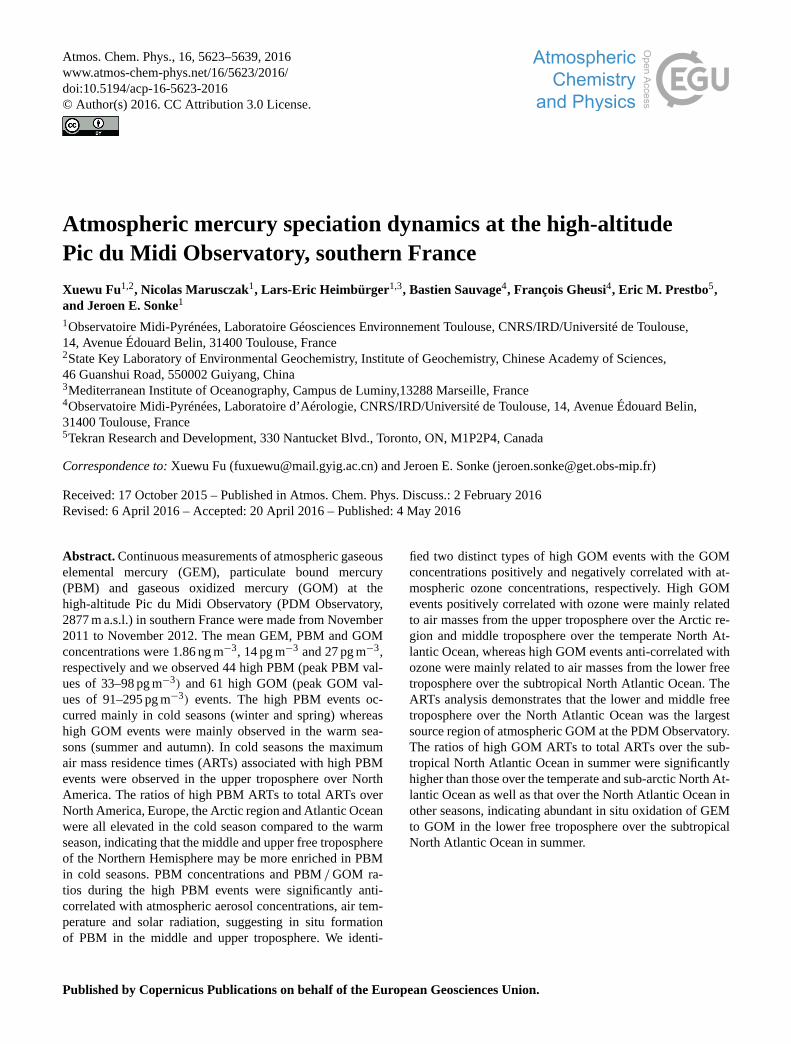
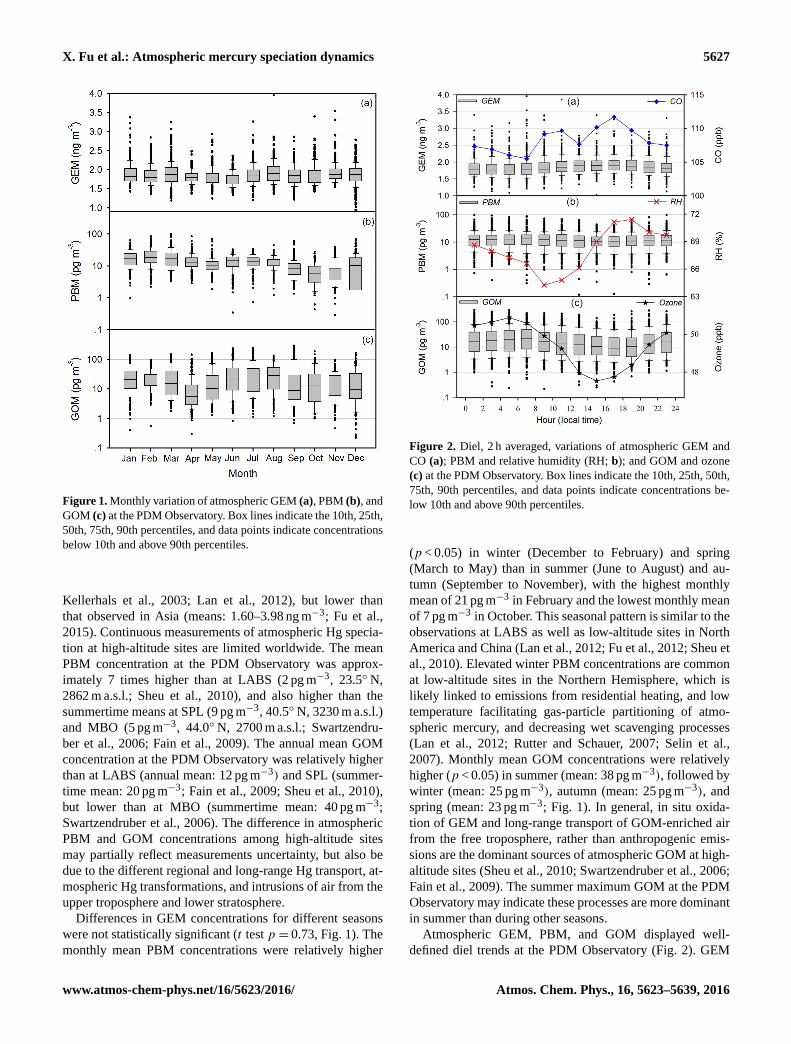
Figure 1. Monthly variation of atmospheric GEM (a), PBM (b), and
GOM (c) at the PDM Observatory. Box lines indicate the 10th, 25th,
50th, 75th, 90th percentiles, and data points indicate concentrations
below 10th and above 90th percentiles.
Kellerhals et al., 2003; Lan et al., 2012), but lower than
that observed in Asia (means: 1.60–3.98 ng m−3; Fu et al.,
2015). Continuous measurements of atmospheric Hg specia-
tion at high-altitude sites are limited worldwide. The mean
PBM concentration at the PDM Observatory was approx-
imately 7 times higher than at LABS (2 pg m−3, 23.5◦ N,
2862 m a.s.l.; Sheu et al., 2010), and also higher than the
summertime means at SPL (9 pg m−3, 40.5◦ N, 3230 m a.s.l.)
and MBO (5 pg m−3, 44.0◦ N, 2700 m a.s.l.; Swartzendru-
ber et al., 2006; Fain et al., 2009). The annual mean GOM
concentration at the PDM Observatory was relatively higher
than at LABS (annual mean: 12 pg m−3) and SPL (summer-
time mean: 20 pg m−3; Fain et al., 2009; Sheu et al., 2010),
but lower than at MBO (summertime mean: 40 pg m−3;
Swartzendruber et al., 2006). The difference in atmospheric
PBM and GOM concentrations among high-altitude sites
may partially reflect measurements uncertainty, but also be
due to the different regional and long-range Hg transport, at-
mospheric Hg transformations, and intrusions of air from the
upper troposphere and lower stratosphere.
Differences in GEM concentrations for different seasons
were not statistically significant (t test p = 0.73, Fig. 1). The
monthly mean PBM concentrations were relatively higher
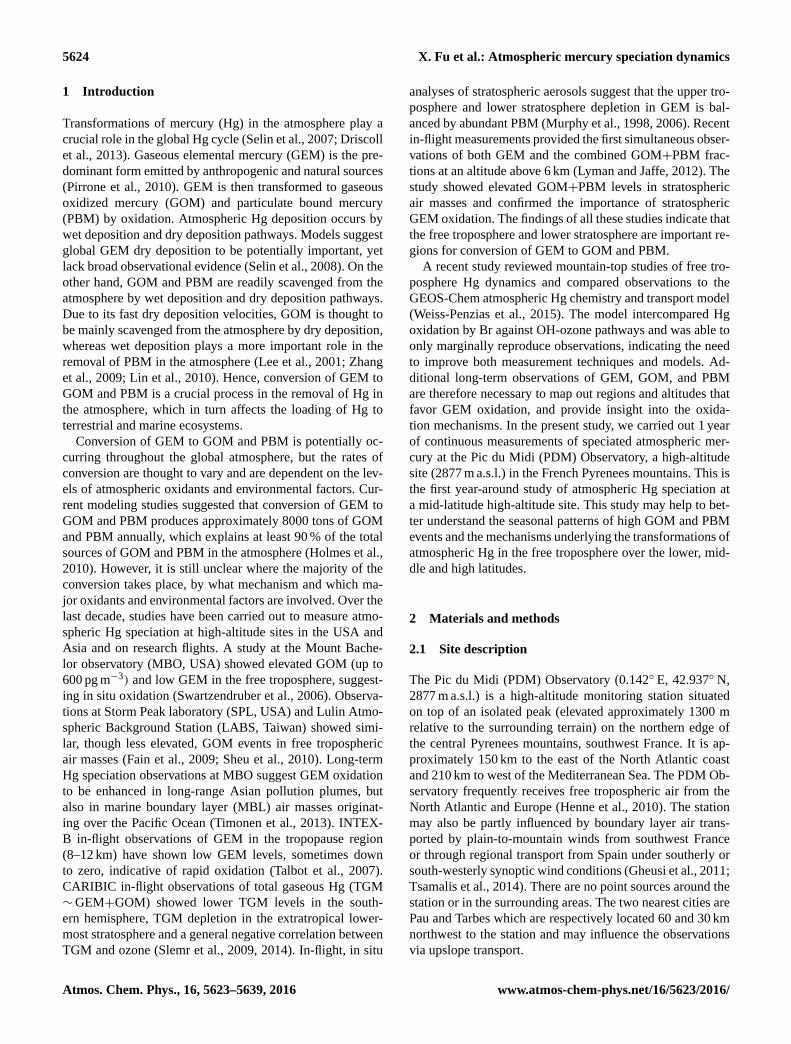
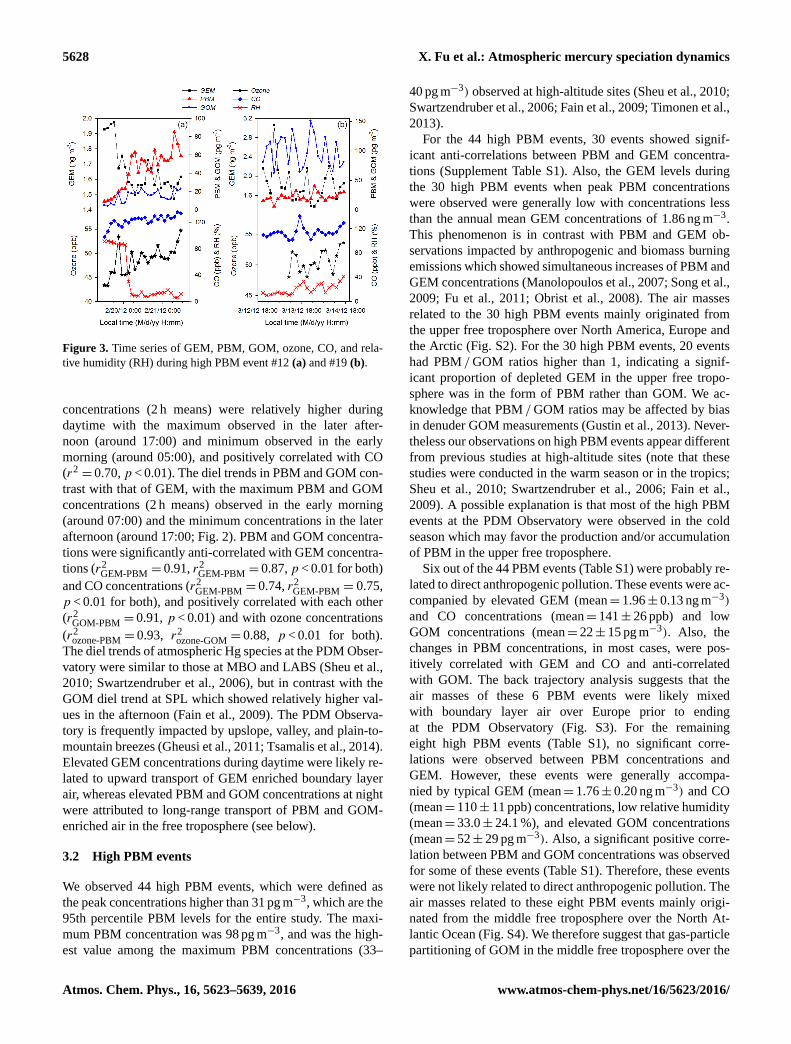
Figure 2. Diel, 2 h averaged, variations of atmospheric GEM and
CO (a); PBM and relative humidity (RH; b); and GOM and ozone
(c) at the PDM Observatory. Box lines indicate the 10th, 25th, 50th,
75th, 90th percentiles, and data points indicate concentrations be-
low 10th and above 90th percentiles.
(p < 0.05) in winter (December to February) and spring
(March to May) than in summer (June to August) and au-
tumn (September to November), with the highest monthly
mean of 21 pg m−3 in February and the lowest monthly mean
of 7 pg m−3 in October. This seasonal pattern is similar to the
observations at LABS as well as low-altitude sites in North
America and China (Lan et al., 2012; Fu et al., 2012; Sheu et
al., 2010). Elevated winter PBM concentrations are common
at low-altitude sites in the Northern Hemisphere, which is
likely linked to emissions from residential heating, and low
temperature facilitating gas-particle partitioning of atmo-
spheric mercury, and decreasing wet scavenging processes
(Lan et al., 2012; Rutter and Schauer, 2007; Selin et al.,
2007). Monthly mean GOM concentrations were relatively
higher (p < 0.05) in summer (mean: 38 pg m−3), followed by
winter (mean: 25 pg m−3), autumn (mean: 25 pg m−3), and
spring (mean: 23 pg m−3; Fig. 1). In general, in situ oxida-
tion of GEM and long-range transport of GOM-enriched air
from the free troposphere, rather than anthropogenic emis-
sions are the dominant sources of atmospheric GOM at high-
altitude sites (Sheu et al., 2010; Swartzendruber et al., 2006;
Fain et al., 2009). The summer maximum GOM at the PDM
Observatory may indicate these processes are more dominant
in summer than during other seasons.
Atmospheric GEM, PBM, and GOM displayed well-
defined diel trends at the PDM Observatory (Fig. 2). GEM
www.atmos-chem-phys.net/16/5623/2016/ Atmos. Chem. Phys., 16, 5623–5639, 2016
5628 X. Fu et al.: Atmospheric mercury speciation dynamics
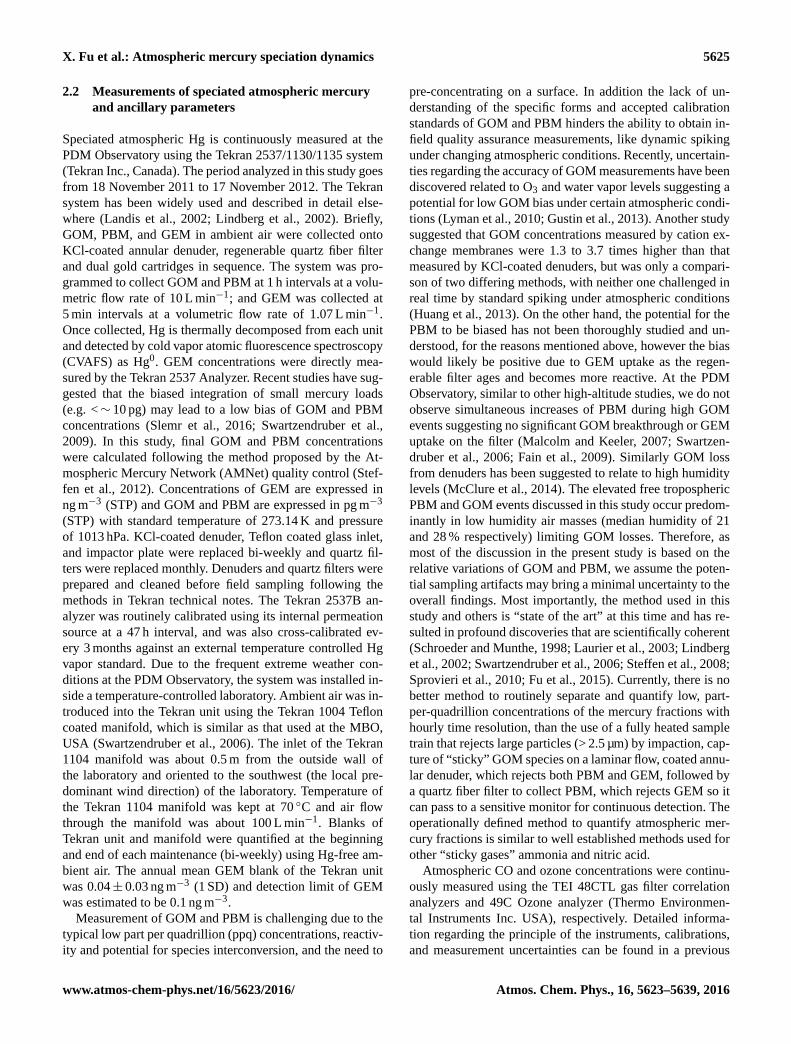
Figure 3. Time series of GEM, PBM, GOM, ozone, CO, and rela-
tive humidity (RH) during high PBM event #12 (a) and #19 (b).
concentrations (2 h means) were relatively higher during
daytime with the maximum observed in the later after-
noon (around 17:00) and minimum observed in the early
morning (around 05:00), and positively correlated with CO
(r2= 0.70, p < 0.01). The diel trends in PBM and GOM con-
trast with that of GEM, with the maximum PBM and GOM
concentrations (2 h means) observed in the early morning
(around 07:00) and the minimum concentrations in the later
afternoon (around 17:00; Fig. 2). PBM and GOM concentra-
tions were significantly anti-correlated with GEM concentra-
tions (r2GEM-PBM = 0.91, r2
GEM-PBM = 0.87, p < 0.01 for both)
and CO concentrations (r2GEM-PBM = 0.74, r2
GEM-PBM = 0.75,
p < 0.01 for both), and positively correlated with each other
(r2GOM-PBM = 0.91, p < 0.01) and with ozone concentrations
(r2ozone-PBM = 0.93, r2
ozone-GOM = 0.88, p < 0.01 for both).
The diel trends of atmospheric Hg species at the PDM Obser-
vatory were similar to those at MBO and LABS (Sheu et al.,
2010; Swartzendruber et al., 2006), but in contrast with the
GOM diel trend at SPL which showed relatively higher val-
ues in the afternoon (Fain et al., 2009). The PDM Observa-
tory is frequently impacted by upslope, valley, and plain-to-
mountain breezes (Gheusi et al., 2011; Tsamalis et al., 2014).
Elevated GEM concentrations during daytime were likely re-
lated to upward transport of GEM enriched boundary layer
air, whereas elevated PBM and GOM concentrations at night
were attributed to long-range transport of PBM and GOM-
enriched air in the free troposphere (see below).
3.2 High PBM events
We observed 44 high PBM events, which were defined as
the peak concentrations higher than 31 pg m−3, which are the
95th percentile PBM levels for the entire study. The maxi-
mum PBM concentration was 98 pg m−3, and was the high-
est value among the maximum PBM concentrations (33–
40 pg m−3) observed at high-altitude sites (Sheu et al., 2010;
Swartzendruber et al., 2006; Fain et al., 2009; Timonen et al.,
2013).
For the 44 high PBM events, 30 events showed signif-
icant anti-correlations between PBM and GEM concentra-
tions (Supplement Table S1). Also, the GEM levels during
the 30 high PBM events when peak PBM concentrations
were observed were generally low with concentrations less
than the annual mean GEM concentrations of 1.86 ng m−3.
This phenomenon is in contrast with PBM and GEM ob-
servations impacted by anthropogenic and biomass burning
emissions which showed simultaneous increases of PBM and
GEM concentrations (Manolopoulos et al., 2007; Song et al.,
2009; Fu et al., 2011; Obrist et al., 2008). The air masses
related to the 30 high PBM events mainly originated from
the upper free troposphere over North America, Europe and
the Arctic (Fig. S2). For the 30 high PBM events, 20 events
had PBM / GOM ratios higher than 1, indicating a signif-
icant proportion of depleted GEM in the upper free tropo-
sphere was in the form of PBM rather than GOM. We ac-
knowledge that PBM / GOM ratios may be affected by bias
in denuder GOM measurements (Gustin et al., 2013). Never-
theless our observations on high PBM events appear different
from previous studies at high-altitude sites (note that these
studies were conducted in the warm season or in the tropics;
Sheu et al., 2010; Swartzendruber et al., 2006; Fain et al.,
2009). A possible explanation is that most of the high PBM
events at the PDM Observatory were observed in the cold
season which may favor the production and/or accumulation
of PBM in the upper free troposphere.
Six out of the 44 PBM events (Table S1) were probably re-
lated to direct anthropogenic pollution. These events were ac-
companied by elevated GEM (mean= 1.96± 0.13 ng m−3)
and CO concentrations (mean= 141± 26 ppb) and low
GOM concentrations (mean= 22± 15 pg m−3). Also, the
changes in PBM concentrations, in most cases, were pos-
itively correlated with GEM and CO and anti-correlated
with GOM. The back trajectory analysis suggests that the
air masses of these 6 PBM events were likely mixed
with boundary layer air over Europe prior to ending
at the PDM Observatory (Fig. S3). For the remaining
eight high PBM events (Table S1), no significant corre-
lations were observed between PBM concentrations and
GEM. However, these events were generally accompa-
nied by typical GEM (mean= 1.76± 0.20 ng m−3) and CO
(mean= 110± 11 ppb) concentrations, low relative humidity
(mean= 33.0± 24.1 %), and elevated GOM concentrations
(mean= 52± 29 pg m−3). Also, a significant positive corre-
lation between PBM and GOM concentrations was observed
for some of these events (Table S1). Therefore, these events
were not likely related to direct anthropogenic pollution. The
air masses related to these eight PBM events mainly origi-
nated from the middle free troposphere over the North At-
lantic Ocean (Fig. S4). We therefore suggest that gas-particle
partitioning of GOM in the middle free troposphere over the
Atmos. Chem. Phys., 16, 5623–5639, 2016 www.atmos-chem-phys.net/16/5623/2016/
X. Fu et al.: Atmospheric mercury speciation dynamics 5629
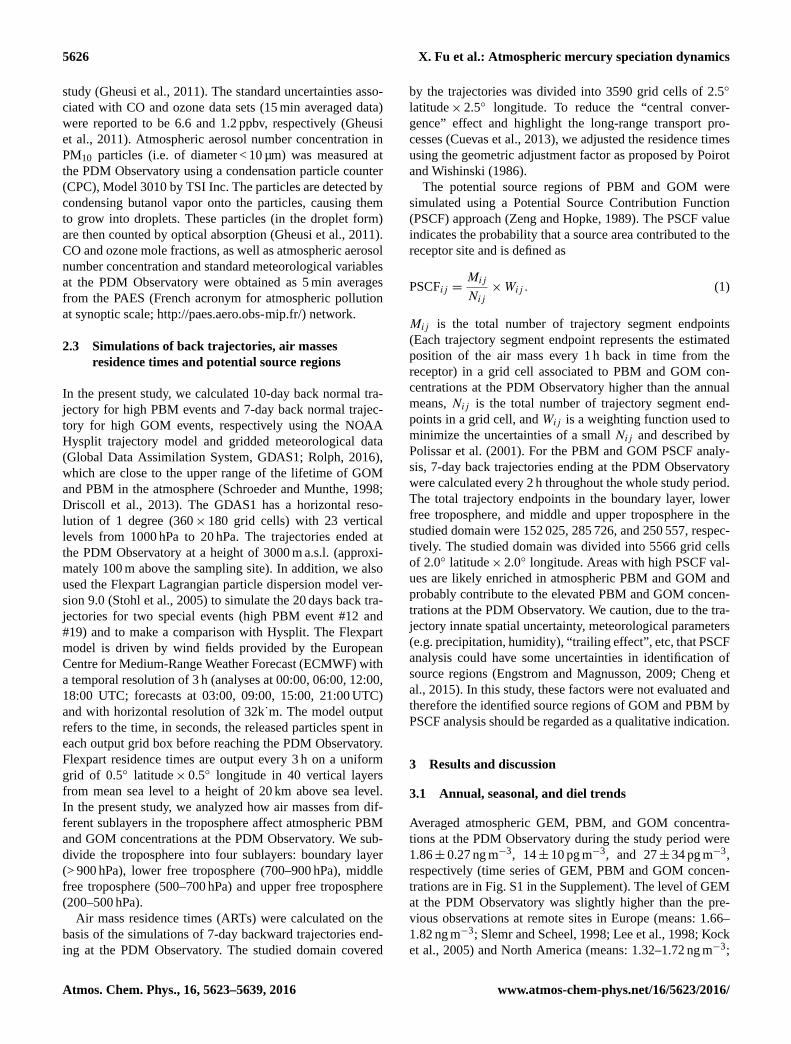
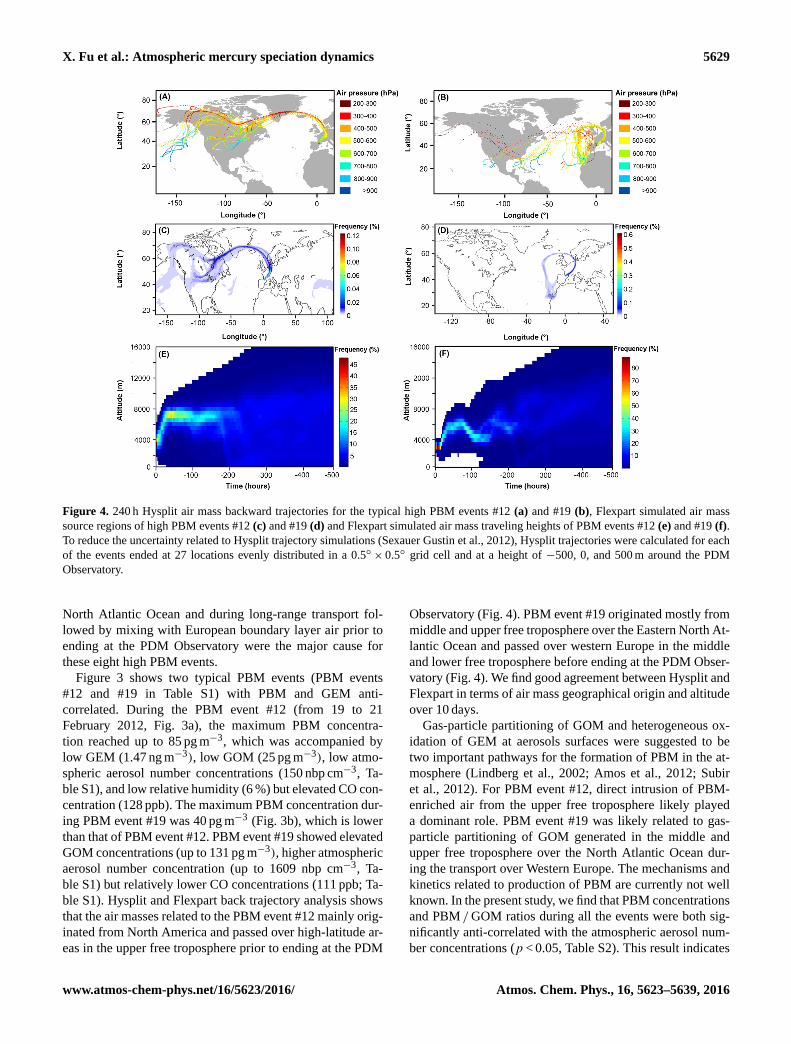
Figure 4. 240 h Hysplit air mass backward trajectories for the typical high PBM events #12 (a) and #19 (b), Flexpart simulated air mass
source regions of high PBM events #12 (c) and #19 (d) and Flexpart simulated air mass traveling heights of PBM events #12 (e) and #19 (f).
To reduce the uncertainty related to Hysplit trajectory simulations (Sexauer Gustin et al., 2012), Hysplit trajectories were calculated for each
of the events ended at 27 locations evenly distributed in a 0.5◦× 0.5◦ grid cell and at a height of −500, 0, and 500 m around the PDM
Observatory.
North Atlantic Ocean and during long-range transport fol-
lowed by mixing with European boundary layer air prior to
ending at the PDM Observatory were the major cause for
these eight high PBM events.
Figure 3 shows two typical PBM events (PBM events
#12 and #19 in Table S1) with PBM and GEM anti-
correlated. During the PBM event #12 (from 19 to 21
February 2012, Fig. 3a), the maximum PBM concentra-
tion reached up to 85 pg m−3, which was accompanied by
low GEM (1.47 ng m−3), low GOM (25 pg m−3), low atmo-
spheric aerosol number concentrations (150 nbp cm−3, Ta-
ble S1), and low relative humidity (6 %) but elevated CO con-
centration (128 ppb). The maximum PBM concentration dur-
ing PBM event #19 was 40 pg m−3 (Fig. 3b), which is lower
than that of PBM event #12. PBM event #19 showed elevated
GOM concentrations (up to 131 pg m−3), higher atmospheric
aerosol number concentration (up to 1609 nbp cm−3, Ta-
ble S1) but relatively lower CO concentrations (111 ppb; Ta-
ble S1). Hysplit and Flexpart back trajectory analysis shows
that the air masses related to the PBM event #12 mainly orig-
inated from North America and passed over high-latitude ar-
eas in the upper free troposphere prior to ending at the PDM
Observatory (Fig. 4). PBM event #19 originated mostly from
middle and upper free troposphere over the Eastern North At-
lantic Ocean and passed over western Europe in the middle
and lower free troposphere before ending at the PDM Obser-
vatory (Fig. 4). We find good agreement between Hysplit and
Flexpart in terms of air mass geographical origin and altitude
over 10 days.
Gas-particle partitioning of GOM and heterogeneous ox-
idation of GEM at aerosols surfaces were suggested to be
two important pathways for the formation of PBM in the at-
mosphere (Lindberg et al., 2002; Amos et al., 2012; Subir
et al., 2012). For PBM event #12, direct intrusion of PBM-
enriched air from the upper free troposphere likely played
a dominant role. PBM event #19 was likely related to gas-
particle partitioning of GOM generated in the middle and
upper free troposphere over the North Atlantic Ocean dur-
ing the transport over Western Europe. The mechanisms and
kinetics related to production of PBM are currently not well
known. In the present study, we find that PBM concentrations
and PBM / GOM ratios during all the events were both sig-
nificantly anti-correlated with the atmospheric aerosol num-
ber concentrations (p < 0.05, Table S2). This result indicates
www.atmos-chem-phys.net/16/5623/2016/ Atmos. Chem. Phys., 16, 5623–5639, 2016
5630 X. Fu et al.: Atmospheric mercury speciation dynamics
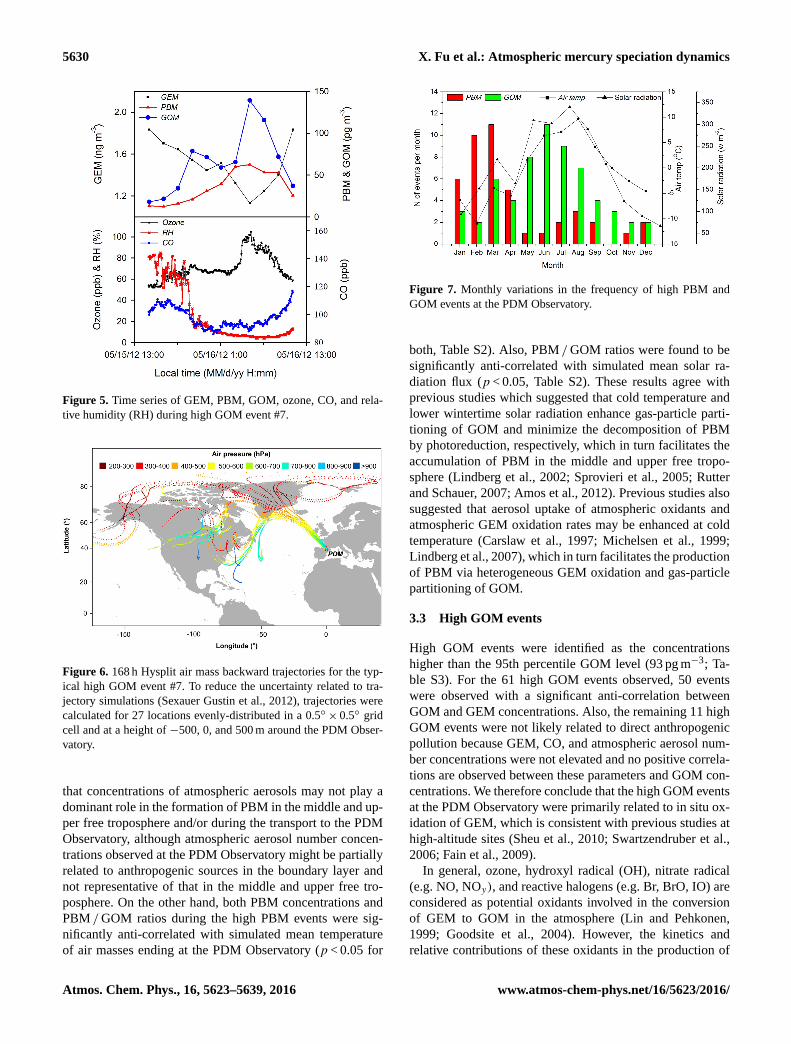
Figure 5. Time series of GEM, PBM, GOM, ozone, CO, and rela-
tive humidity (RH) during high GOM event #7.
Figure 6. 168 h Hysplit air mass backward trajectories for the typ-
ical high GOM event #7. To reduce the uncertainty related to tra-
jectory simulations (Sexauer Gustin et al., 2012), trajectories were
calculated for 27 locations evenly-distributed in a 0.5◦× 0.5◦ grid
cell and at a height of −500, 0, and 500 m around the PDM Obser-
vatory.
that concentrations of atmospheric aerosols may not play a
dominant role in the formation of PBM in the middle and up-
per free troposphere and/or during the transport to the PDM
Observatory, although atmospheric aerosol number concen-
trations observed at the PDM Observatory might be partially
related to anthropogenic sources in the boundary layer and
not representative of that in the middle and upper free tro-
posphere. On the other hand, both PBM concentrations and
PBM / GOM ratios during the high PBM events were sig-
nificantly anti-correlated with simulated mean temperature
of air masses ending at the PDM Observatory (p < 0.05 for
Figure 7. Monthly variations in the frequency of high PBM and
GOM events at the PDM Observatory.
both, Table S2). Also, PBM / GOM ratios were found to be
significantly anti-correlated with simulated mean solar ra-
diation flux (p < 0.05, Table S2). These results agree with
previous studies which suggested that cold temperature and
lower wintertime solar radiation enhance gas-particle parti-
tioning of GOM and minimize the decomposition of PBM
by photoreduction, respectively, which in turn facilitates the
accumulation of PBM in the middle and upper free tropo-
sphere (Lindberg et al., 2002; Sprovieri et al., 2005; Rutter
and Schauer, 2007; Amos et al., 2012). Previous studies also
suggested that aerosol uptake of atmospheric oxidants and
atmospheric GEM oxidation rates may be enhanced at cold
temperature (Carslaw et al., 1997; Michelsen et al., 1999;
Lindberg et al., 2007), which in turn facilitates the production
of PBM via heterogeneous GEM oxidation and gas-particle
partitioning of GOM.
3.3 High GOM events
High GOM events were identified as the concentrations
higher than the 95th percentile GOM level (93 pg m−3; Ta-
ble S3). For the 61 high GOM events observed, 50 events
were observed with a significant anti-correlation between
GOM and GEM concentrations. Also, the remaining 11 high
GOM events were not likely related to direct anthropogenic
pollution because GEM, CO, and atmospheric aerosol num-
ber concentrations were not elevated and no positive correla-
tions are observed between these parameters and GOM con-
centrations. We therefore conclude that the high GOM events
at the PDM Observatory were primarily related to in situ ox-
idation of GEM, which is consistent with previous studies at
high-altitude sites (Sheu et al., 2010; Swartzendruber et al.,
2006; Fain et al., 2009).
In general, ozone, hydroxyl radical (OH), nitrate radical
(e.g. NO, NOy), and reactive halogens (e.g. Br, BrO, IO) are
considered as potential oxidants involved in the conversion
of GEM to GOM in the atmosphere (Lin and Pehkonen,
1999; Goodsite et al., 2004). However, the kinetics and
relative contributions of these oxidants in the production of
Atmos. Chem. Phys., 16, 5623–5639, 2016 www.atmos-chem-phys.net/16/5623/2016/
X. Fu et al.: Atmospheric mercury speciation dynamics 5631
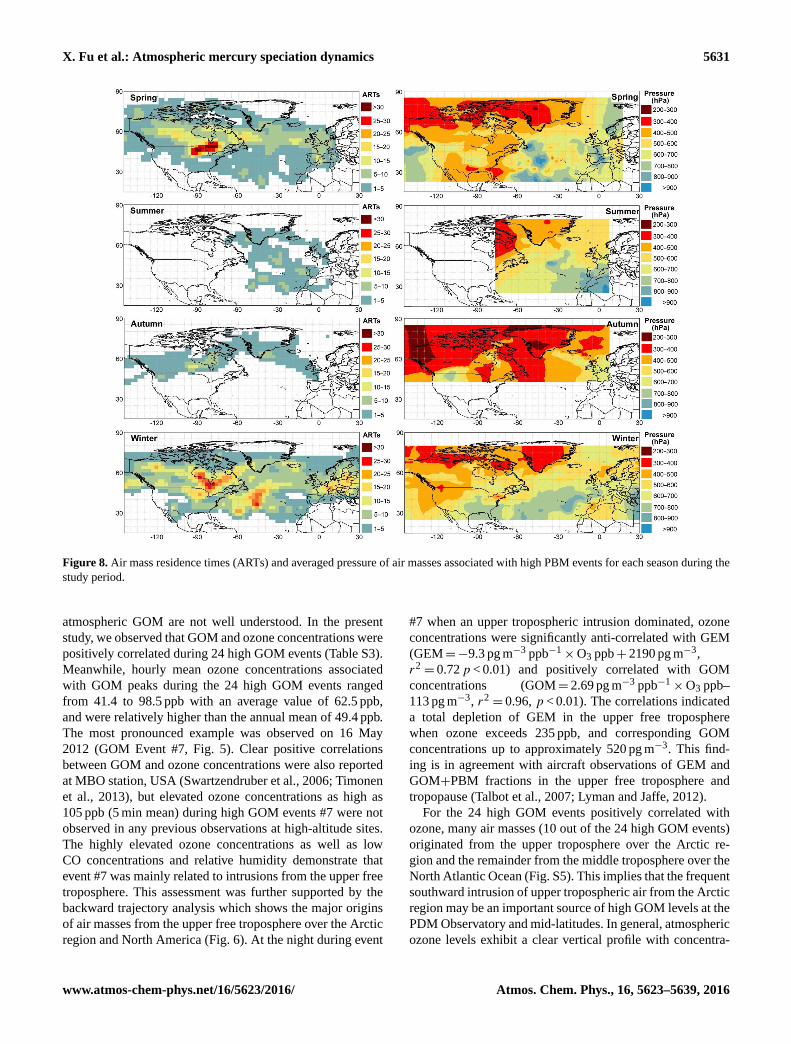
Figure 8. Air mass residence times (ARTs) and averaged pressure of air masses associated with high PBM events for each season during the
study period.
atmospheric GOM are not well understood. In the present
study, we observed that GOM and ozone concentrations were
positively correlated during 24 high GOM events (Table S3).
Meanwhile, hourly mean ozone concentrations associated
with GOM peaks during the 24 high GOM events ranged
from 41.4 to 98.5 ppb with an average value of 62.5 ppb,
and were relatively higher than the annual mean of 49.4 ppb.
The most pronounced example was observed on 16 May
2012 (GOM Event #7, Fig. 5). Clear positive correlations
between GOM and ozone concentrations were also reported
at MBO station, USA (Swartzendruber et al., 2006; Timonen
et al., 2013), but elevated ozone concentrations as high as
105 ppb (5 min mean) during high GOM events #7 were not
observed in any previous observations at high-altitude sites.
The highly elevated ozone concentrations as well as low
CO concentrations and relative humidity demonstrate that
event #7 was mainly related to intrusions from the upper free
troposphere. This assessment was further supported by the
backward trajectory analysis which shows the major origins
of air masses from the upper free troposphere over the Arctic
region and North America (Fig. 6). At the night during event
#7 when an upper tropospheric intrusion dominated, ozone
concentrations were significantly anti-correlated with GEM
(GEM=−9.3 pg m−3 ppb−1×O3 ppb+ 2190 pg m−3,
r2= 0.72 p < 0.01) and positively correlated with GOM
concentrations (GOM= 2.69 pg m−3 ppb−1×O3 ppb–
113 pg m−3, r2= 0.96, p < 0.01). The correlations indicated
a total depletion of GEM in the upper free troposphere
when ozone exceeds 235 ppb, and corresponding GOM
concentrations up to approximately 520 pg m−3. This find-
ing is in agreement with aircraft observations of GEM and
GOM+PBM fractions in the upper free troposphere and
tropopause (Talbot et al., 2007; Lyman and Jaffe, 2012).
For the 24 high GOM events positively correlated with
ozone, many air masses (10 out of the 24 high GOM events)
originated from the upper troposphere over the Arctic re-
gion and the remainder from the middle troposphere over the
North Atlantic Ocean (Fig. S5). This implies that the frequent
southward intrusion of upper tropospheric air from the Arctic
region may be an important source of high GOM levels at the
PDM Observatory and mid-latitudes. In general, atmospheric
ozone levels exhibit a clear vertical profile with concentra-
www.atmos-chem-phys.net/16/5623/2016/ Atmos. Chem. Phys., 16, 5623–5639, 2016
5632 X. Fu et al.: Atmospheric mercury speciation dynamics
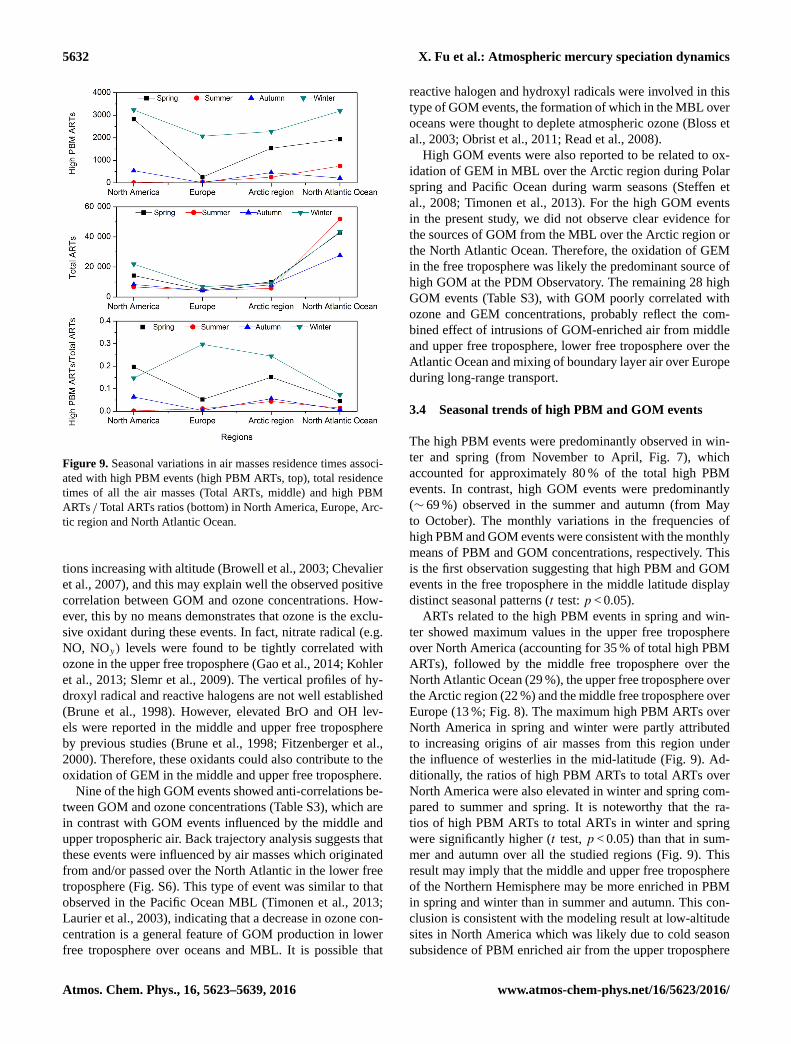
Figure 9. Seasonal variations in air masses residence times associ-
ated with high PBM events (high PBM ARTs, top), total residence
times of all the air masses (Total ARTs, middle) and high PBM
ARTs / Total ARTs ratios (bottom) in North America, Europe, Arc-
tic region and North Atlantic Ocean.
tions increasing with altitude (Browell et al., 2003; Chevalier
et al., 2007), and this may explain well the observed positive
correlation between GOM and ozone concentrations. How-
ever, this by no means demonstrates that ozone is the exclu-
sive oxidant during these events. In fact, nitrate radical (e.g.
NO, NOy) levels were found to be tightly correlated with
ozone in the upper free troposphere (Gao et al., 2014; Kohler
et al., 2013; Slemr et al., 2009). The vertical profiles of hy-
droxyl radical and reactive halogens are not well established
(Brune et al., 1998). However, elevated BrO and OH lev-
els were reported in the middle and upper free troposphere
by previous studies (Brune et al., 1998; Fitzenberger et al.,
2000). Therefore, these oxidants could also contribute to the
oxidation of GEM in the middle and upper free troposphere.
Nine of the high GOM events showed anti-correlations be-
tween GOM and ozone concentrations (Table S3), which are
in contrast with GOM events influenced by the middle and
upper tropospheric air. Back trajectory analysis suggests that
these events were influenced by air masses which originated
from and/or passed over the North Atlantic in the lower free
troposphere (Fig. S6). This type of event was similar to that
observed in the Pacific Ocean MBL (Timonen et al., 2013;
Laurier et al., 2003), indicating that a decrease in ozone con-
centration is a general feature of GOM production in lower
free troposphere over oceans and MBL. It is possible that
reactive halogen and hydroxyl radicals were involved in this
type of GOM events, the formation of which in the MBL over
oceans were thought to deplete atmospheric ozone (Bloss et
al., 2003; Obrist et al., 2011; Read et al., 2008).
High GOM events were also reported to be related to ox-
idation of GEM in MBL over the Arctic region during Polar
spring and Pacific Ocean during warm seasons (Steffen et
al., 2008; Timonen et al., 2013). For the high GOM events
in the present study, we did not observe clear evidence for
the sources of GOM from the MBL over the Arctic region or
the North Atlantic Ocean. Therefore, the oxidation of GEM
in the free troposphere was likely the predominant source of
high GOM at the PDM Observatory. The remaining 28 high
GOM events (Table S3), with GOM poorly correlated with
ozone and GEM concentrations, probably reflect the com-
bined effect of intrusions of GOM-enriched air from middle
and upper free troposphere, lower free troposphere over the
Atlantic Ocean and mixing of boundary layer air over Europe
during long-range transport.
3.4 Seasonal trends of high PBM and GOM events
The high PBM events were predominantly observed in win-
ter and spring (from November to April, Fig. 7), which
accounted for approximately 80 % of the total high PBM
events. In contrast, high GOM events were predominantly
(∼ 69 %) observed in the summer and autumn (from May
to October). The monthly variations in the frequencies of
high PBM and GOM events were consistent with the monthly
means of PBM and GOM concentrations, respectively. This
is the first observation suggesting that high PBM and GOM
events in the free troposphere in the middle latitude display
distinct seasonal patterns (t test: p < 0.05).
ARTs related to the high PBM events in spring and win-
ter showed maximum values in the upper free troposphere
over North America (accounting for 35 % of total high PBM
ARTs), followed by the middle free troposphere over the
North Atlantic Ocean (29 %), the upper free troposphere over
the Arctic region (22 %) and the middle free troposphere over
Europe (13 %; Fig. 8). The maximum high PBM ARTs over
North America in spring and winter were partly attributed
to increasing origins of air masses from this region under
the influence of westerlies in the mid-latitude (Fig. 9). Ad-
ditionally, the ratios of high PBM ARTs to total ARTs over
North America were also elevated in winter and spring com-
pared to summer and spring. It is noteworthy that the ra-
tios of high PBM ARTs to total ARTs in winter and spring
were significantly higher (t test, p < 0.05) than that in sum-
mer and autumn over all the studied regions (Fig. 9). This
result may imply that the middle and upper free troposphere
of the Northern Hemisphere may be more enriched in PBM
in spring and winter than in summer and autumn. This con-
clusion is consistent with the modeling result at low-altitude
sites in North America which was likely due to cold season
subsidence of PBM enriched air from the upper troposphere
Atmos. Chem. Phys., 16, 5623–5639, 2016 www.atmos-chem-phys.net/16/5623/2016/
X. Fu et al.: Atmospheric mercury speciation dynamics 5633
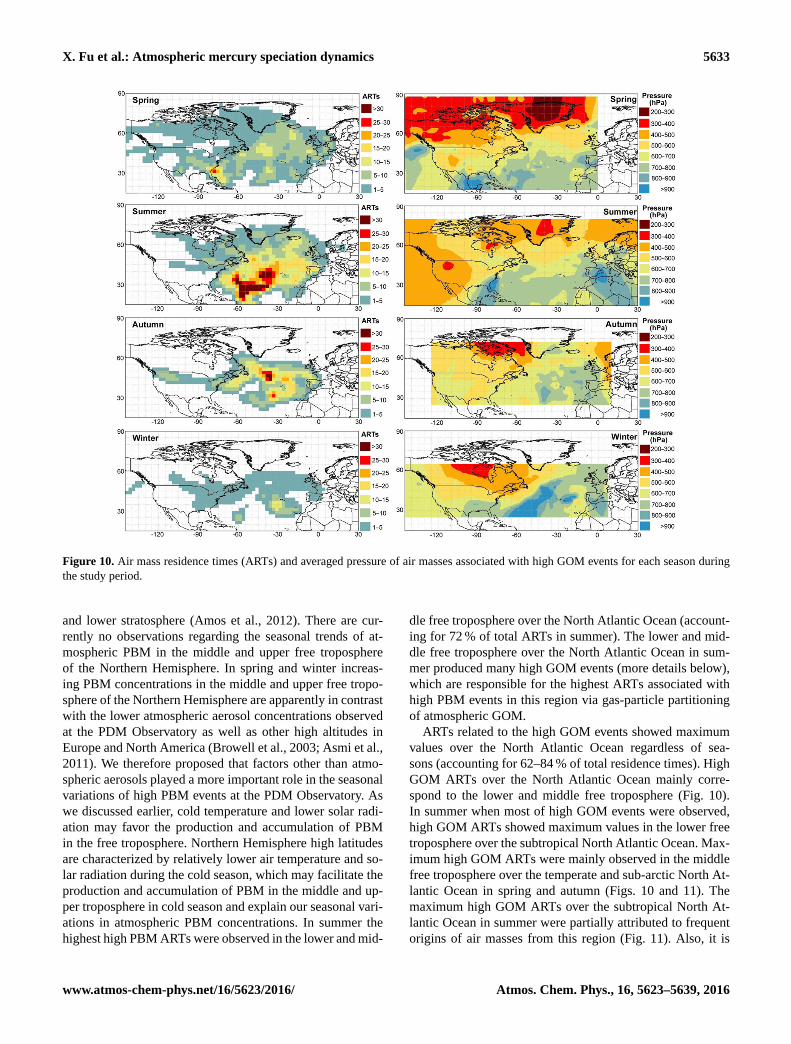
Figure 10. Air mass residence times (ARTs) and averaged pressure of air masses associated with high GOM events for each season during
the study period.
and lower stratosphere (Amos et al., 2012). There are cur-
rently no observations regarding the seasonal trends of at-
mospheric PBM in the middle and upper free troposphere
of the Northern Hemisphere. In spring and winter increas-
ing PBM concentrations in the middle and upper free tropo-
sphere of the Northern Hemisphere are apparently in contrast
with the lower atmospheric aerosol concentrations observed
at the PDM Observatory as well as other high altitudes in
Europe and North America (Browell et al., 2003; Asmi et al.,
2011). We therefore proposed that factors other than atmo-
spheric aerosols played a more important role in the seasonal
variations of high PBM events at the PDM Observatory. As
we discussed earlier, cold temperature and lower solar radi-
ation may favor the production and accumulation of PBM
in the free troposphere. Northern Hemisphere high latitudes
are characterized by relatively lower air temperature and so-
lar radiation during the cold season, which may facilitate the
production and accumulation of PBM in the middle and up-
per troposphere in cold season and explain our seasonal vari-
ations in atmospheric PBM concentrations. In summer the
highest high PBM ARTs were observed in the lower and mid-
dle free troposphere over the North Atlantic Ocean (account-
ing for 72 % of total ARTs in summer). The lower and mid-
dle free troposphere over the North Atlantic Ocean in sum-
mer produced many high GOM events (more details below),
which are responsible for the highest ARTs associated with
high PBM events in this region via gas-particle partitioning
of atmospheric GOM.
ARTs related to the high GOM events showed maximum
values over the North Atlantic Ocean regardless of sea-
sons (accounting for 62–84 % of total residence times). High
GOM ARTs over the North Atlantic Ocean mainly corre-
spond to the lower and middle free troposphere (Fig. 10).
In summer when most of high GOM events were observed,
high GOM ARTs showed maximum values in the lower free
troposphere over the subtropical North Atlantic Ocean. Max-
imum high GOM ARTs were mainly observed in the middle
free troposphere over the temperate and sub-arctic North At-
lantic Ocean in spring and autumn (Figs. 10 and 11). The
maximum high GOM ARTs over the subtropical North At-
lantic Ocean in summer were partially attributed to frequent
origins of air masses from this region (Fig. 11). Also, it is
www.atmos-chem-phys.net/16/5623/2016/ Atmos. Chem. Phys., 16, 5623–5639, 2016
5634 X. Fu et al.: Atmospheric mercury speciation dynamics
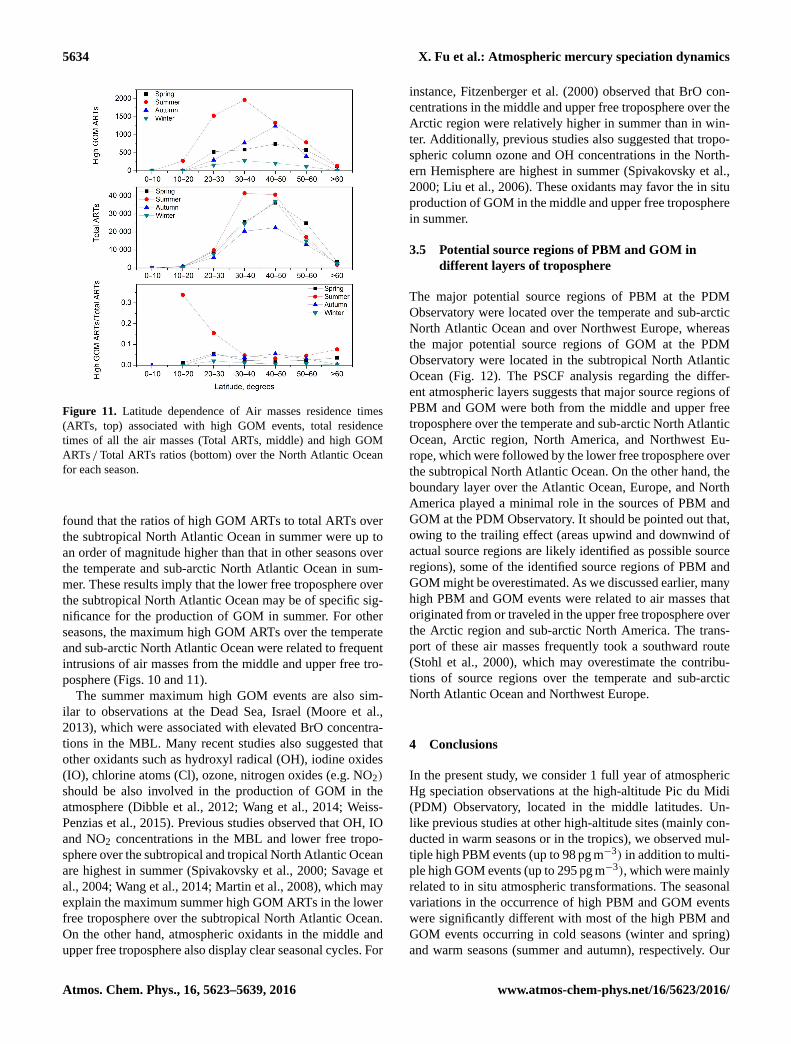
Figure 11. Latitude dependence of Air masses residence times
(ARTs, top) associated with high GOM events, total residence
times of all the air masses (Total ARTs, middle) and high GOM
ARTs / Total ARTs ratios (bottom) over the North Atlantic Ocean
for each season.
found that the ratios of high GOM ARTs to total ARTs over
the subtropical North Atlantic Ocean in summer were up to
an order of magnitude higher than that in other seasons over
the temperate and sub-arctic North Atlantic Ocean in sum-
mer. These results imply that the lower free troposphere over
the subtropical North Atlantic Ocean may be of specific sig-
nificance for the production of GOM in summer. For other
seasons, the maximum high GOM ARTs over the temperate
and sub-arctic North Atlantic Ocean were related to frequent
intrusions of air masses from the middle and upper free tro-
posphere (Figs. 10 and 11).
The summer maximum high GOM events are also sim-
ilar to observations at the Dead Sea, Israel (Moore et al.,
2013), which were associated with elevated BrO concentra-
tions in the MBL. Many recent studies also suggested that
other oxidants such as hydroxyl radical (OH), iodine oxides
(IO), chlorine atoms (Cl), ozone, nitrogen oxides (e.g. NO2)
should be also involved in the production of GOM in the
atmosphere (Dibble et al., 2012; Wang et al., 2014; Weiss-
Penzias et al., 2015). Previous studies observed that OH, IO
and NO2 concentrations in the MBL and lower free tropo-
sphere over the subtropical and tropical North Atlantic Ocean
are highest in summer (Spivakovsky et al., 2000; Savage et
al., 2004; Wang et al., 2014; Martin et al., 2008), which may
explain the maximum summer high GOM ARTs in the lower
free troposphere over the subtropical North Atlantic Ocean.
On the other hand, atmospheric oxidants in the middle and
upper free troposphere also display clear seasonal cycles. For
instance, Fitzenberger et al. (2000) observed that BrO con-
centrations in the middle and upper free troposphere over the
Arctic region were relatively higher in summer than in win-
ter. Additionally, previous studies also suggested that tropo-
spheric column ozone and OH concentrations in the North-
ern Hemisphere are highest in summer (Spivakovsky et al.,
2000; Liu et al., 2006). These oxidants may favor the in situ
production of GOM in the middle and upper free troposphere
in summer.
3.5 Potential source regions of PBM and GOM in
different layers of troposphere
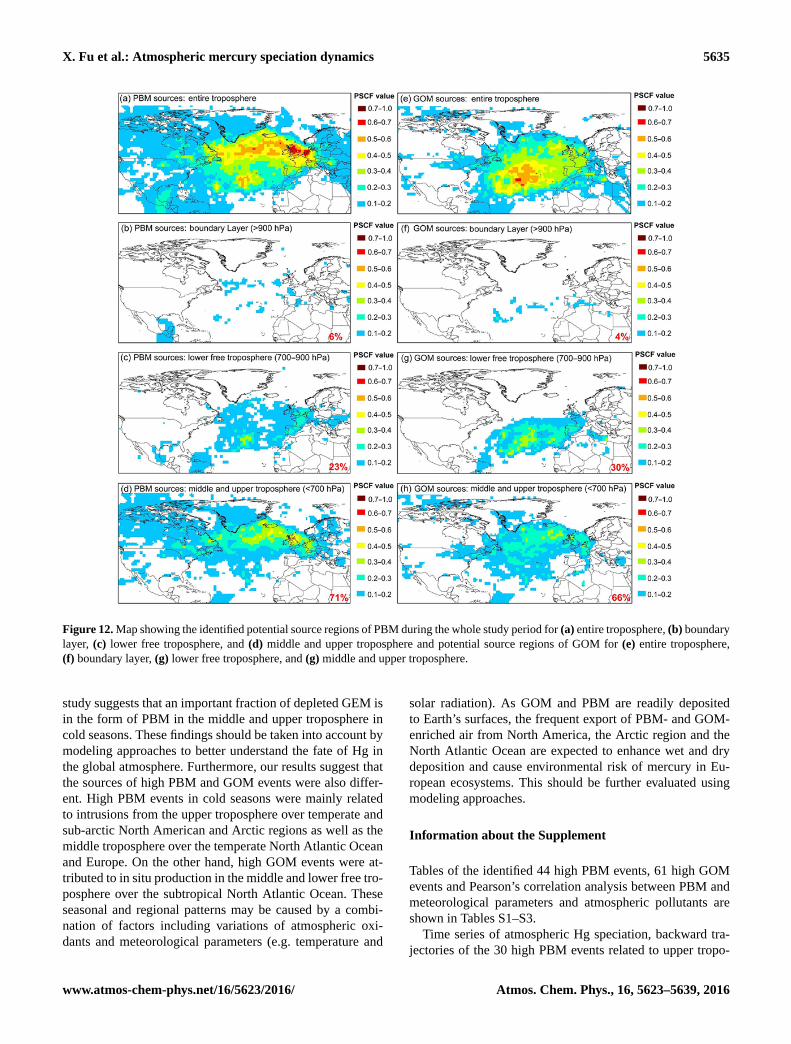
The major potential source regions of PBM at the PDM
Observatory were located over the temperate and sub-arctic
North Atlantic Ocean and over Northwest Europe, whereas
the major potential source regions of GOM at the PDM
Observatory were located in the subtropical North Atlantic
Ocean (Fig. 12). The PSCF analysis regarding the differ-
ent atmospheric layers suggests that major source regions of
PBM and GOM were both from the middle and upper free
troposphere over the temperate and sub-arctic North Atlantic
Ocean, Arctic region, North America, and Northwest Eu-
rope, which were followed by the lower free troposphere over
the subtropical North Atlantic Ocean. On the other hand, the
boundary layer over the Atlantic Ocean, Europe, and North
America played a minimal role in the sources of PBM and
GOM at the PDM Observatory. It should be pointed out that,
owing to the trailing effect (areas upwind and downwind of
actual source regions are likely identified as possible source
regions), some of the identified source regions of PBM and
GOM might be overestimated. As we discussed earlier, many
high PBM and GOM events were related to air masses that
originated from or traveled in the upper free troposphere over
the Arctic region and sub-arctic North America. The trans-
port of these air masses frequently took a southward route
(Stohl et al., 2000), which may overestimate the contribu-
tions of source regions over the temperate and sub-arctic
North Atlantic Ocean and Northwest Europe.
4 Conclusions
In the present study, we consider 1 full year of atmospheric
Hg speciation observations at the high-altitude Pic du Midi
(PDM) Observatory, located in the middle latitudes. Un-
like previous studies at other high-altitude sites (mainly con-
ducted in warm seasons or in the tropics), we observed mul-
tiple high PBM events (up to 98 pg m−3) in addition to multi-
ple high GOM events (up to 295 pg m−3), which were mainly
related to in situ atmospheric transformations. The seasonal
variations in the occurrence of high PBM and GOM events
were significantly different with most of the high PBM and
GOM events occurring in cold seasons (winter and spring)
and warm seasons (summer and autumn), respectively. Our
Atmos. Chem. Phys., 16, 5623–5639, 2016 www.atmos-chem-phys.net/16/5623/2016/
X. Fu et al.: Atmospheric mercury speciation dynamics 5635
Figure 12. Map showing the identified potential source regions of PBM during the whole study period for (a) entire troposphere, (b) boundary
layer, (c) lower free troposphere, and (d) middle and upper troposphere and potential source regions of GOM for (e) entire troposphere,
(f) boundary layer, (g) lower free troposphere, and (g) middle and upper troposphere.
study suggests that an important fraction of depleted GEM is
in the form of PBM in the middle and upper troposphere in
cold seasons. These findings should be taken into account by
modeling approaches to better understand the fate of Hg in
the global atmosphere. Furthermore, our results suggest that
the sources of high PBM and GOM events were also differ-
ent. High PBM events in cold seasons were mainly related
to intrusions from the upper troposphere over temperate and
sub-arctic North American and Arctic regions as well as the
middle troposphere over the temperate North Atlantic Ocean
and Europe. On the other hand, high GOM events were at-
tributed to in situ production in the middle and lower free tro-
posphere over the subtropical North Atlantic Ocean. These
seasonal and regional patterns may be caused by a combi-
nation of factors including variations of atmospheric oxi-
dants and meteorological parameters (e.g. temperature and
solar radiation). As GOM and PBM are readily deposited
to Earth’s surfaces, the frequent export of PBM- and GOM-
enriched air from North America, the Arctic region and the
North Atlantic Ocean are expected to enhance wet and dry
deposition and cause environmental risk of mercury in Eu-
ropean ecosystems. This should be further evaluated using
modeling approaches.
Information about the Supplement
Tables of the identified 44 high PBM events, 61 high GOM
events and Pearson’s correlation analysis between PBM and
meteorological parameters and atmospheric pollutants are
shown in Tables S1–S3.
Time series of atmospheric Hg speciation, backward tra-
jectories of the 30 high PBM events related to upper tropo-
www.atmos-chem-phys.net/16/5623/2016/ Atmos. Chem. Phys., 16, 5623–5639, 2016
5636 X. Fu et al.: Atmospheric mercury speciation dynamics
spheric intrusions, backward trajectories of the six anthro-
pogenic impacted high PBM events, backward trajectories
of the eight mixed high PBM events, backward trajectories
of the 24 high GOM events related to intrusions from mid-
dle and upper troposphere, backward trajectories of the nine
high GOM events related to marine free tropospheric air are
shown in Figs. S1–S6.
The Supplement related to this article is available online
at doi:10.5194/acp-16-5623-2016-supplement.
Acknowledgements. This work was supported by research grant
ERC-2010-StG_20091028 from the European Research Coun-
cil and the National Science Foundation of China (41473025,
41273145). We acknowledge technical support from the UMS
831 Pic du Midi observatory team. Beyond mercury speciation,
other observational data were provided by the PAES atmospheric
monitoring service supported by CNRS-INSU.
Edited by: A. Dastoor
References
Amos, H. M., Jacob, D. J., Holmes, C. D., Fisher, J. A., Wang,
Q., Yantosca, R. M., Corbitt, E. S., Galarneau, E., Rutter, A. P.,
Gustin, M. S., Steffen, A., Schauer, J. J., Graydon, J. A., Louis,
V. L. St., Talbot, R. W., Edgerton, E. S., Zhang, Y., and Sunder-
land, E. M.: Gas-particle partitioning of atmospheric Hg(II) and
its effect on global mercury deposition, Atmos. Chem. Phys., 12,
591–603, doi:10.5194/acp-12-591-2012, 2012.
Asmi, A., Wiedensohler, A., Laj, P., Fjaeraa, A.-M., Sellegri, K.,
Birmili, W., Weingartner, E., Baltensperger, U., Zdimal, V.,
Zikova, N., Putaud, J.-P., Marinoni, A., Tunved, P., Hansson, H.-
C., Fiebig, M., Kivekäs, N., Lihavainen, H., Asmi, E., Ulevicius,
V., Aalto, P. P., Swietlicki, E., Kristensson, A., Mihalopoulos,
N., Kalivitis, N., Kalapov, I., Kiss, G., de Leeuw, G., Henzing,
B., Harrison, R. M., Beddows, D., O’Dowd, C., Jennings, S.
G., Flentje, H., Weinhold, K., Meinhardt, F., Ries, L., and Kul-
mala, M.: Number size distributions and seasonality of submi-
cron particles in Europe 2008–2009, Atmos. Chem. Phys., 11,
5505–5538, doi:10.5194/acp-11-5505-2011, 2011.
Bloss, W. J., Gravestock, T. J., Heard, D. E., Ingham, T., Johnson,
G. P., and Lee, J. D.: Application of a compact all solid-state laser
system to the in situ detection of atmospheric OH, HO2, NO and
IO by laser-induced fluorescence, J. Environ. Monitor., 5, 21–28,
doi:10.1039/B208714f, 2003.
Browell, E. V., Hair, J. W., Butler, C. F., Grant, W. B., DeYoung, R.
J., Fenn, M. A., Brackett, V. G., Clayton, M. B., Brasseur, L. A.,
Harper, D. B., Ridley, B. A., Klonecki, A. A., Hess, P. G., Em-
mons, L. K., Tie, X. X., Atlas, E. L., Cantrell, C. A., Wimmers,
A. J., Blake, D. R., Coffey, M. T., Hannigan, J. W., Dibb, J. E.,
Talbot, R. W., Flocke, F., Weinheimer, A. J., Fried, A., Wert, B.,
Snow, J. A., and Lefer, B. L.: Ozone, aerosol, potential vorticity,
and trace gas trends observed at high-latitudes over North Amer-
ica from February to May 2000, J. Geophys. Res.-Atmos., 108,
D4, doi:10.1029/2001jd001390, 2003.
Brune, W. H., Faloona, I. C., Tan, D., Weinheimer, A. J., Cam-
pos, T., Ridley, B. A., Vay, S. A., Collins, J. E., Sachse, G.
W., Jaegle, L., and Jacob, D. J.: Airborne in-situ OH and HO2
observations in the cloud-free troposphere and lower strato-
sphere during SUCCESS, Geophys. Res. Lett., 25, 1701–1704,
doi:10.1029/97gl03098, 1998.
Carslaw, K. S., Peter, T., and Clegg, S. L.: Modeling the composi-
tion of liquid stratospheric aerosols, Rev. Geophys., 35, 125–154,
doi:10.1029/97rg00078, 1997.
Cheng, I., Xu, X., and Zhang, L.: Overview of receptor-based
source apportionment studies for speciated atmospheric mercury,
Atmos. Chem. Phys., 15, 7877–7895, doi:10.5194/acp-15-7877-
2015, 2015.
Chevalier, A., Gheusi, F., Delmas, R., Ordóñez, C., Sarrat, C.,
Zbinden, R., Thouret, V., Athier, G., and Cousin, J.-M.: Influ-
ence of altitude on ozone levels and variability in the lower
troposphere: a ground-based study for western Europe over
the period 2001–2004, Atmos. Chem. Phys., 7, 4311-4326,
doi:10.5194/acp-7-4311-2007, 2007.
Cuevas, E., González, Y., Rodríguez, S., Guerra, J. C., Gómez-
Peláez, A. J., Alonso-Pérez, S., Bustos, J., and Milford, C.: As-
sessment of atmospheric processes driving ozone variations in
the subtropical North Atlantic free troposphere, Atmos. Chem.
Phys., 13, 1973–1998, doi:10.5194/acp-13-1973-2013, 2013.
Dibble, T. S., Zelie, M. J., and Mao, H.: Thermodynamics of re-
actions of ClHg and BrHg radicals with atmospherically abun-
dant free radicals, Atmos. Chem. Phys., 12, 10271–10279,
doi:10.5194/acp-12-10271-2012, 2012.
Driscoll, C. T., Mason, R. P., Chan, H. M., Jacob, D. J., and
Pirrone, N.: Mercury as a Global Pollutant: Sources, Path-
ways, and Effects, Environ. Sci. Technol., 47, 4967–4983,
doi:10.1021/Es305071v, 2013.
Engström, A. and Magnusson, L.: Estimating trajectory uncertain-
ties due to flow dependent errors in the atmospheric analysis, At-
mos. Chem. Phys., 9, 8857–8867, doi:10.5194/acp-9-8857-2009,
2009.
Faïn, X., Obrist, D., Hallar, A. G., Mccubbin, I., and Rahn, T.:
High levels of reactive gaseous mercury observed at a high eleva-
tion research laboratory in the Rocky Mountains, Atmos. Chem.
Phys., 9, 8049–8060, doi:10.5194/acp-9-8049-2009, 2009.
Fitzenberger, R., Bosch, H., Camy-Peyret, C., Chipperfield, M.
P., Harder, H., Platt, U., Sinnhuber, B. M., Wagner, T., and
Pfeilsticker, K.: First profile measurements of tropospheric BrO,
Geophys. Res. Lett., 27, 2921–2924, doi:10.1029/2000gl011531,
2000.
Fu, X., Feng, X., Sommar, J., and Wang, S.: A review of studies
on atmospheric mercury in China, Sci. Total Environ., 421–422,
73–81, doi:10.1016/j.scitotenv.2011.09.089, 2012.
Fu, X. W., Feng, X. B., Qiu, G. L., Shang, L. H., and
Zhang, H.: Speciated atmospheric mercury and its potential
source in Guiyang, China, Atmos. Environ., 45, 4205–4212,
doi:10.1016/j.atmosenv.2011.05.012, 2011.
Fu, X. W., Zhang, H., Yu, B., Wang, X., Lin, C.-J., and Feng, X. B.:
Observations of atmospheric mercury in China: a critical review,
Atmos. Chem. Phys., 15, 9455–9476, doi:10.5194/acp-15-9455-
2015, 2015.
Atmos. Chem. Phys., 16, 5623–5639, 2016 www.atmos-chem-phys.net/16/5623/2016/
X. Fu et al.: Atmospheric mercury speciation dynamics 5637
Gao, R. S., Rosenlof, K. H., Fahey, D. W., Wennberg, P. O., Hintsa,
E. J., and Hanisco, T. F.: OH in the tropical upper troposphere and
its relationships to solar radiation and reactive nitrogen, J. Atmos.
Chem., 71, 55–64, doi:10.1007/s10874-014-9280-2, 2014.
Gheusi, F., Ravetta, F., Delbarre, H., Tsamalis, C., Chevalier-Rosso,
A., Leroy, C., Augustin, P., Delmas, R., Ancellet, G., Athier, G.,
Bouchou, P., Campistron, B., Cousin, J. M., Fourmentin, M., and
Meyerfeld, Y.: Pic 2005, a field campaign to investigate low-
tropospheric ozone variability in the Pyrenees, Atmos. Res., 101,
640–665, doi:10.1016/j.atmosres.2011.04.014, 2011.
Goodsite, M. E., Plane, J. M. C., and Skov, H.: A theoretical study
of the oxidation of Hg-0 to HgBr2 in the troposphere, Environ.
Sci. Technol., 38, 1772–1776, doi:10.1021/Es034680s, 2004.
Gustin, M. S., Huang, J. Y., Miller, M. B., Peterson, C., Jaffe, D.
A., Ambrose, J., Finley, B. D., Lyman, S. N., Call, K., Talbot,
R., Feddersen, D., Mao, H. T., and Lindberg, S. E.: Do We Un-
derstand What the Mercury Speciation Instruments Are Actu-
ally Measuring? Results of RAMIX, Environ. Sci. Technol., 47,
7295–7306, doi:10.1021/Es3039104, 2013.
Henne, S., Brunner, D., Folini, D., Solberg, S., Klausen, J., and
Buchmann, B.: Assessment of parameters describing representa-
tiveness of air quality in-situ measurement sites, Atmos. Chem.
Phys., 10, 3561–3581, doi:10.5194/acp-10-3561-2010, 2010.
Holmes, C. D., Jacob, D. J., Corbitt, E. S., Mao, J., Yang, X., Tal-
bot, R., and Slemr, F.: Global atmospheric model for mercury
including oxidation by bromine atoms, Atmos. Chem. Phys., 10,
12037–12057, doi:10.5194/acp-10-12037-2010, 2010.
Huang, J. Y., Miller, M. B., Weiss-Penzias, P., and Gustin, M. S.:
Comparison of Gaseous Oxidized Hg Measured by KCl-Coated
Denuders, and Nylon and Cation Exchange Membranes, En-
viron. Sci. Technol., 47, 7307–7316, doi:10.1021/Es4012349,
2013.
Rolph, G. D.: Real-time Environmental Applications and Display
System (READY) Website, NOAA Air Resources Laboratory,
College Park, MD, available at: http://www.ready.noaa.gov (last
access: 10 August 2015), 2016.
Kellerhals, M., Beauchamp, S., Belzer, W., Blanchard, P., Froude,
F., Harvey, B., McDonald, K., Pilote, M., Poissant, L., Puck-
ett, K., Schroeder, B., Steffen, A., and Tordon, R.: Tempo-
ral and spatial variability of total gaseous mercury in Canada:
results from the Canadian Atmospheric Mercury Measure-
ment Network (CAMNet), Atmos. Environ., 37, 1003–1011,
doi:10.1016/S1352-2310(02)00917-2, 2003.
Kock, H. H., Bieber, E., Ebinghaus, R., Spain, T. G., and
Thees, B.: Comparison of long-term trends and seasonal
variations of atmospheric mercury concentrations at the
two European coastal monitoring stations Mace Head, Ire-
land, and Zingst, Germany, Atmos. Environ., 39, 7549–7556,
doi:10.1016/j.atmosenv.2005.02.059, 2005.
Kohler, M. O., Radel, G., Shine, K. P., Rogers, H. L., and Pyle, J.
A.: Latitudinal variation of the effect of aviation NOx emissions
on atmospheric ozone and methane and related climate metrics,
Atmos. Environ., 64, 1–9, doi:10.1016/j.atmosenv.2012.09.013,
2013.
Lan, X., Talbot, R., Castro, M., Perry, K., and Luke, W.: Seasonal
and diurnal variations of atmospheric mercury across the US de-
termined from AMNet monitoring data, Atmos. Chem. Phys., 12,
10569–10582, doi:10.5194/acp-12-10569-2012, 2012.
Landis, M. S., Stevens, R. K., Schaedlich, F., and Prestbo, E.
M.: Development and characterization of an annular denuder
methodology for the measurement of divalent inorganic reac-
tive gaseous mercury in ambient air, Environ. Sci. Technol., 36,
3000–3009, doi:10.1021/Es015887t, 2002.
Laurier, F. J. G., Mason, R. P., Whalin, L., and Kato, S.: Reactive
gaseous mercury formation in the North Pacific Ocean’s marine
boundary layer: A potential role of halogen chemistry, J. Geo-
phys. Res.-Atmos., 108, D17, doi:10.1029/2003jd003625, 2003.
Lee, D. S., Dollard, G. J., and Pepler, S.: Gas-phase mercury in the
atmosphere of the United Kingdom, Atmos. Environ., 32, 855–
864, doi:10.1016/S1352-2310(97)00316-6, 1998.
Lee, D. S., Nemitz, E., Fowler, D., and Kingdon, R. D.: Modelling
atmospheric mercury transport and deposition across Europe and
the UK, Atmos. Environ., 35, 5455–5466, doi:10.1016/S1352-
2310(01)00284-9, 2001.
Lin, C. J. and Pehkonen, S. O.: The chemistry of atmo-
spheric mercury: a review, Atmos. Environ., 33, 2067–2079,
doi:10.1016/S1352-2310(98)00387-2, 1999.
Lin, C.-J., Pan, L., Streets, D. G., Shetty, S. K., Jang, C., Feng, X.,
Chu, H.-W., and Ho, T. C.: Estimating mercury emission out-
flow from East Asia using CMAQ-Hg, Atmos. Chem. Phys., 10,
1853–1864, doi:10.5194/acp-10-1853-2010, 2010.
Lindberg, S., Bullock, R., Ebinghaus, R., Engstrom, D., Feng, X.
B., Fitzgerald, W., Pirrone, N., Prestbo, E., and Seigneur, C.: A
synthesis of progress and uncertainties in attributing the sources
of mercury in deposition, Ambio, 36, 19–32, 2007.
Lindberg, S. E., Brooks, S., Lin, C. J., Scott, K. J., Landis, M. S.,
Stevens, R. K., Goodsite, M., and Richter, A.: Dynamic oxidation
of gaseous mercury in the Arctic troposphere at polar sunrise,
Environ. Sci. Technol., 36, 1245–1256, doi:10.1021/Es0111941,
2002.
Liu, X., Chance, K., Sioris, C. E., Kurosu, T. P., Spurr, R. J.
D., Martin, R. V., Fu, T. M., Logan, J. A., Jacob, D. J.,
Palmer, P. I., Newchurch, M. J., Megretskaia, I. A., and Chat-
field, R. B.: First directly retrieved global distribution of tro-
pospheric column ozone from GOME: Comparison with the
GEOS-CHEM model, J. Geophys. Res.-Atmos., 111, D02308,
doi:10.1029/2005jd006564, 2006.
Lyman, S. N. and Jaffe, D. A.: Formation and fate of oxidized
mercury in the upper troposphere and lower stratosphere, Nat.
Geosci., 5, 114–117, doi:10.1038/Ngeo1353, 2012.
Lyman, S. N., Jaffe, D. A., and Gustin, M. S.: Release of mer-
cury halides from KCl denuders in the presence of ozone, At-
mos. Chem. Phys., 10, 8197–8204, doi:10.5194/acp-10-8197-
2010, 2010.
Malcolm, E. G. and Keeler, G. J.: Evidence for a sampling artifact
for particulate-phase mercury in the marine atmosphere, Atmos.
Environ., 41, 3352–3359, doi:10.1016/j.atmosenv.2006.12.024,
2007.
Manolopoulos, H., Snyder, D. C., Schauer, J. J., Hill, J. S., Turner,
J. R., Olson, M. L., and Krabbenhoft, D. P.: Sources of spe-
ciated atmospheric mercury at a residential neighborhood im-
pacted by industrial sources, Environ. Sci. Technol., 41, 5626–
5633, doi:10.1021/Es0700348, 2007.
Martin, M. V., Honrath, R. E., Owen, R. C., and Li, Q. B.: Sea-
sonal variation of nitrogen oxides in the central North Atlantic
lower free troposphere, J. Geophys. Res.-Atmos., 113, D17307,
doi:10.1029/2007jd009688, 2008.
www.atmos-chem-phys.net/16/5623/2016/ Atmos. Chem. Phys., 16, 5623–5639, 2016
5638 X. Fu et al.: Atmospheric mercury speciation dynamics
McClure, C. D., Jaffe, D. A., and Edgerton, E. S.: Evaluation of
the KCI Denuder Method for Gaseous Oxidized Mercury using
HgBr2 at an In-Service AMNet Site, Environ. Sci. Technol., 48,
11437–11444, doi:10.1021/Es502545k, 2014.
Michelsen, H. A., Spivakovsky, C. M., and Wofsy, S. C.: Aerosol-
mediated partitioning of stratospheric Cl-y and NOy at tem-
peratures above 200 K, Geophys. Res. Lett., 26, 299–302,
doi:10.1029/1998gl900281, 1999.
Moore, C. W., Obrist, D., and Luria, M.: Atmospheric
mercury depletion events at the Dead Sea: Spatial
and temporal aspects, Atmos. Environ., 69, 231–239,
doi:10.1016/j.atmosenv.2012.12.020, 2013.
Murphy, D. M., Thomson, D. S., and Mahoney, T. M. J.: In situ mea-
surements of organics, meteoritic material, mercury, and other
elements in aerosols at 5 to 19 kilometers, Science, 282, 1664–
1669, doi:10.1126/science.282.5394.1664, 1998.
Murphy, D. M., Hudson, P. K., Thomson, D. S., Sheridan, P. J.,
and Wilson, J. C.: Observations of mercury-containing aerosols,
Environ. Sci. Technol., 40, 3163–3167, doi:10.1021/Es052385x,
2006.
Obrist, D., Moosmuller, H., Schurmann, R., Chen, L. W. A., and
Kreidenweis, S. M.: Particulate-phase and gaseous elemental
mercury emissions during biomass combustion: Controlling fac-
tors and correlation with particulate matter emissions, Environ.
Sci. Technol., 42, 721–727, doi:10.1021/Es071279n, 2008.
Obrist, D., Tas, E., Peleg, M., Matveev, V., Fain, X., Asaf,
D., and Luria, M.: Bromine-induced oxidation of mercury
in the mid-latitude atmosphere, Nat. Geosci., 4, 22–26,
doi:10.1038/Ngeo1018, 2011.
Pirrone, N., Cinnirella, S., Feng, X., Finkelman, R. B., Friedli,
H. R., Leaner, J., Mason, R., Mukherjee, A. B., Stracher, G.
B., Streets, D. G., and Telmer, K.: Global mercury emissions
to the atmosphere from anthropogenic and natural sources, At-
mos. Chem. Phys., 10, 5951–5964, doi:10.5194/acp-10-5951-
2010, 2010.
Poirot, R. L. and Wishinski, P. R.: Visibility, Sulfate and Air-Mass
History Associated with the Summertime Aerosol in Northern
Vermont, Atmos. Environ., 20, 1457–1469, doi:10.1016/0004-
6981(86)90018-1, 1986.
Polissar, A. V., Hopke, P. K., and Harris, J. M.: Source regions for
atmospheric aerosol measured at Barrow, Alaska, Environ. Sci.
Technol., 35, 4214–4226, doi:10.1021/Es0107529, 2001.
Read, K. A., Mahajan, A. S., Carpenter, L. J., Evans, M. J., Faria, B.
V. E., Heard, D. E., Hopkins, J. R., Lee, J. D., Moller, S. J., Lewis,
A. C., Mendes, L., McQuaid, J. B., Oetjen, H., Saiz-Lopez, A.,
Pilling, M. J., and Plane, J. M. C.: Extensive halogen-mediated
ozone destruction over the tropical Atlantic Ocean, Nature, 453,
1232–1235, doi:10.1038/Nature07035, 2008.
Rutter, A. P. and Schauer, J. J.: The effect of tempera-
ture on the gas-particle partitioning of reactive mercury
in atmospheric aerosols, Atmos. Environ., 41, 8647–8657,
doi:10.1016/j.atmosenv.2007.07.024, 2007.
Savage, N. H., Law, K. S., Pyle, J. A., Richter, A., Nüß, H.,
and Burrows, J. P.: Using GOME NO2 satellite data to exam-
ine regional differences in TOMCAT model performance, At-
mos. Chem. Phys., 4, 1895–1912, doi:10.5194/acp-4-1895-2004,
2004.
Schroeder, W. H. and Munthe, J.: Atmospheric mercury – An
overview, Atmos. Environ., 32, 809–822, doi:10.1016/S1352-
2310(97)00293-8, 1998.
Selin, N. E., Jacob, D. J., Park, R. J., Yantosca, R. M.,
Strode, S., Jaegle, L., and Jaffe, D.: Chemical cycling
and deposition of atmospheric mercury: Global constraints
from observations, J. Geophys. Res.-Atmos., 112, D02308,
doi:10.1029/2006jd007450, 2007.
Selin, N. E., Jacob, D. J., Yantosca, R. M., Strode, S., Jaegle, L., and
Sunderland, E. M.: Global 3-D land-ocean-atmosphere model
for mercury: Present-day versus preindustrial cycles and anthro-
pogenic enrichment factors for deposition, Global Biogeochem.
Cy., 22, Gb2011, 10.1029/2007gb003040, 2008.
Sexauer Gustin, M., Weiss-Penzias, P. S., and Peterson, C.: Investi-
gating sources of gaseous oxidized mercury in dry deposition at
three sites across Florida, USA, Atmos. Chem. Phys., 12, 9201–
9219, doi:10.5194/acp-12-9201-2012, 2012.
Sheu, G. R., Lin, N. H., Wang, J. L., Lee, C. T., Yang, C. F. O.,
and Wang, S. H.: Temporal distribution and potential sources
of atmospheric mercury measured at a high-elevation back-
ground station in Taiwan, Atmos. Environ., 44, 2393–2400,
doi:10.1016/j.atmosenv.2010.04.009, 2010.
Slemr, F. and Scheel, H. E.: Trends in atmospheric mercury con-
centrations at the summit of the Wank mountain, southern
Germany, Atmos. Environ., 32, 845–853, doi:10.1016/S1352-
2310(97)00131-3, 1998.
Slemr, F., Ebinghaus, R., Brenninkmeijer, C. A. M., Hermann, M.,
Kock, H. H., Martinsson, B. G., Schuck, T., Sprung, D., van
Velthoven, P., Zahn, A., and Ziereis, H.: Gaseous mercury distri-
bution in the upper troposphere and lower stratosphere observed
onboard the CARIBIC passenger aircraft, Atmos. Chem. Phys.,
9, 1957–1969, doi:10.5194/acp-9-1957-2009, 2009.
Slemr, F., Weigelt, A., Ebinghaus, R., Brenninkmeijer, C., Baker,
A., Schuck, T., Rauthe-Schoch, A., Riede, H., Leedham, E., Her-
mann, M., van Velthoven, P., Oram, D., O’Sullivan, D., Dyroff,
C., Zahn, A., and Ziereis, H.: Mercury Plumes in the Global Up-
per Troposphere Observed during Flights with the CARIBIC Ob-
servatory from May 2005 until June 2013, Atmosphere-Basel, 5,
342–369, doi:10.3390/Atmos5020342, 2014.
Slemr, F., Weigelt, A., Ebinghaus, R., Kock, H. H., Bödewadt, J.,
Brenninkmeijer, C. A. M., Rauthe-Schöch, A., Weber, S., Her-
mann, M., Zahn, A., and Martinsson, B.: Atmospheric mer-
cury measurements onboard the CARIBIC passenger aircraft,
Atmos. Meas. Tech. Discuss., doi:10.5194/amt-2015-376, in re-
view, 2016.
Song, X. J., Cheng, I., and Lu, J.: Annual atmospheric mercury
species in Downtown Toronto, Canada, J. Environ. Monitor., 11,
660–669, doi:10.1039/B815435j, 2009.
Spivakovsky, C. M., Logan, J. A., Montzka, S. A., Balkanski, Y. J.,
Foreman-Fowler, M., Jones, D. B. A., Horowitz, L. W., Fusco, A.
C., Brenninkmeijer, C. A. M., Prather, M. J., Wofsy, S. C., and
McElroy, M. B.: Three-dimensional climatological distribution
of tropospheric OH: Update and evaluation, J. Geophys. Res.-
Atmos., 105, 8931–8980, doi:10.1029/1999jd901006, 2000.
Sprovieri, F., Pirrone, N., Landis, M. S., and Stevens, R. K.: Oxida-
tion of gaseous elemental mercury to gaseous divalent mercury
during 2003 polar sunrise at Ny-Alesund, Environ. Sci. Technol.,
39, 9156–9165, doi:10.1021/Es050965o, 2005.
Atmos. Chem. Phys., 16, 5623–5639, 2016 www.atmos-chem-phys.net/16/5623/2016/
X. Fu et al.: Atmospheric mercury speciation dynamics 5639
Sprovieri, F., Pirrone, N., Ebinghaus, R., Kock, H., and Dommer-
gue, A.: A review of worldwide atmospheric mercury measure-
ments, Atmos. Chem. Phys., 10, 8245–8265, doi:10.5194/acp-
10-8245-2010, 2010.
Steffen, A., Douglas, T., Amyot, M., Ariya, P., Aspmo, K., Berg, T.,
Bottenheim, J., Brooks, S., Cobbett, F., Dastoor, A., Dommergue,
A., Ebinghaus, R., Ferrari, C., Gardfeldt, K., Goodsite, M. E.,
Lean, D., Poulain, A. J., Scherz, C., Skov, H., Sommar, J., and
Temme, C.: A synthesis of atmospheric mercury depletion event
chemistry in the atmosphere and snow, Atmos. Chem. Phys., 8,
1445–1482, doi:10.5194/acp-8-1445-2008, 2008.
Steffen, A., Scherz, T., Olson, M., Gay, D., and Blanchard, P.: A
comparison of data quality control protocols for atmospheric
mercury speciation measurements, J. Environ. Monitor., 14, 752–
765, doi:10.1039/c2em10735j, 2012.
Stohl, A., Spichtinger-Rakowsky, N., Bonasoni, P., Feldmann, H.,
Memmesheimer, M., Scheel, H. E., Trickl, T., Hubener, S.,
Ringer, W., and Mandl, M.: The influence of stratospheric in-
trusions on alpine ozone concentrations, Atmos. Environ., 34,
1323–1354, doi:10.1016/S1352-2310(99)00320-9, 2000.
Stohl, A., Forster, C., Frank, A., Seibert, P., and Wotawa, G.:
Technical note: The Lagrangian particle dispersion model
FLEXPART version 6.2, Atmos. Chem. Phys., 5, 2461–2474,
doi:10.5194/acp-5-2461-2005, 2005.
Subir, M., Ariya, P. A., and Dastoor, A. P.: A review of the sources
of uncertainties in atmospheric mercury modeling II, Mercury
surface and heterogeneous chemistry – A missing link, Atmos.
Environ., 46, 1–10, doi:10.1016/j.atmosenv.2011.07.047, 2012.
Swartzendruber, P. C., Jaffe, D. A., Prestbo, E. M., Weiss-Penzias,
P., Selin, N. E., Park, R., Jacob, D. J., Strode, S., and Jaegle, L.:
Observations of reactive gaseous mercury in the free troposphere
at the Mount Bachelor Observatory, J. Geophys. Res.-Atmos.,
111, D24302, doi:10.1029/2006jd007415, 2006.
Swartzendruber, P. C., Jaffe, D. A., and Finley, B.: Improved flu-
orescence peak integration in the Tekran 2537 for applications
with sub-optimal sample loadings, Atmos. Environ., 43, 3648–
3651, doi:10.1016/j.atmosenv.2009.02.063, 2009.
Talbot, R., Mao, H., Scheuer, E., Dibb, J., and Avery, M.:
Total depletion of Hg degrees in the upper troposphere-
lower stratosphere, Geophys. Res. Lett., 34, L23804,
doi:10.1029/2007gl031366, 2007.
Timonen, H., Ambrose, J. L., and Jaffe, D. A.: Oxidation of elemen-
tal Hg in anthropogenic and marine airmasses, Atmos. Chem.
Phys., 13, 2827–2836, doi:10.5194/acp-13-2827-2013, 2013.
Tsamalis, C., Ravetta, F., Gheusi, F., Delbarre, H., and Augustin, P.:
Mixing of free-tropospheric air with the lowland boundary layer
during anabatic transport to a high altitude station, Atmos. Res.,
143, 425–437, doi:10.1016/j.atmosres.2014.03.011, 2014.
Wang, F., Saiz-Lopez, A., Mahajan, A. S., Gómez Martín, J. C.,
Armstrong, D., Lemes, M., Hay, T., and Prados-Roman, C.: En-
hanced production of oxidised mercury over the tropical Pacific
Ocean: a key missing oxidation pathway, Atmos. Chem. Phys.,
14, 1323–1335, doi:10.5194/acp-14-1323-2014, 2014.
Weiss-Penzias, P., Amos, H. M., Selin, N. E., Gustin, M. S., Jaffe,
D. A., Obrist, D., Sheu, G.-R., and Giang, A.: Corrigendum to
“Use of a global model to understand speciated atmospheric mer-
cury observations at five high-elevation sites” published in At-
mos. Chem. Phys., 15, 1161–1173, 2015, Atmos. Chem. Phys.,
15, 2225–2225, doi:10.5194/acp-15-2225-2015, 2015.
Zeng, Y. and Hopke, P. K.: A Study of the Sources of Acid Pre-
cipitation in Ontario, Canada, Atmos. Environ., 23, 1499–1509,
doi:10.1016/0004-6981(89)90409-5, 1989.
Zhang, L. M., Wright, L. P., and Blanchard, P.: A review
of current knowledge concerning dry deposition of at-
mospheric mercury, Atmos. Environ., 43, 5853–5864,
doi:10.1016/j.atmosenv.2009.08.019, 2009.
www.atmos-chem-phys.net/16/5623/2016/ Atmos. Chem. Phys., 16, 5623–5639, 2016


![[Bastien James] Bastien Piano Basics Theory Level (Bookos.org)](https://cdn.vdocument.in/doc/165x107/55cf9af6550346d033a43244/bastien-james-bastien-piano-basics-theory-level-bookosorg.jpg)