
EASTERN JOURNAL OF EUROPEAN STUDIES Volume 3, Issue 2, December 2012 161
Attitudes towards immigrants and the integration
of ethnically diverse societies
Tiiu PAAS
, Vivika HALAPUU
Abstract
The paper aims to clarify the possible determinants of peoples’ attitudes towards
immigrants depending on their personal characteristics as well as attitudes
towards households’ socio-economic stability and a country's institutions
relying on the data of the European Social Survey fourth round database. The
study intends to provide empirical evidence-based grounds for the development
of policy measures to integrate ethnically diverse societies, taking into account
the composition of the country's population as well as other country’s
peculiarities. The results of the empirical analysis are consistent with several
theoretical approaches explaining individual and collective determinants of
people’s attitudes towards immigrants. Ethnic minorities, urban people, people
with higher education and income, as well as people who have work experience
abroad are, as a rule, more tolerant towards immigrants in Europe.
Furthermore, people whose attitudes to socio-economic risks are lower and who
evaluate the political and legal systems of a country and its police higher are
more tolerant towards immigrants. The respondents’ labour market status
(employed, unemployed) does not have a statistically significant relationship
with their attitudes towards immigrants. In addition to the respondent’s personal
characteristics and their attitudes, the collective determinants depending on
country specific conditions measured by country dummies are valid in
explaining people’s attitudes towards immigration.
Tiiu Paas is professor at the Faculty of Economics and Business Administration, University of
Tartu; e-mail: [email protected]. Vivika Halapuu is program analyst in the Estonian Ministry of Education and Research; e-mail:
Acknowledgements: Financial support is acknowledged from the NORFACE research program on
Migration in Europe - Social, Economic, Cultural and Policy Dynamics (project MIDI-REDIE,
Migrant Diversity and Regional Disparity in Europe). The authors of the paper are also grateful to
the Estonian Science Foundation (research grant No. 7756) and the Estonian Ministry of Education
and Research (grant No. SF0180037s08) for their financial support. We are also thankful for the
valuable feedback and comments received from our colleagues and project partners during several
seminars and discussions. Views expressed in the paper are solely those of the authors and, as
such, should not be attributed to other parties.
brought to you by COREView metadata, citation and similar papers at core.ac.uk
provided by Directory of Open Access Journals
162 Tiiu PAAS, Vivika HALAPUU
Key words: attitudes, immigration, tolerance, economic growth, policy
implications
JEL Classification: O40, R11, C31, P51
1. Introduction
Key elements of global competition are no longer trade in goods, services
and flows of capital, but competition for people (see also Florida and Tinagli,
2004). In addition to the neoclassical endogenous growth and the New
Economic Geography (NEG) models examining economic growth and
development, the 3T (Technology, Talent, Tolerance) theory, initially proposed
by Richard Florida (Florida, 2002, 2004, 2005), has gained popularity since the
beginning of the 21st century. The 3T model emphasizes the important role of
the interaction and integrity of technology, talent and tolerance in attracting and
retaining creative and diverse people and thereby spurring economic growth.
This theoretical framework concurs with the view that in order to adjust to a
rapidly changing economic environment, mobility, skills, creativity in people
and new ideas are becoming increasingly important for economic success.
We are of the opinion that economic growth and development are
noticeably affected by the ability of countries and regions to attract and integrate
diverse, creative and innovative people (as one production factor) and to support
the tolerance of diversity. Although not all immigrants are well-educated and
highly-skilled to provide a sufficiently innovative and creative labour force,
national economic policies should create conditions that support the integration
of ethnic diversity. The international mobility of people and labour force is
increasing globally. Countries should manage these processes and develop
policy measures that are competitive in attracting a talented and highly-skilled
new labour force from the global labour market. National institutions should also
create favourable conditions for integrating ethnically diverse societies and
retaining a peaceful environment for economic activities, as well as providing
new challenges for the development of entrepreneurship. An ethnically and
culturally diverse population creates a greater variability in the demand for
goods and services, and also offers greater variability in the supply of labour
through different skills and business cultures. That in turn creates favourable
preconditions for new business activities and also for future economic growth.
In this paper we use people’s attitudes towards immigrants as a proxy for
tolerance of diversity as a possible precondition for economic growth. The
paper's aim is to clarify the possible determinants of people’s attitudes towards
immigrants depending on their personal characteristics (e.g. education, gender,
age, etc.), and attitudes towards a country's institutions and socio-economic
stability. The study's ultimate aim is to provide empirical evidence-based
grounds for policy proposals that through a favourable “people climate” can
ATTITUDES TOWARDS IMMIGRANTS AND THE INTEGRATION OF ETHNICALLY 163
support economic growth. Based on these aims, the paper focuses on examining
the attitudes of European people towards immigrants, relying on information
provided in the European Social Survey (ESS) fourth round database.
In the next part of the paper, we discuss some theoretical arguments for
examining the determinants of people’s attitudes towards immigration,
taking into account that the theoretical framework for clarifying their
attitudes towards immigrants is interdisciplinary. The third part of the
paper relies on the implementation of statistical and econometric methods
for analysing the determinants of people’s attitudes towards immigrants
and presents empirical results. The fourth part of the paper discusses the
study's main outcomes.
2. Theoretical framework for examining the determinants of people’s
attitudes towards immigration
The theories that explain the determinants of attitudes towards immigration
are diverse. Some emphasize the importance of economic competition, while others
emphasize cultural, political and other aspects of life. Generally, the theories can be
divided into two groups – individual and collective theories. What distinguishes the
two groups is the level of measurement; for example, country/region and person.
The same factor enables a further two categories to be defined in the group of
collective theories – national and regional. In this paper we rely mainly upon
individual economic theories (micro-approach) in considering the empirical focus of
the paper. A short review of the collective theories is provided.
Individual theories of attitudes towards immigrants places emphasis on
individual drivers, such as the level of education (human capital theory),
personal income, employment status (individual economic theories), cultural
conflicts where there is a lack of understanding from natives towards immigrants
(cultural marginality safety approach). Collective theories focus on aggregated
variables, such as the number of immigrants in a country (contact theory), level
of unemployment and unemployment growth rate (collective economic theories).
According to individual economic theories, individuals with less economic
security (i.e. with a lower level of education, lack of skills, lower level of
financial resources) tend to have more intolerant attitudes towards immigrants.
An explanation for this comes from the neoclassical economic theory and trade
theory. When a labour supply increases due to immigration, competition on the
labour market becomes tougher. Moreover, the native’s wages (at least in some
skill groups) will decrease. As immigrants tend to be over represented in low-
skilled jobs, low-skilled natives are more likely to have anti-immigrant attitudes.
It has also been established that highly-skilled individuals are more likely to
adopt more tolerant attitudes towards immigration than low-skilled, and this
164 Tiiu PAAS, Vivika HALAPUU
effect is greater in richer countries than in poorer countries, as well as in more
equal countries than in more unequal ones (O’Rourke and Sinnott, 2006).
According to collective economic theories, a higher unemployment rate in a
country leads to a higher level of anti-immigrant attitudes. The explanation is similar
to the aforementioned – greater competition in the labour market which makes
natives feel threatened. It has also been established that in countries with a higher
GDP, attitudes towards immigrants tend to be more positive. However, economic
cycles also matter. In addition to the level of GDP and unemployment, their growth
rates influence attitudes. Economic growth means an increased number of new jobs
and less competition on the labour market even if immigrants enter the country.
Therefore, attitudes are more likely to be tolerant (Kehrberg, 2007, p. 266).
Contact theory and collective threat explanation claim that attitudes
towards immigrants are dependent on the relative size of the immigrant
population (Quillian, 1995, Scheve and Slaughter, 2001). An increasing share of
immigrants percentage of a country’s population leads to an increased perceived
threat of immigrants (both, economic and political. That, in turn, changes
positive or neutral attitudes into anti-immigrant ones. The impact of the relative
size of the immigrant population has therefore two effects, a direct effect by
increasing the perceived threat, and an indirect effect by decreasing political
tolerance, which leads to higher anti-immigrant attitudes (see Kehrberg, 2007).
However, attitudes are not influenced only by the size of the immigrant
population. The level of personal contact also matters. The individual approach
to contact theory says that having a considerable number of immigrants in a
neighbourhood increases the level of perceived threat. Therefore, more casual
contacts with immigrants can mean intolerant attitudes. On the other hand,
having more personal contact with immigrants can lead to a higher level of
tolerance because a native’s knowledge of immigrants will improve and they
will not be seen as that much of a social threat (Allport, 1954, Pettigrew, 1998,
McLaren, 2003). According to cultural marginality explanation, attitudes
towards immigrants are more tolerant when local people can understand
immigrants. People who have belonged to minority groups that have been
discriminated tend to be more tolerant towards other groups in similar situations
(Allport, 1954).
Human capital theory claims that a higher level of education leads to a
higher level of tolerance. One channel for this is via improved skills and higher
qualifications. Economic security acquired in this way repositions the individual
so that s/he does not have to compete against immigrants in the labour market
(Mayda, 2006). Another channel involves education broadening people’s
horizons, which might lead to increased tolerance. A higher level of education
also contributes to political and social engagement. The political affiliation
explanation claims that people who are alienated politically may be looking for
others to blame, and consequently, may be more negative towards immigrants
ATTITUDES TOWARDS IMMIGRANTS AND THE INTEGRATION OF ETHNICALLY 165
(Espenshade and Hempstead, 1996). Another aspect of political life that
influences attitudes towards immigrants is political tolerance. It has been
established that a high level of political tolerance decreases the probability of
negative attitudes towards immigration (Kehrberg, 2007, p. 267).
Neighbourhood safety is a determinant that might also influence attitudes.
If people are afraid to walk around their neighbourhood in the dark, and they
blame immigrants for criminal activity and violence, then their attitudes towards
immigrants are probably negative. Chandler and Tsai (2001), who studied the
relationship between the feeling of safety and attitudes towards immigration,
have found a weak positive relationship between the two variables. In addition,
we also believe that religion, age and the type of area where an individual lives
may have a certain impact on people’s attitudes towards immigrants. Some
authors have argued that age is negatively correlated with attitudes towards
immigrants (Hernes and Knudsen, 1992, Quillian, 1995) and that the level of
tolerance is higher among women (Hernes and Knudsen, 1992). In 1938, Wirth
suggested that exposure to the city’s social heterogeneity promotes tolerance
(Wilson, 1991). That means people living in larger cities should have more
tolerant attitudes.
Relying on the interdisciplinary framework of theories and theoretical
approaches that may explain determinants of people’s attitudes towards
immigrants, we have composed the set of explanatory variables for estimating
regression models to explain the variability in peoples´ attitudes towards
immigrants. In order to capture the country specific determinants proceeding
from collective theories, we rely upon the implementation of country dummies
in the estimated regression models.
3. Empirical analysis of determinants of peoples’ attitudes towards
immigrants
3.1. Data
In the empirical part of our study we rely upon the theoretical arguments
discussed in the previous section of the paper in order to specify econometric models
for examining the relationship between people’s attitudes towards immigrants and
the factors that may explain the variability of these attitudes. The analysis is based
on the European Social Survey (ESS) fourth round database (2008). This is an
academically-driven social survey designed to chart and explain the interaction
between Europe's changing institutions and attitudes, beliefs and behaviour patterns
of its diverse populations. We estimated cross-section regression models based on
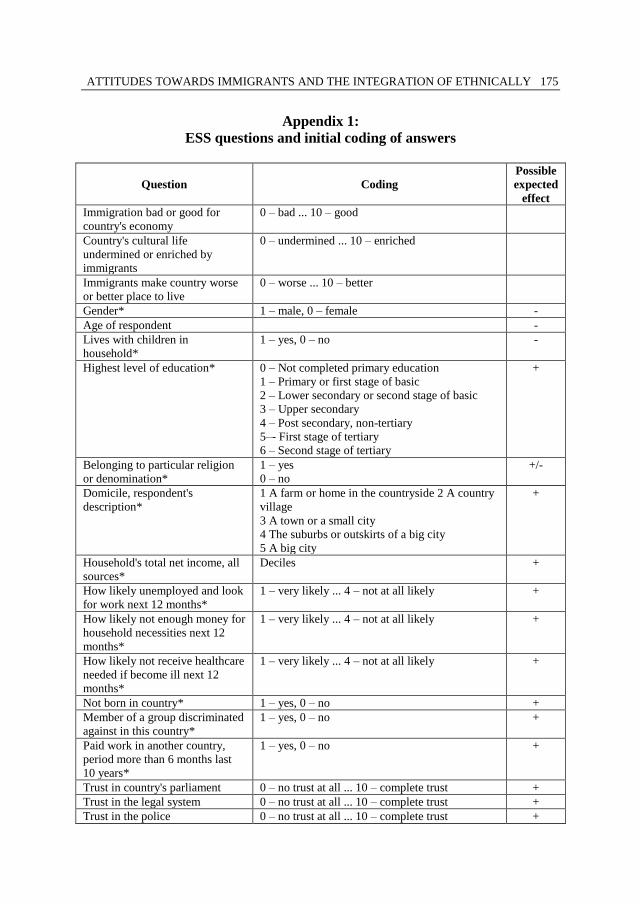
data from 29,858 respondents. Variables from the ESS database that were used in
the analysis and different modified items based on them are presented with
information about their coding in appendix 1.
166 Tiiu PAAS, Vivika HALAPUU
In several cases we re-coded some of the initial indicators of the ESS
database using categorical variables as an explanatory of the estimated
regression models. Information about household incomes is aggregated into
three groups: group I, lowest income, deciles 1–4; group II, middle income,
deciles 5–7, and group III, highest income, deciles 8–10. For presenting
information about the respondents’ education, we used the ISCED-97
(International Standard Classification of Education) coding system and
aggregated information into three groups: lowest level of education (ISCED 0–2;
0 – not completed primary education; 1 – primary or first stage of basic
education; 2 – lower secondary or second stage of basic education); middle level
of education (ISCED 3 and 4; 3 – upper secondary education; 4 – post
secondary, non-tertiary education) and highest level of education (ISCED 5 and
6; 5 – first stage of tertiary; 6 – second stage of tertiary). The respondents’
places of living were coded into three groups: countryside (a farm or house in
the countryside); village or town (a town or a small town; a village); a city (a big
city; suburbs or outskirts of a big city). Information about the labour market
status is presented in three categories: 1 – unemployed; 2 – employed; 3 ––
inactive.
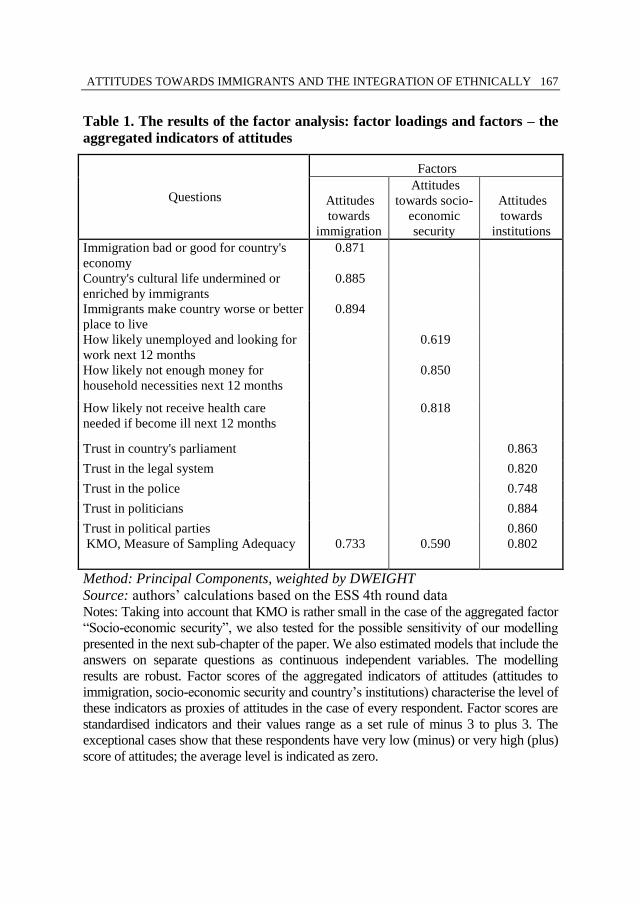
3.2. Aggregated indicators of attitudes
We implemented the principal components factor analysis method in
order to elaborate the aggregated indicators of people’s attitudes by taking into
account answers to several questions from the ESS. The aggregated indicators
characterise people’s attitudes towards 1) immigration (questions 1–3; see Table
1), 2) socio-economic security (questions 4–6), and 3) trust in a country's
institutions (questions 7–11). The results of the factor analysis are presented in
Table 1.
3.3. Empirical results
The dependent variable of the regression model is the aggregated indicator
of people’s attitudes towards immigration (factor scores). Explanatory variables
are the personal characteristics of the respondents (gender, age, education,
ethnicity, type of living area, etc.) and factor scores of two aggregated
indicators: trust in a country's institutions and attitudes to socio-economic
security (Table 2). Country dummies as proxies of country specific conditions
are used as control variables, and the estimated parameters of the country
dummies are considered as country effects (Figure 1). Table 2 presents the
estimators of an econometric model that describes the relationship between that
of Europeans’ attitudes towards immigration and the determinants that may
explain the variability of these attitudes.
ATTITUDES TOWARDS IMMIGRANTS AND THE INTEGRATION OF ETHNICALLY 167
Table 1. The results of the factor analysis: factor loadings and factors – the
aggregated indicators of attitudes
Questions
Factors
Attitudes
towards
immigration
Attitudes
towards socio-
economic
security
Attitudes
towards
institutions
Immigration bad or good for country's
economy
0.871
Country's cultural life undermined or
enriched by immigrants
0.885
Immigrants make country worse or better
place to live
0.894
How likely unemployed and looking for
work next 12 months
0.619
How likely not enough money for
household necessities next 12 months
0.850
How likely not receive health care
needed if become ill next 12 months
0.818
Trust in country's parliament 0.863
Trust in the legal system 0.820
Trust in the police 0.748
Trust in politicians 0.884
Trust in political parties
KMO, Measure of Sampling Adequacy
0.733
0.590
0.860
0.802
Method: Principal Components, weighted by DWEIGHT
Source: authors’ calculations based on the ESS 4th round data Notes: Taking into account that KMO is rather small in the case of the aggregated factor
“Socio-economic security”, we also tested for the possible sensitivity of our modelling
presented in the next sub-chapter of the paper. We also estimated models that include the
answers on separate questions as continuous independent variables. The modelling
results are robust. Factor scores of the aggregated indicators of attitudes (attitudes to
immigration, socio-economic security and country’s institutions) characterise the level of
these indicators as proxies of attitudes in the case of every respondent. Factor scores are
standardised indicators and their values range as a set rule of minus 3 to plus 3. The
exceptional cases show that these respondents have very low (minus) or very high (plus)
score of attitudes; the average level is indicated as zero.
168 Tiiu PAAS, Vivika HALAPUU
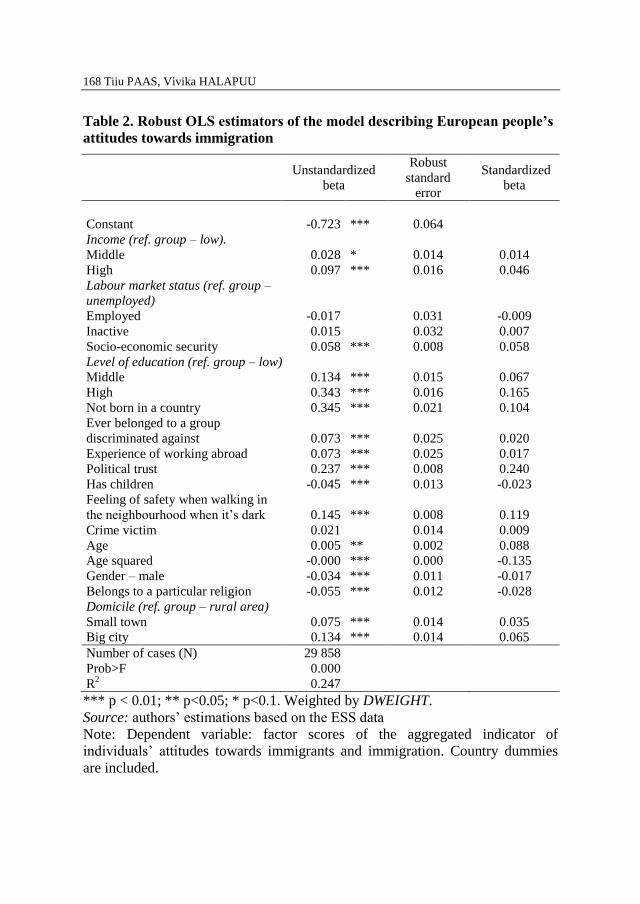
Table 2. Robust OLS estimators of the model describing European people’s
attitudes towards immigration
Unstandardized
beta
Robust
standard
error
Standardized
beta
Constant -0.723 *** 0.064
Income (ref. group – low).
Middle 0.028 * 0.014 0.014
High 0.097 *** 0.016 0.046
Labour market status (ref. group –
unemployed)
Employed -0.017 0.031 -0.009
Inactive 0.015 0.032 0.007
Socio-economic security 0.058 *** 0.008 0.058
Level of education (ref. group – low)
Middle 0.134 *** 0.015 0.067
High 0.343 *** 0.016 0.165
Not born in a country 0.345 *** 0.021 0.104
Ever belonged to a group
discriminated against 0.073 *** 0.025 0.020
Experience of working abroad 0.073 *** 0.025 0.017
Political trust 0.237 *** 0.008 0.240
Has children -0.045 *** 0.013 -0.023
Feeling of safety when walking in
the neighbourhood when it’s dark 0.145 *** 0.008 0.119
Crime victim 0.021 0.014 0.009
Age 0.005 ** 0.002 0.088
Age squared -0.000 *** 0.000 -0.135
Gender – male -0.034 *** 0.011 -0.017
Belongs to a particular religion -0.055 *** 0.012 -0.028
Domicile (ref. group – rural area)
Small town 0.075 *** 0.014 0.035
Big city 0.134 *** 0.014 0.065
Number of cases (N) 29 858
Prob>F 0.000
R2 0.247
*** p < 0.01; ** p<0.05; * p<0.1. Weighted by DWEIGHT.
Source: authors’ estimations based on the ESS data
Note: Dependent variable: factor scores of the aggregated indicator of
individuals’ attitudes towards immigrants and immigration. Country dummies
are included.
ATTITUDES TOWARDS IMMIGRANTS AND THE INTEGRATION OF ETHNICALLY 169
Descriptive information on dependent and explanatory variables is
presented in Appendix 2.
Explanatory variables can be considered differently. Some of them remain
stable over the respondent’s lifespan (e.g. gender, religion etc.) and policy
measures cannot change them. Some variables like attitudes towards socio-
economic security and political trust are volatile and can be changed as a result
of government activity. Some personal characteristics like education, type of
living area and work experience can also change over a lifetime as a result of
personal decisions and government policies as well as a combination of both.
The empirical results (Table 2) are consistent with several theories that
explain the determinants of attitudes towards immigrants. For instance, the
estimated results confirm that people who are not born in the country where they
live, people who have belonged to a group discriminated against in the country
they live in, and people who have worked abroad for at least 6 months during the
last 10 years have more tolerant attitudes towards immigrants. These results
support contact theory.
In addition to contact theory, the area that people live in also influences
their attitudes towards immigrants. People living outside urban areas (in smaller
towns and rural areas) have more anti-immigrant attitudes as compared to people
living in urban areas. The expected effects of the variables mentioned so far are
consistent with the signs of coefficients estimated using the models in most of
the cases.
The political affiliation explanation works in the case of the estimated
model as well. People who trust the institutions (parliament, legal system, police,
politicians and political parties) of the country where they live have more
tolerant attitudes towards immigrants. People who can trust the political and
legal system of a country do not have to worry that much about possible threats
that immigrants might represent. Therefore, creating a transparent and reliable
political system and institutions might help increase tolerant attitudes towards
other aspects of life (e.g. immigration).
The results also confirm the validity of the human capital theory, which
claims that a higher level of education leads to a greater level of tolerant
attitudes. People in higher income groups are more tolerant towards immigrants.
Surprisingly, the labour market status does not have a significant impact on
attitudes towards immigration: attitudes of employed and inactive people show
no significant statistical difference from those who are unemployed. We also ran
an analysis to compare attitudes towards immigration among two groups -
students and those out of the labour force (excluding students) - and we received
confirmation that students’ attitudes towards immigrants are more positive than
the attitudes of those out of the labour force. The estimated parameters of
personal characteristics of the respondents (age, education, religion, country of
origin, etc.) are statistically significant and have the expected signs.
170 Tiiu PAAS, Vivika HALAPUU
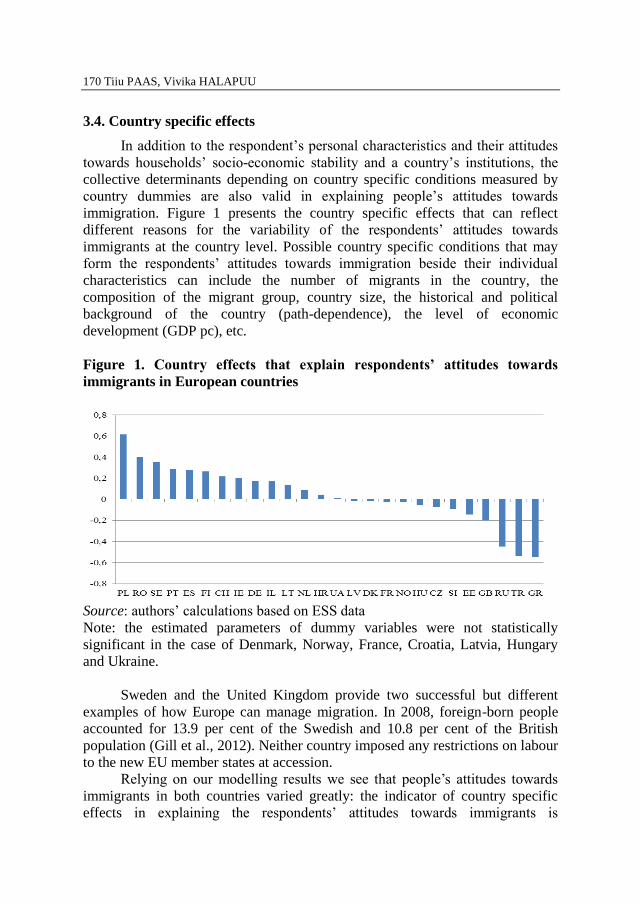
3.4. Country specific effects
In addition to the respondent’s personal characteristics and their attitudes
towards households’ socio-economic stability and a country’s institutions, the
collective determinants depending on country specific conditions measured by
country dummies are also valid in explaining people’s attitudes towards
immigration. Figure 1 presents the country specific effects that can reflect
different reasons for the variability of the respondents’ attitudes towards
immigrants at the country level. Possible country specific conditions that may
form the respondents’ attitudes towards immigration beside their individual
characteristics can include the number of migrants in the country, the
composition of the migrant group, country size, the historical and political
background of the country (path-dependence), the level of economic
development (GDP pc), etc.
Figure 1. Country effects that explain respondents’ attitudes towards
immigrants in European countries
Source: authors’ calculations based on ESS data
Note: the estimated parameters of dummy variables were not statistically
significant in the case of Denmark, Norway, France, Croatia, Latvia, Hungary
and Ukraine.
Sweden and the United Kingdom provide two successful but different
examples of how Europe can manage migration. In 2008, foreign-born people
accounted for 13.9 per cent of the Swedish and 10.8 per cent of the British
population (Gill et al., 2012). Neither country imposed any restrictions on labour
to the new EU member states at accession.
Relying on our modelling results we see that people’s attitudes towards
immigrants in both countries varied greatly: the indicator of country specific
effects in explaining the respondents’ attitudes towards immigrants is
ATTITUDES TOWARDS IMMIGRANTS AND THE INTEGRATION OF ETHNICALLY 171
statistically significantly negative in the UK and positive in Sweden (figure 1).
According to MIPEX – Migrant Integration Policy Index (see www.mipex.eu),
the migrant integration policies of these countries are evaluated differently.
According to MIPEX III (2011), Sweden has the best migration integration
policy in the world. In the international context, the British immigrant
integration policies are assessed as being weak. At the same time, the UK
received a high percentage of highly-skilled newcomers willing to work due to
its cultural diversity, metropolitan centres such as London, the presence of
multinational companies and few language barriers. The diversity of
immigration in the UK makes it relatively easy for foreigners to find a niche.
However, negative attitudes towards immigration from the UK respondents
indicate that there is a threat that tensions could increase in this multinational
society, and in turn, that could have a negative impact on future economic
growth.
4. Conclusion and discussion
The results of our empirical analysis are consistent with several individual
theories explaining the determinants of people’s attitudes towards immigrants.
Ethnic minorities, urban people, people with higher education and higher
income, as well as people who have work experience abroad are, as a rule, more
tolerant towards immigrants in Europe. Furthermore, people who evaluate the
political and legal systems of a country and its police higher (e.g. they have
higher level of political trust) are more tolerant. Similarly, people who have
more positive expectations of their future well-being and whose attitudes to
socio-economic risks are lower are more tolerant towards immigrants. The
labour market status of respondents (employed, inactive) does not have a
statistically significant relationship with their attitudes towards immigrants.
Thus, people in general do not connect their own labour market status with
immigrants.
Possibly country specific conditions that can form the attitudes of
respondents towards immigrants beside their individual characteristics are taken
into account by including country dummies in the regression models. These
variables are considered as aggregated proxies of the determinants explained by
collective theories of people’s attitudes towards immigrants. The estimators
show that the majority of the country specific effects are as a rule statistically
significant, indicating that in addition to the respondent’s personal
characteristics and their attitudes towards the country’s institutions and
households’ socio-economic security the collective determinants of attitudes
depending on country specific conditions are also valid. Thus, we can summarise
that the European people’s attitudes towards immigrants vary depending on 1)
the personal characteristics of the respondents, 2) the people’s attitudes towards
172 Tiiu PAAS, Vivika HALAPUU
the country's institutions and socio-economic security, and 3) country specific
conditions.
In addition to considering the determinants of the people’s attitudes
according to individual and collective theories, they should also be considered
differently depending on their flexibility to policy measures. Some of these
determinants remain stable during the respondent’s life, and policy measures
cannot change them. Some personal characteristics like education, living place
and work experience can change during life as a result of personal decisions and
government policies or a combination of both. Determinants like the individual’s
attitudes to household’s socio-economic security and political trust are
changeable as a result of government activities and implemented policies.
In conclusion, in order to support the integration of ethnically diverse
societies, the implementation of policy measures that support the improvement
of people’s attitudes towards a country’s institutions and socio-economic
situation are necessary. A further package of measures should include the
creation of supportive conditions for labour mobility and the improvement of
human capital as well as reflecting positive images of multicultural activities in
the media. In addition, linking neighbourhood safety with contact seems to be
important for future improvement of a climate of tolerance to ethnic diversities.
If natives have better knowledge of immigrants, they will not associate them
with crime unless there are proofs of some criminal incidents.
References
Allport, G. W. (1954), The Nature of Prejudice. Reading, MA: Addison-Wesley.
Chandler, C. R., Tsai, Y. (2001), Social Factors Influencing Immigration
Attitudes: An Analysis of Data from the General Social Survey, The Social
Science Journal, Vol. 38, pp. 177-188.
Clifton, N. (2008), The Creative Class in the UK: an Initial Analysis,
Geografiska Annaler: Series B, Human Geography, Vol. 90, No. 1, pp. 63-82.
Cooke, P; Clifton, N. (2007), Technology, Talent and Tolerance in European
Cities: A Comparative Analysis, Full Research Report, Cardiff University.
Espenshade, T. J., Hempstead, K. (1996), Contemporary American Attitudes
toward U.S. immigration, International Migration Review, Vol. 30, No. 2, pp.
535-570.
European Social Survey Round 4 Data (2008), Data file edition 3.0. Norwegian
Social Science Data Services, Norway – Data Archive and distributor of ESS
data.
Florida, R. (2002), The Rise of the Creative Class: And How It's Transforming
Work, Leisure, Community and Everyday Life, New York: Basic Books, 416 p.
ATTITUDES TOWARDS IMMIGRANTS AND THE INTEGRATION OF ETHNICALLY 173
Florida, R., Tinagli, I. (2004), Europe in the Creative Age, 48 p.
Florida, R. (2004), The Flight of the Creative Class: The New Global
Competition for Talent. Harper Collins, New York, 326 p.
Florida, R. (2005), Cities and Creative Class. Routledge, New York, London.
Gill, I.S, Raiser, M. et al. (2012), Golden Growth. Restoring the lustre of the
European economic model, World Bank, Washington.
Gross, D.M. (1998), Immigration Flows and Regional Labor Market Dynamics.
International Monetary Fund, Working Paper, No. 98/47, 29 p.
Hernes, G., Knudsen, K. (1992), Norwegians’ attitudes toward new immigrants,
Acta Sociologica, Vol. 35, pp. 123-139.
Kehrberg, J.E. (2007), Public Opinion on Immigration in Western Europe:
Economics, Tolerance, and Exposure, Comparative European Politics, Vol. 5,
pp. 264-281.
Lorenzen, M., Andersen, C. V. (2009), Centrality and Creativity: Does Richard
Florida’s Creative Class Offer New Insights into Urban Hierarchy? Economic
Geography, Vol. 85, No. 4, pp. 363-390.
Malanga, S. (2004), The Curse of the Creative Class, City Journal,
[http://www.city-journal.org/html/14_1_the_curse.html].
Markusen, A. (2006), Urban Development and the Politics of a Creative Class:
Evidence from the Study of Artists, Environment and Planning A, Vol. 38, No.
10, pp. 1921-1940.
McLaren, L.M. (2003), Anti-Immigrant Prejudice in Europe: Contact, Threat
Perception, and Preferences for the Exclusion of Migrants, Social Forces,
Vol. 81, No. 3, pp. 909-936.
Mayda, A.M. (2006), Who is Against Immigration? A Cross-Country
Investigation of Individual Attitudes toward Immigrants, Review of Economics
and Statistics, Vol. 88, No. 3, pp. 510-530.
O’Rourke, K. H., Sinnott, R. (2006), The determinants of individual attitudes
towards immigration, European Journal of Political Economy, Vol. 22, pp. 838–
861.
Ottaviano, G.I.P., Peri, G. (2006), The Economic Value of Cultural Diversity:
Evidence from US cities, Journal of Economic Geography, Vol. 6, No. 1, pp. 9-
44.
Pettigrew, T.F. (1998), Intergroup Contact Theory, Annual Review of
Psychology, Vol. 49, pp. 65-85.
174 Tiiu PAAS, Vivika HALAPUU
Pope, D., Withers, G. (1993), Do Migrants Rob Jobs? Lessons of Australian
History, 1861-1991, The Journal of Economic History, Vol. 53, No. 4, pp. 719-
74.
Quillian, L. (1995), Prejudice as a response to perceived group threat: population
composition and anti-immigrant and racial prejudice in Europe, American
Sociological Review, Vol. 60, No. 4, pp. 586-612.
Rustenbach, E. (2010), Sources of Negative Attitudes toward Immigrants in
Europe: A Multi-Level Analysis, International Migration Review, Vol. 44, No.
1, pp. 53-77.
Scheve, K.F., Slaughter, M. J. (2001), Labor Market Competition and Individual
Preferences over Immigration Policy, The Review of Economics and Statistics,
Vol. 83, No. 1, pp. 133-145.
Wilson, T.C. (1991), Urbanism, Migration, and Tolerance: A Reassessment,
American Sociological Review, Vol. 56, No. 1, pp. 117-123.
Wirth, L. (1938), Urbanism as a Way of life, American Journal of Sociology,
Vol. 44, pp. 3-24.
Zolberg, A.R. (1999), Bounded States in A Global Market: The Uses of
International Labor Migrations, in Bourdieu, P. and Coleman, J. S. (eds.), Social
Theory for a Changing Society, Boulder, CO: Westview, 1.
ATTITUDES TOWARDS IMMIGRANTS AND THE INTEGRATION OF ETHNICALLY 175
Appendix 1:
ESS questions and initial coding of answers
Question Coding
Possible
expected
effect
Immigration bad or good for
country's economy
0 – bad ... 10 – good
Country's cultural life
undermined or enriched by
immigrants
0 – undermined ... 10 – enriched
Immigrants make country worse
or better place to live
0 – worse ... 10 – better
Gender* 1 – male, 0 – female -
Age of respondent -
Lives with children in
household*
1 – yes, 0 – no -
Highest level of education* 0 – Not completed primary education
1 – Primary or first stage of basic
2 – Lower secondary or second stage of basic
3 – Upper secondary
4 – Post secondary, non-tertiary
5–- First stage of tertiary
6 – Second stage of tertiary
+
Belonging to particular religion
or denomination*
1 – yes
0 – no
+/-
Domicile, respondent's
description*
1 A farm or home in the countryside 2 A country
village
3 A town or a small city
4 The suburbs or outskirts of a big city
5 A big city
+
Household's total net income, all
sources*
Deciles +
How likely unemployed and look
for work next 12 months*
1 – very likely ... 4 – not at all likely +
How likely not enough money for
household necessities next 12
months*
1 – very likely ... 4 – not at all likely +
How likely not receive healthcare
needed if become ill next 12
months*
1 – very likely ... 4 – not at all likely +
Not born in country* 1 – yes, 0 – no +
Member of a group discriminated
against in this country*
1 – yes, 0 – no +
Paid work in another country,
period more than 6 months last
10 years*
1 – yes, 0 – no +
Trust in country's parliament 0 – no trust at all ... 10 – complete trust +
Trust in the legal system 0 – no trust at all ... 10 – complete trust +
Trust in the police 0 – no trust at all ... 10 – complete trust +
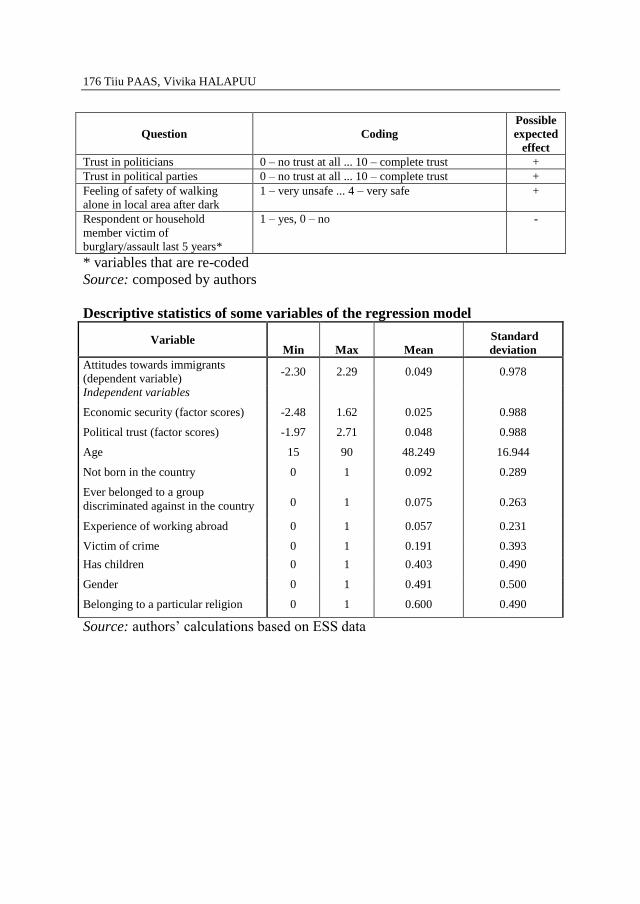
176 Tiiu PAAS, Vivika HALAPUU
Question Coding
Possible
expected
effect
Trust in politicians 0 – no trust at all ... 10 – complete trust +
Trust in political parties 0 – no trust at all ... 10 – complete trust +
Feeling of safety of walking
alone in local area after dark
1 – very unsafe ... 4 – very safe +
Respondent or household
member victim of
burglary/assault last 5 years*
1 – yes, 0 – no -
* variables that are re-coded
Source: composed by authors
Descriptive statistics of some variables of the regression model
Variable Min Max Mean
Standard
deviation
Attitudes towards immigrants
(dependent variable) -2.30 2.29 0.049 0.978
Independent variables
Economic security (factor scores) -2.48 1.62 0.025 0.988
Political trust (factor scores) -1.97 2.71 0.048 0.988
Age 15 90 48.249 16.944
Not born in the country 0 1 0.092 0.289
Ever belonged to a group
discriminated against in the country 0 1 0.075 0.263
Experience of working abroad 0 1 0.057 0.231
Victim of crime 0 1 0.191 0.393
Has children 0 1 0.403 0.490
Gender 0 1 0.491 0.500
Belonging to a particular religion 0 1 0.600 0.490
Source: authors’ calculations based on ESS data


