
Audit partner and audit firm rotation and the assessment of internal control deficiencies
Brian C. Fitzgerald
Texas A&M University
Anne M. Thompson*
University of Illinois at Urbana-Champaign
Thomas C. Omer
Texas A&M University
April 26, 2012
Acknowledgments: We appreciate helpful comments and suggestions from Tim Bauer,
Kathleen Bentley, Colleen Boland, Tony Bucaro, Keith Czerny, Brad Lawson, Mark Peecher,
Brad Pomeroy, and Jaime Schmidt. We also thank Ryan Larkin, Will Lauer, and Wenyi Ying for
assistance with data collection.
*corresponding author ([email protected])

Audit partner and audit firm rotation and the assessment of internal control deficiencies
ABSTRACT: This study examines the effects of audit partner and audit firm rotation on the
reporting of internal control deficiencies. Auditor assessment of internal control deficiencies has
potential implications for planned audit test procedures. Further, auditor choices about whether
and how to report these deficiencies have the potential to revise the decision making of their
clients’ stakeholders. Thus, the empirical relation among the reporting of control deficiencies
and attributes of the auditor-client relationship may shed some light on the likely costs and
benefits of audit partner and audit firm rotation. Using a sample of audit reports issued for large
U.S. not-for-profit organizations between 2001 and 2007, we find a significant increase in
material weaknesses, reportable conditions, and audit findings reported in the first year of audit
firm tenure. While we find no significant association between audit partner changes and the
reporting of internal control deficiencies, we do find that partners are more likely to report audit
findings if their tenure exceeds five years. These results are consistent with an audit firm’s
investment in understanding and testing internal controls in their initial year of an engagement
leading to greater reporting of control deficiencies and with longer audit partner tenure leading to
an improvement in audit quality.
Keywords: Audit firm rotation, audit partner rotation, internal control, nonprofit organizations
Data Availability: All data used in this study is publicly available.

1
Audit partner and audit firm rotation and the assessment of internal control deficiencies
I. INTRODUCTION
This study examines the effects of audit partner and audit firm rotation on the reporting
of internal control deficiencies among large U.S. not-for-profit (NFP) organizations. Regulators
and standard setters in the U.S. and other financial markets frequently assert that auditor
independence and audit quality may decline over long auditor-client relationships (AICPA 1978,
GAO 2003, PCAOB 2011, House of Lords 2011, European Commission 2010) and many
countries (including the U.S.) now mandate audit partner rotation for public companies. Prior
research finds mixed evidence on the value of audit partner rotation in improving audit quality in
countries such as Australia and Taiwan (e.g. Carey and Simnett 2006; Chen et al. 2008; Carson
et al. 2012) and research on audit partner tenure and rotation in the U.S. is limited because audit
partner-level data is not generally available for public companies. Research on U.S. and
international public companies suggests lower audit quality in the early versus later years of
audit firm tenure due to less client-specific knowledge and greater reliance on management
representations (e.g. Gul et al. 2007; Myers et al. 2003; Johnson et al. 2002).
Understanding the effects of audit firm and audit partner rotation on the reporting of
internal control deficiencies is important because internal control assessment is an integral
component of the audit risk model, guiding the nature, timing, and extent of planned audit
procedures (SAS No. 47, AICPA 1983). For example, if the lack of client-specific knowledge
leads to over-reliance on a relatively weak control environment, the auditor may fail to detect a
material misstatement early in the tenure of the auditor-client relationship. Alternately, under-
reliance on controls by a new partner or new audit firm may lead to an inefficient audit program
and potentially increase the cost of audit firm and audit partner changes. In addition, the internal

2
control opinion included in the audit report may influence stakeholder decision making about
auditee organizations. Thus, understanding whether or how the detection and reporting of control
deficiencies varies with the auditor-client relationship is fundamental to understanding the costs
and benefits of audit partner and audit firm rotation.
Ex-ante, it is unclear whether or how either audit firm or audit partner rotation will affect
the detection and reporting of internal control deficiencies. Audit firm rotation introduces a
different audit methodology to the client and the additional planning effort in the initial year may
increase the likelihood of detecting internal control deficiencies. Audit firm rotation also brings a
“fresh look” to the client and may result in an increase in reported internal control deficiencies if
differences in professional judgment lead to different characterizations of control exceptions
detected by the predecessor auditor that were not reported in prior years. However, lack of client
familiarity may inhibit a new audit firm from obtaining the same depth of understanding of the
client’s control environment as the predecessor audit firm, which may offset the benefits of audit
firm rotation.
With respect to audit partner rotation, audit partners increase the extent of planned audit
procedures in their initial year on an engagement (Bedard and Johnstone 2010), suggesting that
audit partner rotation may result in improved detection and reporting of internal control
deficiencies. However, these incremental procedures may or may not exceed the benefits of
client-specific knowledge held by veteran audit partners. Also, audit firm methodology,
documentation, and other engagement personnel often are held constant surrounding audit
partner rotations (Bamber and Bamber 2009; Chi et al. 2009). Thus, whether audit firm and audit
partner rotation are associated with added detection and reporting of internal control deficiencies
is an empirical question.

3
We conduct our tests using audit reports issued for large not-for-profit organizations
(NFPs) between 2001 and 2007. In order to support compliance with applicable laws and
regulations and to ensure appropriate administration of federal funds, the federal government
imposes internal control attestation requirements under OMB Section A-133 for audits of federal
award recipients.1 A-133 audit reports issued for NFPs provide an advantageous setting to
examine our research questions for two reasons. First, the identity of both the audit firm and
engagement partner are observable, allowing us to separate the effects of audit firm change and
audit partner rotation. Second, A-133 audit reports disclose not just material weaknesses, but also
less severe internal control deficiencies that typically are not observable for public companies,
including reportable conditions (i.e. significant deficiencies) and audit findings (i.e. exceptions
identified in the controls and substantive testing over major program compliance).
We document a substantial increase in the reporting of material weaknesses, significant
deficiencies, and audit findings in the first year of the audit firm-client relationship. Specifically,
the rates of financial statement reportable conditions and material weaknesses nearly double in
the first year of audit firm tenure when compared to other years. We find little evidence that
audit partners rotating on to a client report internal control deficiencies with greater frequency
than in other years. However, audit partners with more than five years of experience on the same
client are significantly more likely to report audit findings and questioned costs, suggesting that
client-specific knowledge does improve the detection of less severe deficiencies and exceptions
in substantive testing. Finally, we find no decline in reported internal control deficiencies in the
last year of audit firm tenure, suggesting that our results are not attributable to a decline in the
predecessor auditor’ objectivity.
1 Office of Management and Budget (OMB) Circular A-133: Audits of States, Local Governments, and Nonprofit
Organizations (A-133), requires that all charitable organizations expending federal awards over a certain threshold,
currently $500 thousand, must be audited annually. See Section II for additional detail on the A-133 audit process.

4
Our study makes three main contributions. Our results suggest that an audit firm’s
investment in understanding the client’s control environment in the initial year of the
engagement leads to an increase in the reporting of internal control deficiencies. We
acknowledge that our results may be interpreted as suggesting that audit quality is higher in the
initial year of an engagement than in later years, in contrast to studies that document lower audit
quality in the initial year of audit firm tenure (e.g. Johnson et al. 2002; Myers et al. 2003; Gul et
al. 2007; Carcello and Nagy 2004). However, prior literature commonly relies on the auditee’s
accruals quality to assess audit quality over the term of the auditor-client relationship. This study
looks at a directly-observable output of the audit process and thus provides a more direct test of
how the audit process evolves over audit partner and audit firm tenure. Furthermore, because
recent studies link internal control quality to financial reporting quality (Doyle et al. 2007,
Ashbaugh-Skaife et al. 2008), our findings suggest that auditors’ additional investment in
internal control procedures during the initial year of the audit engagement may add value to
clients if the early remediation of detected internal control deficiencies improves financial
reporting quality in later years.
Second, we find no evidence in this setting suggesting that audit partner rotation provides
a “fresh look” resulting in an increase in reported internal control deficiencies similar to increase
documented for audit firm change discussed above. However, the results do support the notion,
at least in our context, that client-specific knowledge appears to improve audit quality.
Specifically, we provide initial evidence from the United States that audit partner tenure in
excess of five years, the limit imposed by the Sarbanes-Oxley Act for public company audits
(U.S. Congress 2002), is associated with greater reporting of audit findings. In addition, we find

5
that Big N audit partners with tenure exceeding five years are more likely to report material
weaknesses.
Finally, we contribute to the longstanding debate in the United States and other countries
concerning policies on audit firm rotation. Currently, no state or federal regulation requires NFP
entities to rotate audit firms, but many U.S. state and local governments require audit firm
rotation (Zeff 2003). However, because many states regulate the governance of NFP
organizations similarly to the regulation of public companies (Iyer and Watkins 2008; Petrovits
et al. 2011), actions taken by the PCAOB concerning auditor rotation may affect the NFP sector.
It is unclear how closely our findings in the NFP sector would generalize to SEC registered
companies or to enterprises in other countries due to differences in the reporting objectives and
client risk. But, similarities in the audit methodology and training of engagement personnel
across public company and NFP engagements suggest that these findings may be useful to
standard setters in evaluating the costs and benefits of audit firm and audit partner rotation in
other sectors of the U.S. and global economies.
This paper proceeds as follows: Section II provides background information and develops
our hypotheses. Section III outlines our research design. Section IV presents the results of our
empirical tests and Section V concludes.
II. BACKGROUND INFORMATION AND HYPOTHESIS DEVELOPMENT
Background Information on the NFP Sector and A-133 Audit Reports
The NFP sector comprises a significant portion of the U.S. economy. NFP organizations
contribute 5% of GDP and employ 10% of the U.S. workforce (IRS 2010; NCCS 2011). The
GAO estimates that at least $235 billion in federal funds reached the NFP sector in 2006 and
NFPs benefitted from $50 billion in foregone federal income tax payments due to the tax

6
advantaged status of the NFP sector (GAO 2009). The growth in the NFP sector has attracted
scrutiny from both the GAO and U.S. Congress because NFPs face fewer regulations than
taxable organizations and there are documented cases of some NFPs exploiting their tax-exempt
status to earn economic rents at the expense of their for-profit counterparts (GAO 2002; GAO
2008b; Grassley 2006; Grassley 2010; Carreyrou and Martinez 2008).
Under the guidelines of the Office of Management and Budget (OMB) Circular A-133:
Audits of States, Local Governments, and Nonprofit Organizations (A-133), all charitable
organizations expending federal awards over a $500 thousand threshold, must be audited
annually. The auditor’s report includes a financial statement audit, an evaluation of the entity’s
internal controls, and an assessment of the organization’s use of federal funds in compliance with
applicable laws and regulations. 2, 3
Donors, granting agencies, and other stakeholders use A-133
audit reports to assess whether the NFP’s funds were used in accordance with the NFP’s stated
mission and donors’ intentions. NFPs face negative financial consequences to non-compliance
(Keating et al. 2005) and donations and government grants decrease after the disclosure of an
internal control problem (Petrovits et al. 2011) or the receipt of a going-concern opinion (Feng
2010).
Although A-133 audit reports provide information to various stakeholders, the quality of
the auditors’ testing to support these opinions has repeatedly been called into question (GAO
2 During an A-133 audit, the auditor must evaluate the nonprofit’s internal controls separately for financial reporting
and for major programs. Section .520 of A-133 provides quantitative and qualitative guidance on which federal
programs are to be classified as major programs for the NFP. The auditor must designate as major programs at least
50 percent of the total federal awards received by the auditee; 25 percent for nonprofits designated as ‘low risk’
(OMB 2007). Refer to the definition of the LOWRISK variable in Appendix A for additional information on the
‘low risk’ designation.
3 A deficiency identified during internal control testing can be a ‘reportable conditions’ or ‘material weaknesses.’
Effective June, 26, 2007, A-133 was revised to redefine a ‘reportable condition’ finding as a ‘significant deficiency.’
A-133 refers to generally accepted auditing standards for the definition of ‘significant deficiency’ and ‘material
weakness’ (OMB 2007). SAS No. 115 aligns the definitions of ‘significant deficiency’ and ‘material weaknesses’
with the definitions included in Auditing Standard No. 5 issued by the PCAOB.

7
2008a; GAO 2002; Ramen and Wilson 1992). In June 2007, the President’s Council on Integrity
and Efficiency (PCIE) issued a report summarizing the findings of the National Single Audit
Sampling Project (PCIE 2007). The study concluded that 35 percent of A-133 audits are of
unacceptable quality. The most commonly identified problems included failure to sufficiently
document or test the NFP’s internal controls, suggesting that internal control deficiencies are
likely under-reported in NFP sector. The federal government places significant reliance on
entities’ internal controls to support compliance and appropriate administration of federal
awards, thus the failure to document and test controls raises concerns about the overall quality of
audits of among NFP entities.
Hypothesis Development
Prior research commonly defines audit quality as the joint probability that the auditor
detects and reports a material misstatement in the client’s financial reporting (DeAngelo 1981).
The auditor’s ability to detect misstatements is influenced by the auditor’s assessment of inherent
risk and the client’s control risk because these factors guide the nature, timing, and extent of
planned audit procedures in the audit risk model (AICPA 1983). Conceptually, a material
misstatement implies a weakness in the control environment (Kinney and McDaniel 1989; López
and Peters 2010; Rice and Weber 2012). This link is supported by audit work paper studies
connecting weaknesses in the control environment to financial reporting misstatements. (See
Eilifsen and Messier 2000 for a review.) In addition, recent evidence from public companies
suggests a negative relationship between financial reporting quality and the likelihood of
disclosing a weakness in internal controls (Doyle et al. 2007; Ashbaugh-Skaife et al. 2008).
Taken together, these studies suggest that the detection and reporting of internal control
deficiencies is an important dimension of audit quality.

8
Our first hypothesis examines the association between audit firm changes and reported
internal control deficiencies. Professional standards require auditors to obtain an understanding
of the client’s internal control environment sufficient to plan the audit (AU 319). The procedures
employed by auditors to obtain this understanding vary with factors including previous
experience with the entity (AU 319 .26). Further, standards governing initial audit engagements
state that “the auditor may need to expand the planning activities because the auditor does not
ordinarily have the previous experience with the entity that is considered when planning
recurring engagements” (AU 311 .26).
Prior research suggests that audit hours are significantly higher in the initial year of the
audit firm-client relationship (Caramanis and Lennox 2008; Deis and Giroux 1996).
Furthermore, Johnstone and Bedard (2001) find no difference in initial-year audit effort for
governmental/NFP audit clients and for other clients. If a new audit firm makes a substantial
audit effort investment to understand a new client’s internal control environment, the audit firm
may identify previously unreported internal control deficiencies in the initial year of the audit
engagement. In this case, we would expect an increase in reported internal control deficiencies
immediately following an audit firm change.
We may also observe an increase in reported internal control deficiencies immediately
following an audit firm change if the predecessor audit team is less likely to report internal
control deficiencies as tenure increases due to the potential loss of auditor objectivity over time.
Experimental research suggests that escalation of commitment is common to situations where the
decision maker has responsibility for prior decisions that are perceived to be irrevocable. During
evidence acquisition, auditors tend pay more attention to information that is consistent with
previous assessments, which may cause auditors to be less likely to detect potential audit issues

9
(Tan 1995). During evidence evaluation, auditors tend to remain committed to their initial
decisions, despite subsequent evidence contrary to their original assessments, which may cause
auditors to be less likely to report potential audit issues (Jeffrey 1992; Brody and Kaplan 1996).
In internal controls testing, a setting that exhibits substantial variation in judgment,4 this bias
may be particularly problematic if the auditor identifies a new deficiency in a process unchanged
from the prior year because the identification of the new deficiency calls into question the quality
of the prior-year’s internal control testing. For these reasons, escalation of commitment by the
predecessor auditors also suggests that audit firms may be more likely to report internal control
deficiencies in the initial year of audit firm tenure.
However, the new audit firm may be at an informational disadvantage due to less client-
specific knowledge, forcing auditors to place greater reliance on estimates and representations
made by the client.5 Prior research examining U.S. for-profit companies document lower audit
quality in the initial years of audit firm tenure, followed by an improvement in audit quality in
later years (Johnson et al. 2002; Geiger and Raghunandan 2002; Myers et al. 2003; Carcello and
Nagy 2004). These studies suggest that audit teams gain client-specific knowledge that enables
them to better identify their clients’ unique financial reporting risks and objectively evaluate
their clients’ accounting choices. Consistent with this explanation, Gul et al. (2007) document
that accruals quality is lower in the early years of audit firm tenure among clients of non-industry
specialists, when compared to accruals quality among clients of industry specialists. In addition,
Srinidhi et al. (2010) report that accruals quality increases with long audit firm tenure only for
4 Trotman and Wood’s (1991) meta-analysis of internal control judgments reports a mean correlation of 0.629
between internal control judgments and the studies’ independent variables of interest, which suggests that substantial
variation remains unexplained by the studies’ proposed moderating relationships. 5 Palmrose (1991) concludes that audit firms have a higher chance of litigation for negligent audits during the early
years of the professional engagement period.

10
clients that require a high degree of client-specific knowledge. If an NFP’s auditor requires a
high degree of client-specific knowledge to effectively evaluate the NFP’s internal control
environment, we expect audit teams to be better able to identify internal control deficiencies as
audit tenure increases. In this case, we would expect lower likelihoods of reported internal
control deficiencies in the initial years of the audit firm-client relationship.
Because it is unclear whether the additional procedures performed in the initial year of
the audit engagement will offset the lack of client-specific knowledge and whether escalation of
commitment effects the predecessor audit team members’ evaluation of internal controls, we
state our first hypothesis in the null form:
H1: Audit firms are no more likely to report internal control deficiencies in the initial
year of audit firm tenure.
Our second and third hypotheses examine whether audit partner rotation and tenure are
associated with reported internal control deficiencies. Regulators in the U.S. and other countries
argue that audit partners develop relationships with their clients over time that may compromise
auditor independence and impair audit quality. Thus, audit partner rotation should bring a “fresh
look” to the engagement. Using proprietary data from a large accounting firm, Bedard and
Johnstone (2010) report that planned audit effort increases following audit partner rotation,
suggesting that new audit partners invest in gaining client-specific knowledge in their first year
on engagements. If the expanded procedures performed by new audit partners provide a new
assessment of the client, we expect that the likelihood of an internal control deficiency disclosure
to increase in the year of audit partner rotation.
However, audit partner rotation may not increase the likelihood of reporting internal
control deficiencies. U.S. audit partners report that at least two years of client-specific experience
is necessary to gain familiarity with a client (Daughtery et al. 2012), suggesting that rotation may
11
not immediately improve audit quality. In addition, much of the client-specific knowledge is
retained through reference to the prior-year work papers and in the established audit
methodology. Further, many members of the audit team are not required to rotate periodically.
Thus the new audit partner may not bring a truly “fresh look” to the engagement, which may
limit the improvement in independence and audit quality related to audit partner rotation
because, although new audit partners are potentially more independent than rotated partners, they
may rely heavily on existing staff and work papers, which may keep the likelihood of reporting
internal control deficiencies unchanged (Bamber and Bamber 2009; Chi et al. 2009). Finally,
Carson et al. (2012) find that, although audit quality is higher in the two years following both
audit partner and audit firm changes in Australia, the effect of audit firm change dominates the
effect of audit partner rotation. Because the evidence on the effectiveness of audit partner
rotation is inconclusive, we state our second hypothesis in the null form:
H2: Audit partners are no more likely to report internal control deficiencies in the initial
year of audit partner tenure on a continuing client.
Our third hypothesis examines the association between audit partner tenure and the
reporting of internal control deficiencies. As discussed previously, regulators argue that audit
partner objectivity may decline over time. However, because independence is critical to the value
of attest services, audit partners have strong incentives to maintain their professional skepticism
(POB 2000). As such, any potential benefit to the audit partner derived from an impairment of
judgment may be negated by the potential cost to one’s professional reputation (DeAngelo
1981). Because audit partners with longer client relationships amass greater reputational capital
through successive audits, opponents of auditor rotation suggest that reputation protection likely
mitigates any reduction in independence that might occur over time. However, as discussed in

12
the motivation of H1, cognitive biases may limit the audit partner’s ability to detect and report an
internal control weakness as audit partner tenure increases. Prior research in non-U.S.
jurisdictions yields mixed evidence on the association between audit partner tenure and audit
quality. Although evidence from Australia suggests that audit quality declines with audit partner
tenure (Carey and Simnett 2006; Ye et al. 2011; Carson et al. 2012), studies from other countries
suggest either no association between audit partner tenure and audit quality (e.g. Knechel and
Vanstraelen 2007) or an improvement in audit quality as audit partner tenure increases (e.g. Chen
et al. 2010). For U.S. for-profit companies, Gul et al. (2009) and Lim and Tan (2010) suggest
that longer audit firm tenure is associated with higher accruals quality for companies audited by
specialist audit firms, who also have higher levels of reputational capital to protect. Because it is
unclear whether reputation protection concerns, as evidenced by U.S. research at the audit firm
level, sufficiently mitigates the potential loss of independence over time, we state our third
hypothesis in the null form:
H3: Audit partners are no more likely to report internal control deficiencies on clients
with longer partner tenure.
III. RESEARCH DESIGN
Sample Selection
To construct our sample, we begin by identifying NFP entities with available data in both
the Federal Audit Clearinghouse database of OMB Section A-133 audit reports and the IRS
Statement of Income (SOI) files maintained by the National Center for Charitable Statistics
(NCCS). The SOI files include financial statement and organizational data on nonprofit entities
from IRS Form 990 informational tax returns. The SOI files are compiled annually and include
data from large NFPs (total assets exceeding $30 million) and a stratified random sample of

13
smaller NFP organizations.6 The A-133 database includes financial statement auditor and audit
opinion information for nonprofits expending a minimum threshold of federal awards during the
year.7
Our sample period spans the 2000 through 2007 tax years. The IRS made significant
changes to the Form 990 for the 2000 and 2008 filing years, thus the information reported on the
Form 990 is more comparable between 2000 and 2007 than in the years prior to 2000 or in 2008
(Feng et al. 2011).8 In addition, 1997 is the earliest year in the A-133 database, therefore
beginning the sample earlier than 2000 would limit our ability to measure audit partner tenure for
observations in our sample. We exclude NFP entities missing three or more years of data in both
files during our sample period because we cannot reliably measure audit firm and partner
changes for observations missing multiple years of data in the A-133 database. In addition,
entities missing multiple years may not consistently expend the minimum threshold of federal
funds to require an A-133 audit, or they may have severe difficulties meeting these compliance
requirements. Finally, the control and compliance environments may differ systematically
6 Our sample size is smaller than studies that use the IRS Core files (e.g. Petrovits et al. 2011; Tate 2007). The IRS
Core files contain a limited number of financial statement variables (approximately 150 data items total) for a large
number of organizations. In contrast, the SOI files include more than 400 data items during our sample years for
large NFPs and a stratified random sample of smaller NFP organizations. Accordingly, the differences in sample
composition between our study and other studies are in the proportion of smaller NFP organizations. Our interest
lies in the larger organizations because we expect greater complexity and stronger internal control environments
among these organizations. Consistent with this expectation, 98.6% of A-133 audits in the SOI files received
unqualified financial statement audit opinions compared to 90.1% of other audits. For financial statement reportable
conditions (material weaknesses), the differences are 15.6% (5.1%) for observations with SOI file data versus 24.4%
(10.9%) for other observations. The proportion of going concern report modifications is the same in both samples
(0.08%).
7 During our sample period, the minimum threshold was $300,000 in annual federal expenditures prior to 2004 and
$500,000 in annual federal expenditures in 2004 onward.
8 2008 was the last available year at the time we collected our data in September 2011 because SOI files are
released, on average, three years after the filing year has ended. Our inferences are unchanged when including 2008
in the sample.

14
between NFPs with and without annual A-133 audits due to differences in federal expenditures
and inconsistency in applying the Single Audit Act compliance requirements.
The SOI files contain 192,241 NFP observations from 2000-2007. Of these, 22,936
observations include auditor and audit opinion information in the A-133 database. We eliminate
3,809 observations for entities missing three or more years of data in both files, and exclude 236
observations due to missing or incorrect audit partner information. Our selection model requires
two consecutive years of data; therefore we exclude year 2000 observations from our main
analysis, and eliminate 1,140 observations due to missing consecutive years of data during the
sample period. Our final sample consists of 15,664 observations with tax return filing years
2001-2007. These sample selection procedures are outlined in Table 1.
[INSERT TABLE 1 HERE]
Measuring Audit Firm and Audit Partner Changes
We identify audit firm and audit partner changes by examining consecutive years of audit
reports in the A-133 database. We classify a NFP organization as changing audit firms if the
financial statement auditor in year t is not the same as the auditor in year t-1 (CHANGEFIRM).
We review all audit firm changes by hand and reclassify CHANGEFIRM to equal zero if the
change in auditor name is due to a firm name change or merger of two public accounting firms.
We identify the audit partner as the individual listed in the field CPACONTACT. As
discussed previously, we exclude observations if the field CPATTITLE indicates that the contact
holds a position other than partner or equivalent position in their firm.9 We classify an NFP as
changing audit partners in year t when CHANGEFIRM equals zero and the audit partner in year t
9 We consider positions such as “owner,” “shareholder,” “managing director,” “principal,” “vice-president,”
“proprietor,” or any position that includes the word partner as a partner-equivalent position. We exclude
observations where the CPATITLE field indicates senior manager, senior associate, audit manager, or staff. We also
exclude A-133 audit reports issued by the Defense Contract Audit Agency because the financial statement audit firm
and partner information is not observable for these NFPs.

15
is not the same as in year t-1 (CHANGEPARTNER).10
We calculate audit partner tenure as the
number of years the partner has been listed as the signing partner in the A-133 database as of
year t and classify partners as having short (1-2 years), medium (3-5 years), or long (6 or more
years, LONGTENURE) of tenure on the client as of year t.11
Multivariate Model
We estimate the following model of the joint detection and reporting of internal control
deficiencies in the auditor’s report:
Control Deficiency is a variable equal to one if the auditor reports one of the following
conditions: financial statement reportable condition (FS_RC) or material weakness (FS_MW), a
major program reportable condition (MP_RC) or material weakness (MP_MC), or an audit
finding or questioned cost (FINDORQ), and equal to zero otherwise.12
Our primary independent variables are CHANGEFIRM, CHANGEPARTNER, and
LONGTENURE as defined previously. We follow Petrovits et al. (2011) in controlling for
10
We observe 57 cases of clients following an audit partner to a new public accounting firm. 24 of these cases are
due to Andersen clients following a partner to a new audit firm between 2001 and 2002. We treat these observations
as firm changes because of differences in the audit methodology and quality control procedures between the
predecessor and successor firm. Excluding these observations from our sample has no effect on our inferences.
11
The earliest year of data in the A-133 database is 1997. Therefore, we cannot observe or measure audit firm
tenure prior to an audit firm change. Per discussion with practitioners, many firms maintain policies of audit partner
rotation after 7 years for non-SEC clients, therefore examining observations in 2003 onward may provide clearer
inferences concerning the role of longer partner tenure on internal control deficiency identification and reporting.
Our inferences are the same examining only 2003 onward.
12
We cannot determine the number or nature of control deficiencies reported from the A-133 database because the
Data Collection Form submitted to the Census department does not include these fields.

16
determinants of internal control weaknesses in NFP organizations:13
COMPLEXITY equals the
number of revenue sources listed on Form 990 (public support, government contributions,
program revenue). SURPLUS equals one if the client reported revenues in excess of expenses
during year t and equals zero otherwise. GCAR equals one if the prior-year audit report included
a going concern modification and equals zero otherwise. ASSETSIZE equals the natural log of
total assets reported at the end of year t and GROWTH equals the growth rate in total assets over
the prior year (Line 59 Column B divided by Line 59 Column A). LOWRISK equals one if the
client qualifies as low risk under Section .530 of the Single Audit Act. NFPs do not qualify for
low risk status if the auditor reported a material weakness or a finding or questioned cost in the
prior year.14
We control for audit firm size with indicator variables equal to one if the audit firm is a
Big N firm (BIGN), a second tier firm, or a NFP industry specialist. We define a second tier firm
(SECTIER) as one of the largest 30 public accounting firms other than the Big 4 per the Public
Accounting Report in 2007, the last year of our sample. We define a NFP industry specialist as a
public accounting firm other than a BIGN or SECTIER firm that performed at least 50 audits in
our sample (SPECIALIST). Finally, we determine whether the audit firms in our sample are
registered with the PCAOB per Audit Analytics and review of the PCAOB website listing of
registered firms as of September 2011. We include an indicator variable OTHERPCAOB equal to
one if the public accounting firm is registered with the PCAOB but not otherwise categorized as
a BIGN, SECTIER, or SPECIALIST firm.
13
We exclude one variable from the Petrovits et al. (2011) model. Their model includes NEWGRANTEE, an
indicator variable equal to one in the first year an organization expends federal funds. We exclude all first-time A-
133 audits from our sample because we cannot observe changes in audit firms or audit partners for new grantees
Therefore, NEWGRANTEE equals zero for all observations in our sample by construction.
14
Refer to Appendix A for further criteria on the LOWRISK designation.

17
We augment the Petrovits et al. (2011) model for audit-specific factors that may influence
the audit firm’s detection and reporting of internal control deficiencies. Because audit resources
expended (audit hours and staffing mix) may affect the detection and reporting of internal control
deficiencies, we include fees paid for outside accounting services as a proxy for audit fees.15
LNACCTFEES equals the natural log of total accounting fees paid in year t (line 31, column A).
We include LAGPROBLEM because the prior-year audit report is available to the audit firm and
the existence of internal control deficiencies or a modified opinion in the prior year may
influence planned audit procedures in the current year. LAGPROBLEM is equal to the sum of the
number of problems reported in the prior year including financial statement or major program
reportable conditions or material weaknesses, going concern audit reports, audit opinion
qualifications, material non-compliance findings, and questioned costs (Tate 2007).
NFPs issuing tax-exempt debt may pose greater litigation risk to the audit firm, and these
NFPs may be subject to greater monitoring or compliance requirements from bondholders and
external financing authorities. Therefore, we control for leverage at the end of year t
(LEVERAGE, Line 64a, Column B divided by Line 59, Column B). Next, we control for the
number of employees because low headcount may constrain NFPs’ abilities to effectively
segregate duties and implement manual control procedures. LNEMPLOYEES equals the natural
log of the number of employees paid greater than $30,000 during the year that are not among the
five highest paid employees (Schedule A, Part 1). Finally, we include an indicator variable equal
to one if the NFP engaged in lobbying activities during the year (LOBBY, Schedule A line 37b).
We include indicator variables for year and industry and cluster standard errors by entity
15
Auditor litigation risk for NFP organizations is low. Accordingly, we expect that the risk premium component of
audit fees for NFPs is low.

18
identifier (EIN). Finally, we winsorize all continuous variables at 1 and 99 percent to reduce the
influence of outliers.
Selection Bias
Because prior research suggests that public companies are more likely to change auditors
following an adverse internal control opinion (Zhang et al. 2007; Ettredge et al. 2011), the
decision to terminate the auditor-client relationship likely does not arise randomly in our sample.
We control for possible selection bias arising from auditor changes using the Heckman
maximum likelihood estimation method (Heckman 1979). We follow Tate (2007) and estimate
the following model:
Where auditor changes among NFP organizations (CHANGEFIRM) is modeled as a function of
the absolute value change from year t-1 to year t in total contributions (ABSCONCHG),
government funding (ABSGOVCHG), management and general expenses (ABSMGCHG),
fundraising expenses (ABSFRCHG), federal expenditures (ABSFEEXPCHG), total liabilities
(ABSLIABCHG), leverage (ABSDACHG), and executive compensation (ABSCOMPCHG). In
addition, the Tate (2007) model includes the natural log of total revenues in year t (LNREV), the
change in revenue from year t-1 to year t (REVCHG), and an indicator variable equal to one if
total accounting fees declined from year t-1 to year t (NEGACCHG).
We also include an indicator variable equal to one if the predecessor auditor was a Big N
auditor (LAGBIGN) an indicator variable equal to one if the predecessor auditor was Arthur

19
Andersen (LAGANDERSEN), and the auditor’s client base, calculated as the natural log of the
number of audit opinions issued during the year by the audit firm (CLIENTBASE). We include
all control variables from the second stage model discussed previously, as well as indicator
variables for year, state, and industry. The discriminatory power of the model is acceptable
(ROC = 0.786). Finally, we perform multi-collinearity diagnostics for all second stage models
and confirm the stability of the coefficient estimates (Belsley et al. 1980).
IV. EMPIRICAL RESULTS
Descriptive statistics
Table 2 presents descriptive and univariate statistics for internal control deficiencies and
for audit finding and questioned costs (collectively referred to as audit findings). Table 2, Panel
A presents reported internal control deficiencies and audit findings for clients in the year of an
audit firm change, an audit partner change, and no change of firm or partner. We identify no
differences in either reportable conditions or material weaknesses between NFPs changing audit
partners since the prior year and NFPs with no changes during the year. NFPs changing audit
firms report internal control deficiencies at significantly higher rates than NFPs changing only
audit partners. Twenty five percent of NFPs changing audit firms report a financial statement
reportable condition as compared to 14 percent of NFPs with an audit partner rotation (p<0.01).
The rates of financial statement and major program material weaknesses among NFPs changing
audit firms (9 and 6 percent respectively) are double the rates of material weaknesses among
NFPs with a new audit partner (4 and 3percent respectively, both p<0.01).
We find higher rates of findings or questioned costs when NFP clients experience a
partner change (28 versus 24 percent, p<0.01) and higher rates of findings and questioned costs
among NFP clients with a new audit firm than a new audit partner (33 versus 28 percent,

20
p<0.01). The increase in reported audit findings and questioned costs following an audit partner
change are consistent with audit partners increasing planned audit procedures in their first year
on a continuing client (Bedard and Johnstone 2010). However, our findings suggest that this
increase in planned audit procedures does not result in an increase in detection and reporting of
more severe internal control deficiencies.
[INSERT TABLE 2 HERE]
Table 2, Panel B presents reported internal control deficiencies and audit findings by
audit partner tenure and audit firm size. Generally, the percentage of audit reports with internal
control deficiencies and audit findings is higher among audits with short firm or partner tenure,
consistent with the findings in Panel A. Among Big N NFP clients, the rates of internal control
deficiencies are similar across short, medium, and long audit partner tenure, although Big N
auditors report findings and questioned costs more frequently among NFPs with long partner
tenure (40 percent of long partner tenure NFPs, 35 percent of short and medium partner tenure
NFPs). In addition, Big N auditors report financial statement reportable conditions and material
weaknesses less frequently than other auditors, consistent with these NFPs maintaining stronger
internal control over financial reporting. PCAOB registered audit firms report internal control
deficiencies and audit findings more frequently than non-PCAOB registered firms, however the
rate of material weakness disclosures are comparable between PCAOB and non-PCAOB
registered audit firms. We expect that clients of non-PCAOB registered audit firms are smaller
and maintain weaker internal control environments; therefore the results suggest lower audit
quality among non-PCAOB registered auditors.
Table 2, Panel C presents the rates of internal control deficiencies in the three years
surrounding audit firm and audit partner changes. Figures 1 and 2 present these findings

21
graphically. The percentage of audit reports disclosing reportable conditions and material
weaknesses is higher in the year of an audit firm change than in the prior year or subsequent
year. Twenty four percent of audit reports disclose a financial statement reportable condition in
the year of an audit firm change, compared to 13 percent in the year prior to the change and 18
percent in the year following the change. We identify a similar pattern for financial statement
material weaknesses, for major program reportable conditions and material weaknesses, and for
audit findings. We identify no changes in reportable conditions or material weaknesses
surrounding audit partner changes, although reported findings and questioned costs are more
frequent in the year of an audit partner change than the surrounding years (29 percent in the year
of change versus 26 percent in the prior and subsequent years). These descriptive statistics
suggest that the increase in reported internal control deficiencies surrounding audit firm changes
observed in Table 2, Panel A reflects a one-time reporting difference, as the rates of reported
internal control deficiencies are comparable in years t-1 and t+1. Finally, Table 2, Panel D
tabulates the observed frequency of audit firm changes within the same audit firm size tier versus
dropping down or moving up in the audit firm tier.
Table 3 presents descriptive statistics for the variables used in the multivariate regression
analysis. Table 3, Panel A presents descriptive statistics for the main regression model. The
primary variables of interest are consistent with those reported in Table 2, Panel A. Six percent
of observations changed audit firms since the prior year, 12.7 percent changed audit partners
since the prior year, and 27 percent of observations are characterized by long audit partner tenure
(greater than five years). The mean (median) client in our sample reports $246 ($59.9) million in
total assets and employs 1,166 (333) employees earning greater than $30,000 per year. Table 3,
Panel B presents descriptive statistics for the selection model.

22
[INSERT TABLE 3 HERE]
Multivariate Results
Table 4 presents probit regression coefficient estimates for the audit firm change
selection model. The discriminatory ability of the model is adequate (ROC=0.786, Pseudo R-
Square=0.243). The inferences for this model are generally consistent with Tate (2007) even
though our sample is estimated using a different time period (2001-2007 versus 1997-2003) and
excluding smaller entities because of the differences in the SOI versus CORE files.
[INSERT TABLE 4 HERE]
Table 5 presents coefficient estimates for our logistic regression models examining the
association between audit firm and audit partner changes on reported control deficiencies and
audit findings. Across all five dependent variables, the coefficient for CHANGEFIRM is positive
and significant at p<0.05, indicating that changing audit firms is associated with higher odds of
reported internal control deficiencies and audit findings. The coefficients for
CHANGEPARTNER are not significant in any of these models. The coefficient for
LONGTENURE is positive and significant when the dependent variable equals FINDORQ
(p<0.01), suggesting that greater familiarity with the NFP increases the likelihood of reporting
audit findings and questioned costs. The discriminatory power of these models range from
adequate (ROC between 0.70 and 0.80) to excellent (ROC between 0.80 and 0.90) and confirm
model fit using goodness of fit test statistics.
[INSERT TABLE 5 HERE]
Table 6 presents coefficient estimates by audit firm size. Table 6, Panel A, presents
coefficient estimates for CHANGEFIRM, CHANGEPARTNER, and LONGTENURE when the
dependent variable equals FS_RC. The coefficient for CHANGEFIRM is positive and significant
for Big N, second tier, and specialist audit firms at p<0.01 and for other PCAOB registered firms

23
at p<0.10. The coefficients for CHANGEFIRM are not significant for other non-PCAOB
registered audit firms. Table 6, Panel B presents similar findings with FS_MW as the dependent
variable. In addition, the coefficient on LONGTENURE is positive and significant for Big N
clients, suggesting that longer relationships between the client and engagement partner are
associated with higher odds of reporting a material weakness. Because NFP client familiarity
may be low in the initial year of the engagement, these findings suggest that larger audit firms
are better able to overcome the lack of client-specific knowledge in evaluating their clients’
internal control environments.
[INSERT TABLE 6 HERE]
Table 7 presents our analysis partitioning CHANGEFIRM by changes in audit firm size
tier. This analysis provides evidence on the role of changes in audit firm size on internal control
deficiency detection and reporting.16
We separate audit firm changes into changes within audit
firm size tier (CHANGEWITHIN), changes from a larger to smaller audit firm size tier
(DROPDOWN) and changes from a smaller to larger audit firm size tier (MOVEUP). For
purposes of this analysis, audit firm size is ranked from largest to smallest as BIGN, SECTIER,
SPECIALIST, OTHERPCAOB, and other audit firms not registered with the PCAOB.17
We find
positive and significant coefficients on CHANGEWITHIN and MOVEUP for all 5 models,
however these results are driven by Big N and second tier audit firms and generally we do not
find significant coefficients for SPECIALIST and other audit firms (untabulated). Next, we find
16
Our selection model includes controls for auditor selectivity in terminating the auditor-client relationship. We
note that, although auditor selectivity for publicly traded companies was high during some years of our sample (due
to audit demand constraints imposed by implementation of the internal controls attestation requirements of the
Sarbanes-Oxley Act of 2002), NFP clients pose significantly lower litigation risk to an audit firm. Also, these clients
generally do not report as of December 31 and, therefore, are useful to the auditor for increasing utilization during
periods characterized by lower billable hours. Our conversations with practitioners confirm these expectations
regarding the frequency of audit firm changes due to selectivity among NFP clients during our sample period.
17
We recognize that many specialist audit firms are not PCOAB registrants.

24
that, among SPECIALIST audit firms, the coefficient on DROPDOWN is negative and significant
(p<0.05) for FS_MW, MP_RC, and MP_MW, indicating that these audit firms are significantly
less likely to detect and report these types of severe internal control deficiencies for new NFP
clients that were previously audited by larger audit firms. Finally, the inferences for
CHANGEPARTNER and LONGTENURE are consistent with our prior analysis.
[INSERT TABLE 7 HERE]
Overall, these findings consistently indicate that audit firms are significantly more likely
to detect and report severe internal control deficiencies for new NFP clients, and that this result
is strongest among Big N and second tier audit firms. We also observe that audit firms are more
likely to report audit findings and questioned costs when audit partner tenure is greater than five
years, suggesting that, among NFP clients, the acquisition of client-specific knowledge may
improve the detection and reporting of audit findings.
Supplemental Analysis
As discussed previously, new audit firms may be more likely to report internal control
deficiencies in the initial year if the predecessor auditor either did not detect existing internal
control deficiencies or assessed known internal control deficiencies to be less severe than the
successor auditor. In addition, it is possible new audit partners may not provide a “fresh look” if
the practitioner has previous experience with the client. Table 8 presents additional analysis to
examine these two possibilities. First, we determine whether the audit partner has prior client
knowledge by examining whether a partner rotating onto the client signed an audit opinion for
the same NFP client in the eight previous years.18
We separate CHANGEPARTNER into two
variables – CHANGEPARTER_EXP to denote prior experience with the client and
18
We do not identity any audit partners rotating back onto a client with a lag greater than eight years although our
ability to observe audit partner identity is limited to the years since 1997.
25
CHANGEPARTNER_NOEXP to denote no prior experience with the client. We then examine the
effect of prior client knowledge on the joint detection and reporting of FS_RC, FS_MW, and
FINDORQ. In Table 8, Panel A, the coefficient for CHANGEPARTNER_EXP is positive and
significant (p<0.05) when the dependent variable is FS_RC, indicating that audit partners
rotating back onto a client are significantly more likely to report a reportable condition.
However, audit partners rotating back onto a client are no more likely to report financial
statement material weaknesses, findings or questioned cost, or major program control
deficiencies. Finally, the coefficient on CHANGEPARTNER_NOEXP is not significant in any of
these models.
[INSERT TABLE 8 HERE]
To examine whether the increase in reported internal control deficiencies in the year of an
auditor change is due to under-reporting of internal control deficiencies by the predecessor
auditor, we include indicator variables equal to one for the last year of an audit firm engagement
(LAST FIRM YEAR), the audit partner’s last year where the audit firm is continuing as the
auditor (LAST PARTNER YEAR), and indicator variables equal to one for the audit partner’s
second and third years following an audit partner change on a continuing client
(PARTNERTENURE=2 and PARTNERTENURE=3).
Table 8, Panel B presents these results for all firms in the sample and Table 8, Panel C
presents results only for Big N and second tier audit firms. We find positive and significant
coefficients on LAST FIRM YEAR for both FS_RC and FS_MW as dependent variables (p<0.01
in both panels). Consistent with our prior results, the coefficient on CHANGEFIRM remains
positive and significant (p<0.01) in all models. These results indicate that audit firms are

26
significantly more likely to report reportable conditions and material weaknesses in both the last
year of an engagement and first year of a new engagement.
When we examine the likelihood of internal control deficiency disclosure in the year
preceding audit partner change, the coefficient on LAST PARTNER YEAR is also positive and
significant for FS_RC in both panels (p<0.05) and the coefficient on FS_MW is positive and
significant among Big N and second tier audit firms (p<0.10). These results suggest that audit
partners are more likely to report internal control deficiencies in the last year on an engagement.
We also find a positive and significant coefficient on PARTNERTENURE=2 (p<0.05) for
reportable conditions, indicating that audit partners in their second year on an engagement are
more likely to report reportable conditions. Finally, consistent with Table 6, we find that
LONGTENURE is positively associated with reporting a financial statement material weakness
among Big N clients. Overall, these results suggest that both audit firms and audit partners in
their last year on the engagement are significantly more likely to report internal control
deficiencies, consistent with audit arguments that auditors protect their reputations in the later
years of an engagement. These results also suggest that the increase in reported internal control
deficiencies following an audit firm change is more likely due to the application of new audit
methodology and planning procedures than due to under-reporting of internal control
deficiencies by the predecessor auditor.
Robustness Tests
In untabulated analysis, we examine the role of audit partner tenure in the detection and
reporting of internal control deficiencies only among clients that did not change auditors since
the prior year. Again, the coefficients on CHANGEPARTNER and LONGTENURE are not
significant for internal control deficiencies and the coefficient for LONGTENURE is positive and
significant for FINDORQ. In addition, we control for prior-year audit partner tenure surrounding

27
audit firm or partner changes and alternatively interact lagged partner tenure with
CHANGEFIRM and CHANGEPARTNER. We find no association between prior period audit
partner tenure and the detection and reporting of internal control deficiencies in the year of an
audit firm or audit partner change. We control for former Andersen partners and re-perform our
analysis excluding former Andersen partners and Andersen NFP clients and find no changes in
inferences.
We estimate our regressions on an annual cross-sectional basis to determine if our results
are driven by specific years and to examine whether passage of the Sarbanes-Oxley Act and
implementation of Auditing Standard 2 influenced internal control detection and reporting
among NFP clients. The coefficient for CHANGEFIRM is positive and significant in every year
when material weaknesses are the dependent variable (FS_MW and MP_MW) and is positive and
significant when reportable conditions are the dependent variable (FS_RC and MP_RC) in every
year except 2002. CHANGEPARTNER is not significant in any of the four models in any year.
These results suggest that our findings are not driven by specific years, or regulatory changes to
public accounting firms and SEC registered firms during our sample period.
Finally, we re-estimate our models using “first time” internal control deficiencies to rule
out the influence of internal control deficiencies reported in prior years. We define a “first time”
internal control deficiency as a reportable condition, material weakness or finding reported in
year t only if no internal control deficiencies or modified audit opinions were reported the prior
two years. Our inferences from Tables 5-8 are consistent when we substitute “first time” internal
control deficiencies as our dependent variables. These results support our conclusions that the
increase in internal control deficiencies surrounding audit firm changes are due to the application

28
of new audit methodology and enhanced audit planning procedures in the initial year of the audit
engagement.
V. CONCLUSION
This study examines the effects of audit firm and audit partner rotation on the reporting
of internal control deficiencies. Auditor assessment of internal control deficiencies has potential
implications for planned audit test procedures and auditor choices about whether and how to
report these deficiencies can influence the decision making of the clients stakeholders. Thus, the
empirical relation among the reporting of internal control deficiencies and attributes of the
auditor-client relationship may shed some light on the likely costs and benefits of audit partner
and audit firm rotation.
Using a sample of audit reports issued for large U.S. not-for-profit organizations between
2001 and 2007, we find a significant increase in material weaknesses, reportable conditions, and
audit findings reported in the first year following an audit firm change. We find no association
between audit partner changes and the detection and reporting of internal control deficiencies.
However, partners with tenure exceeding five years are more likely to report audit findings.
These results suggest that an audit firm’s investment in understanding and testing internal
controls in the initial year of the engagement leads to greater reporting of internal control
deficiencies. We also find that longer audit partner tenure may improve audit quality. We
provide initial evidence from the United States on the association between audit partner tenure
and rotation on the reporting of internal control deficiencies, a measure of auditor independence
and a dimension of audit quality. In addition, our results may be useful to regulators in
evaluating the costs and benefits of audit firm and audit partner rotation. Finally, our results

29
should interest state and federal agencies when evaluating policies to improve audit quality in
NFP sector.
Our study is subject to two primary limitations. First, as discussed earlier, it is unclear
how closely findings from NFP sector clients generalize to SEC registered clients or clients
located in other countries. Therefore, further research is needed before drawing policy
conclusions from this study. Second, we cannot observe the nature of the internal control
deficiencies as is possible with public companies. For this reason, we cannot examine the
remediation of control weaknesses, nor can we perform tests distinguishing between account
level versus entity level internal control deficiencies or internal control deficiencies detected by
management versus the auditor. These and other questions provide opportunities for future
research.

30
REFERENCES
American Institute of Certified Public Accountants (AICPA). 1978. The Commission on
Auditors’ Responsibilities: Report, Conclusions, and Recommendations. New York:
AICPA.
American Institute of Certified Public Accountants (AIPCA). 1983. Statement on Auditing
Standards No. 47: Audit risk and materiality in conducting an audit. New York: AIPCA.
Ashbaugh-Skaife, H., D. Collins, and W. Kinney. and R. LaFond. 2008. The effect of SOX
internal control deficiencies and their remediation on accrual quality. The Accounting
Review 83 (1): 217–250.
Bamber, E. M., and L. S. Bamber. 2009. Discussion of "Mandatory audit partner rotation, audit
quality, and market perception: Evidence from Taiwan". Contemporary Accounting
Research 26 (2): 393-402.
Bedard, J. C., and K. M. Johnstone. 2010. Audit partner tenure and audit planning and pricing.
Auditing: A Journal of Practice & Theory 29 (2): 45-70.
Belsley, D.A., E. Kuh, and R.E. Welsch, 1980. Regression Diagnostics: Identifying Influential
Data and Sources of Collinearity. New York: John Wiley and Sons Inc.
Brody, R. G., and S. E. Kaplan. 1996. Escalation of commitment among internal auditors.
Auditing: A Journal of Practice & Theory 15 (1): 1–15.
Caramanis, C., and C. Lennox. 2008 Audit effort and earnings management. Journal of
Accounting and Economics 45(1): 116-138.
Carcello, J. V., and A. L. Nagy. 2004. Audit firm tenure and fraudulent financial reporting.
Auditing: A Journal of Practice & Theory 23 (2): 55-60.
Carey, P., and R. Simnett. 2006. Audit partner tenure and audit quality. The Accounting Review
81 (3): 653-676.
Carreyrou, J. and B. Martinez. 2008. Grassley targets nonprofit hospitals on charity care. The
Wall Street Journal (December 18).
Carson, E., A. Luc, and L. Wong. 2012. Disentangling the effects of audit partner tenure and
audit firm tenure on audit quality. Working paper, University of New South Wales.
Chen, C-Y., C-J. Lin, and Y-C. Lin. 2008. Auditor partner tenure, audit firm tenure, and
discretionary accruals: Does long auditor tenure impair earnings quality? Contemporary
Accounting Research 25 (2): 415-446.
Chen, S., S. Sun, and D. Wu. 2010. Client importance, institutional improvements, and audit
quality in China: An office and individual auditor level analysis. The Accounting Review
85 (1): 127-158.
31
Chi, W., H. Huang, Y. Liao, and H. Xie. 2009. Mandatory audit partner rotation, audit quality,
and market perception: Evidence from Taiwan. Contemporary Accounting Research 26
(2): 329-358.
Daugherty, B., D. Dickens, R. Hatfield, and J. Higgs. 2012. An examination of partner
perceptions of partner rotation: Direct and indirect consequences to audit quality.
Auditing: A Journal of Practice & Theory 31(1): 97-114.
DeAngelo, L. 1981. Auditor size and audit quality. Journal of Accounting and Economics 3 (3):
183-199.
Deis, D., and G. Giroux. 1996. The effect of auditor changes on audit fees, audit hours, and audit
quality. Journal of Accounting and Public Policy 15(1): 55-76.
Doyle, J., W. Ge, and S. McVay. 2007. Accruals quality and internal control over financial
reporting. The Accounting Review 82 (5): 1141–1170.
Eilifsen, A., and W. F. Messier. 2000. Auditor detection of misstatements: A review and
integration of empirical research. Journal of Accounting Literature 19: 1-43.
Ettredge, M., J. Heintz, C. Li, and S. Scholz. 2011. Auditor realignments accompanying
implementation of SOX 404 ICFR reporting requirements. Accounting Horizons 25(1):
17-39.
European Commission. 2010. Audit Policy: Lessons from the Crisis. Green Paper. Brussels:
European Commission.
Feng, N. C., Q. Ling, D. Neely, and A. A. Roberts. 2011. Using archival data sources to conduct
nonprofit accounting research. Working paper, Providence College, Marquette
University, University of Wisconsin – Milwaukee and University of Virginia.
Feng, N. C. 2010. Determinants and Ecomonic Consequenes of Going Concern Audit Opinions
in Nonprofit Organizations. DBA dissertation, Boston University.
Geiger, M. A., and K. Raghunandan. 2002. Auditor tenure and audit reporting failures. Auditing:
A Journal of Practice & Theory 21 (1): 67-78.
Grassley, C. 2006. Strengthening the nonprofit sector. The Hill. (July 12).
———. 2010. Memorandum to Reporters and Editors: Illinois Supreme Court ruling on
hospital’s state tax exemption. Dated March 18, 2010. Available at:
http://grassley.senate.gov/news/Article.cfm?RenderForPrint=1&customel_dataPageID_1
502=25826.
Gul, F. A., S. Y. K. Fung, and B. L. Jaggi. 2009. Earnings quality: Some evidence on the role of
auditor tenure and auditors’ industry expertise. Journal of Accounting and Economics 47
(3): 265-287.

32
Gul, F. A., B. L. Jaggi, and G. V. Krishnan. 2007. Auditor independence: Evidence on the joint
effect of auditor tenure and nonaudit fees. Auditing: A Journal of Practice & Theory 26
(2): 117-142.
Heckman, J. 1979. Sample selection bias as a specification error. Econometrica 47 (1): 153-161.
House of Lords Select Committee on Economic Affairs (House of Lords). 2011. Auditors:
Market Concentration and Their Role. Volume I: Report. London: House of Lords.
Internal Revenue Service (IRS). 2010. IRS Business Master File with a limited selection of
variables for all 501(c)(3) and other 501(c) exempt organizations combined, Jan 2010.
Available at: http://nccsdataweb.urban.org/PubApps/showDD.php#Business Master
Files.
Iyer, V., and A. Watkins. 2008. Adoption of Sarbanes-Oxley measures by nonprofit
organizations: An empirical study. Accounting Horizons 22 (3): 255-277.
Jeffrey, C. 1992. The relation of judgment, personal involvement, and experience in the audit of
bank loans. The Accounting Review 67 (4): 802–819.
Johnson, E., I. K. Khurana, and J. K. Reynolds. 2002. Audit-firm tenure and the quality of
financial reports. Contemporary Accounting Research 19 (4): 637-660.
Johnstone, K., and J. Bedard. 2001. Engagement planning, bid pricing, and client response in the
market for initial attest engagements. The Accounting Review 76 (2): 199-220.
Keating, E., M. Fischer, T. Gordon, and J. Greenlee. 2005. The Single Audit Act: How
compliant are nonprofit organizations? Journal of Public Budgeting, Accounting and
Financial Management 17 (3): 285-309.
Kinney, W., and L. McDaniel. 1989. Characteristics of firms correcting previously reported
quarterly earnings. Journal of Accounting and Economics 11 (1):71-93.
Knechel, W. R. & Vanstraelen, A. 2007. The relationship between auditor tenure and audit
quality implied by going concern opinions. Auditing: A Journal of Practice & Theory: 26
(1): 113–31.
Lim, C.-Y., and H.-T. Tan. 2010. Does auditor tenure improve audit quality? Moderating effects
of industry specialization and fee dependence. Contemporary Accounting Research 27
(3): 923-957.
López, D. M., and G. F. Peters. 2010. Internal control reporting differences among public and
governmental auditors: The case of city and county Circular A-133 audits. Journal of
Accounting and Public Policy 29 (5): 510–524.
Myers, J. N., L. A. Myers, and T. C. Omer. 2003. Exploring the term of the auditor-client
relationship and the quality of earnings: A case for mandatory auditor rotation? The
Accounting Review 78 (July): 779-801.

33
National Center for Charitable Statistics (NCCS). 2011. Number of nonprofit organizations in
the United States, 1999 – 2009. Available at:
http://nccsdataweb.urban.org/PubApps/profile1.php?state=US.
Office of Management and Budget (OMB). 2007. Circular No. A-133: Audits of States, Local
Governments, and Non-Profit Organizations. Revised to show changes published in the
Federal Register June 27, 2003 and June 26, 2007. Washington, D.C.: OMB.
Palmrose, Z. V. 1991. Trials of legal disputes involving independent auditors: Some empirical
evidence. Journal of Accounting Research 29 (Supplement): 149-185.
Petovits, C., C. Shakespeare, and A. Shih. 2011. The causes and consequences of internal control
problems in nonprofit organizations. The Accounting Review 86 (1): 325-357.
President’s Council on Integrity and Efficiency (PCIE). 2007. Report on National Single Audit
Sampling Project. Washington, D.C.: Government Printing Office.
Public Company Accounting Oversight Board (PCAOB). 2011. Concept Release on Auditor
Independence and Audit Firm Rotation. Release No. 2011-006, Washington, D.C.:
PCAOB.
Public Oversight Board (POB). 2000. Panel on Audit Effectiveness: Public Oversight Board
Report and Recommendations. Stamford, CT: POB.
Ramen, K., and E. Wilson. 1992. An empirical investigation of the market for ‘single audit’
services. Journal of Accounting and Public Policy 11(4): 271-295.
Rice, S., and D. Weber. 2012. How effective is internal control reporting under SOX 404?
Determinants of the (non-)disclosure of existing material weaknesses. Journal of
Accounting Research, forthcoming.
Srinidhi, B., S. Leung, and F. A. Gul. 2010. Auditor tenure and audit quality: The role of the
demand for unique client specific knowledge. Working paper, City University of Hong
Kong and The Hong Kong Polytechnic University.
Tan, H. T. 1995. Effects of expectations, prior involvement, and review awareness on memory
for audit evidence and judgment. Journal of Accounting Research 33 (1): 113–136.
Trotman, K. T., and R. Wood. 1991. A meta-analysis of studies on internal control judgments.
Journal of Accounting Research 29 (1): 180-192.
Tate, S. 2007. Auditor change and auditor choice in nonprofit organizations. Auditing: A Journal
of Practice & Theory 26 (1): 47-70.
U.S. Congress. 2002. The Sarbanes–Oxley Act of 2002. 107th Congress of the United States of
America. H.R. 3763. Washington, D.C.: Government Printing Office.
34
U.S. General Accountability Office (GAO). 2002. Improvements possible in public, IRS, and
state oversight of charities. GAO-02-526 (April). Washington, D.C.: Government
Printing Office.
———. 2003. Public Accounting Firms: Required Study on the Potential Effects of Mandatory
Audit Firm Rotation. Washington, D.C.: Government Printing Office.
———. 2008a. Single Audit Quality. Actions needed to address persistent audit quality
problems. GAO 08-213T. Washington, D.C.: Government Printing Office
———. 2008b. Variation in standards and guidance limit comparison of how hospitals meet the
community benefit requirement. GAO-08-880 (September). Washington, D.C.:
Government Printing Office.
———. 2009. Significant federal funds reach the sector through various mechanisms, but more
complete and reliable funding data are needed. GAO report 09-193. Washington D.C.:
Government Printing Office.
Ye, P. E. Carson, and R. Simnett. 2011. Threats to auditor independence: The impact of
relationship and economic bonds. Auditing: A Journal of Practice & Theory 30 (1): 121-
148.
Zeff, S. 2003. Du Pont’s early policy on the rotation of audit firms. Journal of Accounting and
Public Policy 22 (1): 1-18.
Zhang, Y., J. Zhou, and N. Zhou. 2007. Audit committee quality, auditor independence, and
internal control weaknesses. Journal of Accounting and Public Policy 26 (3): 300-327.

35
APPENDIX A
Variable Definitions
Dependent Variables
FS_RC Equals one if the audit report in year t discloses a financial
statement control deficiency classified as a reportable condition
during the year, and equals zero otherwise
FS_MW Equals one if the audit report in year t discloses a financial
statement control deficiency classified as a material weakness
during the year, and equals zero otherwise
FINDORQ Equals one if the audit report in year t discloses a major program
audit finding or questioned cost during the year, and equals zero
otherwise
MP_RC Equals one if the audit report in year t discloses a major program
control deficiency classified as a reportable condition during the
year, and equals zero otherwise
MP_MW Equals one if the audit report in year t discloses a major program
control deficiency classified as a material weakness during the year,
and equals zero otherwise
Independent Variables
CHANGEFIRM Equals one if the client changed auditors between year t-1 and year
t, and equals zero otherwise
CHANGEPARTNER Equals one if the auditor is the same in year t-1 and year t but the
audit partner has changed between year t-1 and year t, and equals
zero otherwise
LONGTENURE Equals one if audit partner tenure in year t is greater than or equal to
six years, and equals zero otherwise
LNACCTFEES Equals the natural log of total accounting fees paid in year t
LAGPROBLEM Equals the number of problems reported in year t-1 (i.e.: the sum of
going concern opinion, qualified/adverse/disclaimer opinion,
reportable condition, material weakness, audit finding, and
questioned cost)
COMPLEXITY Equals the number of revenue sources in year t listed on Form 990
(public support, government contributions, and program revenue)
SURPLUS Equals one if the firm reported revenues in excess of expenses
during year t, and equals zero otherwise
GCAR Equals one if the auditor issued a going concern audit opinion in
year t, and equals zero otherwise
ASSETSIZE Equals the natural log of total assets reported in year t

36
APPENDIX A (continued)
GROWTH Equals the growth rate in total assets over the prior year measured as
the ratio of end of year total assets in year t (Line 59 Column B) to
beginning of year total assets in year t (Line 59 Column A)
LOWRISK Equals one if the auditee qualifies as low risk in year t under Section
.530 of the Single Audit Act (A Single Audit was performed in each
of the last two years, the auditee received an unqualified audit
opinion on the financial statements and Schedule of Expenditures of
Federal Awards, the auditor reported no material weaknesses, and
none of the federal programs had audit findings resulting in a
material weakness or due to questioned costs exceeding 5% of
federal awards expended for Type A programs), and equals zero
otherwise
BIGN Equals one if the auditor in year t is a Big N firm, and equals zero
otherwise
SECTIER Equals one if the auditor in year t is one of the largest 30 public
accounting firms in the country in 2008, excluding the Big N firms,
and equals zero otherwise
SPECIALIST Equals one if the auditor in year t issues 50 or more audit reports
during the sample period, excluding BIGN and SECTIER firms, and
equals zero otherwise
LEVERAGE Equals tax exempt bond liabilities at the end of the year in year t
(Line 64a, Column B) divided by total assets at the end of year t
(Line 59, Column B)
OTHERPCAOB Equals one if the auditor in year t is a PCAOB registrant in 2010 but
not otherwise classified as BIGN, SECTIER, or SPECIALIST, and
equals zero otherwise
LOBBY Equals one if the NFP reported lobbying expense in year t (Schedule
A line 37b), and equals zero otherwise
LNEMPLOYEES Equals the natural log of the number of employees paid greater than
$30,000 in year t that are not among the five highest paid employees
in year t (Schedule A, Part 1)
Additional selection model variables
ABCONCHG Equals the absolute value of the change in contributions from year t-1
to year t
ABSGOVCHG Equals the absolute value of the change in government contributions
from year t-1 to year t
ABSMGCHG Equals the absolute value of the change in management and general
expenses from year t-1 to year t
ABSFRCHG Equals the absolute value of the change in fundraising expenses from
year t-1 to year t

37
APPENDIX A (continued)
ABSFEEXPCHG Equals the absolute value of the change in federal expenditures from
year t-1 to year t
ABSLIABCHG Equals the absolute value of the change in total liabilities from year t-1
to year t
ABSDACHG Equals the absolute value of the change in leverage (total
liabilities/total assets) from year t-1 to year t
NEGACCHG Equals one if total accounting fees declined between year t-1 and year
t, and equals zero otherwise
LNREV Equals the natural log of total revenue in year t
REVCHG Equals the change in total revenue between year t-1 and year t
LAGBIGN Equals one if the auditor in year t-1 was a BIGN auditor, and equals
zero otherwise
ABSCOMPCHG Equals the absolute value of the change in executive compensation
between year t-1 and year t
CLIENTBASE Equals the natural log of the number of opinions issued by the auditor
in year t
LAGANDERSEN Equals one if the predecessor auditor was Arthur Andersen, and equals
zero otherwise
Additional Analyses
CHANGEWITHIN Equals one if CHANGEFIRM in year t equals 1 and the company
changes audit firms within the audit firm size tier, and equals zero
otherwise
DROPDOWN Equals one if CHANGEFIRM in year t equals 1 and the company
changes audit firms from a larger to smaller size tier, and equals zero
otherwise
MOVEUP Equals one if CHANGEFIRM in year t equals 1 and the company
changes audit firms from a smaller to larger audit firm size tier, and
equals zero otherwise
CHANGEPARTNER_EXP Equals one if CHANGEPARTNER in year t equals 1 and the new audit
partner has prior experience with the client, and equals zero otherwise
CHANGEPARTNER_NOEXP Equals one if CHANGEPARTNER in year t equals 1 and the new audit
partner has no prior experience with the client, and equals zero
otherwise
LAST FIRM YEAR Equals one if CHANGEFIRM in year t+1 equals 1, and equals zero
otherwise
LAST PARTNER YEAR Equals one if CHANGEPARTNER in year t+1 equals 1, and equals
zero otherwise
PARTNRTENURE=2, Equals one if audit partner tenure in year t equals 2 years, and equals
zero otherwise
PARTNERTENURE=3 Equals one if audit partner tenure in year t equals 3 years, and equals
zero otherwise
FIGURES
Figure 1

38
Frequencies of reported internal control deficiencies surrounding audit firm changes
(observations=926)
Figure 2
Frequencies of reported internal control deficiencies surrounding audit partner changes
(observations=1,278)
0%
5%
10%
15%
20%
25%
30%
35%
Year Prior to Audit
Firm Change
Year of Audit Firm
Change
Year Following
Audit Firm Change
FS_RC
FS_MW
MP_RC
MP_MW
FINDORQ
0%
5%
10%
15%
20%
25%
30%
Year Prior to Audit
Partner Change
Year of Audit
Partner Change
Year Following
Audit Partner
Change
FS_RC
FS_MW
MP_RC
MP_MW
FINDORQ

39
TABLE 1
Sample Reconciliation
Observations in IRS SOI Files 2000-2007 192,241
Less: Observations without auditor data in A-133 database (169,305)
Intersection of A-133 database and SOI files 22,936
Exclude NFP entities missing three or more years of data from 2000-
2007 (3,809)
Exclude observations where audit partner is not identifiable (236)
18,891
Less: Observations in 2000 (needed for selection model) (2,087)
Less: Observations missing consecutive years for selection model (1,140)
15,664

40
TABLE 2
Univariate Statistics
Panel A: Univariate comparisons of internal control deficiencies reported and audit findings by audit firm and audit partner rotation
No Change Partner Change Audit Firm Change
Same Partner v.
New Partner New Partner
v. New Firm
Mean Std. Dev. Mean Std. Dev. Mean Std. Dev.
T Stat
T Stat
FS_RC 14% 0.345 14% 0.347 25% 0.432
0.26
7.74***
FS_MW 4% 0.195 4% 0.195 9% 0.289
0.03
6.20***
FINDORQ 24% 0.429 28% 0.449 33% 0.470
3.63***
2.66***
MP_RC 15% 0.352 16% 0.362 22% 0.412
1.20
4.07***
MP_MW 3% 0.171 3% 0.165 6% 0.242
0.76
4.62***
Obs. 12,651
1,990
1,023
Panel B: Frequency of control deficiencies and audit findings reported by auditor size and audit partner tenure.
All Observations Big N Clients Only PCAOB Registered Firms
(Big N =0) Non-PCAOB Registered Firms
Short Medium Long Short Medium Long Short Medium Long Short Medium Long
FS_RC 17% 13% 14% 11% 9% 10% 23% 17% 17% 17% 14% 13%
FS_MW 5% 4% 4% 3% 1% 3% 7% 5% 5% 6% 4% 4%
FINDORQ 28% 24% 23% 35% 35% 40% 27% 22% 20% 17% 16% 16%
MP_RC 18% 14% 13% 18% 17% 17% 18% 13% 12% 15% 13% 13%
MP_MW 4% 3% 3% 4% 3% 4% 4% 2% 2% 4% 4% 2%
Obs. 6,022 5,445 4,197 2,216 1,939 983 2,191 1,720 1,209 1,614 1,791 2001
(continued on next page)
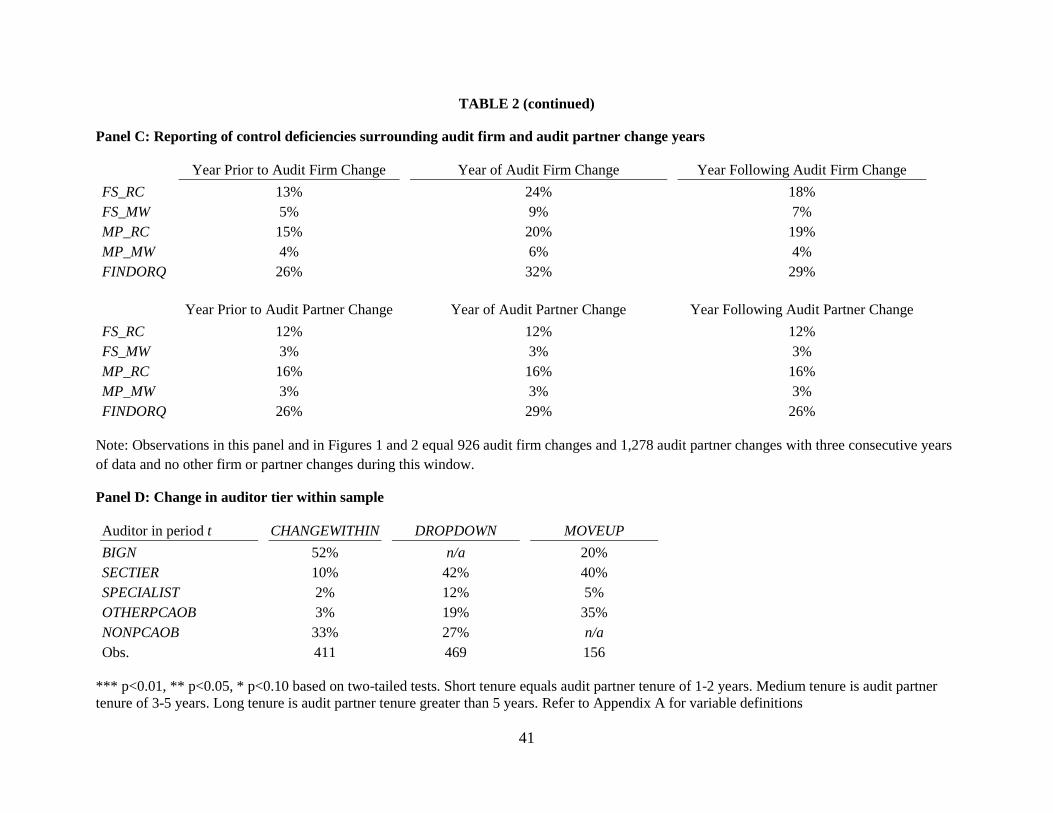
41
TABLE 2 (continued)
Panel C: Reporting of control deficiencies surrounding audit firm and audit partner change years
Year Prior to Audit Firm Change Year of Audit Firm Change Year Following Audit Firm Change
FS_RC 13% 24% 18%
FS_MW 5% 9% 7%
MP_RC 15% 20% 19%
MP_MW 4% 6% 4%
FINDORQ 26% 32% 29%
Year Prior to Audit Partner Change Year of Audit Partner Change Year Following Audit Partner Change
FS_RC 12% 12% 12%
FS_MW 3% 3% 3%
MP_RC 16% 16% 16%
MP_MW 3% 3% 3%
FINDORQ 26% 29% 26%
Note: Observations in this panel and in Figures 1 and 2 equal 926 audit firm changes and 1,278 audit partner changes with three consecutive years
of data and no other firm or partner changes during this window.
Panel D: Change in auditor tier within sample
Auditor in period t CHANGEWITHIN DROPDOWN MOVEUP
BIGN 52% n/a 20%
SECTIER 10% 42% 40%
SPECIALIST 2% 12% 5%
OTHERPCAOB 3% 19% 35%
NONPCAOB 33% 27% n/a
Obs. 411 469 156
*** p<0.01, ** p<0.05, * p<0.10 based on two-tailed tests. Short tenure equals audit partner tenure of 1-2 years. Medium tenure is audit partner
tenure of 3-5 years. Long tenure is audit partner tenure greater than 5 years. Refer to Appendix A for variable definitions

42
TABLE 3
Descriptive Statistics
Panel A: Regression model variables
Mean
Standard
Deviation
5%
25%
50%
75%
95%
Dependent Variables FS_RC 0.149 0.356 0.000 0.000 0.000 0.000 1.000
FS_MW 0.045 0.208 0.000 0.000 0.000 0.000 0.000
FINDORQ 0.254 0.435 0.000 0.000 0.000 1.000 1.000
MP_RC 0.153 0.360 0.000 0.000 0.000 0.000 1.000
MP_MW 0.033 0.179 0.000 0.000 0.000 0.000 0.000
Independent Variables CHANGEFIRM 0.065 0.247 0.000 0.000 0.000 0.000 1.000
CHANGEPARTNER 0.127 0.333 0.000 0.000 0.000 0.000 1.000
LONGTENURE 0.270 0.444 0.000 0.000 0.000 1.000 1.000 LAGPROBLEM 0.514 0.876 0.000 0.000 0.000 1.000 2.000
LNACCTFEES# 100.4 179.8 0.000 3.500 43.00 107.28 413.28
COMPLEXITY 1.786 0.863 0.000 1.000 2.000 2.000 3.000
SURPLUS 0.690 0.462 0.000 0.000 1.000 1.000 1.000
GCAR 0.006 0.076 0.000 0.000 0.000 0.000 0.000
ASSETSIZE# 246.33 586.84 1.923 10.353 59.529 108.07 1,159.9
GROWTH 1.061 0.150 0.884 0.980 1.038 1.107 1.318
LOWRISK 0.773 0.419 0.000 1.000 1.000 1.000 1.000
BIGN 0.317 0.466 0.000 0.000 0.000 1.000 1.000
SECTIER 0.185 0.388 0.000 0.000 0.000 0.000 1.000
SPECIALIST 0.085 0.279 0.000 0.000 0.000 0.000 1.000
LEVERAGE 0.091 0.150 0.000 0.000 0.000 0.154 0.420
OTHERPCAOB 0.121 0.326 0.000 0.000 0.000 0.000 1.000
LOBBY 0.068 0.251 0.000 0.000 0.000 0.000 1.000
LNEMPLOYEES# 1,166 2,852 0.000 74.00 333.0 1,018 4,869
(continued on next page)
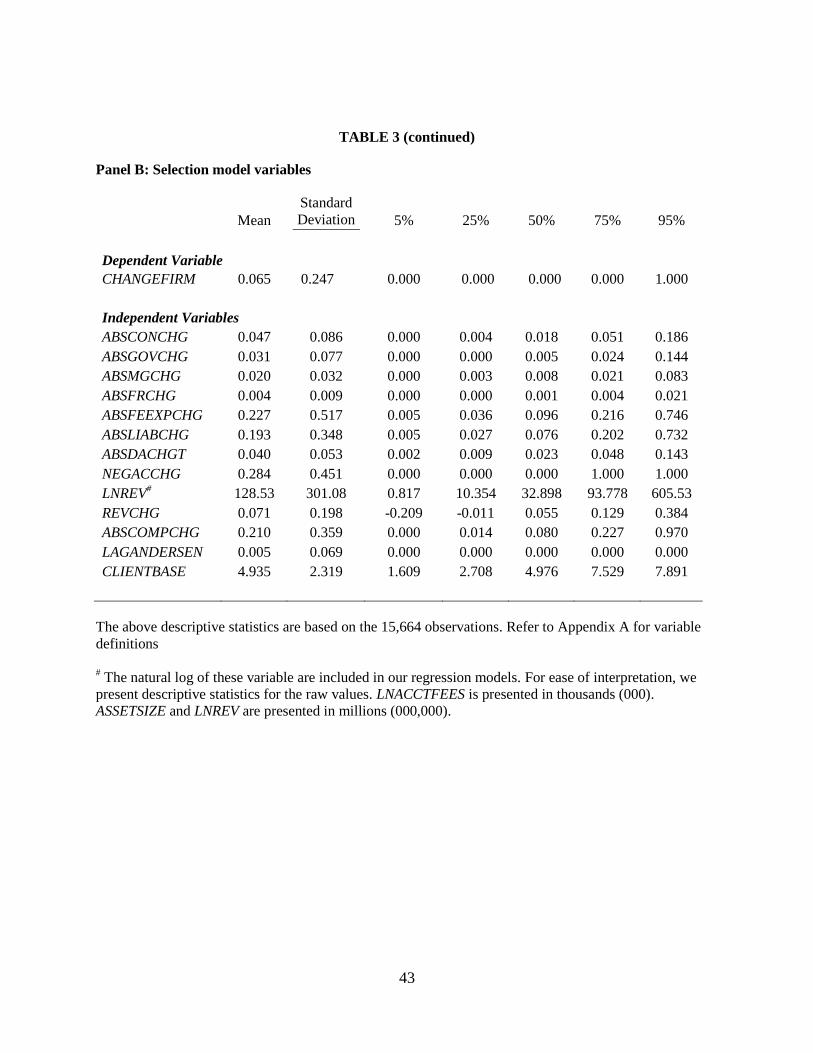
43
TABLE 3 (continued)
Panel B: Selection model variables
Mean
Standard
Deviation
5%
25%
50%
75%
95%
Dependent Variable
CHANGEFIRM 0.065 0.247 0.000 0.000 0.000 0.000 1.000
Independent Variables
ABSCONCHG 0.047 0.086 0.000 0.004 0.018 0.051 0.186
ABSGOVCHG 0.031 0.077 0.000 0.000 0.005 0.024 0.144
ABSMGCHG 0.020 0.032 0.000 0.003 0.008 0.021 0.083
ABSFRCHG 0.004 0.009 0.000 0.000 0.001 0.004 0.021
ABSFEEXPCHG 0.227 0.517 0.005 0.036 0.096 0.216 0.746
ABSLIABCHG 0.193 0.348 0.005 0.027 0.076 0.202 0.732
ABSDACHGT 0.040 0.053 0.002 0.009 0.023 0.048 0.143
NEGACCHG 0.284 0.451 0.000 0.000 0.000 1.000 1.000
LNREV# 128.53 301.08 0.817 10.354 32.898 93.778 605.53
REVCHG 0.071 0.198 -0.209 -0.011 0.055 0.129 0.384
ABSCOMPCHG 0.210 0.359 0.000 0.014 0.080 0.227 0.970
LAGANDERSEN 0.005 0.069 0.000 0.000 0.000 0.000 0.000
CLIENTBASE 4.935 2.319 1.609 2.708 4.976 7.529 7.891
The above descriptive statistics are based on the 15,664 observations. Refer to Appendix A for variable
definitions
# The natural log of these variable are included in our regression models. For ease of interpretation, we
present descriptive statistics for the raw values. LNACCTFEES is presented in thousands (000).
ASSETSIZE and LNREV are presented in millions (000,000).

44
TABLE 4
Auditor Change Model (Selection Model)
CHANGEFIRM
ABSCONCHG 0.279
(1.157)
ABSGOVCHG 0.589**
(2.201)
ABSMGCHG 3.627***
(7.483)
ABSFRCHG -1.629
(-0.632)
ABSFEEXPCHG 0.144***
(5.341)
ABSLIABCHG -0.022
(-0.350)
ABSDACHG 0.221
(0.559)
NEGACCHG 0.116***
(2.947)
LNREV 0.090***
(3.307)
REVCHG 0.075
(0.765)
LAGBIGN 2.327***
(18.098)
ABSCOMPCHG 0.188***
(3.728)
LOWRISK -0.169***
(-3.729)
CLIENTBASE -0.138***
(-5.019)
LAGANDERSEN 1.316***
(6.489)
Outcome Variables Included
State, Industry, Year Indicators Included
Constant -4.895***
(-10.352)
Observations 15,664
ROC/Pseudo R-Square 0.786/0.243
The above table presents the probit regression coefficients (t-statistics in parentheses) for the auditor change selection model. ***
p<0.01, ** p<0.05, * p<0.10 based on two-tailed tests. Outcome variables and state, industry, and year indicators are included but
omitted from the table for brevity. Refer to Appendix A for variable definitions.

45
TABLE 5
Reported Internal Control Deficiencies and Audit Findings
FS_RC FS_MW FINDORQ MP_RC MP_MW
CHANGEFIRM H1 0.805*** 1.074*** 0.404*** 0.383*** 0.389** (7.265) (6.319) (4.046) (3.499) (2.046) CHANGEPARTNER H2 0.021 0.056 0.051 -0.018 -0.225 (0.253) (0.383) (0.803) (-0.241) (-1.316) LONGTENURE H3 -0.007 0.028 0.187*** -0.028 -0.028 (-0.096) (0.242) (3.387) (-0.392) (-0.196) LAGPROBLEM 0.853*** 0.796*** 1.028*** 0.797*** 0.746*** (25.433) (17.410) (31.127) (24.094) (14.146) LNACCTFEES -0.017** -0.012 0.008 0.003 0.008 (-2.359) (-1.156) (1.355) (0.415) (0.628) COMPLEXITY 0.166*** 0.221*** -0.092*** 0.072* 0.163* (4.018) (3.542) (-2.728) (1.821) (1.760) SURPLUS -0.230*** -0.078 0.085 0.069 -0.154 (-3.562) (-0.773) (1.498) (1.064) (-1.275) GCAR 0.829*** 0.701 -0.876*** -0.655* 0.280 (2.804) (1.621) (-2.664) (-1.908) (0.716) ASSETSIZE -0.017 -0.009 0.113*** -0.014 -0.021 (-0.536) (-0.193) (4.735) (-0.442) (-0.366) GROWTH 0.209 0.144 -0.311* -0.056 0.442 (1.094) (0.467) (-1.827) (-0.301) (1.250) LOWRISK -0.447*** -1.079*** -0.454*** -0.706*** -1.579*** (-5.962) (-10.310) (-7.003) (-9.867) (-12.106) BIGN -0.493*** -0.649*** 0.594*** 0.168 0.181 (-3.990) (-3.210) (6.574) (1.486) (0.888) SECTIER 0.327*** 0.054 0.401*** 0.017 -0.367* (3.120) (0.351) (4.855) (0.163) (-1.840) SPECIALIST 0.471*** 0.207 -0.188 -0.237 -0.499* (3.396) (1.102) (-1.490) (-1.529) (-1.829) LEVERAGE 0.090 -0.130 0.364** 0.457** 0.528 (0.381) (-0.372) (2.142) (2.148) (1.184) OTHERPCAOB 0.057 -0.057 -0.217** -0.221* -0.301 (0.490) (-0.352) (-2.036) (-1.824) (-1.339) LOBBY -0.136 -0.120 -0.153* -0.252* -0.345 (-1.042) (-0.622) (-1.660) (-1.952) (-1.507) LNEMPLOYEES 0.009 -0.040 0.049*** 0.015 -0.019 (0.424) (-1.220) (2.992) (0.752) (-0.565) IMR 0.069 0.261** -0.061 -0.044 -0.302** (0.835) (2.036) (-0.866) (-0.537) (-2.223) Constant -2.136*** -2.867*** -2.399*** -0.486 -1.888* (-3.136) (-2.950) (-4.133) (-0.713) (-1.669) Observations 15,664 15,664 15,664 15,664 15,664 ROC/Pseudo R Sq
0.796/0.185 0.847/0.237 0.802/0.206 0.770/0.151 0.849/0.233
*** p<0.01, ** p<0.05, * p<0.10 based on two-tailed tests. Industry and year indicators are included but omitted from the table
for brevity. Refer to Appendix A for variable definitions.

46
TABLE 6
Internal Control Deficiencies and Audit Findings by Audit Tier
Panel A: Financial statement reportable conditions
BIGN SECTIER SPECIALIST OTHERPCAOB NONPCAOB
FS_RC FS_RC FS_RC FS_RC FS_RC
CHANGEFIRM 1.136*** 1.346*** 1.302*** 0.615* 0.239
(5.607) (5.712) (2.720) (1.941) (1.024)
CHANGEPARTNER 0.102 -0.023 -0.132 0.175 0.040
(0.697) (-0.152) (-0.556) (0.677) (0.203)
LONGTENURE 0.158 -0.026 -0.351 0.160 -0.032
(1.093) (-0.155) (-1.433) (0.759) (-0.245)
Controls Yes Yes Yes Yes Yes
Observations 5,138 2,879 1,180 1,834 4,628
ROC 0.773 0.781 0.837 0.805 0.820
Panel B: Financial statement material weaknesses
BIGN SECTIER SPECIALIST OTHERPCAOB NONPCAOB
FS_MW FS_MW FS_MW FS_MW FS_MW
CHANGEFIRM 2.022*** 1.651*** 1.221 0.957** 0.271
(5.832) (5.765) (1.504) (2.353) (0.797)
CHANGEPARTNER 0.313 0.128 -0.611 -0.682 0.403
(1.051) (0.525) (-1.208) (-1.343) (1.427)
LONGTENURE 0.617** -0.037 0.033 0.010 -0.207
(2.151) (-0.136) (0.091) (0.031) (-1.058)
Controls Yes Yes Yes Yes Yes
Observations
5,138 2,879 1,010 1,796 4,628
ROC 0.827 0.765 0.856 0.881 0.860
*** p<0.01, ** p<0.05, * p<0.10 based on two-tailed tests. Control variables are included but omitted from the table for brevity.
Refer to Appendix A for variable definitions.
Note: Due to the use of a binary variable as the dependent variable, our sample sizes differ between Panels A and B for auditor
size partitions due to the loss of observations as perfect predictors of success or failure in some specifications.

47
TABLE 7
Internal Control Deficiency Reporting Surrounding Auditor Tier Changes
FS_RC FS_MW FINDORQ MP_RC MP_MW
CHANGEWITHIN 0.783*** 1.006*** 0.396*** 0.500*** 0.445*
(5.645) (4.733) (3.103) (3.668) (1.915)
DROPDOWN 0.480** 0.132 0.306* 0.187 -0.505
(2.542) (0.410) (1.733) (0.928) (-1.398)
MOVEUP 0.997*** 1.650*** 0.675*** 0.659*** 1.376***
(4.833) (6.115) (3.255) (3.012) (4.465)
CHANGEPARTNER 0.019 0.057 0.055 -0.009 -0.212
(0.233) (0.395) (0.866) (-0.121) (-1.243)
LONGTENURE -0.008 0.028 0.190*** -0.020 -0.015
(-0.103) (0.237) (3.447) (-0.274) (-0.101)
Controls Yes Yes Yes Yes Yes
Observations 15,664 15,664 15,664 15,664 15,664
ROC 0.796 0.848 0.802 0.771 0.852
*** p<0.01, ** p<0.05, * p<0.10 based on two-tailed tests. Control variables are included but omitted from the table for brevity.
Refer to Appendix A for variable definitions.

48
TABLE 8
Prior Client Familiarity
Panel A: The role of client familiarity on the reporting of control deficiencies surrounding
audit partner changes
FS_RC FS_MW FINDORQ MP_RC MP_MW
CHANGEFIRM 0.806*** 1.075*** 0.404*** 0.383*** 0.389**
(7.273) (6.324) (4.045) (3.492) (2.048)
CHANGEPARTNER_EXP 0.410** 0.299 -0.097 -0.408 -0.113
(2.043) (0.792) (-0.481) (-1.579) (-0.257)
CHANGEPARTNER_NOEXP -0.035 0.021 0.068 0.022 -0.238
(-0.406) (0.137) (1.045) (0.298) (-1.389)
LONGTENURE -0.006 0.029 0.187*** -0.029 -0.028
(-0.080) (0.248) (3.382) (-0.400) (-0.194)
Controls Yes Yes Yes Yes Yes
Observations 15,664 15,664 15,664 15,664 15,664
ROC 0.796 0.847 0.802 0.771 0.849
(continued on next page)

49
TABLE 8 (continued)
Panel B: Horizon effects surrounding audit firm and audit partner changes
FS_RC FS_MW FINDORQ
Audit Firm Horizon
LAST FIRM YEAR 0.323*** 0.639*** -0.023
(2.932) (3.982) (-0.249)
CHANGEFIRM 0.863*** 1.083*** 0.362***
(7.533) (6.256) (3.525)
Audit Partner Horizon
LAST PARTNER YEAR 0.168** 0.214 -0.042
(2.126) (1.539) (-0.675)
CHANGEPARTNER_EXP 0.337 0.285 -0.075
(1.638) (0.733) (-0.370)
CHANGEPARTNER_NOEXP -0.018 -0.023 0.037
(-0.197) (-0.146) (0.538)
PARTNERTENURE=2 0.164* -0.045 -0.097
(1.801) (-0.271) (-1.348)
PARTNERTENURE=3 0.073 -0.045 -0.094
(0.985) (-0.348) (-1.453)
LONGTENURE 0.036 0.002 0.148**
(0.460) (0.013) (2.496)
Controls Yes Yes Yes
Observations 15,664 15,664 15,664
ROC 0.794 0.851 0.802
(continued on next page)

50
TABLE 8 (continued)
Panel C: Big N and second tier audit firms only
FS_RC FS_MW FINDORQ
Audit Firm Horizon
LAST FIRM YEAR 0.397*** 1.092*** -0.027
(2.883) (5.278) (-0.258)
CHANGEFIRM 1.238*** 1.713*** 0.437***
(8.308) (7.465) (3.534)
Audit Partner Horizon
LAST PARTNER YEAR 0.213** 0.307* -0.004
(2.046) (1.730) (-0.053)
CHANGEPARTNER_EXP 0.253 0.496 0.026
(0.977) (1.196) (0.107)
CHANGEPARTNER_NOEXP 0.013 0.079 0.117
(0.112) (0.382) (1.493)
PARTNERTENURE=2 0.224** 0.057 -0.088
(1.973) (0.269) (-1.091)
PARTNERTENURE=3 0.086 0.261 -0.122
(0.838) (1.431) (-1.552)
LONGTENURE 0.129 0.337* 0.192**
(1.131) (1.699) (2.483)
Controls Yes Yes Yes
Observations 8,326 8,326 8,326
ROC 0.792 0.848 0.772
*** p<0.01, ** p<0.05, * p<0.10 based on two-tailed tests. Control variables are included but omitted for from the table brevity.
Refer to Appendix A for variable definitions.


