
Augmented designs to assess immune responses in vaccine
efficacy trials
Talk adapted from Dean Follmann’s slidesNIAID
Biostat 578A Lecture 12
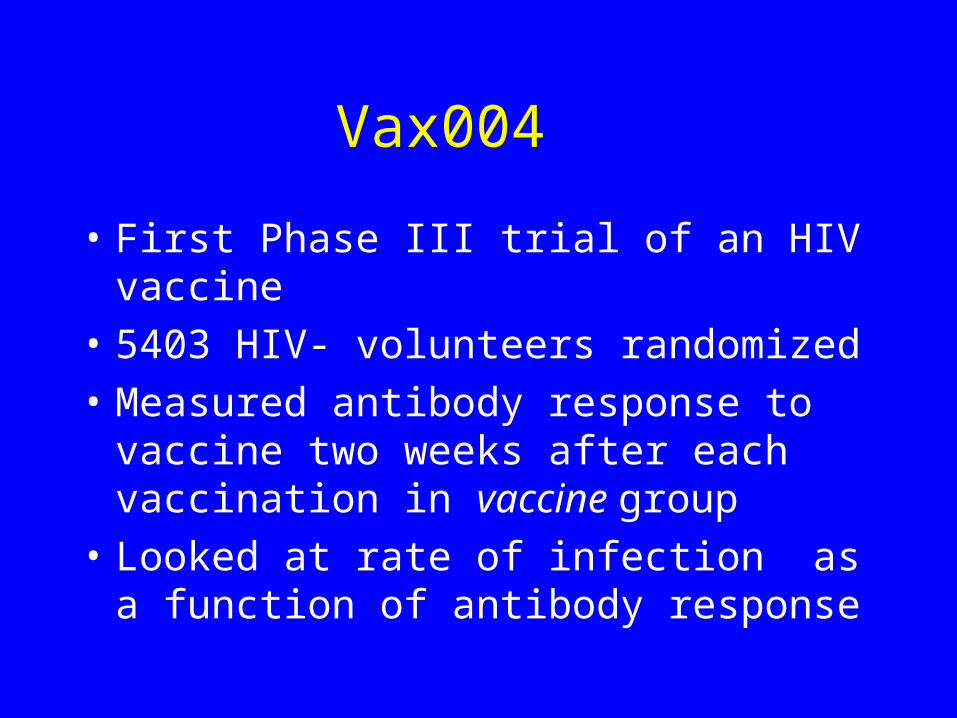
Vax004
• First Phase III trial of an HIV vaccine
• 5403 HIV- volunteers randomized
• Measured antibody response to vaccine two weeks after each vaccination in vaccine group
• Looked at rate of infection as a function of antibody response

Vax004: Relative Risk of Infection Within Vaccine Group
GROUP Weak Modest Good Best
Vaccine 1.00 .43* .34* .29*
* p<.05
IMMUNE RESPONSE QUARTILE
Result: Antibody level is a Correlate of Risk (COR)

Vax004: Relative Risk of Infection Both Groups
GROUP Weak Modest Good Best
Placebo ? ? ? ? 1.00
Vaccine 1.67* .98 .87 .74
* p<.05
IMMUNE RESPONSE QUARTILE
? is X(1), the unknown potential immune response if assigned
vaccine [more on this later]

What does this mean?
• Two possible explanations– Mere Association: The vaccine is useless, but those
individuals who could mount a strong immune response are better able to remain uninfected
– Causation: The vaccine tends to cause infections in those who have poor immune response, but may prevent infections in those with good immune responses
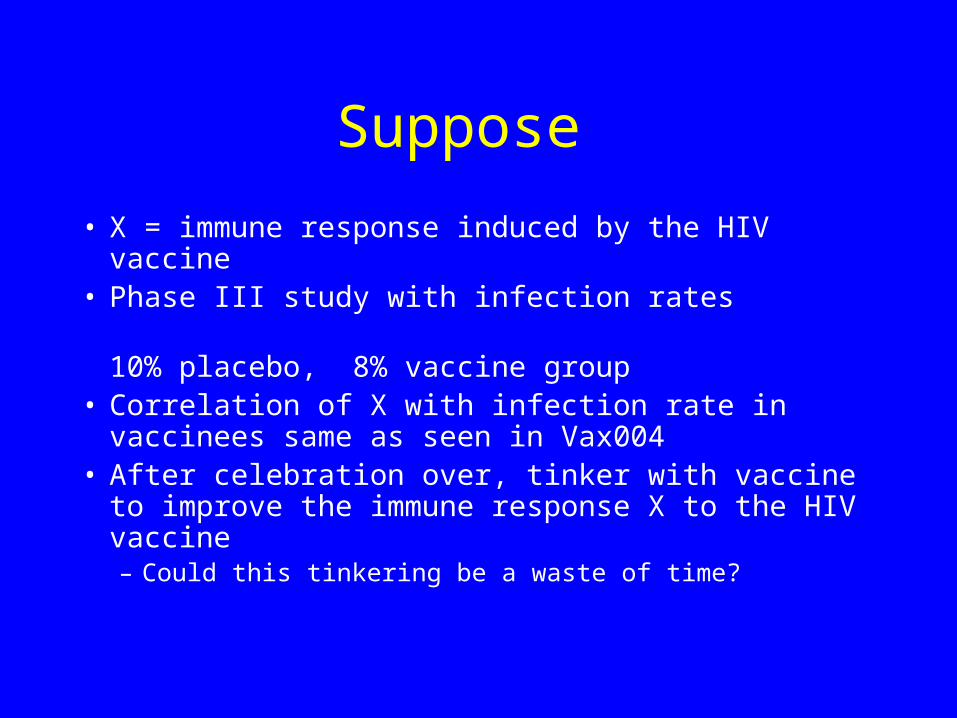
Suppose
• X = immune response induced by the HIV vaccine• Phase III study with infection rates
10% placebo, 8% vaccine group
• Correlation of X with infection rate in vaccinees same as seen in Vax004
• After celebration over, tinker with vaccine to improve the immune response X to the HIV vaccine– Could this tinkering be a waste of time?
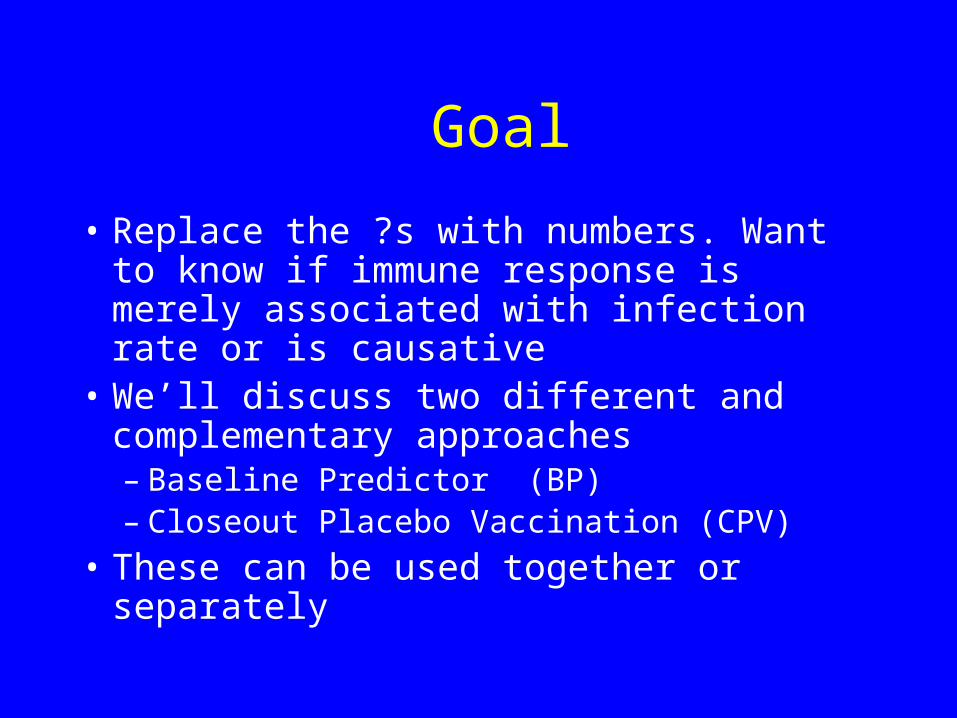
Goal
• Replace the ?s with numbers. Want to know if immune response is merely associated with infection rate or is causative
• We’ll discuss two different and complementary approaches– Baseline Predictor (BP)– Closeout Placebo Vaccination (CPV)
• These can be used together or separately
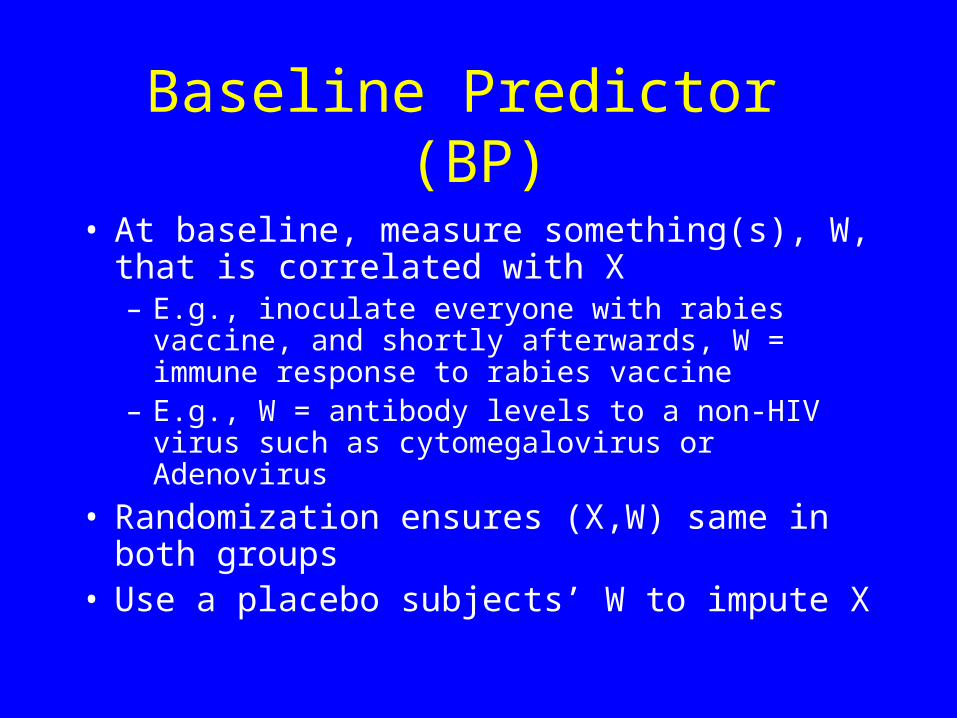
Baseline Predictor (BP)
• At baseline, measure something(s), W, that is correlated with X – E.g., inoculate everyone with rabies vaccine, and
shortly afterwards, W = immune response to rabies vaccine
– E.g., W = antibody levels to a non-HIV virus such as cytomegalovirus or Adenovirus
• Randomization ensures (X,W) same in both groups
• Use a placebo subjects’ W to impute X

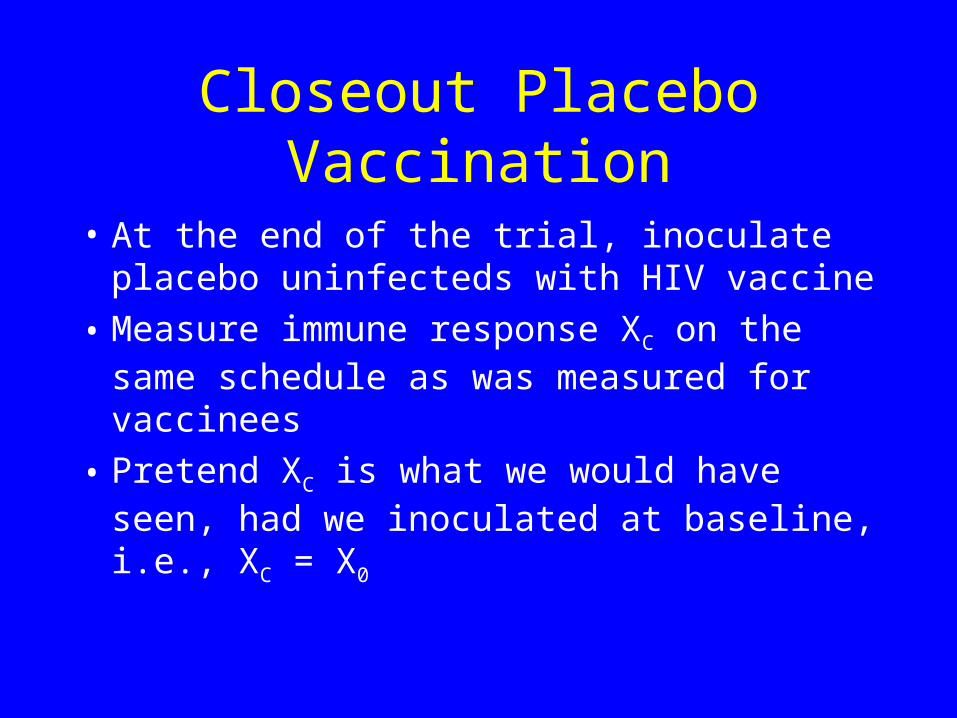
Closeout Placebo Vaccination
• At the end of the trial, inoculate placebo uninfecteds with HIV vaccine
• Measure immune response XC on the same schedule as was measured for vaccinees
• Pretend XC is what we would have seen, had we inoculated at baseline, i.e., XC = X0
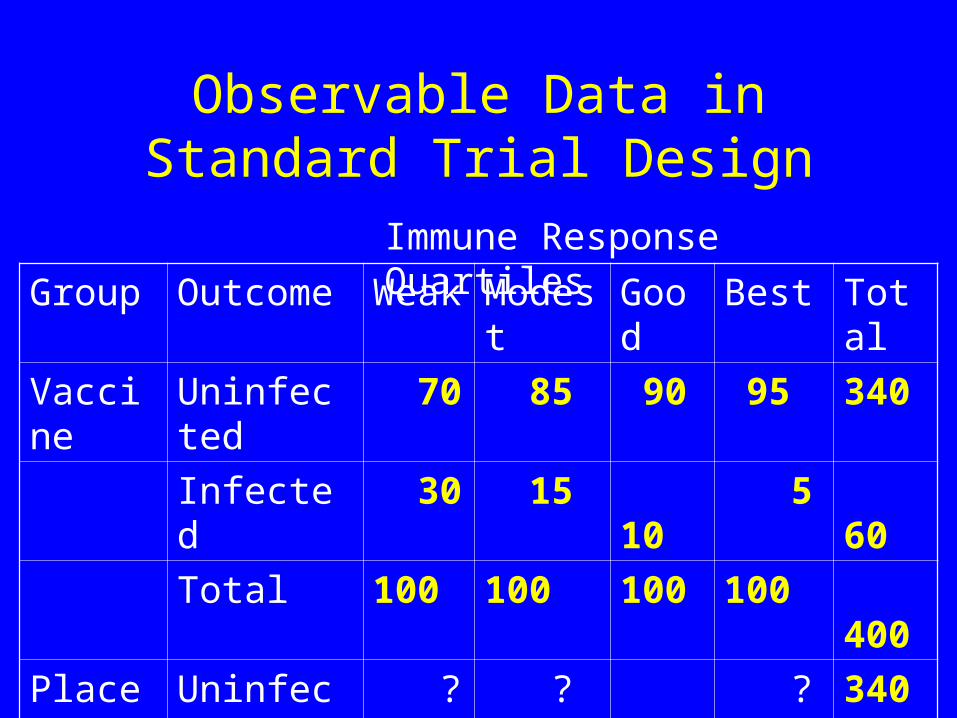
Group Outcome Weak Modest Good Best Total
Vaccine Uninfected 70 85 90 95 340
Infected 30 15 10 5 60
Total 100 100 100 100 400
Placebo Uninfected ? ? ? ? 340
Infected ? ? ? ? 60
Total ? ? ? ? 400
Immune Response Quartiles
Observable Data in Standard Trial Design

Group Outcome Weak Modest Good Best Total
Vaccine Uninfected 70 85 90 95 340
Infected 30 15 10 5 60
Total 100 100 100 100 400
Placebo Uninfected ? ? ? ? 340
Infected ? ? ? ? 60
Total ~100 ~100 ~100 ~100 400
Immune Response Quartiles
Standard Trial Design Exploiting Randomization
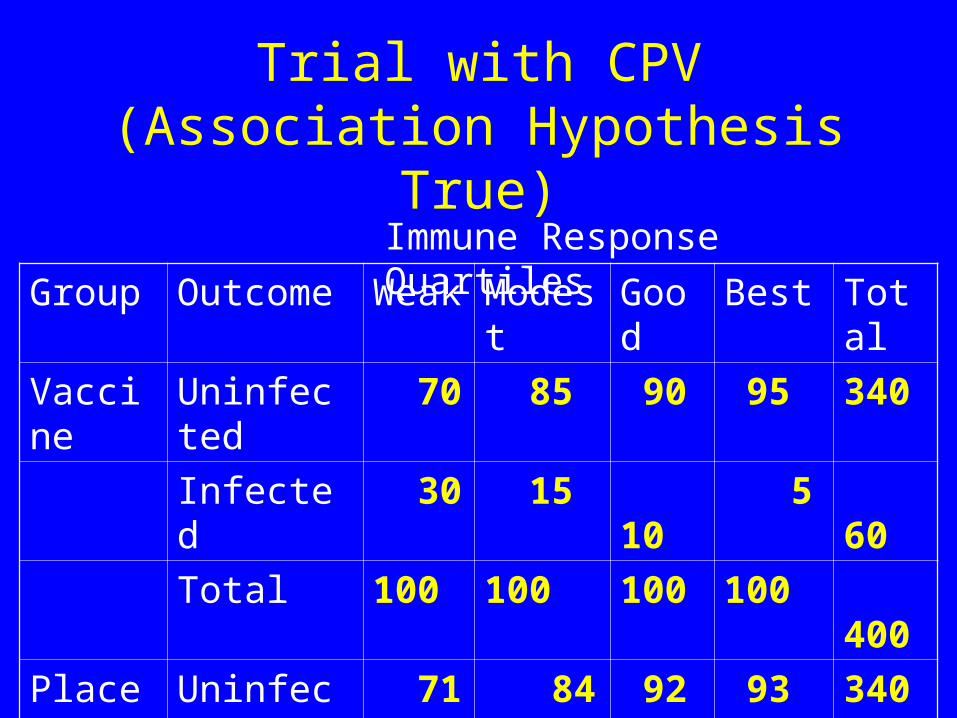
Group Outcome Weak Modest Good Best Total
Vaccine Uninfected 70 85 90 95 340
Infected 30 15 10 5 60
Total 100 100 100 100 400
Placebo Uninfected 71 84 92 93 340
Infected ~29 ~16 ~8 ~7 60
Total ~100 ~100 ~100 ~100 400
Immune Response Quartiles
Trial with CPV (Association Hypothesis True)
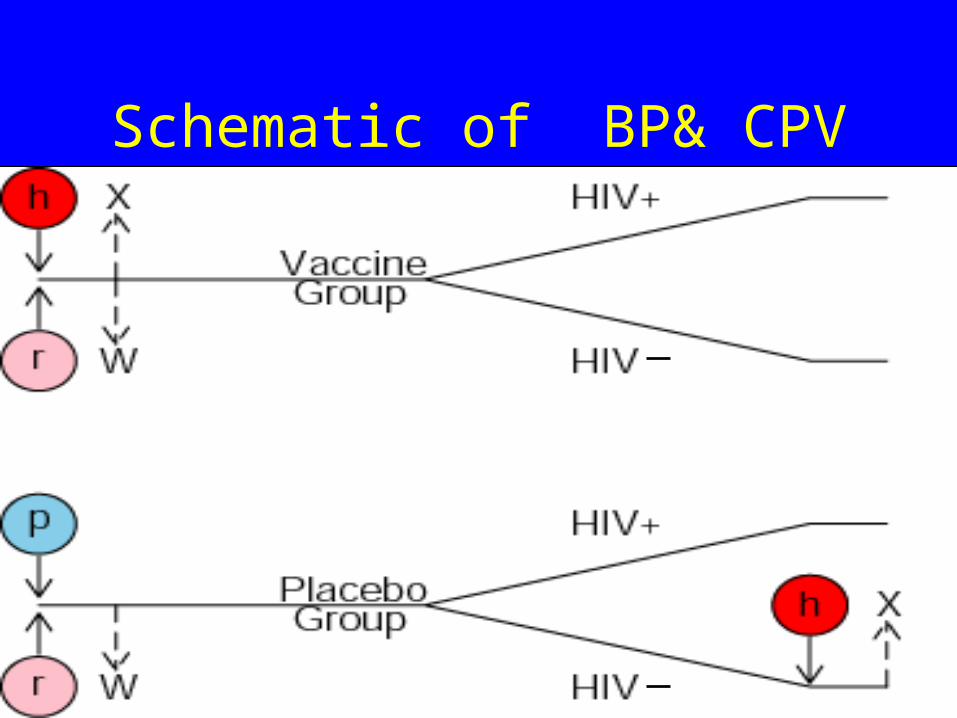
Schematic of BP& CPV

Assumptions
• No noncompliance
• No missing data
• Infections start after X0 is measured
• If not vaccinated, a subject has X = 0 [i.e., X0i(0) = 0]
• Time constancy of immune response:
XCi = X0i

What is X?
• X = X(1) is the potential HIV specific immune response to HIV vaccination
• Vaccine: What a subject did produce in response to the vaccine. (realized: X = X(1))
• Placebo: What a patient would produce in response to the vaccine. (unrealized: X(1) not observed- missing covariate)

Probit Regression
• Assume the probability of infection varies smoothly with X – Placebo Group:
– Vaccine Group:0 2( 1| ) ( )P Y X X
0 1 2 3( 1| ) ( ( ) )P Y X X
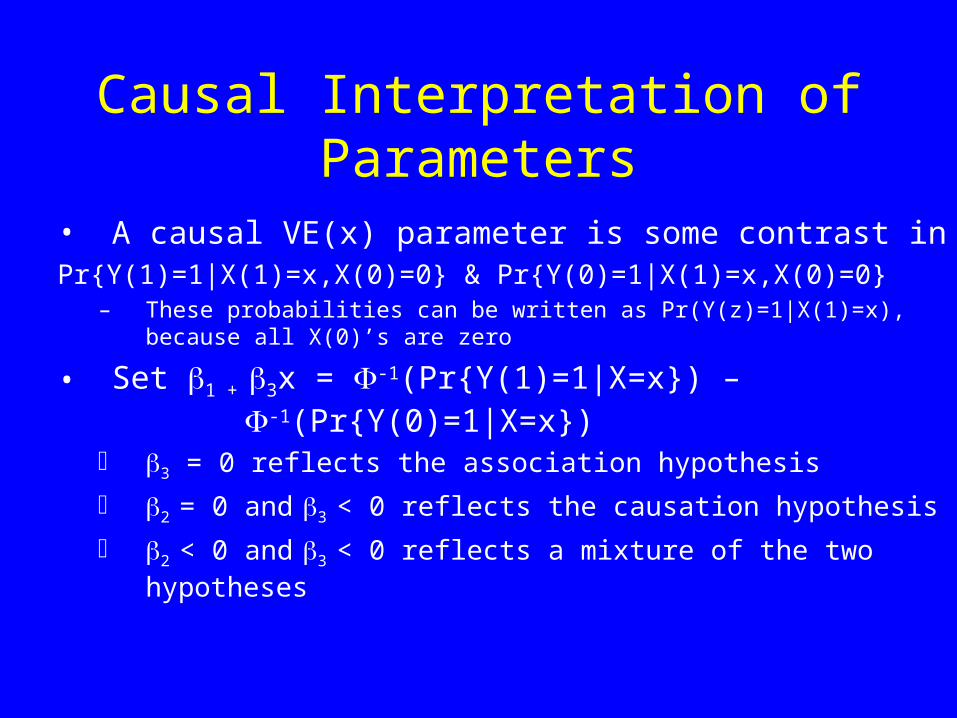
Causal Interpretation of Parameters
• A causal VE(x) parameter is some contrast in Pr{Y(1)=1|X(1)=x,X(0)=0} & Pr{Y(0)=1|X(1)=x,X(0)=0}
– These probabilities can be written as Pr(Y(z)=1|X(1)=x), because all X(0)’s are zero
• Set 1 + 3x = -1(Pr{Y(1)=1|X=x}) – -1(Pr{Y(0)=1|X=x})
3 = 0 reflects the association hypothesis
2 = 0 and 3 < 0 reflects the causation hypothesis
2 < 0 and 3 < 0 reflects a mixture of the two hypotheses
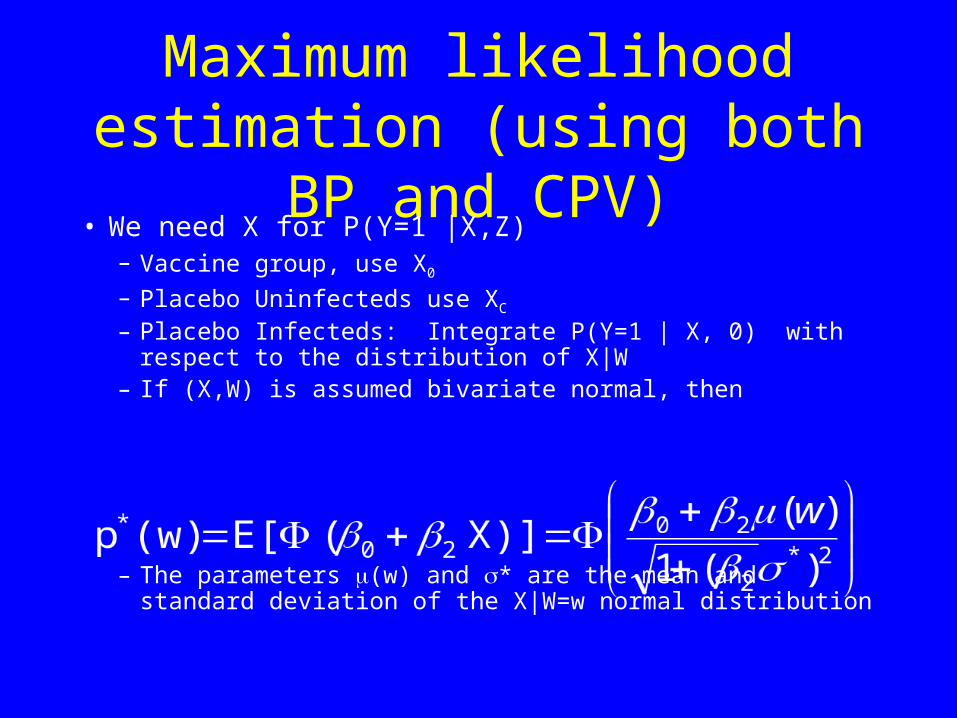
Maximum likelihood estimation (using both BP and CPV)
• We need X for P(Y=1 |X,Z)– Vaccine group, use X0
– Placebo Uninfecteds use XC
– Placebo Infecteds: Integrate P(Y=1 | X, 0) with respect to the distribution of X|W
– If (X,W) is assumed bivariate normal, then
– The parameters (w) and * are the mean and standard deviation of the X|W=w normal distribution

Likelihood (using both BP and CPV)
• Vaccine contribution
i in Vpv(x0i) y(i) (1 - pv(x0i) ) 1 - y(i)
• Placebo contribution
i in P(U) (1 - pp(xCi) ) 1 - y(i) i in P(I)p*(wi) y(i)
• wi at baseline, x0i shortly after randomization, xCi at closeout

Maximum Likelihood
• Likelihood maximized using R (standard maximizers)
• Bootstrap used to estimate standard errors of parameters for Wald Tests
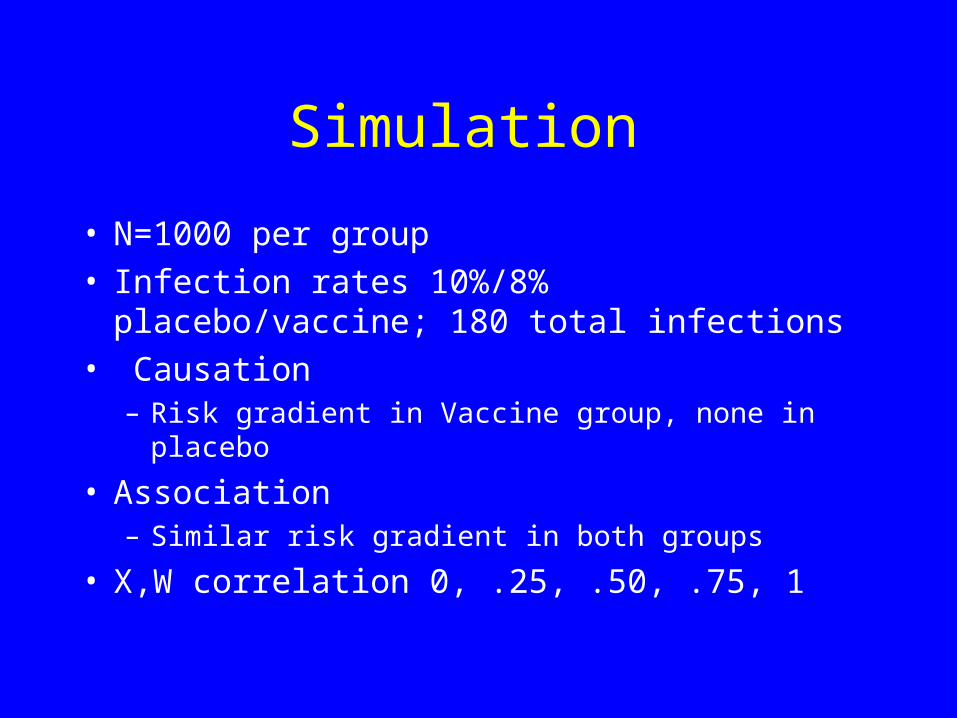
Simulation
• N=1000 per group• Infection rates 10%/8% placebo/vaccine; 180 total
infections • Causation
– Risk gradient in Vaccine group, none in placebo
• Association – Similar risk gradient in both groups
• X,W correlation 0, .25, .50, .75, 1

Placebo
Vaccine

PlaceboVaccine

Results • Measure performance by simulation sample
variance of coefficient estimate, relative to the case where X is known for all subjects
• Association Scenario, correlation r =.5
Design
Variance of
2 estimate
Relative Variance
CPV .0575 15.5
BP .0199 5.4
CPV+BP .0145 3.9
X known .0037 1.0
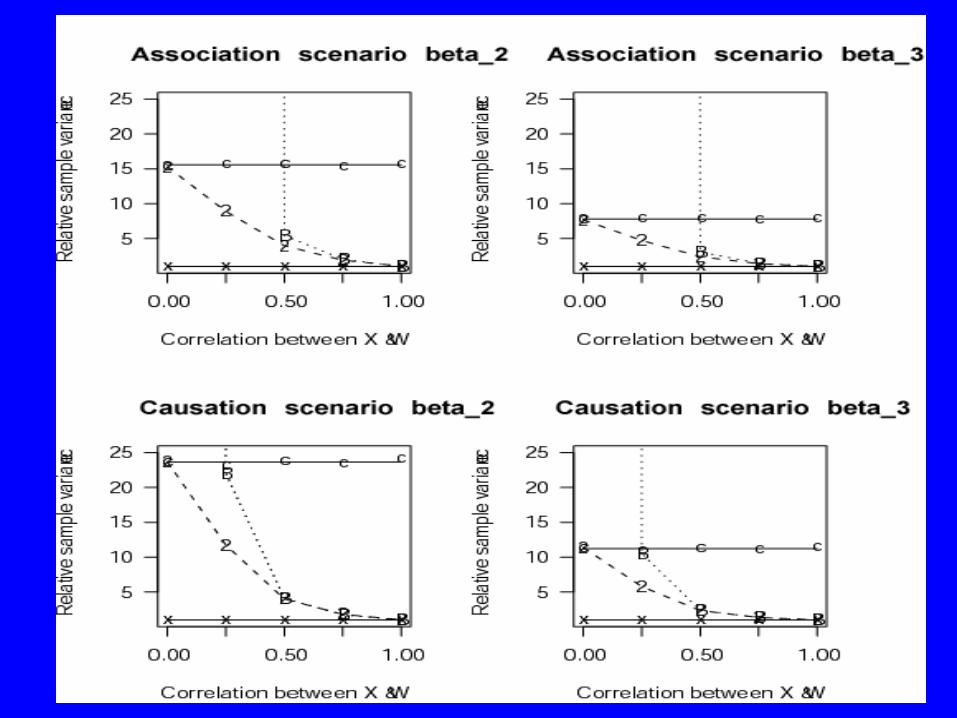
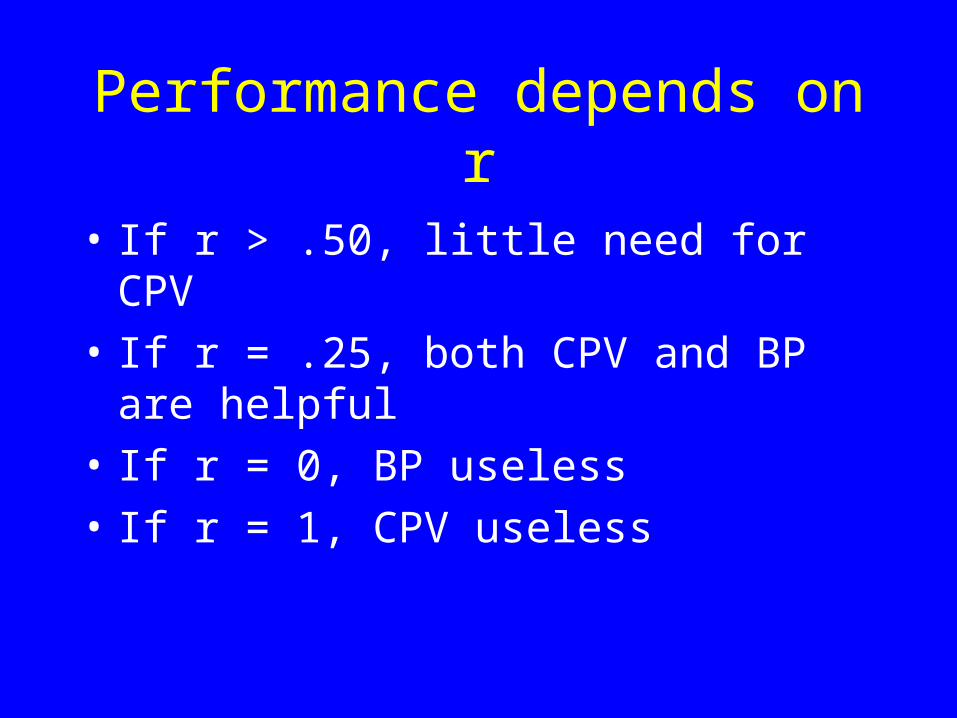
Performance depends on r
• If r > .50, little need for CPV
• If r = .25, both CPV and BP are helpful
• If r = 0, BP useless
• If r = 1, CPV useless

Statistical Power BP alone
• r =.5 N=2000/5000 180/450 total infections
2 3 Scenario
.86/1.00 .03/.05 Association
.04/.05 .78/.99 Causation
.57/.95 .35/.65 Both
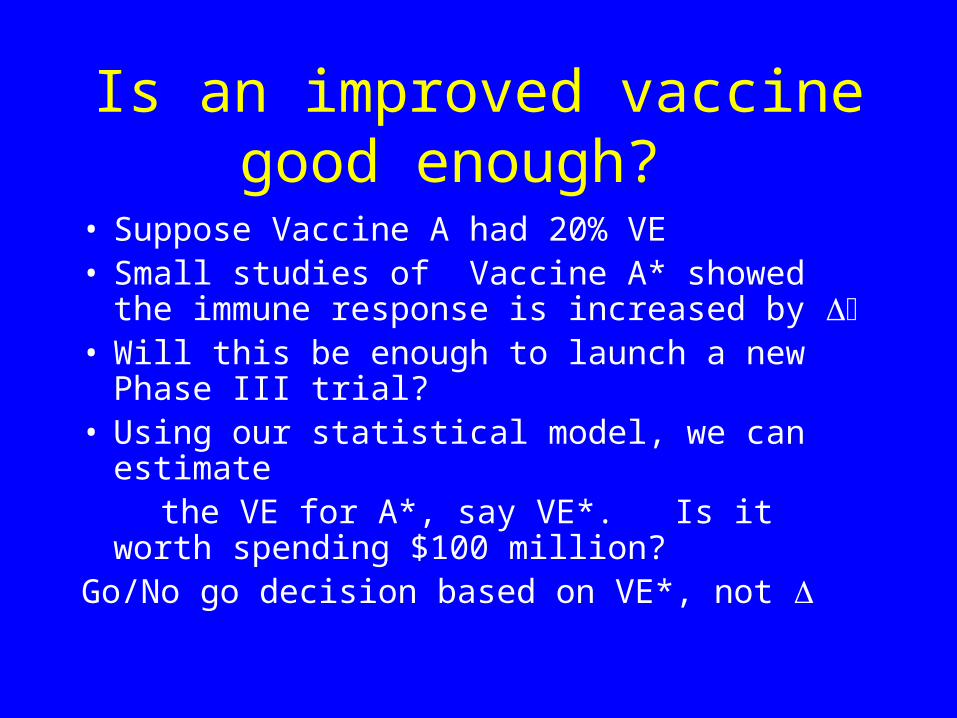
Is an improved vaccine good enough?
• Suppose Vaccine A had 20% VE• Small studies of Vaccine A* showed the immune
response is increased by • Will this be enough to launch a new Phase III
trial?• Using our statistical model, we can estimate the VE for A*, say VE*. Is it worth spending
$100 million? Go/No go decision based on VE*, not

Summary • BP and CPV can be added onto standard vaccine
efficacy trials to replace the “?”s in the placebo group
• Vaccine development focuses on cultivating the best immune response. But– Immune response may be partly causative– Different responses may be more/less causative
• Important to consider augmented designs to properly assess role of immune response
• Could incorporate BP into phase 1 or 2 trials to assess correlation

Summary • This work is an example of a method for assessing
validity of a principal surrogate endpoint [Frangakis and Rubin’s definition of a surrogate endpoint]
• Many open problems– More flexible modeling (semiparametric)/relax
assumptions/diagnostics– Extend from binary endpoint to failure time endpoint– Fitting into a case-cohort design framework– Handling multiple immune responses
• Repeated measures• Multiple immune responses- which combination best predicts
vaccine efficacy?
– Other trial designs (e.g., cluster randomized)


