AUSTIN
2016
Credits & ContactPitchBook Data, Inc.
JOHN GABBERT Founder, CEO
ADLEY BOWDEN Vice President,
Market Development & Analysis
ContentGARRETT JAMES BLACK Senior Analyst
BRYAN HANSON Data Analyst
JENNIFER SAM Senior Graphic Designer
Contact PitchBook pitchbook.com
RESEARCH
EDITORIAL
SALES
COPYRIGHT © 2017 by PitchBook Data, Inc. All rights reserved. No part of this publication may be reproduced in any form or by any means—graphic, electronic, or mechanical, including photocopying, recording, taping, and information storage and retrieval systems—without the express written permission of PitchBook Data, Inc. Contents are based on information from sources believed to be reliable, but accuracy and completeness cannot be guaranteed. Nothing herein should be construed as any past, current or future recommendation to buy or sell any security or an offer to sell, or a solicitation of an offer to buy any security. This material does not purport to contain all of the information that a prospective investor may wish to consider and is not to be relied upon as such or used in substitution for the exercise of independent judgment.
Introduction 3
Review: Austin in the US venture
ecosystem4
Economy 5
Investment activity 6-10
Exits & fundraising 11-12
Select league tables 13
The PitchBook PlatformThe data in this report comes from the PitchBook Platform–our data software for
VC, PE and M&A. Contact [email protected] to request a free trial.
Photo courtesy of Eric Hunt, Wikimedia Commons.
Contents
2 PITCHBOOK 2016 VENTURE ECOSYSTEM FACTBOOK: AUSTIN

A promising venture ecosystem facing hurdlesIntroduction
When it comes to analyzing trends in venture investment, thinking in terms
of an ecosystem is one of the more powerful approaches, as much within
venture capital is not quite as quantifiable as one would like. Moreover, framing
an investment ecosystem as an overlapping, interlocking system of cycles is
especially illuminating when it comes to analysis of VC within a specific region,
given the interplay between general business cycles, fund investing lifecycles,
policy mandates and more. For example, the primary narrative for the US venture
industry throughout 2016 has been a decline in activity even as valuations
have remained relatively strong, with certain metropolitan areas enjoying more
resilient numbers than others. But when zeroing in on one of those metropolitan
areas, the location-specific historical trend in the supply of startups jockeying for
and garnering VC investment becomes a more critical component for analysis.
The metro-specific growth over the past several years also matters considerably.
On top of that, it’s important to highlight how metro-specific venture activity
is necessarily limited by the speed of the spread of viable information within a
given network, plus the size of the nodes in a venture network, i.e. the size of
capital sources. Likewise, livability and interconnectivity within a metro matter,
ranging from metrics such as ease of doing business to tax rates to typical rents
to sprawl. The purpose of this PitchBook report series is to place PitchBook
venture data within a broader context on a more geography-specific basis, the
better to illustrate potential use cases for analysis. It’s critical to note that within
that broader context one must take timing into account. The growth percentage
over time is an important indicator of a venture ecosystem’s overall health, as
one of my collaborators remarked during our review, and there is always more to
any existing ecosystem than can be rendered in a dataset.
As this is the inaugural installment of the metro-specific series, we welcome your
feedback and questions—reach out to us at [email protected]. I’d like
to thank S3 Ventures, Sante Ventures, the Austin Chamber of Commerce, PTV
Healthcare Capital, and the National Venture Capital Association, among others
whom assisted in the production of this report.
GARRETT JAMES BLACK
Senior Analyst
Look up a company.
And its cap table.
And its investors.
And its EBITDA
multiples.
And its board
members.
In seconds.
The PitchBook Platform
has the data you need
to close your next deal.
Learn more at
pitchbook.com
3 PITCHBOOK 2016 VENTURE ECOSYSTEM FACTBOOK: AUSTIN
Review: Austin in US venture ecosystemSnapshot of Austin MSA’s size within the US venture ecosystem as a whole
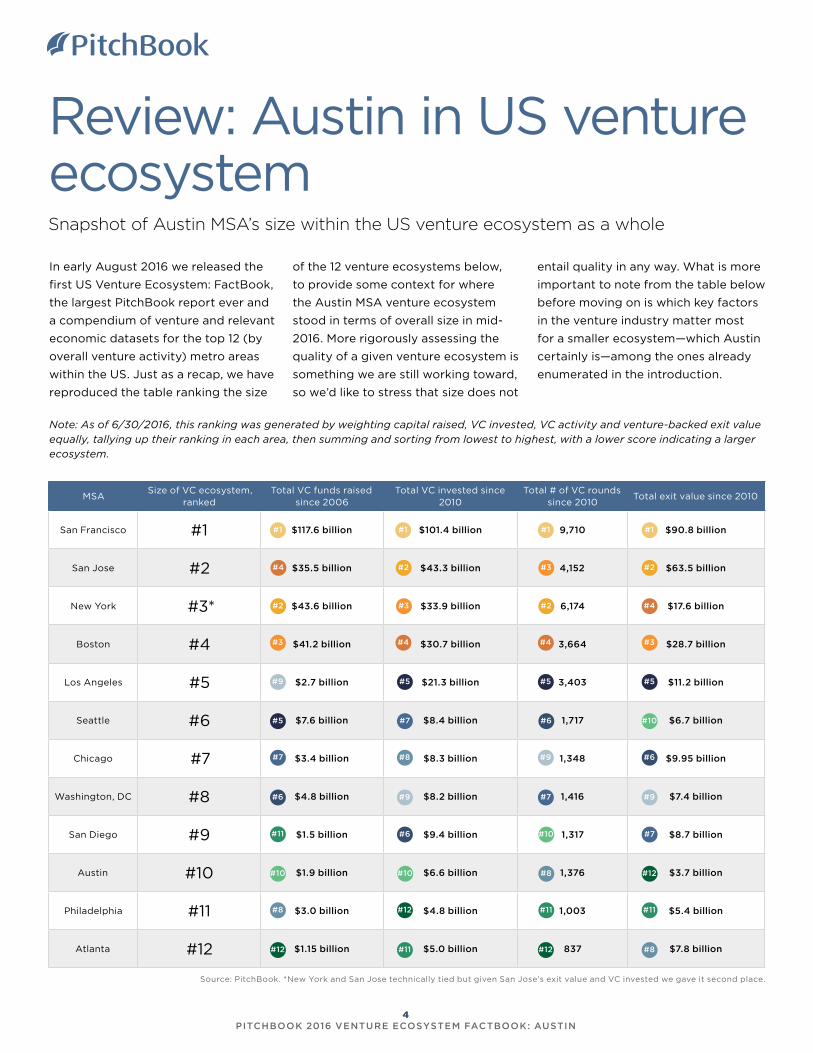
In early August 2016 we released the
first US Venture Ecosystem: FactBook,
the largest PitchBook report ever and
a compendium of venture and relevant
economic datasets for the top 12 (by
overall venture activity) metro areas
within the US. Just as a recap, we have
reproduced the table ranking the size
Source: PitchBook. *New York and San Jose technically tied but given San Jose’s exit value and VC invested we gave it second place.
Note: As of 6/30/2016, this ranking was generated by weighting capital raised, VC invested, VC activity and venture-backed exit value equally, tallying up their ranking in each area, then summing and sorting from lowest to highest, with a lower score indicating a larger ecosystem.
MSASize of VC ecosystem,
rankedTotal VC funds raised
since 2006Total VC invested since
2010Total # of VC rounds
since 2010Total exit value since 2010
San Francisco #1 $117.6 billion $101.4 billion 9,710 $90.8 billion
San Jose #2 $35.5 billion $43.3 billion 4,152 $63.5 billion
New York #3* $43.6 billion $33.9 billion 6,174 $17.6 billion
Boston #4 $41.2 billion $30.7 billion 3,664 $28.7 billion
Los Angeles #5 $2.7 billion $21.3 billion 3,403 $11.2 billion
Seattle #6 $7.6 billion $8.4 billion 1,717 $6.7 billion
Chicago #7 $3.4 billion $8.3 billion 1,348 $9.95 billion
Washington, DC #8 $4.8 billion $8.2 billion 1,416 $7.4 billion
San Diego #9 $1.5 billion $9.4 billion 1,317 $8.7 billion
Austin #10 $1.9 billion $6.6 billion 1,376 $3.7 billion
Philadelphia #11 $3.0 billion $4.8 billion 1,003 $5.4 billion
Atlanta #12 $1.15 billion $5.0 billion 837 $7.8 billion
#1
#2
#1
#3
#4
#5
#6
#7
#8
#9
#10
#11
#12
#1 #1
#2
#2 #2#4
#3
#5
#6
#7
#8
#9
#10
#11
#12
#3
#4
#5
#7
#8
#6
#9
#10
#11
#12
#4
#3
#5
#6
#7
#10
#9
#12
#11
#8
of the 12 venture ecosystems below,
to provide some context for where
the Austin MSA venture ecosystem
stood in terms of overall size in mid-
2016. More rigorously assessing the
quality of a given venture ecosystem is
something we are still working toward,
so we’d like to stress that size does not
entail quality in any way. What is more
important to note from the table below
before moving on is which key factors
in the venture industry matter most
for a smaller ecosystem—which Austin
certainly is—among the ones already
enumerated in the introduction.
4 PITCHBOOK 2016 VENTURE ECOSYSTEM FACTBOOK: AUSTIN

EconomyAustin’s current economic condition & recent trends
When assessing how the health of the
local economy impacts the venture
ecosystem, some primary factors to
look at are tax burdens, relative wages,
rental rates and the supply of talent.
Seasonal temporary hiring contributed
to Austin’s unadjusted employment
rate declining to 3% in December
2016, while Texas on the whole saw
a 4.6% seasonally adjusted jobless
rate in November 2016, per the Texas
Workforce Commission. Austin and
Texas on the whole are still exhibiting
significantly strong numbers, but
by and large it appears the marked
expansion since the financial crisis is
slowing. The Federal Reserve Bank of
Dallas released data in late December
showing the Austin Business-Cycle
Index grew by an annualized rate of
2.9% in October 2016, considerably
below relative to the last decade as a
whole. We emphasize year-over-year
changes—the better to gauge more
recent changes that will have affected
current sentiment—so the impact of
monthly or quarterly influxes of data
do not overly drown out longer-term
trends. Such longer-term perspectives
are crucial to take into account when
considering typical venture investment
cycles. That said, a more recent decline
in economic indicators, however, will
contribute to and may have already
clouded domestic and outside investor
sentiment, at least somewhat. For now,
the state of the Austin economy is still
quite healthy—any negative changes
are distinct mainly due to the fact they
are in proportion to previous, markedly
strong numbers.
A brief note on Austin’s livability: Given
the increasing popularity of events
such as SXSW and Austin’s persisting
Austin metropolitan statistical areaSelect
statistics
Labor force, 2016* 1,101,336
Labor force growth, Oct. ‘15-Oct. ‘16 2.3%
Employment growth, Oct. ‘15-Oct. ‘16 2.4%
Unemployment growth, Oct. ‘15-Oct. ‘16 -0.9%
Average hourly earnings of all employees, August 2016 $27.35
Growth in average hourly earnings of all employees, 2015 YTD-2016 YTD 2.4%
Change in existing building inventory, 2015 YTD-2016 YTD 0.93%
Change in vacancy rate, 2015 YTD-2016 YTD -0.2%
Change in quoted full-service equivalent rental rates 8.2%
Quoted full-service equivalency rental rate $32.7
Change in existing home sales, 2015 YTD-2016 YTD 3.8%
Change in existing home average price, 2015 YTD-2016 YTD 5.3%
Metro Business Cycle Index, August 2016 (Oct. 1980=100) 795.34
Change in Metro Business Cycle Index, 2015 YTD-2016 YTD 6.4%
Austin Business-Cycle Index, October 2016* 2.9%
Monthly change in unemployment rate, September 2016-October 2016* -0.2%
Change in percentage of homes sold that were affordable for median-income families, 2Q 2016-3Q 2016*
2.4%
Sources: US Bureau of Labor Statistics, CoStar Group, Federal Reserve Bank of Dallas, Real Estate Center
at Texas A+M University & National Association of Realtors, & Texas Workforce Commission, data not
seasonally adjusted. YTD as of 11/19/2016 excepting average hourly earnings, which are as of 9/29/2016.
Office rental data is as of 10/6/2016, residential as of 11/1/2016. *As of 12/1/2016.
Texas has no corporate, individual income or state property tax. It also ranks 41st among the 50 US states in taxes paid per $1,000 of personal income, at $88.
cultural reputation, as well as a sizable
transportation bill that passed recently
and input from multiple domestic
parties, it appears the area is still
and will remain quite attractive as a
residence for some time.
5 PITCHBOOK 2016 VENTURE ECOSYSTEM FACTBOOK: AUSTIN

Austin MSA venture activity
Source: PitchBook
Overall, the rate of venture investing in Austin startups has slid
considerably, after a boom period of two years straight
Austin MSA venture activity
Investment activityAn overview of Austin’s venture investment activity
$633
$846
$905
$459
$688
$881
$996
$811
$1,4
24
$1,2
91
$978
78102 98
107134
156
190
251286 296
199
2006 2007 2008 2009 2010 2011 2012 2013 2014 2015 2016
Deal Value ($M) # of Deals Closed
Investment in Austin-based startups
is on the downswing relative to
elevated activity from 2014 to 2015.
Beginning in the final quarter of 2015,
activity has oscillated in a subdued
fashion on a quarterly basis, although
aggregate capital invested flatlined
in the back half of 2016. There are
multiple challenges that could
contribute to a cyclical downturn
within Austin specifically, relative
to the nationwide decline. As we’ve
already seen, the local economy is
healthy, but among these challenges
are: an insufficient supply of startups
decreasing the probability of VCs
finding worthwhile opportunities; lack
of robust domestic sources of capital;
declining interest on the part of both
local and outside investors due to
increases in perception of risk; and a
sluggish recycling of capital. So which
of these are most relevant for Austin,
right now?
0
10
20
30
40
50
60
70
80
90
$0.0
$100.0
$200.0
$300.0
$400.0
$500.0
$600.0
1Q 2Q 3Q 4Q 1Q 2Q 3Q 4Q 1Q 2Q 3Q 4Q 1Q 2Q 3Q 4Q 1Q 2Q 3Q 4Q 1Q 2Q 3Q 4Q 1Q 2Q 3Q 4Q
2010 2011 2012 2013 2014 2015 2016
Deal Value ($M) # of Deals Closed
Source: PitchBook
6 PITCHBOOK 2016 VENTURE ECOSYSTEM FACTBOOK: AUSTIN

First financings have also declined considerably in number through the
end of 2016 but value has remained stable
First-time financings of Austin MSA-based startups
$150
$148
$167
$105
$103
$119
$249
$103
$197
$189
$144
2539 38
43
55 5765
9687 85
49
2006 2007 2008 2009 2010 2011 2012 2013 2014 2015 2016
Deal Value ($M) # of Deals Closed
Source: PitchBook
Activity may be declining, but median sums invested
remain resolutely high
Median venture financing size ($M) in Austin MSA
Valuations are either up or at least staying flat
Median venture financing post valuation ($M) in Austin
MSA
$0.7 $1.0
$3.96 $4.0
$5.9
$9.3
$0.0
$2.0
$4.0
$6.0
$8.0
$10.0
$12.0
2006 2007 2008 2009 2010 2011 2012 2013 2014 2015 2016
Angel/Seed Early Stage VC Later Stage VC
$5.0 $4.5
$20.8 $21.5
$33.5
$60.0
$0.0
$10.0
$20.0
$30.0
$40.0
$50.0
$60.0
$70.0
$80.0
$90.0
2007 2008 2009 2010 2011 2012 2013 2014 2015 2016
Angel/Seed Early Stage VC Later Stage VC
According to the most recent edition
of the Kauffman Index of Startup
Activity, the Austin metro area
ranked first in the US in its rate of
new entrepreneurs and fourth in
terms of startup density (defined as
number of startups per 1,000 firm
population), plus second in growth
entrepreneurship. It should be noted
that the composition of that startup
population is diverse enough that it
may not be exactly representative
of the types of industries that are
likely to attract venture capital—food
vendors such as taco trucks, for
instance. The strong supply of new
business formation makes sense in the
context of economic data—it’s simply
less expensive to build companies in
Austin. Accordingly, the total supply
of startups likely to vie for funding is
not as much of an issue, from both
quantitative and anecdotal angles.
But inflated financings and valuations
are. Coupled with a decline in
financing activity overall plus a
drop-off in the number of first-time
financings (although VC invested in
first-time rounds is quite robust), the
resolutely high median financing size
and post-valuation—particularly at
the late stage—imply that investors’
supply of capital is still ample, yet the
benchmarks for obtaining financings
of such size have shifted upward. Each
venture ecosystem across the US will
experience somewhat insulated rises in
those metrics, interconnected as they
are by information flow but insulated
somewhat by relative costs and
available/willing sources of capital. It’s
easy to ascribe such a shift to a typical
period in any investment cycle where
Source: PitchBook Source: PitchBook
7 PITCHBOOK 2016 VENTURE ECOSYSTEM FACTBOOK: AUSTIN

Aligning with national trends, early-stage numbers
have been hit hard
Austin MSA VC activity (#) by round size
Capital invested in significantly sized rounds has
declined but not as sharply
Austin MSA VC activity ($M) by round size
$0
$200
$400
$600
$800
$1,000
$1,200
$1,400
$1,600
2007 2008 2009 2010 2011 2012 2013 2014 2015 2016
Under $500K $500K-$1M $1M-$5M
$5M-$10M $10M-$25M $25M+
0
50
100
150
200
250
300
2007 2008 2009 2010 2011 2012 2013 2014 2015 2016
Under $500K $500K-$1M $1M-$5M
$5M-$10M $10M-$25M $25M+
Proportionally, later stages are still resilient yet Series
A financings hit a multiyear low in 2016
Austin MSA VC activity (#) by series
Quite coincidentally, Series B financings saw no less
than $211.5M in total value in 2016
Austin MSA VC activity ($M) by series
Source: PitchBook
investors fear of overexuberance
and oversupply of capital leading to
slumping returns on sums invested
and consequently begin to pull back
somewhat. Thus, once reversion to the
mean has completed, Austin is likely
to see venture financing creep up
once more, barring significant macro
shocks.
However, when it comes to metro-level
analysis, the pipeline of previously
financed companies eligible for
follow-on rounds becomes more
crucial. Sufficient levels of funding
across the entire capital stack has a
greater impact when analyzing overall
activity on a metro scale. There was
a significant ramp-up in seed-stage
financings in tandem with a much
more modest increase in Series A
fundings across the past few years,
for example. This increase doubtless
already fed into Series A financings
that are occurring now. Yet any
potential slump in the seed stage such
as that which was observed in 2016
through late November could portend
ill for the width of the startup pipeline
when it comes to Series A funding
down the line. Such a phenomenon
could well have come into effect in
2016 already, happening to any given
series of financing and subsequent
rounds. Accordingly, with overall
supply not being an issue yet the
benchmarks of quality for startups to
garner venture financing having moved
upward in a highly valued climate, the
0
20
40
60
80
100
120
140
160
180
200
2007 2008 2009 2010 2011 2012 2013 2014 2015 2016
Seed Series A Series B
Series C Series D+
$0.0
$200.0
$400.0
$600.0
$800.0
$1,000.0
$1,200.0
$1,400.0
2007 2008 2009 2010 2011 2012 2013 2014 2015 2016
Seed Series A Series B
Series C Series D+
Source: PitchBook
Source: PitchBookSource: PitchBook
8 PITCHBOOK 2016 VENTURE ECOSYSTEM FACTBOOK: AUSTIN

Austin MSA VC activity ($M) by sector
Austin MSA VC activity (#) by sector
0%
20%
40%
60%
80%
100%
2010 2011 2012 2013 2014 2015 2016
CommercialServicesConsumer Goods& RecreationEnergy
HC Devices &SuppliesHC Services &SystemsIT Hardware
Media
Other
Pharma & Biotech
Software
0%
20%
40%
60%
80%
100%
2010 2011 2012 2013 2014 2015 2016
CommercialServicesConsumer Goods& RecreationEnergy
HC Devices &SuppliesHC Services &SystemsIT Hardware
Media
Other
Pharma & Biotech
Software
Source: PitchBook
Austin MSA VC activity in healthcare devices & services
$14
$55
$103
$16
$48
$29
$71
$114
$27
$37
$23
4
5
8 8
10
7
9 9
6
1211
2006 2007 2008 2009 2010 2011 2012 2013 2014 2015 2016
Deal Value ($M) # of Deals Closed
stutter in the startup pipeline could
lead to repercussions in the years to
come for the Austin area.
However, the timeline of supply is
also regulated by ongoing startup
activity within sectors more primed
to attract venture investors’ interest.
Particularly analyzing within an
ecosystem framework, the formation
of sizable new educational institutions
or headquarters relocations of major
companies plays into such associated
startup formation considerably. The
opening of the new Dell Seton Medical
Center as well as the establishment
of a nonprofit—Capital City
Innovation—that will target connecting
entrepreneurs with the healthcare
research and development efforts at
the new center could help engender
the creation of new healthcare-
related startups. Anecdotally, the
healthcare sector pipeline is still
underrepresented in Austin—if not
the nation—as of late in the gradual
recovery since the financial crisis,
barring a gradual uptick in Austin over
the past few years. Sector diversity
within a venture ecosystem matters
more and more nowadays for long-
term health. Particularly as the lines
between various sectors blur with
advances in enterprise-specific
software programs and advances in
certain hardware segments, a truly
thriving venture/startup ecosystem will
see more startups geared toward such
confluences. Similar interactions are
crucial for sectors apart from general
consumer and enterprise software,
which have benefited more directly
than most from the dramatic decrease
in launching costs over the past 15
years. Examples include startups
targeting medical records systems in
particular with tailored capabilities as
opposed to, say, a general filesharing
service like Dropbox.
Drawing outside investment is critical
Source: PitchBook
Source: PitchBook
9 PITCHBOOK 2016 VENTURE ECOSYSTEM FACTBOOK: AUSTIN
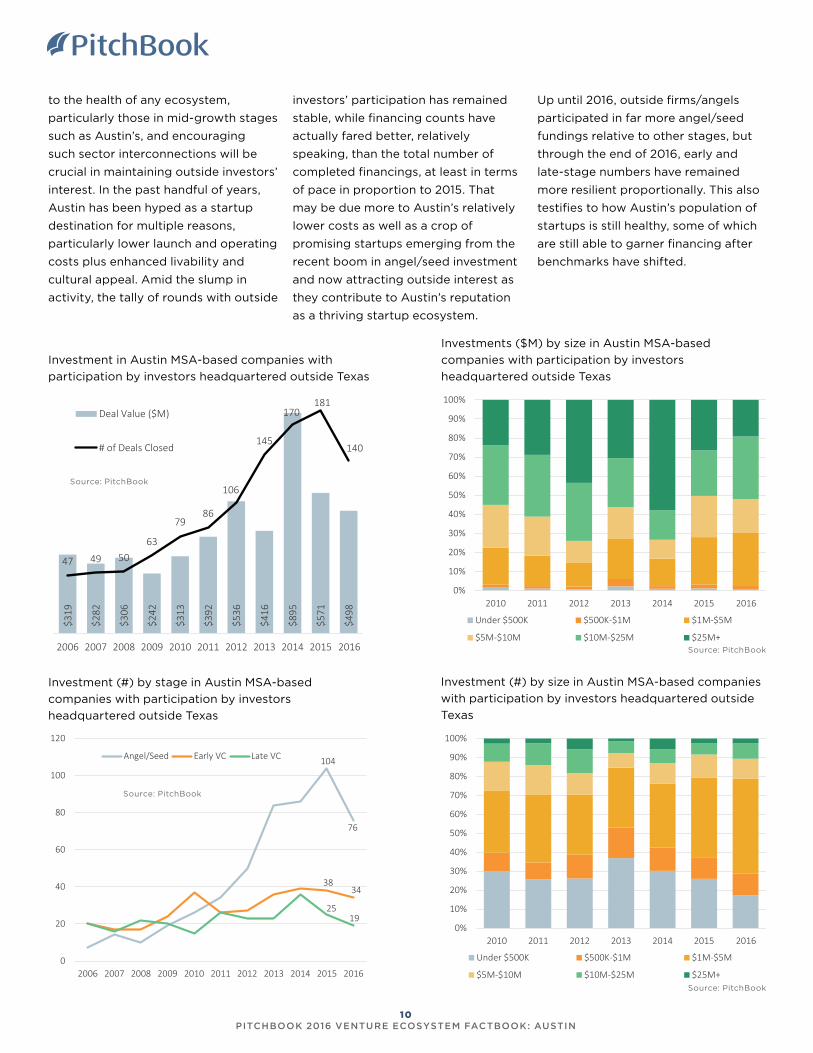
Investment in Austin MSA-based companies with
participation by investors headquartered outside Texas
Investments ($M) by size in Austin MSA-based
companies with participation by investors
headquartered outside Texas
$319
$282
$306
$242
$313
$392
$536
$416
$895
$571
$498
47 49 5063
7986
106
145
170181
140
2006 2007 2008 2009 2010 2011 2012 2013 2014 2015 2016
Deal Value ($M)
# of Deals Closed
0%
10%
20%
30%
40%
50%
60%
70%
80%
90%
100%
2010 2011 2012 2013 2014 2015 2016
Under $500K $500K-$1M $1M-$5M
$5M-$10M $10M-$25M $25M+
Investment (#) by size in Austin MSA-based companies
with participation by investors headquartered outside
Texas
0%
10%
20%
30%
40%
50%
60%
70%
80%
90%
100%
2010 2011 2012 2013 2014 2015 2016
Under $500K $500K-$1M $1M-$5M
$5M-$10M $10M-$25M $25M+
Investment (#) by stage in Austin MSA-based
companies with participation by investors
headquartered outside Texas
104
76
3834
2519
0
20
40
60
80
100
120
2006 2007 2008 2009 2010 2011 2012 2013 2014 2015 2016
Angel/Seed Early VC Late VC
to the health of any ecosystem,
particularly those in mid-growth stages
such as Austin’s, and encouraging
such sector interconnections will be
crucial in maintaining outside investors’
interest. In the past handful of years,
Austin has been hyped as a startup
destination for multiple reasons,
particularly lower launch and operating
costs plus enhanced livability and
cultural appeal. Amid the slump in
activity, the tally of rounds with outside
investors’ participation has remained
stable, while financing counts have
actually fared better, relatively
speaking, than the total number of
completed financings, at least in terms
of pace in proportion to 2015. That
may be due more to Austin’s relatively
lower costs as well as a crop of
promising startups emerging from the
recent boom in angel/seed investment
and now attracting outside interest as
they contribute to Austin’s reputation
as a thriving startup ecosystem.
Up until 2016, outside firms/angels
participated in far more angel/seed
fundings relative to other stages, but
through the end of 2016, early and
late-stage numbers have remained
more resilient proportionally. This also
testifies to how Austin’s population of
startups is still healthy, some of which
are still able to garner financing after
benchmarks have shifted.
Source: PitchBook
Source: PitchBook
Source: PitchBook
Source: PitchBook
10 PITCHBOOK 2016 VENTURE ECOSYSTEM FACTBOOK: AUSTIN

Exits & fundraisingDatasets of venture-backed exits and local venture fundraising in Austin
Given the historical scale of Austin exits, activity in 2016 has been
relatively healthy, although value was toward the lower end
Venture-backed exits of Austin MSA-based companies
$190
$156
$391
$986
$859
$604
$520
$502
$254
$530
$361
12
7
12
14
19 18
23
19
24
1817
2006 2007 2008 2009 2010 2011 2012 2013 2014 2015 2016
Exit Value ($M) # of Exits
Corporate buyers still shell out the most, however
Venture-backed exits ($M) by type of Austin MSA-
based companies
Interestingly, acquisitions are at a decade low
Venture-backed exits (#) by type of Austin MSA-based
companies
0%
10%
20%
30%
40%
50%
60%
70%
80%
90%
100%
2006 2007 2008 2009 2010 2011 2012 2013 2014 2015 2016Acquisition Buyout IPO
0%
10%
20%
30%
40%
50%
60%
70%
80%
90%
100%
2006 2007 2008 2009 2010 2011 2012 2013 2014 2015 2016Acquisition Buyout IPO
A central component of any venture
ecosystem is the recycling of dollars
invested by both LPs and GPs. In
the overall fundraising and investing
cycle, attrition will occur at certain
periods, yet if long-term fund
economics do not work out, with
fund investors eventually getting
their money back, then any local
ecosystem cannot survive. And, to
reiterate an earlier point, without a
reasonably healthy local ecosystem,
outside investment simply will not be
feasible. Accordingly, the relatively
stable level of venture-backed exits of
Austin-based companies in 2016 bodes
well, although the total value exited
is toward the lower end of historical
tallies. However, considering the
natural lag between investment and
exit periods, 2016 exit value is decent
relative to annual sums invested
between 2006 and 2013.
Source: PitchBook
Source: PitchBook Source: PitchBook
11 PITCHBOOK 2016 VENTURE ECOSYSTEM FACTBOOK: AUSTIN

A clear majority of exit value in several sizable sales
Venture-backed exits of Austin MSA-based companies
($M) by size
A fair number of lucrative exits occurred
Venture-backed exits of Austin MSA-based companies
(#) by size
The peak of domestic fundraising is still carrying forward, given typical
investment lifecycles
Austin MSA venture fundraising
$821
$20
$147
$0 $39
$105
$462
$268
$97
$75
4
1
2 2
3 3
4 4
1 1
2006 2007 2008 2009 2010 2011 2012 2013 2014 2015 2016
Capital Raised ($B)
# of Funds Closed
Source: PitchBook
0%
10%
20%
30%
40%
50%
60%
70%
80%
90%
100%
2006 2007 2008 2009 2010 2011 2012 2013 2014 2015 2016
Under $25M $25M-$50M $50M-$100M $100M-$500M
0%
10%
20%
30%
40%
50%
60%
70%
80%
90%
100%
2006 2007 2008 2009 2010 2011 2012 2013 2014 2015 2016
Under $25M $25M-$50M $50M-$100M $100M-$500M
The timing of fundraising and exit
cycles could be initially presumed
to roughly sync, with a successful
fundraising period overlapping
somewhat with hefty sums exited,
yet the impact of hype cycles and
flourishing local startup scenes should
not be overlooked. Hence the surge in
domestic funds closed between 2013
and 2014. Many of the funds raised
even two to three years ago are likely
still investing, although some are
perhaps nearing the tail end of their
active period. With outside investors
still maintaining a significant presence
in Austin, the role of local firms in
syndicates will still be crucial, yet
not solely responsible for bolstering
investment totals. That said, greater
growth is unlikely to occur without a
ramp-up in domestic fundraising.
Source: PitchBook Source: PitchBook
12 PITCHBOOK 2016 VENTURE ECOSYSTEM FACTBOOK: AUSTIN

Capital Factory 10
Silverton Partners 9
Central Texas Angel Network 9
LiveOak Venture Partners 5
Mercury Fund 5
Wild Basin Investments 5
ATX Seed Ventures 4
Floodgate Fund 4
S3 Ventures 4
Techstars 4
UT Horizon Fund 4
Altos Ventures 3
Founders Fund 3
Frontier Tech Ventures 3
New Science Ventures 3
Noro-Moseley Partners 3
Most active investors in Austin MSA
Venture capitalVenture capital, for the purposes of this report, is defined as institutional investors that have raised a fund structured as a limited
partnership from a group of accredited investors, or a corporate entity making venture capital investments.
ValuationsPre-money valuation: the valuation of a company prior to the round of investment. Post-money valuation: the valuation of a company
following an investment.
Exits
This report includes both full and partial exits via mergers and acquisitions, private equity buyouts and IPOs.
FundraisingThis report includes Austin-based venture capital funds that have held a final close. Funds-of-funds and secondary funds are not
included.
All league tables are compiled using the number of completed VC rounds for Austin MSA or Austin-based companies in 2016 through December 31. To ensure your firm is accurately represented in future PitchBook reports, please contact [email protected].
Source: PitchBook
Company Deal size ($M)Series/stage
Sector Select investors
Pivot3 $55.5 CSystems & info mgmt
Argonaut Private Equity, S3 Ventures
Spredfast $50.1 FMedia & info
servicesRiverwood Capital
Lumos Pharma $34 BDrug
discoveryDeerfield Management
Bigcommerce $30 EBusiness/
productivity software
GGV Capital, American Express Ventures, SoftBank Capital
Silvercar $28 C AutomotiveAudi of America, Austin
Ventures
CognitiveScale $21.8 BSystems & info mgmt
Norwest Venture Partners, Intel Capital
FloSports $21.2 BSocial/
platform software
DCM Ventures, Bertelsmann Digital Media Investments
Twyla $19 ASpecialty
retailGoogle Ventures
OutboundEngine $18 CMedia & info
services
S3 Ventures, Altos Ventures, Silverton
Partners
ESO Solutions $17.7 CMedical records systems
Accel-KKR, Wild Basin Investments
The Zebra $17 AMedia & info
servicesBallast Point Ventures,
Daher Capital
TrendKite $16.3 DBusiness/
productivity software
Adams Street Partners, Mercury Fund
Source: PitchBook
Select league tablesSelect rankings of most active investors and deals in Austin
Select 2016 venture financings of companies headquartered in Austin
13 PITCHBOOK 2016 VENTURE ECOSYSTEM FACTBOOK: AUSTIN

See how the PitchBook Platform can
help your private equity firm close your
next deal.
We do EBITDA multiples,private comps,valuations,market trends,growth metrics.
You build a better portfolio.


