National Centre for Research Methods Working Paper
01/13
Availability and use of UK based ethnicity data for health research Rohini Mathur, Pathways, LSHTM
Emily Grundy, Pathways, University of Cambridge
Liam Smeeth, Pathways, LSHTM
1
Rohini Mathur1, Emily Grundy2, Liam Smeeth1 1 Department of Non-communicable Disease Epidemiology, London School of Hygiene and Tropical Medicine 2 Department of Geography, University of Cambridge March 2013
SUMMARY
The aim of this working paper is to inform researchers of the availability of ethnicity data in
population based datasets which are available for use in epidemiological and social science research.
The paper begins by introducing the concept of ethnicity and problems associated with definition
and classification. Secondly, the paper charts the evolution of ethnicity recording in the UK census
and how this has been incorporated across the NHS. Thirdly, the paper focuses down on to the
relationship between ethnicity and health and describes electronic NHS databases in which routinely
collected ethnicity data are available for research purposes. Finally, the paper briefly reviews existing
work on ethnicity and health which has been undertaken using population wide data from the ONS
Longitudinal Study and NHS databases.
AVAILABILITY AND USE OF UK BASED ETHNICITY DATA FOR HEALTH RESEARCH
2
CONTENTS 1. Introduction ................................................................................................................................................... 3
1.1 Definitions of ethnicity ................................................................................................................................. 3
1.2 Challenges in classifying ethnicity................................................................................................................. 4
2. Evolution of ethnicity recording in the UK Census ....................................................................................... 5
3. The relationship between ethnicity and health ........................................................................................... 9
4. Availability of ethnicity data in Census Microdata .................................................................................... 11
5. Availability of ethnicity data in Electronic NHS Databases ........................................................................ 12
5.1 Primary Care ............................................................................................................................................... 13
5.2 Secondary Care ........................................................................................................................................... 16
6. Current uses of population based ethnicity data for health research ....................................................... 18
6.1 Current uses of routinely recorded ethnicity in the ONS Longitudinal Study............................................. 18
6.2 Current uses of routinely recorded ethnicity in national health care databases ....................................... 19
7. Conclusions .................................................................................................................................................. 20
8. References ................................................................................................................................................... 22
3
1. INTRODUCTION
1.1 DEFINITIONS OF ETHNICITY Historically, the term ethnicity has been used synonymously with ‘race’- the construction of
humankind as being made up of biologically distinct sub-groups. Developed in the 19th century,
theories about ‘race’ were used as a means to justify the superiority of ‘Caucasians’ and policies
supporting imperialism, eugenics and slavery.1-4 However, the notion of race as a genetically
immutable trait has been widely discredited over the past 50 years, in part due to the fall of Nazi
Germany, and definitions of race and ethnicity have diverged considerably.
In contrast to ‘race’ which was defined by those in positions of power and imposed upon others,
ethnicity is now understood to reflect an individual’s own self-identification, which encompasses a
broad range of socially constructed characteristics. As such, ethnic self identification can be fluid
over time, responding to political and cultural forces.5-6 It is now widely recommended that the
concept of ethnicity replace the unscientific concept of ‘race’ in all spheres of research as it is a more
meaningful way of grouping individuals with some shared identity- encompassing, but not limited to,
country of birth, religion, language, cultural practices, and geography.3 5 The UK Department of
Health defines ethnicity as “complex, multifaceted and subjective”, and defined by “a shared history,
a common cultural tradition; a common geographical origin; descent from common ancestors; a
common language; a common religion; and a distinct group within a larger community” (p18).7
Ethnic identity can evolve both within individuals over time and between generations. This is
particularly salient for countries such as the UK where historic changes in migration patterns over
the past century have increased the ethnic diversity of the population and created new ethnic
categories for later generations born in the UK. For example, first generation migrants may identify
ethnically with their home country, while their offspring may identify more strongly with newer
social networks, though both these may adapt over time. Similarly, children born to parents from
different ethnic origins may identify with either parent or create a new identity for themselves.
The UK differs from the USA in that there is no legal requirement for the inclusion of ethnic minority
groups in publicly funded research which can provide the evidence base for guidance and policy
tailored to ethnically diverse populations.8 Furthermore, much previous research on the UK
population has not considered ethnicity as an explanatory variable of interest, and thus has not been
able to investigate ethnic inequalities.9 Moreover, there are concerns about the quality of some of
4
the previous research that has been undertaken with some researchers failing to explicitly report
how their ethnic categories have been derived, which concepts they are intended to represent and
what role they expect ethnicity to play in the phenomenon under study.10-11
1.2 CHALLENGES IN CLASSIFYING ETHNICITY One of the conceptual challenges of disaggregating populations by ethnicity is the way in which
ethnic groups are defined and understood. Ethnic groups themselves should not be considered to be
homogeneous as it is well established that high level groupings can conceal significant
heterogeneity.12-13 In both the USA and the UK it has been acknowledged that the ethnic categories
used in official statistics are, to some extent, arbitrary and have been selected primarily for
pragmatic reasons; The US directive for the collection of race and ethnicity data states “These
classifications should not be interpreted as being scientific or anthropological in nature”.3 14 Indeed,
one of the concerns about the original ethnicity question considered for use in the UK 1981 Census
was that:
“The question confused colour with ethnic and national origin and the category “white” in
particular would be open to sensational and damaging treatment in the popular Press (page
12).”15
There is no way to create a classification scheme that is valid and meaningful across all contexts, as
the relevance and validity of ethnic categories depends entirely upon the context in which they are
used. This provides a challenge when conducting epidemiological research into ethnicity where
categories for explanatory variables must be meaningful, discrete and fixed in order to be
interpretable. In order to effectively investigate ethnicity- it must be operationalized into practical
analytical categories which are understood to encompass the rich variety of concepts, but are
however constrained by the time and socio-cultural context in which they were developed.16 A
further important pragmatic consideration is that categories used must allow identification of
groupings large enough for meaningful statistical analysis.
Just as individuals can change their ethnic identity over time, so too has the classification of ethnicity
evolved, with more categories being included in standard classifications, reflecting numerical growth
in representation of certain groups on the one hand, and on the other more nuanced understanding
of meaningful categories. Provided that researchers recognize the limitations of categories and
approach them critically, the study of ethnic differences can provide vital information about the
5
patterns of health and social indicators and provide an essential foundation for tackling inequalities
between different populations. As articulated by Mason (1990):
“We should not be afraid to use categories which are not embraced by actors themselves if these
can illuminate patterns of disadvantage and domination. We must, however, be clear when we
are doing so and not imply that these categories coincide with the identities of those to whom
they refer.”17
2. EVOLUTION OF ETHNICITY RECORDING IN THE UK CENSUS The origins of the modern system of ethnic group data collection in the UK can be traced to the
Census Act of 1920 which recommended that ‘race and nationality’ statistics be collected as part of
the census for Great Britain in order to better understand the needs and circumstances of the
population18. However, at the time, it was felt that the existing question on country of birth, which
had been used since 1841, was sufficient; the recommendation would not be acted on for another
60 years.
In lieu of a national programme to capture ethnicity information for the whole population, the
collection of ethnic statistics was incorporated into national surveys, the first of which was the
General Household Survey for Great Britain. Launched in 1971, the GHS captured information on
aspects of family life, education, health and employment in order to inform social policy and
resource allocation by the government. Contrary to principles widely held today, the GHS required
that ethnicity be assigned by the interviewer, who was asked to record whether, upon visual
inspection, the respondents appeared “White”, “Coloured”, or “Unknown”. If a child was unseen, his
or her ethnicity was “imputed” from that of their parents. Self classification of ethnic origin was
eventually introduced to the GHS in 1983 and used until the survey’s close in 2012.19-22.
The 1981 Census
The question of recording ethnicity in the census was revisited in the years leading up to the 1981
Census when it became clear that country of birth was no longer sufficient for tracking the growth of
the increasingly diverse UK population. As an interim measure, a question on parent’s country of
birth was included in the 1971 Census, with the intention of deriving ethnicity indirectly. However,
6
large scale immigration from both the Commonwealth and Europe dating back to the 1950’s meant
that questions on country of birth, and parent’s country of birth were less relevant given the growth
in second and third generation ethnic minority populations born in the UK. Despite extensive pilot
testing and the development of a draft question, the plan to incorporate an ethnicity question was
eventually abandoned due to strong opposition from civilian groups and the poor acceptability of
the question to Afro-Caribbean populations following tensions in the 1970’s.23-24
Following the 1981 Census, an enquiry by the House of Commons Home Affairs Committee on Race
Relations concluded that questions on ethnicity and language should be included in the 1991
Census. A House of Commons Select Committee Report set out the positive aspects of monitoring
ethnic information, stating:
“The object of asking ethnic questions is, in conjunction with other indicators of general
disadvantage, to assist Government and local authorities to identify and work against all
aspects of racial disadvantage and racial discrimination.”25
The 1991 Census
Bolstered by high levels of support from the 1989 post enumeration survey, a question on ethnicity
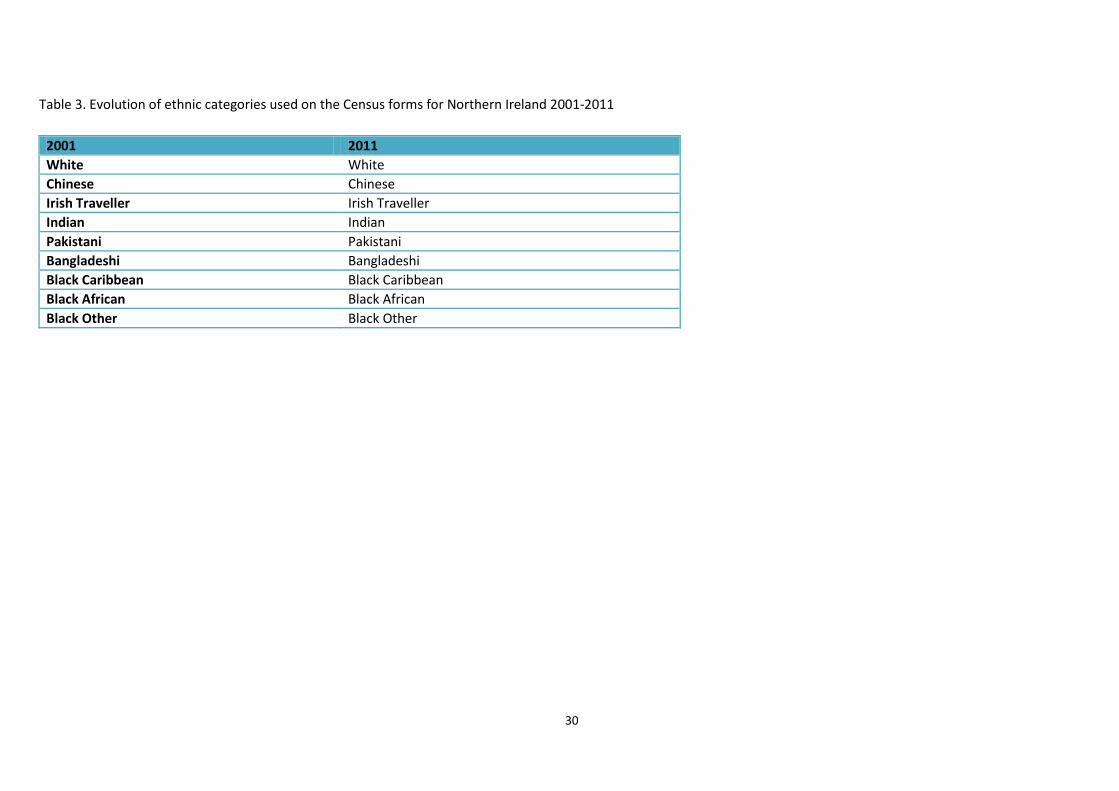
was added to the 1991 Census for England, Wales, and Scotland, but not Northern Ireland, where a
question on ethnicity was introduced in 2001.26-28 The term “ethnic group” was used instead of
“ethnic origin”- which was found to be less acceptable to respondents. 29
The concept of ethnicity adopted by the census was, and remains, that of self classification as
recommended by the Commission for Racial Equality, ensuring that ethnicity refers to the
individuals’ self perception, rather than how they appear to others.24
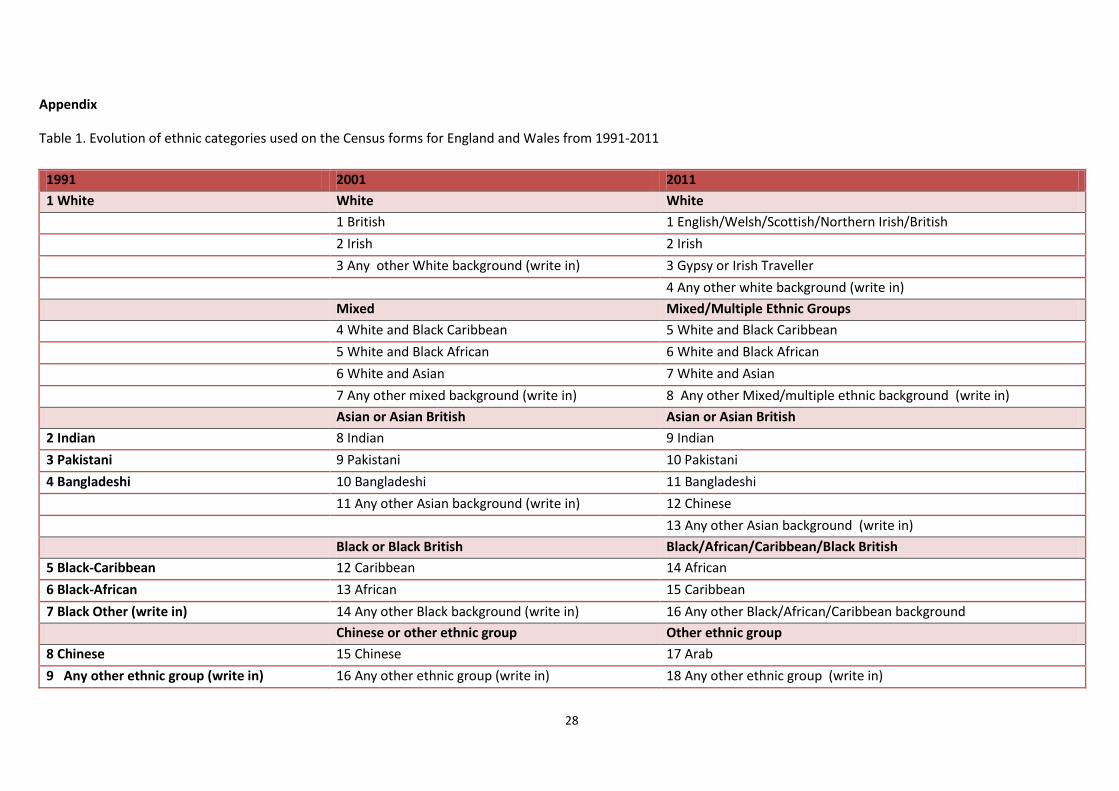
In 1991, the ethnic group question for Great Britain consisted of seven pre-coded categories visible
on the household form plus 28 additional ethnic groups derived from any multi-ticking of the boxes
and the written descriptions given in “Black other” and “other” ethnic group boxes (Table 1). Written
descriptions which had the same or similar meaning to one of the pre-coded categories were
assigned the relevant code between 0 and 6. Written responses for ‘black other’ were assigned a
code between 7 and 17, while written responses for “any other ethnic group” were allocated a code
between 18 and 34.30 In the 1991 Census, 98.6% of respondents selected a pre-coded category while
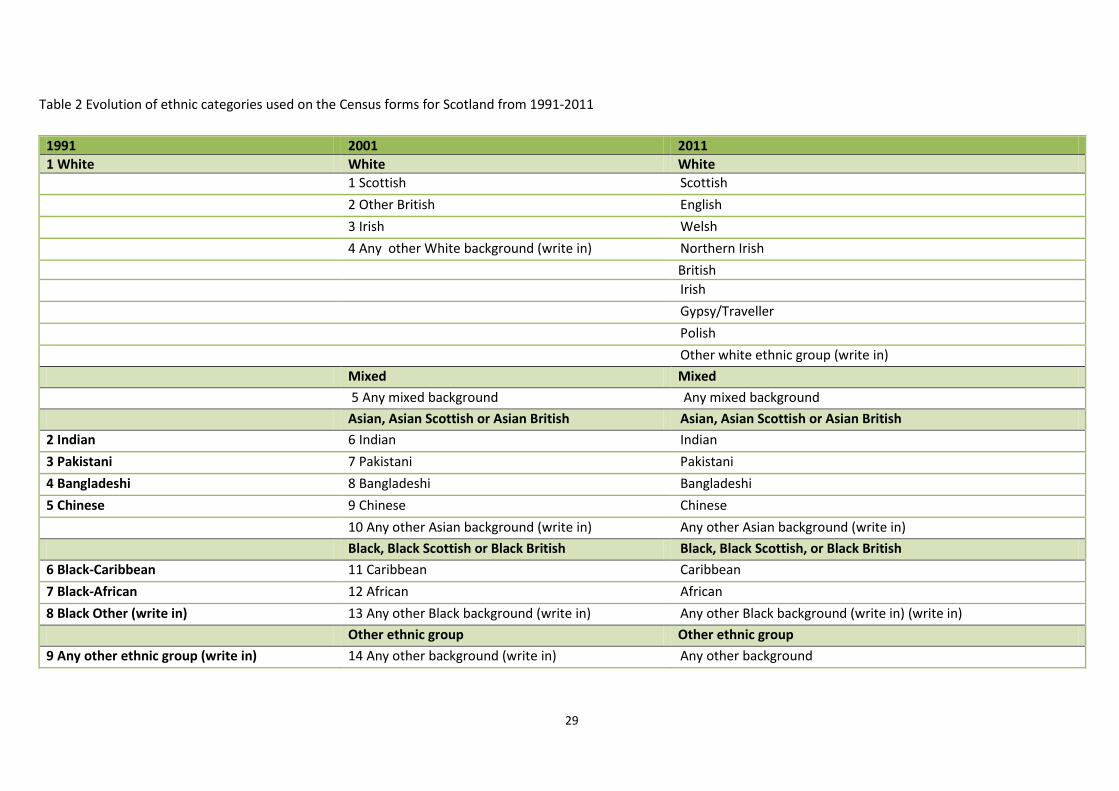
1.4% specified their ethnic group in the free text area.23 Output from the 1991 Census was collapsed
7
into 10 categories. In Scotland, this was further reduced to 4 categories. Many outputs from the
1991 Census also included a “born in Ireland” category derived from the country of birth question.
There is criticism that the 1991 ethnic group question was too limited and managed only to separate
“non-white” ethnic groups from the “white” non-ethnic majority- separating out Black and south
Asian groups, but grouping together “White” populations despite known heterogeneity in terms of
health and social circumstances.3 22 31 Furthermore, it did not allow individuals to identify themselves
as British, regardless of their geographic or ancestral origin.23 32 For example, 26% of the free text
responses under the “Black-other” category stated “British”. 32
The 2001 Census
In response to lobbying for the recognition of the poor social conditions for Irish populations born
both inside and outside Great Britain, the 2001 Census expanded the White category to differentiate
British, Irish and ‘Other’ white. The other significant change from the 1991 Census was the addition
of a mixed ethnicity category, which recognized the significant population of individuals born to
parents of different ethnic groups.16 This increased the number of ethnic group categories to 16 in
England and Wales, 14 in Scotland and 12 in Northern Ireland.33 Religion was added for the first
time to the 2001 Census for Great Britain as an optional question. Pilot testing of the 2001 Census
found that some respondents felt that religion was a more useful indicator, particularly for
individuals from south Asia and Ireland, where religion may form the primary measure of identity
instead of ethnicity .34
The 2011 Census
In the recently completed 2011 Census, the White category was further expanded to incorporate
Gypsy or Irish Traveller. Furthermore, Chinese ethnicity was reclassified from the ‘other’ group to
Asian, while a new category for Arab was added to the other group. In the previous 2001 Census,
only people selecting “White” ethnicity could identify as “British”. This problem was addressed in the
2011 Census by creating a distinct question for national identity; thus respondents could identify
themselves as British, or any other nationality, independently of ethnicity. 35 According to the 2001
Census for England and Wales, 8% of the UK population identified themselves as members of
minority ethnic groups. Furthermore, 8% of the population of England and Wales in 2001 was born
out of the UK; half of this group classified themselves as non-white.
8
The UK is now one of the few countries in Europe that emphasizes the need for positive action to
promote equality via the collection of official ethnic group statistics. In a recent review of practices
of data collection in censuses across Europe, only 5 out of 35 countries surveyed across Europe
collected ethnicity data in the most recent census, of which the UK was one.36 Since the Race
Relations Act of 1968, the official collection of ethnic group statistics has been mandated as an
essential first step towards identifying and overcoming ethnic inequalities.37-42
Geographical Harmonisation
The ethnic categories and terminology used in England, Wales, Scotland, and Northern Ireland differ
slightly based on local requirements. When compiling or comparing statistics across Great Britain
and the UK, these data are harmonised by the office for national statistics and presented in high
level groupings (ONS).
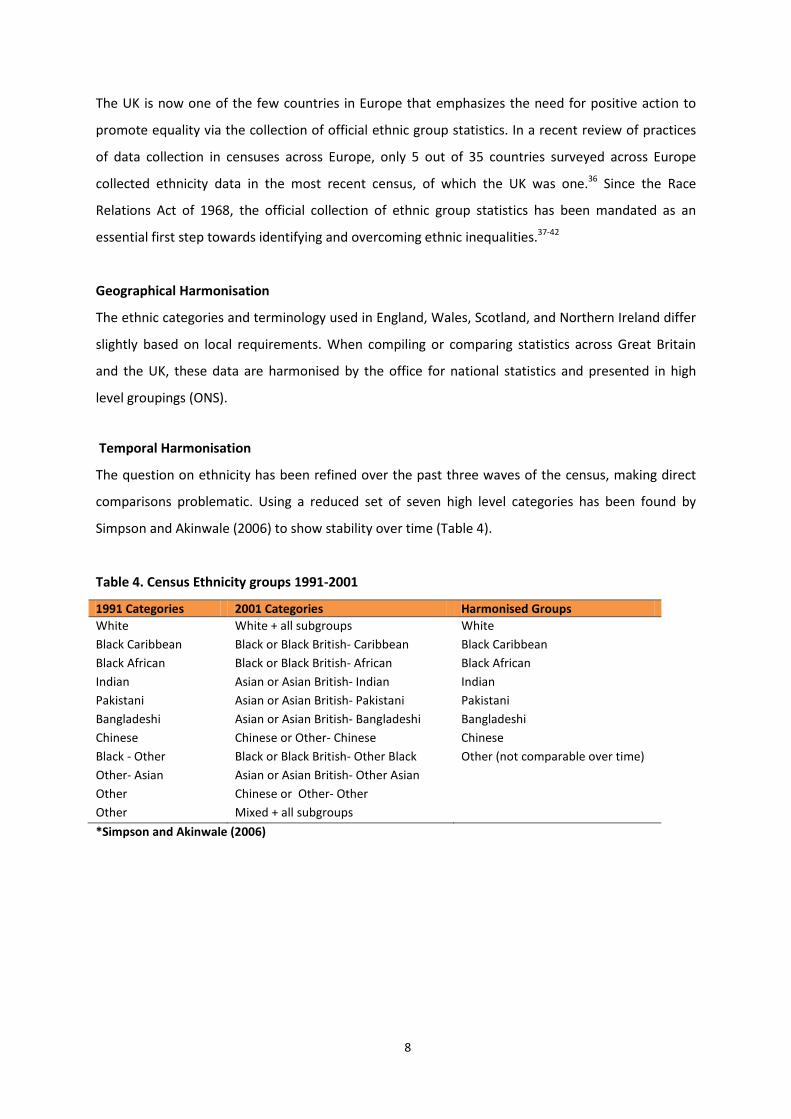
Temporal Harmonisation
The question on ethnicity has been refined over the past three waves of the census, making direct
comparisons problematic. Using a reduced set of seven high level categories has been found by
Simpson and Akinwale (2006) to show stability over time (Table 4).
Table 4. Census Ethnicity groups 1991-2001
1991 Categories 2001 Categories Harmonised Groups White White + all subgroups White Black Caribbean Black or Black British- Caribbean Black Caribbean Black African Black or Black British- African Black African Indian Asian or Asian British- Indian Indian Pakistani Asian or Asian British- Pakistani Pakistani Bangladeshi Asian or Asian British- Bangladeshi Bangladeshi Chinese Chinese or Other- Chinese Chinese Black - Other Black or Black British- Other Black Other (not comparable over time) Other- Asian Asian or Asian British- Other Asian Other Chinese or Other- Other Other Mixed + all subgroups *Simpson and Akinwale (2006)
9
3. THE RELATIONSHIP BETWEEN ETHNICITY AND HEALTH
In health research, ethnicity can provide valuable information about shared exposures for individuals
with similar geographic origin, culture, language, beliefs about and access to health services. Across
the UK, large-scale surveys have shown that minority ethnic groups experience higher rates of
disease and poorer health related outcomes than the ‘White British’ population; In particular, rates
of cardiovascular disease and diabetes are higher in these groups, with disease onset at younger
ages, and at lower levels of risk.43-4624478
When hypothesizing about and interpreting the mechanisms through which ethnicity is related to
health, it is essential to be clear that health outcomes are determined by factors associated with
ethnicity, not ethnicity itself. The distribution of these factors, such as genetic influences, socio-
economic deprivation, migration status, cultural practices, and lifestyle manifest unequally in
different population groups, and can be conceptualized broadly as ethnic differences.
Genetic influences
It is widely accepted that genetically distinct races are a myth, and that the genetic diversity within
so called “races” is greater than that between races. Thus defining how ethnicity as a social
construct impacts upon health and healthcare use is complicated. Though current uses of the
ethnicity as a variable of interest focus on social causes, this does not preclude the existence of
some pertinent genetic variation which can influence health. For example, the prevalence of the
BrCA gene for breast cancer is higher amongst Ashkenazi Jewish populations, while the prevalence
of the gene for sickle cell trait is highest amongst populations from Southern Europe, Africa, and the
Caribbean.48-49 Similarly, biological differences related to ethnicity are now being recognized and
incorporated into evidence based guidelines for clinical practice in the UK. Examples include the
increased predisposition to type 2 diabetes and cardiovascular disease amongst South Asian groups-
which has prompted the recommendation for the use of different thresholds for overweight and
obesity in this population. 50-51
Socio-economic deprivation
There is a well established social gradient in health, with individuals of lowest socio-economic
position experiencing poorer health outcomes than less deprived groups.52 Experiences of
deprivation differ between ethnic groups, with individuals from some ethnic minority populations
more likely to live in deprived neighbourhoods and be unemployed than the general
10
population.52 These ethnic disparities in health are inextricably linked to socioeconomic factors, with
ethnic minority groups more likely to live in the most deprived boroughs of England53. For example,
maps illustrating ‘hot spots’ for diabetes risk in east London highlight not only the uniformly
elevated risk for South Asian individuals across the borough but also reveal remarkable similarities to
the poverty maps created in the late 19th Century.54 Earlier research into the relationship between
ethnicity and deprivation has often assumed that the all ethnic groups experience disadvantage
equally. However, research based on the UK Census shows that while Bangladeshi and African
populations are more likely to live in deprived areas, Indian and Chinese groups live in more affluent
areas and experience less material deprivation.55
Migration
Though individuals mostly migrate to improve life for themselves and their families, the experience
can often have negative influences on health; In addition to the physical and psycho-social stress of
relocating to a place where limited language skills and lack of social network may limit economic
opportunities, migrant groups may also experience stigma and prejudice, increasing the likelihood of
poor health outcomes among this population 56. Furthermore, new immigrants are more likely than
the host population to live in areas of high deprivation such as inner cities and have poor access to
health and social services.57-58
These experiences may counter any initial advantage that new migrants may experience via the
‘healthy migrant effect’, which hypothesizes that individuals who migrate long distances, particularly
internationally, are healthier, better educated and less disadvantaged than those who remain in the
home country.59-60 This health selection effect is evidenced in lower mortality and chronic disease
prevalence amongst first generation migrants compared to those in the host country.59 61 However,
over time the process of ‘acculturation’, or the adoption of local lifestyle, dietary, and cultural
practices, as well as the ‘wearing off; of initial selective influences, may cause the health profile of
migrant populations and their descendents to converge with that of the host population. 56 59
Cultural practices and lifestyle
Shared cultural norms around health seeking behaviours, diet and exercise, and religious practices
may directly impact health in both positive and negative ways; For example, the fourth Health
Survey for England found that while rates of smoking are higher in Bangladeshi men compared to
other men in England, over 90% of all Bangladeshi adults are non-drinkers.
11
4. AVAILABILITY OF ETHNICITY DATA IN CENSUS MICRODATA
Ethnicity data are available for the whole UK population at an aggregate level, and at an individual
level for smaller samples of the population. Two particular census datasets of interest when
examining health outcomes and ethnicity are the Samples of Individual Person-Level records (SARs)
and the Office for National Statistics (ONS) Longitudinal study of England and Wales (LS).
SARS data have been available since 1991 and are made up of anonymised individual level records
with high levels of detail for socio-demographic, household, and geographical information for each
individual. These data cannot be linked over time, but do provide large cross-sectional cuts of the
Census return. The SARs for 2001 contained information for 1.8 million individuals, representing 3%
of all records that year.62
The ONS Longitudinal Study links data from the previous five censuses with demographic events of
births, deaths, and cancer registrations. The data set also includes information on birth weight and
deaths among infants born to sample members and birth weight of new sample members joining the
study at birth. The sample constitutes approximately 1% of the England & Wales population and is
selected based on four birthdates during the year. 63 . Events are added to the LS via the NHS Central
Register which includes registration and de-registration from a doctor, deaths, and cancer
registrations.64 Two ‘sister’ studies covering Scotland and Northern Ireland respectively have
subsequently been established. The Scottish Longitudinal Study (SLS) includes records from the 1991
and subsequent Censuses linked, as with the main ONS LS to vital registration data and additionally
to hospital admission and discharge data.65 The Northern Ireland Longitudinal Study (NILs) dates
from the 2001 Census and includes potential linkage for specified projects to a wider range of health
and social care data, including prescription, cancer screening and dental service records, subject to
specific ethical and legal approval.66
12
5. AVAILABILITY OF ETHNICITY DATA IN ELECTRONIC NHS DATABASES
In the UK, population based research into the relationship between ethnicity and health is typically
conducted either using Census data, large-scale surveys, or computerised medical records collected
throughout the NHS. The availability of ethnicity data in census outputs and large-scale social
surveys across the UK has been detailed extensively by the Economic and Social Data Service.67 The
section below describes briefly the ethnicity data held in computerised databases across the
National Health Service.
The services provided by the National Health Service in the UK fall into two broad categories;
primary care services include all care provided by general practitioners, dentists, community
pharmacies, community nurses, and optometrists. Secondary care services encompass all care
administered in hospital settings by both NHS and private providers.
Although ethnicity recording was mandated across the National Health Service in 1991 alongside the
Census, until recently, electronic health records have been of limited use for examining associations
between ethnicity and health due to the poor completeness and quality of the data.68-69 Instead,
past studies exploring ethnicity have variously ascribed patient ethnicity indirectly via name-
recognition software or by estimating ethnic population size from Census data. Both these methods
are of questionable validity, particularly for individuals of mixed ethnicity and for descendents of
migrants70-73. However, individual level ethnicity data is becoming increasingly available in both
primary and secondary care data sources, providing a novel opportunity to conduct research across
the whole of the UK population into ethnic differences in the healthcare usage and outcomes.
The UK has the advantage of near-universal registration with general practitioners, around 98% of
the entire population. As such, analyses of the registered patient population are widely
representative, though notable exceptions include homeless populations, who are less likely to
access GP services, and special populations such as the armed forces and prison populations.74-75
Additional linkages to secondary care data, disease registries, surveys and vital statistics give these
databases unique value for observational studies and increasingly for pragmatic clinical trials.76-81

13
5.1 PRIMARY CARE
The computerization of health care records across both primary care and secondary care has
generated enormous potential for population based research on morbidity and the use of health
services. The movement to computerised health records in primary care began in the 1980’s and
was supported by government funding for primary care computers and the introduction of financial
incentives to reach targets which were most easily illustrated using computerised records.82
The recording of ethnicity data in primary care was introduced across the UK in 1991 at the same
time as the introduction of questions on ethnicity in the Census. Initially, the usability of ethnic
group data coded in electronic health records was low- primarily due to poor data quality stemming
from incomplete and inaccurate recording.73 Within primary care, the incentivisation of ethnicity
recording under the Quality and Outcomes Framework in 2004 dramatically increased recording to
levels of over 90% for all newly registered patients.83-84 The QOF is a voluntary annual reward
scheme that was introduced in 2004 to incentivise achievements of targets for clinical care in
general practices.85 Under the scheme, general practices were awarded £125 annually for achieving
a target of recording ethnicity for 100% of newly registered patients33 34. In 2008 this scheme was
replaced with a new enhanced service scheme which remunerated practices with 5.6 pence per
patient for recording ethnicity and first language in all new registrations.84 The recording of ethnicity
was removed from the programme in April 2011 as it is now expected that general practices will
record ethnicity, along with first language, routinely in order to meet the needs of their registered
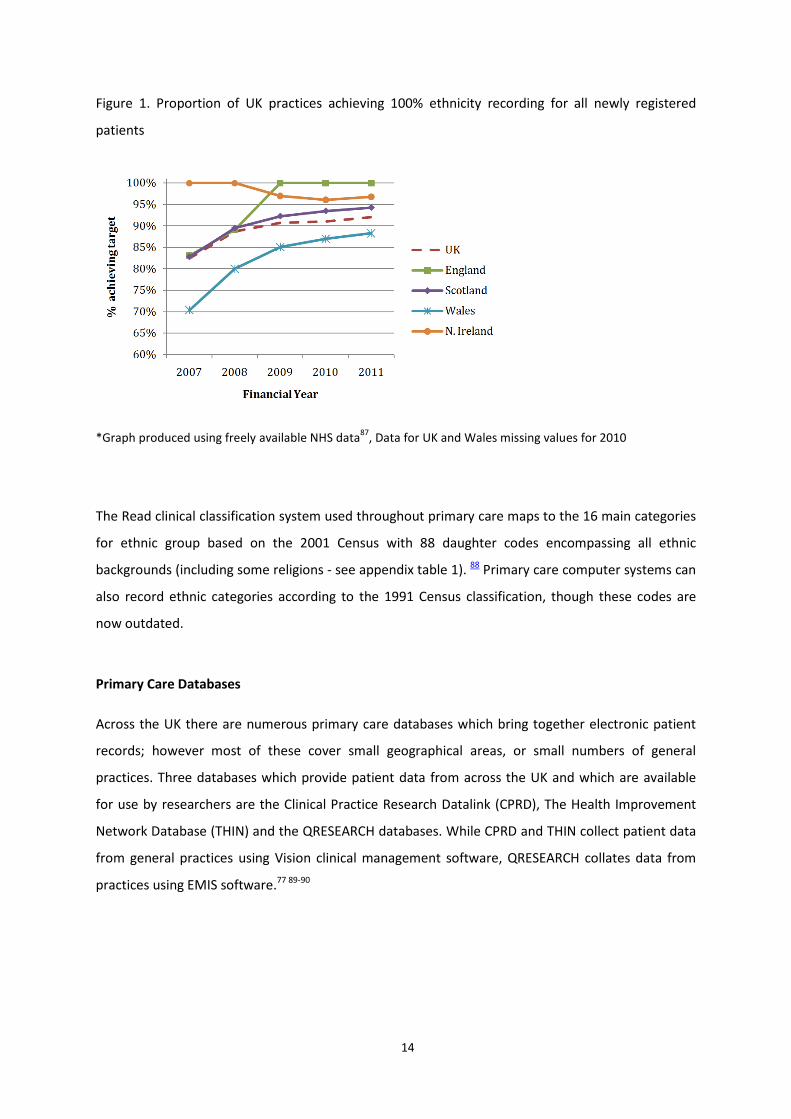
populations.86 Publicly available QOF outcomes data shows that, as of 2011, over 90% of UK
practices are recording ethnicity for all of their newly registered patients (Figure 1).
14
Figure 1. Proportion of UK practices achieving 100% ethnicity recording for all newly registered
patients
*Graph produced using freely available NHS data87, Data for UK and Wales missing values for 2010
The Read clinical classification system used throughout primary care maps to the 16 main categories
for ethnic group based on the 2001 Census with 88 daughter codes encompassing all ethnic
backgrounds (including some religions - see appendix table 1). 88 Primary care computer systems can
also record ethnic categories according to the 1991 Census classification, though these codes are
now outdated.
Primary Care Databases
Across the UK there are numerous primary care databases which bring together electronic patient
records; however most of these cover small geographical areas, or small numbers of general
practices. Three databases which provide patient data from across the UK and which are available
for use by researchers are the Clinical Practice Research Datalink (CPRD), The Health Improvement
Network Database (THIN) and the QRESEARCH databases. While CPRD and THIN collect patient data
from general practices using Vision clinical management software, QRESEARCH collates data from
practices using EMIS software.77 89-90
15
Clinical Practice Research Datalink (CPRD)
The CPRD (previously the General Practice Research Database) is a clinical research database which
was initially set up in 1987 as a commercial data bank by the company VAMP (Value Added Medical
Products).90-91 Now run by the Medicines and Health Care products Regulatory Agency, the CPRD
contains longitudinal primary care records for approximately 3.4 million patients registered with
around 500 practices using Vision clinical software across the UK. Continuous observational data has
been collected in most practices for over six years yielding over 30 million patient years of
observation.92
Practices are required to record a minimum of 95% of prescribing and relevant patient encounter
events. Data from practices are routinely validated by internal checks. 93 Practices that meet the
quality standard are flagged as being “up to standard”, indicating that their data is suitable for
research. The first practice to meet these quality criteria did so in 1987, with most practices reaching
the same level of quality by 1991. Practices input data onto their standard systems and download
anonymised data every 6 weeks which the CPRD then append monthly to the continually growing
database.90
Ethnicity data has been available in the CPRD since its inception, with recording practices in line with
NHS data reporting requirements for primary care.
The Health Improvement Network Database (THIN)
The THIN primary care research database was formed in May 2002 with data collection started in
2003.91 THIN provides anonymised clinical data from 420 general practices using Vision software in
England, Scotland, Wales and Northern Ireland. The database includes a nationally representative
sample of 5% of the UK population. As of 2010, THIN had access to 479 practices, 3.7 million active
patients and 9.1 million patients in total.94 Data entered into the THIN database undergoes quality
checks similar to those conducted in CPRD.95 Ethnicity is available in the THIN database using
primary care Read codes which can be grouped into the 16 categories of the 2001 census.
QRESEARCH
The QRESEARCH database was established in 2003 as a joint not-for-profit venture between the
University of Nottingham and Egton Medical Information Systems Ltd (EMIS). The database consists
of fully anonymised health records for over 13 million patients from over 660 practices across the UK
16
.77 96 Ethnicity is available in the QRESEARCH database using primary care Read codes which can be
grouped into the 16 categories of the 2001 census.
5.2 SECONDARY CARE
Hospital episode statistics (HES) have been collected since 1989 on all patients in England receiving
care in NHS or NHS commissioned hospitals (such as private hospitals). Prior to the introduction of
HES, only 10% of admitted patient data was recorded nationally. Data on inpatient episodes has
been available since 1989 while data on accident and emergency admissions has been available
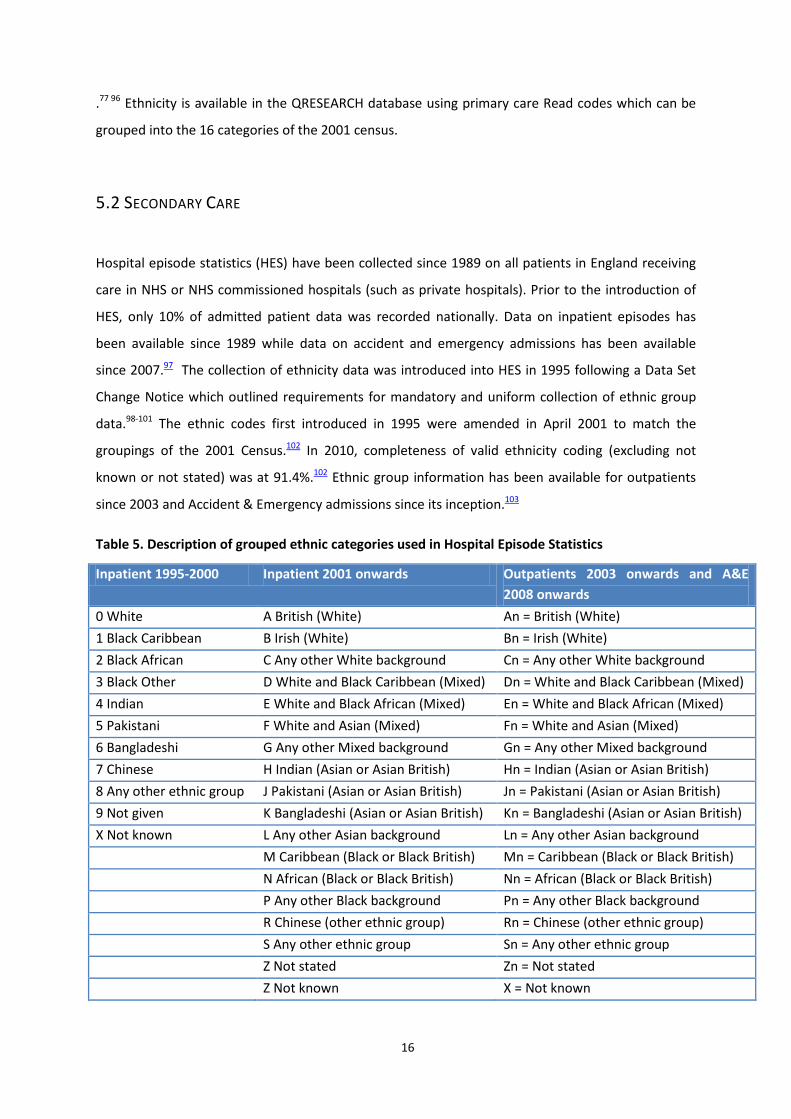
since 2007.97 The collection of ethnicity data was introduced into HES in 1995 following a Data Set
Change Notice which outlined requirements for mandatory and uniform collection of ethnic group
data.98-101 The ethnic codes first introduced in 1995 were amended in April 2001 to match the
groupings of the 2001 Census.102 In 2010, completeness of valid ethnicity coding (excluding not
known or not stated) was at 91.4%.102 Ethnic group information has been available for outpatients
since 2003 and Accident & Emergency admissions since its inception.103
Table 5. Description of grouped ethnic categories used in Hospital Episode Statistics
Inpatient 1995-2000 Inpatient 2001 onwards Outpatients 2003 onwards and A&E 2008 onwards
0 White A British (White) An = British (White) 1 Black Caribbean B Irish (White) Bn = Irish (White) 2 Black African C Any other White background Cn = Any other White background 3 Black Other D White and Black Caribbean (Mixed) Dn = White and Black Caribbean (Mixed) 4 Indian E White and Black African (Mixed) En = White and Black African (Mixed) 5 Pakistani F White and Asian (Mixed) Fn = White and Asian (Mixed) 6 Bangladeshi G Any other Mixed background Gn = Any other Mixed background 7 Chinese H Indian (Asian or Asian British) Hn = Indian (Asian or Asian British) 8 Any other ethnic group J Pakistani (Asian or Asian British) Jn = Pakistani (Asian or Asian British) 9 Not given K Bangladeshi (Asian or Asian British) Kn = Bangladeshi (Asian or Asian British) X Not known L Any other Asian background Ln = Any other Asian background M Caribbean (Black or Black British) Mn = Caribbean (Black or Black British) N African (Black or Black British) Nn = African (Black or Black British) P Any other Black background Pn = Any other Black background R Chinese (other ethnic group) Rn = Chinese (other ethnic group) S Any other ethnic group Sn = Any other ethnic group Z Not stated Zn = Not stated Z Not known X = Not known
17
The 16 ethnic group categories defined by the 2001 Census for England and Wales currently form
the national standard for mandatory ethnicity data collection across the National Health
Service.104105 In 2011, Scotland became the first country in the world to records ethnicity on death
certificates.106 However ethnicity is still not routinely recorded on birth certificates anywhere in the
UK.107
Who records ethnicity information?
In primary care it is expected that ethnicity will be recorded in one of two ways; either the patient
will be asked to fill in a drop down checklist similar to that of the 2001 Census, or the patient will be
asked face to face either by the general practitioner or with other practice staff.7 This can take place
during registration or consultation. In hospital settings, guidelines state that ethnicity should be self-
reported by patients whenever possible, with assistance from relatives, interpreters, and advocates
where necessary.98
18
6. CURRENT USES OF POPULATION BASED ETHNICITY DATA FOR
HEALTH RESEARCH
6.1 CURRENT USES OF ROUTINELY RECORDED ETHNICITY IN THE ONS LONGITUDINAL STUDY
All publications utilizing the ONS Longitudinal Study are listed in a database maintained by the
Centre for Longitudinal Study Information and User Support (CeLSIUS). 108 Of the 648 publications
listed therein, as of January 2013, 22 have examined the relationship between ethnicity and health.
Specifically, these studies explore ethnic differentials in birth weight, cancer, general health109-110,
long term limiting illness111-114, and mortality61 115-124.
Studies of birth weight have found that, in comparison to mothers of White ethnicity, non-White
mothers have an increased risk of having low birth weight babies. 125 Furthermore, this weight
differential persists over generations. 126 A study comparing babies born to Indian versus White
parents has posited that the differences in birth weight are largely due to genetic factors, with
infants of mixed parentage having a birth weight which falls between the two ethnic groups.127
Research into cancer using the LS has focused primarily on the incidence of cancer amongst migrants
born outside England and Wales compared to all individuals in the LS. Since this research uses LS
data pre -dating 1991, country of birth is used to group individuals instead of ethnic group. These
studies have shown great variation in the incidence of cancers by country of birth, with genetics
hypothesised to play a greater role for more recent migrants, and environment for more
longstanding groups such as the Irish and Scottish. 128-130
An examination of ethnic differences in long term limiting illness has shown that rates are increased
in Black and South Asian groups compared to white, and lower amongst Chinese individuals and that
these differences do not attenuate across generations.112-113
Several studies reporting on the mortality of migrants from Ireland and Scotland living in England
and Wales have highlighted increased mortality rates in these two groups compared the whole LS
population.122-123 For individuals of Irish ethnicity, this excess mortality is found across first, second
and third generation migrants in comparison to all other LS members, with the rate of excess
mortality increasing over generations. 115 120 124
19
Turning to mortality of migrants from the rest of the world, research using the LS has confirmed
higher mortality rates in migrants compared to those born in England and Wales, with duration of
residence associated with increased mortality. 61 118 121
6.2 CURRENT USES OF ROUTINELY RECORDED ETHNICITY IN NATIONAL HEALTH CARE
DATABASES
A search of MEDLINE, EMBASE, and Web of Knowledge in February 2012 identified 5 observational
studies using UK wide primary care databases (THIN, and QRESEARCH) and 10 studies utilizing the
Hospital Episode Statistics for England. All five studies set in primary care made use of patient data
across the UK. Of the ten studies set in secondary care, five included patients from the whole of
England, while the remainder selected patients from various regions of the country. In total, six
studies incorporated ethnicity as a factor in a the derivation and validation of risk prediction
models131-136; three studies examined access to and use of secondary care services137-139; two
examined in-patient procedures140-141, three studies focussed on cancer142-144; and one on liver
disease.145
Studies focusing on cancer found that the incidences of oesophageal and testis cancer were highest
in the White population while the incidence of prostate cancer was highest for ethnic minority
men.142-143 In a further study, the incidence of breast cancer was found to be lowest amongst South
Asian women, though no ethnic differences in five year survival were evident. 144
Studies of secondary care usage found that ethnicity was a significant predictor of emergency
hospital admission, or (any) readmission to hospital. Patients of Black and South Asian ethnicity had
lower use of coronary revascularization surgery while Black and South Asian children with cancer
were found to be less likely to die at home. A study by Hacker et al. found no ethnic differences in
their study of waiting times to surgery.138
Studies of disease prevalence and risk uniformly reported increased risk in non-white groups-
particularly South Asian groups for cardiovascular disease, chronic kidney disease, and Type 2
diabetes mellitus.

20
7. CONCLUSIONS
From unscientific beginnings, the concept of ethnicity has evolved to encompass the spectrum of
biological, social, and cultural influences understood to form part of our individual identity. As the
concept has evolved, so has the difficulty with which it can be operationalized into a single variable
for research purposes. In the UK, and indeed worldwide, a pragmatic approach has been undertaken
to create ethnic categories which are simple and meaningful, but still largely based on racial and
geographic boundaries.
Routinely collected national data is already widely used to examine health outcomes by gender, age,
socio-economic status, and country of birth. The introduction of standardized ethnic categories
across the government and the NHS has massively increased the potential for these same data to
examine ethnicity in great detail both across representative population samples as found in general
practice databases and the ONS Longitudinal Study, and in selected population samples such as the
Hospital Episode Statistics.
One key area for development is that of chronic disease management in the UK. Though research
into ethnic disparities is ongoing, this has yet to be translated into concrete guidance for identifying,
treating, and managing conditions differentially by ethnic group. One emerging use of routinely
recorded ethnicity data is within pragmatic clinical trials, which use electronic health databases to
examine the efficacy of widely prescribed interventions across a vast number of patients, for a lower
cost than traditional clinical trials.78 Such studies would have the power to identify adequate
numbers of eligible patients within each ethnic group, as well as track all clinical care provided in
general practice. Studies using population based samples are key to generating findings which are
generalizable to the whole population.
Furthermore, as the ONS Longitudinal Study progresses, the value of ethnicity data for identifying
differences in health and mortality will increase as successive generations of migrant populations are
born in the UK. The culmination of the 2011 Census means that a fifth time point can now be added
to the Longitudinal Study, thus allowing for more robust examination of intergenerational
differences in health and mortality, and for the identification of long term limiting illness and poor
general health which may manifest differentially by ethnic group.
Finally, linkage of these datasets to further health and social data will allow us to fully explore the
relationship between ethnicity and the wider determinants of health. The Clinical Practice Research
Datalink is currently in the process of linking the CPRD database with cost data, prescribing data, and

21
disease registries.146 In addition to current linkages with the NHS central services and the ONS both
the Scottish Longitudinal Study and the Northern Ireland Longitudinal Study include linkages to other
records The SLS, for example, includes hospital admissions and discharges and NILs can be linked to
health and social care databases including cancer screening, prescription and dental services
databases for specific projects, subject to legal and ethical approval. The scope of the England and
Wales Longitudinal Study may be extended if similar linkage is permitted in the future.
22
8. REFERENCES
1. Freedman BJ. For debate...Caucasian. Br Med J (Clin Res Ed) 1984;288(6418):696-8. 2. Williams DR. The concept of race in Health Services Research: 1966 to 1990. Health Serv Res
1994;29(3):261-74. 3. Bhopal R. Is research into ethnicity and health racist, unsound, or important science? Bmj
1997;314(7096):1751-6. 4. Fullilove MT. Comment: abandoning "race" as a variable in public health research--an idea whose
time has come. Am J Public Health 1998;88(9):1297-8. 5. Cooper RS. A case study in the use of race and ethnicity in public health surveillance. Public Health
Rep 1994;109(1):46-52. 6. Carter BOB, Fenton S. Not Thinking Ethnicity: A Critique of the Ethnicity Paradigm in an Over-
Ethnicised Sociology. Journal for the Theory of Social Behaviour 2010;40(1):1-18. 7. Department of Health, Health and Social Care Information Centre, NHS Employers. A Practical
Guide to Ethnic Monitoring in the NHS and Social Care, 2005. 8. Salway S, Barley R, Allmark P, Gerrish K, Higginbottom G, Ellison G. Ethnic diversity and inequality:
ethical and scienfici rigour in social research. In: Joseph Rowntree Foundation, editor. York, 2011.
9. Oakley A. Ethnicity and research evaluating interventions: issues of science and ethics. In: Nazroo JY, editor. Health and Social Research in Multiethnic Populations. Abingdon: Routledge, 2006:142-64.
10. Ahdieh L, Hahn RA. Use of the terms 'race', 'ethnicity', and 'national origins': a review of articles in the American Journal of Public Health, 1980-1989. Ethn Health 1996;1(1):95-8.
11. Bhopal R, Rankin J. Concepts and terminology in ethnicity, race and health: be aware of the ongoing debate. Br Dent J 1999;186(10):483-4.
12. Bhopal RS. Heterogeneity among Indians, Pakistanis, and Bangladeshis is key to racial inequities. Bmj 2002;325(7369):903.
13. Aspinall PJ. Describing the "white" ethnic group and its composition in medical research. Soc Sci Med 1998;47(11):1797-808.
14. U.S Census Bureau. Directive No. 15: Race and Ethnic standards for federal statistics and administrative reporting In: Bureau USC, editor, 1977.
15. Cabinet Office. Conclusions of a meeting of the cabinet held at 10 Downing Street on Thursday 13 April 1978 at 10:30am: Crown Copyright, 1978.
16. Simpson L, Akinwale B. Stability and change in ethnic groups in England and Wales. Population Trends, no 2005;121.
17. Mason D. A rose by any other name...? Categorisation, identity and social science. Journal of Ethnic and Migration Studies 1990;17(1):123-333.
18. Census Order 1920. In: Parliament of the United Kingdom, editor. England: the King's Printer of Acts of Parliament, 1920.
19. Department of Health. General Household Survey: Crown Copyright 2011, 2011. 20. London Health Observatory. Ethnicity Coding, 2012. 21. Office for National Statistics. Labour Force Survey User Guide. Volume 1 - LFS Background and
Methodology 2011, 2011. 22. Jenkinson C. 'Measuring Health Status and Quality of Life' 1998 Question Bank Topic
Commentary on Health: University of Surrey, 1998. 23. Ballard R. Britain's Visible Minorities: A demographic overview. Stalybridge: Centre for Applied
South Asian Studies. 24. Bhopal RS. Ethnicity, Race, and Health in Multicultural Societies: Foundations for better
epidemiology, public health, and health care. New York: Oxford University Press, 2007.
23
25. Booth H. Ethnic and racial questions in the Census: The home affairs committee report. Journal of Ethnic and Migration Studies 1983;11(1-2):83-91.
26. Coleman D, Salt J, editors. Ethnicity in the 1991 census: volume 1: demographic characteristics of ethnic minority populations. London, 1996.
27. Sillitoe K, White PH. Ethnic group and the British census: the search for a question. J R Stat Soc Ser A Stat Soc 1992;155(1):141-63.
28. Northern Ireland Statistics & Research Agency. Comparability with the 1991 Census. 29. Heath I. The role of ethnic monitoring in general practice. British Journal of General
Practice;41(349):310-1. 30. Office for National Statistics. Appendix VI: 1991 Census: definitions and concepts, 1991. 31. Senior PA, Bhopal R. Ethnicity as a variable in epidemiological research. Bmj 1994;309(6950):327-
30. 32. Ballard R. Negotiating Race and Ethnicity: exploring the implications of the 1991 census. Patterns
of Prejudice 1997;30(3):3-33. 33. Centre for Longitudinal Study Information and User Support. 2001 Census Appendix 13: Ethnic
Group. 34. Rees P, Martin D, Williamson P, editors. The Census Data System. Chichester: Wiley, 2002. 35. Office for National Statistics. Final recommended questions for the 2011 Census in England and
Wales: National Identity, 2009. 36. Simon P. Collecting ethnic statistics in Europe: a review. Ethnic and Racial Studies 2011:1-26. 37. Psoinos M, Hatzidimitriadou E, Butler C, Barn R. Ethnic monitoring in Healthcare Services in the
UK as a mechanism to address Health Disparities: A Narrative Review. London: Swan IPI, 2011.
38. Simon P. "Ethnic" statistics and data protection in the Council of Europe countries. Strasbourg: Council of Europe, 2007.
39. UK Government. Race Relations (Amendment) Act 2000: Crown Corporation, 2000. 40. Baxter C, Baxter D. Racial inequalities in health: a challenge to the British National Health Service.
International Journal of Health Services 1988;18:563-71. 41. Silvera M. Proposal for guidelines on monitoring the ethnic origin of service users. London:
Parkside Health Authority, 1991. 42. National Association of Health Authorities in England and Wales. Actions not words. Birmingham:
National Association of Health Authorities, 1988. 43. Chiu M, Austin PC, Manuel DG, Shah BR, Tu JV. Deriving ethnic-specific BMI cutoff points for
assessing diabetes risk. Diabetes Care 2011;34(8):1741-8. 44. Gholap N, Davies M, Patel K, Sattar N, Khunti K. Type 2 diabetes and cardiovascular disease in
South Asians. Primary care diabetes 2011;5(1):45-56. 45. Bellary S, O'Hare JP, Raymond NT, Gumber A, Mughal S, Szczepura A, et al. Enhanced diabetes
care to patients of south Asian ethnic origin (the United Kingdom Asian Diabetes Study): a cluster randomised controlled trial. Lancet;371(9626):1769-76.
46. Kurian AK, Cardarelli KM. Racial and ethnic differences in cardiovascular disease risk factors: a systematic review. Ethnicity & Disease 2007;17(1):143-52.
47. Parry G, Van Cleemput P, Peters J, Walters S, Thomas K, Cooper C. Health status of Gypsies and Travellers in England. J Epidemiol Community Health 2007;61(3):198-204.
48. Kohut K, D'Mello L, Bancroft EK, Thomas S, Young MA, Myhill K, et al. Implications for cancer genetics practice of pro-actively assessing family history in a General Practice cohort in North West London. Fam Cancer 2012;11(1):107-13.
49. Bennett L. Understanding sickle cell disorders. Nurs Stand 2005;19(32):52-61; quiz 62. 50. Gray LJ, Yates T, Davies MJ, Brady E, Webb DR, Sattar N, et al. Defining obesity cut-off points for
migrant South Asians. PLoS One 2011;6(10):e26464. 51. NHS Information Centre. Health Survey for England 2004: Health of Ethnic Minorities - Full
Report, 2006.
24
52. The Marmot Review. Fair Society, Healthy Lives: Strategic Review of Health Inequalities in England post-2010. London, 2010.
53. Department of Health. Tackling Health Inequalities: A program for Action. In: Publications DoH, editor. London, 2003
54. Noble D, Smith D, Mathur R, Robson J, Greenhalgh T. Feasibility study of geospatial mapping of
chronic disease risk to inform public health commissioning. BMJ open 2012;2(1). 55. Joseph Rowntree Foundation. Ethnic minorities and urban deprivation, 1998. 56. Bhopal RS. The quest for culturally sensitive health-care systems in Scotland: insights for a multi-
ethnic Europe. J Public Health (Oxf) 2012;34(1):5-11. 57. Aung NC, Rechel B, Odermatt P. Access to and utilisation of GP services among Burmese migrants
in London: a cross-sectional descriptive study. BMC Health Serv Res 2010;10:285. 58. Topal K, Eser E, Sanberk I, Bayliss E, Saatci E. Challenges in access to health services and its
impact on quality of life: a randomised population-based survey within Turkish speaking immigrants in London. Health Qual Life Outcomes 2012;10:11.
59. Misra A, Ganda OP. Migration and its impact on adiposity and type 2 diabetes. Nutrition 2007;23(9):696-708.
60. Marmot MG, Adelstein AM, Bulusu L. Immigrant Mortality in England and Wales 1970-1978. OPCS Studies of Medical and Population Subjects. London: HMSO, 1984.
61. Harding S. Mortality of migrants from the Indian subcontinent to England and Wales: effect of duration of residence. Epidemiology 2003;14(3):287-92.
62. Support UDSC. Census Microdata Guide, 2013. 63. Goldring S, Newman J. The ONS Longitudinal Study--a prestigious past and a bright future. Popul
Trends 2010(139):4-10. 64. Centre for Longitudinal Study Information and User Support. Means of Linkage. 65. Hattersly L, Boyle P. The Scottish Longitudinal Study, an Introduction. LSCS Working Paper, 2007. 66. O'Reilly D, Rosato M, Catney G, Johnston F, Brolly M. Cohort description: the Northern Ireland
Longitudinal Study (NILS). Int J Epidemiol 2012;41(3):634-41. 67. Afkhami R, Acik-Toprak N. Ethnicity: Introductory User Guide. In: Service EaSD, editor, 2012. 68. Jones M, Kai J. Capturing ethnicity data in primary care: challenges and feasibility in a diverse
metropolitan population. Diversity in Health and Social Care 2007;4(3):211-20. 69. Aspinall P, Anionwu E. The role of ethnic monitoring in mainstreaming race equality and the
modernization of the NHS: A neglected agenda? Critical Public Health 2002;12(1):1-15. 70. Nitsch D, Kadalayil L, Mangtani P, Steenkamp R, Ansell D, Tomson C, et al. Validation and utility
of a computerized South Asian names and group recognition algorithm in ascertaining South Asian ethnicity in the national renal registry. Qjm 2009;102(12):865-72.
71. Hull SA, Rivas C, Bobby J, Boomla K, Robson J. Hospital data may be more accurate than census data in estimating the ethnic composition of general practice populations. Inform Prim Care 2009;17(2):67-78.
72. Shah BR, Chiu M, Amin S, Ramani M, Sadry S, Tu JV. Surname lists to identify South Asian and Chinese ethnicity from secondary data in Ontario, Canada: a validation study. BMC Med Res Methodol 2010;10:42.
73. Pringle M, Hobbs R. Large computer databases in general practice. Bmj 1991;302(6779):741-2. 74. Crisis UK. Critical Condition: Vulnerable single homeless people and access to GPs. London, 2002. 75. de Lusignan S, van Weel C. The use of routinely collected computer data for research in primary
care: opportunities and challenges. Fam Pract 2006;23(2):253-63. 76. Carey IM, Cook DG, De Wilde S, Bremner SA, Richards N, Caine S, et al. Developing a large
electronic primary care database (Doctors' Independent Network) for research. International Journal of Medical Informatics 2004;73(5):443-53.
77. Hippisley-Cox J, Stables D, Pringle M. QRESEARCH: a new general practice database for research. Inform Prim Care 2004;12(1):49-50.

25
78. van Staa TP, Goldacre B, Gulliford M, Cassell J, Pirmohamed M, Taweel A, et al. Pragmatic randomised trials using routine electronic health records: putting them to the test. Bmj 2012;344:e55.
79. Denburg MR, Haynes K, Shults J, Lewis JD, Leonard MB. Validation of The Health Improvement Network (THIN) database for epidemiologic studies of chronic kidney disease. Pharmacoepidemiol Drug Saf 2011;20(11):1138-49.
80. Gallagher AM, Smeeth L, Seabroke S, Leufkens HG, van Staa TP. Risk of death and cardiovascular outcomes with thiazolidinediones: a study with the general practice research database and secondary care data. PLoS ONE 2011;6(12):e28157.
81. Mindell J, Biddulph JP, Hirani V, Stamatakis E, Craig R, Nunn S, et al. Cohort Profile: The Health Survey for England. International Journal of Epidemiology 2012.
82. Bourke A, Dattani H, Robinson M. Feasibility study and methodology to create a quality-evaluated database of primary care data. Inform Prim Care 2004;12(3):171-7.
83. General Practitioners Committee. Ethnicity and first language recording- GPC guidance. In: British Medical Association, editor, 2011.
84. Incentives to improve ethnicity coding in primary care. Equality and inequality in Health 2010; London. The Kings Fund. 85. Race for Health. Ethnic Monitoring in General Practice- communicating the benefits National Health Service,. 86. General Practitioners Committee. GMS 2011/12 Contract Agreement. In: British Medical
Association, editor. London, 2011. 87. QOF database: Records 21, 2012. 88. Chisholm J. The Read clinical classification. Bmj 1990;300(6732):1092. 89. Cegedim Strategic Data. THIN data statistics, 2011. 90. Walley T, Mantgani A. The UK General Practice Research Database. Lancet 1997;350(9084):1097-
9. 91. Bourke A, Dattani H, Robinson M. Feasibility study and methodology to create a quality-
evaluated database of primary care data. Inform Prim Care 2004;12(3):171-7. 92. Lawson DH, Sherman V, Hollowell J. The General Practice Research Database. Scientific and
Ethical Advisory Group. Qjm 1998;91(6):445-52. 93. Hollowell J. The General Practice Research Database: quality of morbidity data. Popul Trends
1997(87):36-40. 94. Cegedim Strategic Data. THIN Data Training Programme: The Health Improvement Network,
2010. 95. University of Pennsylvania. Frequently asked questions on how to use the GPRD/THIN databases. 96. QRESEARCH. Qresearch: Practice Information Sheet, 2011. 97. Hughes G. Hospital Episode Statistics: are they anything to write home about? Emerg Med J
2009;26(6):392. 98. Information Standards Board for Health and Social Care. DSCN 54/94/P40 Ethnic group data
collection, 1994. 99. Aspinall PJ. Department of Health's requirement for mandatory collection of data on ethnic
group of inpatients. Bmj 1995;311(7011):1006-9. 100. Jack RH, Linklater KM, Hofman D, Fitzpatrick J, Moller H. Ethnicity coding in a regional cancer
registry and in Hospital Episode Statistics. BMC Public Health 2006;6:281. 101. Information Standards Board for Health and Social Care. DSCN 53/94/P39 Ethnic Origin, 1994. 102. NHS Information Centre. How good is HES ethnic coding and where do the problems lie?, 2009. 103. Health and Social Care Information Centre. HES User Guide, 2010. 104. Department of Health. National standards for ethnic group and related matters. 105. NHS Information Standards Board. Data Set Change Notice:CDS, HES & Workforce Ethnic Data.
In: NHS, editor. London: NHS Information Authority,, 2000. 106. Christie B. Scotland introduces record of ethnicity on death certificates. Bmj 2012;344.
26
107. Home Office Identity & Passport Service. Official information on births, marriages and deaths, 2012.
108. CeLSIUS. Publications using the ONS LS, 2007. 109. Harding S. Health of Ethnic Women in England and Wales. London: Health Education Authority,
1996. 110. Hickman MJ, Morgan S, Walter B. Second-Generation Irish People in Britain: a Demographic,
Socio-economic and Health Profile. A Research Report for the DION Committee. London: Irish Studies Centre, University of North London, 2001.
111. Stott D. A Demographic Analysis of Ethnic Differentials in Limiting Long-term Illness Reporting: 1991 Census of Great Britain. London School of Hygiene and Tropical Medicine, 1994.
112. Davey-Smith G, Chaturvedi N, Harding S, Nazroo J, Williams R. Ethnic inequalities in health: a review of UK epidemiological evidence. Critical Public Health 2000;10(4):377-408.
113. Harding S, Balarajan R. Limiting long-term illness among black Caribbeans, black Africans, Indians, Pakistanis, Bangladeshis and Chinese born in the UK. Ethn Health 2000;5(1):41-6.
114. Creeser R. The scope for using the 1991 Census questions on ethnicity and limiting long-term illness: Institute of Education, 1993.
115. Raftery J, Jones DR, Rosato M. The mortality of first and second generation Irish immigrants in the U.K. Soc Sci Med 1990;31(5):577-84.
116. Harding S. The Health of the Irish in England and Wales. London: Federation of Irish Societies, 1998.
117. Maxwell R, Harding S. Mortality of migrants from outside England and Wales by marital status. Popul Trends 1998(91):15-22.
118. Harding S. Mortality of migrants from the Caribbean to England and Wales: effect of duration of residence. Int J Epidemiol 2004;33(2):382-6.
119. Harding S, Balarajan R. Longitudinal study of socio-economic differences in mortality among South Asian and West Indian migrants. Ethn Health 2001;6(2):121-8.
120. Harding S, Balarajan R. Patterns of mortality in second generation Irish living in England and Wales: longitudinal study. Bmj 1996;312(7043):1389-92.
121. Harding S, Maxwell R, editors. Differences in mortality of migrants. London, 1998. 122. Popham F, Boyle PJ. Is there a 'Scottish effect' for mortality? Prospective observational study of
census linkage studies. J Public Health (Oxf) 2011;33(3):453-8. 123. Williams R, Ecob R. Regional Mortality and the Irish in Britain: Findings from the ONS
Longitudinal Study. Sociology of Health & Illness 1999;21(3):344-67. 124. Harding S, Balarajan R. Mortality of third generation Irish people living in England and Wales:
longitudinal study. Bmj 2001;322(7284):466-7. 125. Collingwood Bakeo A, Clarke L. Risk factors for low birthweight based on birth registration and
census information, England and Wales, 1981-2000. Health Stat Q 2006(30):15-21. 126. Harding S, Rosato MG, Cruickshank JK. Lack of change in birthweights of infants by generational
status among Indian, Pakistani, Bangladeshi, Black Caribbean, and Black African mothers in a British cohort study. Int J Epidemiol 2004;33(6):1279-85.
127. Ronalds G. Study of the relationship between ethnic ancestry and birth weight in babies born to Indian and white parents in England and Wales. London School of Hygiene & Tropical Medicine, University of London, 2003.
128. Harding S, Allen EJ. Sources and uses of data on cancer among ethnic groups. Br J Cancer Suppl 1996;29:S17-21.
129. Harding S. The incidence of cancers among second-generation Irish living in England and Wales. Br J Cancer 1998;78(7):958-61.
130. Harding S, Rosato M. Cancer incidence among first generation Scottish, Irish, West Indian and South Asian migrants living in England and Wales. Ethn Health 1999;4(1-2):83-92.
27
131. Hippisley-Cox J, Coupland C, Vinogradova Y, Robson J, Minhas R, Sheikh A, et al. Predicting cardiovascular risk in England and Wales: prospective derivation and validation of QRISK2. British Medical Journal 2008;336(7659):1475-+.
132. Hippisley-Cox J, Coupland C. Predicting the risk of chronic Kidney Disease in men and women in England and Wales: prospective derivation and external validation of the QKidney Scores. BMC Family Practice 2010;11:49.
133. Billings J, Dixon J, Mijanovich T, Wennberg D. Case finding for patients at risk of readmission to hospital: development of algorithm to identify high risk patients. BMJ 2006;333(7563):327.
134. Hippisley-Cox J, Coupland C. Predicting the risk of Chronic Kidney Disease in Men and Women in England and Wales: prospective derivation and external validation of the QKidney (R) Scores. BMC Family Practice 2010;11.
135. Collins GS, Altman DG. An independent and external validation of QRISK2 cardiovascular disease risk score: A prospective open cohort study. BMJ 2010;340 (7758):1231.
136. Collins GS, Altman DG. External validation of QDSCORE((R)) for predicting the 10-year risk of developing Type 2 diabetes. Diabet Med 2011;28(5):599-607.
137. Bottle A, Aylin P, Majeed A. Identifying patients at high risk of emergency hospital admissions: a logistic regression analysis. Journal of the Royal Society of Medicine 2006;99(8):406-14.
138. Hacker J, Stanistreet D. Equity in waiting times for two surgical specialties: a case study at a hospital in the North West of England. Journal of Public Health 2004;26(1):56-60.
139. Shah A, Diggens N, Stiller C, Murphy D, Passmore J, Murphy MFG. Place of death and hospital care for children who died of cancer in England, 1999-2006. European Journal of Cancer 2011;47(14):2175-81.
140. Mindell J, Klodawski E, Fitzpatrick J. Using routine data to measure ethnic differentials in access to coronary revascularization. Journal of Public Health 2008;30(1):45-53.
141. Bragg F, Cromwell DA, Edozien LC, Gurol-Urganci I, Mahmood TA, Templeton A, et al. Variation in rates of caesarean section among English NHS trusts after accounting for maternal and clinical risk: cross sectional study. BMJ 2010;341:c5065.
142. Cooper SC, Day R, Brooks C, Livings C, Thomson CS, Trudgill NJ. The influence of deprivation and ethnicity on the incidence of esophageal cancer in England. Cancer Causes & Control 2009;20(8):1459-67.
143. Jack RH, Davies EA, Moller H. Testis and prostate cancer incidence in ethnic groups in South East England. International Journal of Andrology 2007;30(4):215-20; discussion 20-1.
144. Downing A, West RM, Gilthorpe MS, Lawrence G, Forman D. Using routinely collected health data to investigate the association between ethnicity and breast cancer incidence and survival: what is the impact of missing data and multiple ethnicities? Ethnicity & Health 2011;16(3):201-12.
145. Mann AG, Trotter CL, Balogun MA, Ramsay ME. Hepatitis C in ethnic minority populations in England. Journal of Viral Hepatitis 2008;15(6):421-6.
146. Medicines and Healthcare Products Regulatory Agency. CPRD for Researchers- How can we help?, 2013.
28
Appendix
Table 1. Evolution of ethnic categories used on the Census forms for England and Wales from 1991-2011
1991 2001 2011 1 White White White 1 British 1 English/Welsh/Scottish/Northern Irish/British 2 Irish 2 Irish 3 Any other White background (write in) 3 Gypsy or Irish Traveller 4 Any other white background (write in) Mixed Mixed/Multiple Ethnic Groups 4 White and Black Caribbean 5 White and Black Caribbean 5 White and Black African 6 White and Black African 6 White and Asian 7 White and Asian 7 Any other mixed background (write in) 8 Any other Mixed/multiple ethnic background (write in) Asian or Asian British Asian or Asian British 2 Indian 8 Indian 9 Indian 3 Pakistani 9 Pakistani 10 Pakistani 4 Bangladeshi 10 Bangladeshi 11 Bangladeshi 11 Any other Asian background (write in) 12 Chinese 13 Any other Asian background (write in) Black or Black British Black/African/Caribbean/Black British 5 Black-Caribbean 12 Caribbean 14 African 6 Black-African 13 African 15 Caribbean 7 Black Other (write in) 14 Any other Black background (write in) 16 Any other Black/African/Caribbean background Chinese or other ethnic group Other ethnic group 8 Chinese 15 Chinese 17 Arab 9 Any other ethnic group (write in) 16 Any other ethnic group (write in) 18 Any other ethnic group (write in)
29
Table 2 Evolution of ethnic categories used on the Census forms for Scotland from 1991-2011
1991 2001 2011 1 White White White 1 Scottish Scottish 2 Other British English 3 Irish Welsh 4 Any other White background (write in) Northern Irish British Irish Gypsy/Traveller Polish Other white ethnic group (write in) Mixed Mixed 5 Any mixed background Any mixed background Asian, Asian Scottish or Asian British Asian, Asian Scottish or Asian British 2 Indian 6 Indian Indian 3 Pakistani 7 Pakistani Pakistani 4 Bangladeshi 8 Bangladeshi Bangladeshi 5 Chinese 9 Chinese Chinese 10 Any other Asian background (write in) Any other Asian background (write in) Black, Black Scottish or Black British Black, Black Scottish, or Black British 6 Black-Caribbean 11 Caribbean Caribbean 7 Black-African 12 African African 8 Black Other (write in) 13 Any other Black background (write in) Any other Black background (write in) (write in) Other ethnic group Other ethnic group 9 Any other ethnic group (write in) 14 Any other background (write in) Any other background
30
Table 3. Evolution of ethnic categories used on the Census forms for Northern Ireland 2001-2011
2001 2011 White White Chinese Chinese Irish Traveller Irish Traveller Indian Indian Pakistani Pakistani Bangladeshi Bangladeshi Black Caribbean Black Caribbean Black African Black African Black Other Black Other


