
Bank of America Bank of America Healthcare Healthcare ConferenceConference
May 17, 2006May 17, 2006

2
Jeff CampbellJeff Campbell
Executive Vice PresidentExecutive Vice PresidentChief Financial OfficerChief Financial Officer
3
Some of the information in this presentation may constitute forward-looking statements that are subject to various uncertainties. These uncertainties could cause actual results to differ materially from those projected or implied. The risk factors associated with those uncertainties are described in the Company’s reports and exhibits filed with the Securities and Exchange Commission. Financial information is presented here in summary form. Full details are provided in the Company’s most recent 10-Q report. All of this information is available at www.mckesson.com. The Company assumes no obligation to update or revise any such statements, whether as a result of new information or otherwise.
Safe Harbor Clause

4
McKesson Facts
$88 billion in revenues in FY06FY06 EPS $2.44 (excluding Securities Litigation charge and Discontinued Ops)Over 27,000 employees304 million shares outstanding $15 billion market capFounded 1833, headquartered in San Francisco
144% Return to Shareholders since April 1, 2000
Medical-Surgical$3.1 B
Provider Technologies$1.5 B
FY06 REVENUES
FY06 OPERATING PROFIT
PharmaSolutions$83.4 B
Medical-Surgical$70 M
Provider Technologies$143 M
PharmaSolutions$1,211 M
5
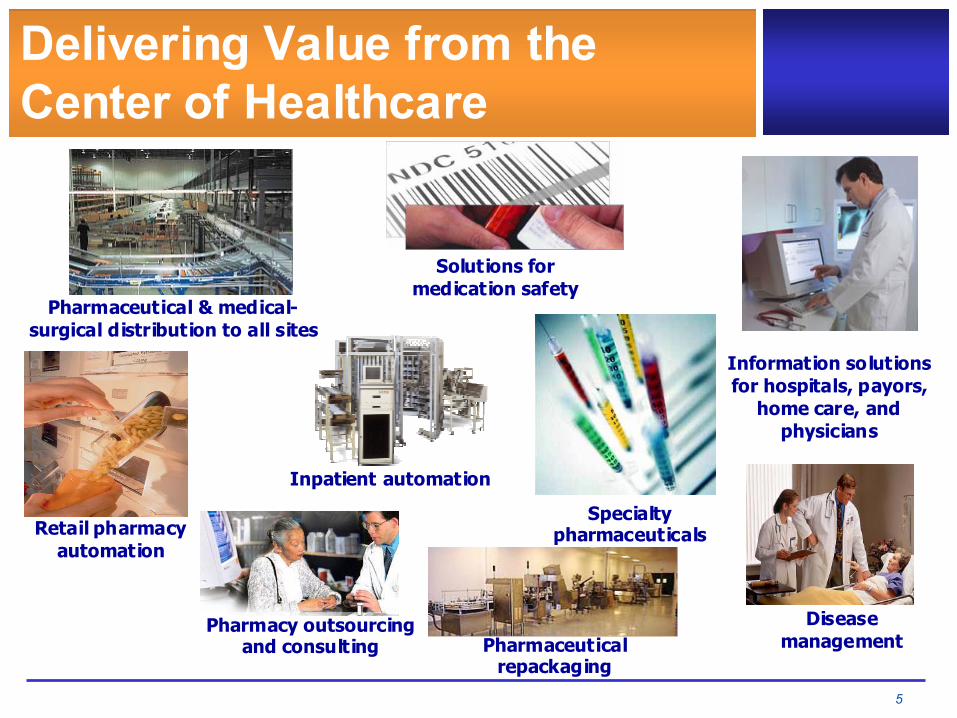
Delivering Value from the Center of Healthcare
Pharmaceutical & medical-surgical distribution to all sites
Solutions for medication safety
Pharmacy outsourcing and consulting
Specialty pharmaceuticals
Inpatient automation
Information solutions for hospitals, payors,
home care, and physicians
Pharmaceutical repackaging
Retail pharmacy automation
Disease management

6
McKesson McKesson PharmaceuticalPharmaceutical
#1 in U.S., Canada, and Mexico
Large Rx repackaging
Leading generics provider
Specialty distribution & patient services for
manufacturers
#1 in medical management software and services for
payors
#1 in disease management for Medicaid agencies
McKesson McKesson MedicalMedical--SurgicalSurgical
#1 in primary care
#1 in extended care
Private label product offerings
Rapid growth in physician office pharmaceuticals and equipment
Market Leading Positions in Healthcare Services
McKesson McKesson Provider TechnologiesProvider Technologies
63% of health systems
51% of hospitals with 200+ beds
Leader in clinical, revenue cycle, and resource
management solutions
More “Best in KLAS”products than any
other vendor
#1 in robotic hospital pharmacy dispensing
#1 in bedside scanning

7
Leader in Growing Areas
U.S. Pharmaceutical$234 B 5-8% projected growth (1)
Canadian Pharmaceutical $12 B US5-7% projected growth (1)
HIT – Hospital, Alternate Site and Automation$28 B6-7% projected growth (3)
Well positioned in all growing healthcare areas
(1) IMS(2) Medical Devices & Supplies M arket Update(3) Datamonitor, 2005(4) Includes medical management software/content, disease management, coding, compliance ser vices
U.S. Medical-Surgical $80 B6-8% projected growth (2)
Payor – Outsourced and Software$8 B20-25% projected growth (4)

8
Long-term Relationships with Market Leaders
Vanderbilt University Medical CenterVanderbilt University Medical Center

9
McKesson’s Strategy
To bring together clinical knowledge, process expertise, technology, and the resources of
a Fortune 16 company to fundamentally change the cost and quality of healthcare.
Create long-termrelationships based on custom solutions
that deliverROI & quality
Sell McKesson’s comprehensive
offering
Introduce innovations that address emerging
healthcarechallenges

10
Six Years of Strong Growth
FY00FY01
FY02
FY03
FY04
FY05FY0
6
Warehouse SalesDirect Revenues
$36.7 $42.0
$50.0$57.1
$69.2
$80.1$88.1
16% CAGR (total sales)
$ Billions

11
Diluted EPS(continuing operations)*
$2.44
$2.18
($0.15)
$0.65
$1.43
$1.89
$2.18
FY00
FY01
FY02
FY03
FY04
FY05
FY06
25% CAGR
Note: EPS from continuing operations, excluding securities litigation charges.


13
Diluted EPS Reconciliation($ and shares in millions, except EPS)
FY04 FY05 FY06
$ 643 $ (160) $ 737
Exclude: Securities Litigation charges, net - 1,200 45
Estimated income tax benefit - (390) (15) - 810 30
Net income, continuing ops, excluding Securities Litigation charges $ 643 $ 650 $ 767
$ 2.18 $ 2.18 $ 2.44
299 301 316
Net income (loss), continuing ops - as reported
Diluted earnings per common share, continuing ops, excluding Securities Litigation charges (1) (2)
Shares on which diluted earnings per common share were based (2)
(1) Certain computations may reflect rounding adjustments.(2) For the years ended March 31, 2006, 2005 and 2004, interest exp ense, net of relat ed income taxes, of $1 million, $6 mil lion and $6 mil lion has been add ed to net income, excluding the Securities Litigation charges, for purposes of calculating diluted earning s per sh are. This calculation also includ es the impact of dilutive securities (stock options, convertible junior subordinat ed debentures and restricted stock).

14
Diluted EPS Reconciliation($ and shares in millions, except EPS)
FY05 FY06 FY05 FY06
$ 258 $ 220 $ (160) $ 737
Exclude: Securities Litigation charges (credits), net - (8) 1,200 45
Estimated income tax benefit - 3 (390) (15) - (5) 810 30
Net income, continuing ops,excluding Securities Litigation charges $ 258 $ 215 $ 650 $ 767
$ 0.85 $ 0.68 $ 2.18 $ 2.44
305 314 301 316
Full Year
Net income, (loss) continuing ops - as reported
Diluted earnings per common share, continuing ops, excluding Secuities Litigation charges (1) (2)
Shares on which diluted earnings per common share were based (2)
Q4
(1) Certain computations may reflect rounding adjustments.(2) For the years ended March 31, 2006, 2005 and 2004, interest exp ense, net of relat ed income taxes, of $1 million, $6 mil lion and $6 mil lion has been add ed to net income, excluding the Securities Litigation charges, for purposes of calculating diluted earning s per sh are. This calculation also includ es the impact of dilutive securities (stock options, convertible junior subordinat ed debentures and restricted stock).


