
7/25/2019 Banks et al 2007 Human_ecological_niches_and_ranges_during_the_LGM_in_Europe_derived_from_an_application_of…
http://slidepdf.com/reader/full/banks-et-al-2007-humanecologicalnichesandrangesduringthelgmineuropederivedfromanapplicati… 1/11
Human ecological niches and ranges during the LGM in Europe derivedfrom an application of eco-cultural niche modeling
William E. Banks a,*, Francesco d’Errico a,b, A. Townsend Peterson c, Marian Vanhaeren d,Masa Kageyama e, Pierre Sepulchre e, Gilles Ramstein e, Anne Jost f , Daniel Lunt g
a Institut de Prehistoire et de Geologie du Quaternaire, UMR 5199-PACEA, Universite Bordeaux 1, CNRS,
Bati ment B18, Avenue des Facultes, 33405 Talence, Franceb Department of Anthropology, George Washington University, 2110 G Street NW, Washington, DC 20052, USA
c Natural History Museum and Biodiversity Research Center, The University of Kansas, 1345 Jayhawk Boulevard, Lawrence, KS 66045-7561, USAd Ethnologie prehistorique, UMR 7041-ArScAn, Universite de Paris X, CNRS, 21 allee de l’Universite, 92023 Nanterre Cedex, France
e Laboratoire des Sciences du Climat et de l’Environnement/IPSL, UMR 1572, CEA/CNRS/UVSQ, Saclay,
L’Orme des Merisiers, Batiment 701, 91191 Gif-sur-Yvette Cedex, Francef UMR 7619 SISYPHE, Universite Pierre-et-Marie Curie Paris VI, Boite 123, 4 Place Jussieu, 75252 Paris Cedex 05, France
g School of Geographical Sciences, University Road, University of Bristol, Bristol BS8 1SS, United Kingdom
Received 15 February 2007; received in revised form 18 April 2007; accepted 1 May 2007
Abstract
We apply eco-cultural niche modeling (ECNM), an heuristic approach adapted from the biodiversity sciences, to identify habitable portions
of the European territory for Upper Paleolithic hunter-gatherers during the Last Glacial Maximum (LGM), circumscribe potential geographic
extents of the Solutrean and Epigravettian technocomplexes, evaluate environmental and adaptive factors that influenced their distributions, and
discuss this method’s potential to illuminate past humane
environment interaction. Our ECNM approach employed the Genetic Algorithm forRule-Set Prediction (GARP) and used as input a combination of archaeological and geographic data, in conjunction with high-resolution pale-
oclimatic simulations for this time frame. The archaeological data consist of geographic coordinates of sites dated by Accelerator Mass Spec-
trometry to the LGM and attributed to the Solutrean and Epigravettian technocomplexes. The areas predicted by ECNM consistently outline the
northern boundary of human presence at 22,000e20,000 cal BP. This boundary is mainly determined by climatic constraints and corresponds
well to known southern limits of periglacial environments and permafrost conditions during the LGM. Differences between predicted ecological
niches and known ranges of the Solutrean and Epigravettian technocomplexes are interpreted as Solutrean populations being adapted to colder
and more humid environments and as reflecting influences of ecological risk on geographic distributions of cultures.
2007 Elsevier Ltd. All rights reserved.
Keywords: Eco-cultural niche modeling; GARP; LGM; Solutrean; Epigravettian; Western Europe; Upper Paleolithic; Human adaptation
1. Introduction
The idea of modeling past humaneenvironment interac-
tions is by no means new. Researchers have used archaeolog-
ical and environmental data sets, and diverse methods, to
interpret prehistoric hunter-gatherer behavior in ecological
contexts. Well-known European examples concern prehistoric
population distributions during Oxygen Isotope Stages 2 and 3
(Gamble et al., 2004; Van Andel and Davies, 2003), as well as
the resettlement of regions following severe climatic episodes
(Gamble et al., 2005; Straus et al., 2000). These studies were
based on spatial distributions of radiometrically dated sites
and generalized climatic reconstructions. Others have used
a similar approach to estimate population size and kinetics
(Bocquet-Appel and Demars, 2000; Bocquet-Appel et al.,* Corresponding author. Tel.: þ33 540003649.
E-mail address: [email protected] (W.E. Banks).
0305-4403/$ - see front matter 2007 Elsevier Ltd. All rights reserved.
doi:10.1016/j.jas.2007.05.011
ARTICLE IN PRESS
Please cite this article in press as: William E. Banks, d’Errico, F. et al., Human ecological niches and ranges during the LGM in Europe derived from an ap-
plication of eco-cultural niche modeling, J. Archaeol. Sci. (2007), doi:10.1016/j.jas.2007.05.011
Journal of Archaeological Science xx (2007) 1e11http://www.elsevier.com/locate/jas
+ MODEL

7/25/2019 Banks et al 2007 Human_ecological_niches_and_ranges_during_the_LGM_in_Europe_derived_from_an_application_of…
http://slidepdf.com/reader/full/banks-et-al-2007-humanecologicalnichesandrangesduringthelgmineuropederivedfromanapplicati… 2/11
2005). More detailed attempts to examine population distribu-
tions and human tolerances with respect to environmental var-
iability also exist (Binford, 1999, 2001; Davies et al., 2003;
d’Errico and Sanchez Go~ni, 2003; d’Errico et al., 2006; Sepul-
chre et al., 2007). However, no agreement yet exists on how
best to evaluate influences of environmental factors on prehis-
toric human populations and their responses to climaticvariability.
One common limitation is the use of coarse-scale climatic
data (i.e., simulations with resolutions of 3e5 in latitude and
longitude) and imprecise chronological data (i.e., reliance on
old conventional ages with large sigmas) that make evaluation
of human responses to rapid-scale climatic variability, with ad-
equate resolution, difficult. Another shortfall of previous stud-
ies is that they have incorporated environmental data into
analyses only passively, such that these data are used as back-
drops against which the archaeological record is interpreted.
While these studies have obvious value, they are limited in
their ability to evaluate prehistoric hunter-gatherer responses
to the abrupt climatic and environmental changes of the lastglacial period. The need for robust methods with which to
evaluate more precisely how past human and animal popula-
tions responded to these changes is critical.
An important recent advance in the study of biological
diversity has been the development of biocomputational
architectures for predictive modeling of complex biodiversity
phenomena (Guisan and Zimmermann, 2000; Soberon and
Peterson, 2005). Such tools can be used to predict species’range
(i.e., ecological niche) expansion or contraction in response to
real or simulated climatic changes (Peterson et al., 2002). The
ecological niche of a species can be defined as the range of en-
vironmental conditions within which it can persist without im-migrational subsidy (Grinnell, 1924; Hutchinson, 1957). Such
methods have considerable potential for reconstructing niches
of past human populations and for illuminating the complex
mechanisms that regulated the interactions between past
hunter-gatherer populations and their environments, which in
turn helped shape cultural, genetic, and linguistic geographies.
These methods, and relatedconcepts, recently have been termed
eco-cultural niche modeling (ECNM) (Banks et al., 2006) when
applied to prehistoric human populations. Our application of
ECNM interactively integrates climatic, geographic, and
archaeological data via a machine-learning genetic algorithm,
described below. Comparable work is being pursued by others
to analyze North American Paleoindian (Anderson and Gillam
in Banks et al., 2006) and Far Eastern Paleolithic (Gillam and
Tabarev, 2006) data and have shown promising results. We ar-
gue that ECNM is a powerful approach and, when paired with
high-resolution climatic simulations, allows one to overcome
many limitations of previous studies and evaluate prehistoric
humaneenvironment interactions at regional scales.
Here, we apply ECNM to human populations at the Last
Glacial Maximum (LGM) in Europe, a well-studied and dated
climatic phase known to have had profound impacts on human
populations, with three primary objectives: (1) to determine
the limits of the potential human range during the LGM, (2)
to define the eco-cultural niches of the two main archeological
cultures present in Europe at that time (the Solutrean and Epi-
gravettian technocomplexes), and (3) to identify environmen-
tal and cultural factors that shaped their geographic ranges.
1.1. Environmental and cultural context
The last glacial period was marked by dramatic and rapidclimatic variability (Dansgaard et al., 1993; Johnsen et al.,
1992), with the LGM representing a unique suite of climatic
conditions (Ditlevsen et al., 1996; Peyron et al., 1998). This
period, centered on 21 kyr cal BP, is characterized by the max-
imum volume of the ice sheet over Scandinavia and northern
Europe, along with cold and generally arid conditions in north-
ern and Western Europe. The LGM archaeological record is
characterized by a relatively small number of sites and large
gaps in the archaeological record for many regions (cf. Soffer
and Gamble, 1990; Straus, 2005; Street and Terberger, 1999).
Such a pattern has been interpreted to be the result of the hu-
man abandonment of northern Europe and a contraction of thehuman range to southern regions that served as refugia. Such
contraction and consequent demographic reduction is known
to have produced a bottleneck in human genetic diversity (Bar-
bujani et al., 1998: p. 490; Torroni et al., 1998, 2001).
In Western Europe, between ca. 22 kyr and 20 kyr cal BP,
human groups responded to LGM environmental conditions by
developing a suite of new technologies characterized by a vari-
ety of diagnostic projectile points and knives produced by bi-
facial retouch (Fig. 1A), which define the Solutrean (Mortillet,
1873; Smith, 1966). Straus (2005) proposed that Solutrean
populations employed more specialized subsistence systems,
relative to earlier Upper Paleolithic technocomplexes, to ex-
ploit regions rich in game but under harsh climatic conditions.
In the regions of southeastern Europe, hunter-gatherers of
the LGM produced a different lithic technology, termed the
early Epigravettian (Laplace, 1964; Mussi, 2001), character-
ized by shouldered and backed projectile points produced by
unifacial retouch (Fig. 1B). Leaf-shaped points are rare and
have been recovered from only a few sites in northern Italy
(Palma di Cesnola, 1990). Contrary to the Solutrean, which
appears as a novel technology, the Epigravettian toolkit is in-
terpreted as being derived from the preceding Gravettian tech-
nocomplex (Otte, 1990; Palma di Cesnola, 2001).
2. Materials and methods
For ECNM, we employed a machine-learning genetic algo-
rithm originally developed for determining the ecological
niches of plant and animal species (Stockwell, 1999; Stock-
well and Peters, 1999). This software application, termed the
Genetic Algorithm for Rule-Set Prediction (GARP), has
been applied to topics as diverse as habitat conservation, ef-
fects of climate change on species’ distributions, the geo-
graphic potential of species’ invasions, and anticipation of
emerging disease transmission risk (Adjemian et al., 2006;
Martinez-Meyer et al., 2004; Peterson et al., 2004; Sanchez-
Cordero and Martınez-Meyer, 2000; Soberon and Peterson,
2 W.E. Banks et al. / Journal of Archaeological Science xx (2007) 1e11
+ MODEL
ARTICLE IN PRESS
Please cite this article in press as: William E. Banks, d’Errico, F. et al., Human ecological niches and ranges during the LGM in Europe derived from an ap-
plication of eco-cultural niche modeling, J. Archaeol. Sci. (2007), doi:10.1016/j.jas.2007.05.011

7/25/2019 Banks et al 2007 Human_ecological_niches_and_ranges_during_the_LGM_in_Europe_derived_from_an_application_of…
http://slidepdf.com/reader/full/banks-et-al-2007-humanecologicalnichesandrangesduringthelgmineuropederivedfromanapplicati… 3/11
2004). It is available for download at http://www.lifemapper.
org/desktopgarp/ .
GARP requires as input the geographic coordinates where
the target species has been observed and raster GIS data layers
summarizing environmental variables that may be involved in
limiting the geographic distribution of the species. In our ap-
plication, the occurrence data were the geographic coordinates
of radiometrically dated and culturally attributed archaeologi-
cal sites. These archaeological data were obtained from a data-
base, compiled by FdE and MV, that contains the geographic
coordinates, recorded stratigraphic levels, associated cultural
affiliations, and >6000 radiometric ages from ca. 1300 archae-
ological sites in Europe.
The raster GIS data consisted of landscape attributes and
high-resolution climatic simulations for the LGM. The land-
scape variables included slope, aspect, elevation, and com-
pound topographic index (a measure of tendency to pool
water) from the Hydro-1K data set (U.S. Geological Survey’s
Center for Earth Resources Observation and Science e http://
edc.usgs.gov/products/elevation/gtopo30/hydro/index.html).
Typically, climatic simulations for specific periods of time
are produced by forcing general circulation models (GCMs),
which reconstruct past, present, and future climates globally
typically at resolutions where grid squares measure 100e
200 km on a side. For instance, the LGM and the mid-Holo-
cene have been the focus of coordinated experiments in the
framework of the Paleoclimate Modelling Intercomparison
Project (Harrison et al., 2002; Joussaume and Taylor, 1995;
PMIP, 2000). In an effort to use climatic data that approachthe same scale of resolution as our geographic data, we use
in the present study a regional climatic simulation with
a grid box size over Europe of w 60 km on a side, which
was run at the Laboratoire des Sciences du Climat et de l’En-
vironnement, Gif-sur-Yvette, France.
This high-resolution LGM atmospheric simulation fol-
lowed the PMIP1 protocol (http://www-lsce.cea.fr/pmip),
with sea-surface temperatures and sea ice cover as prescribed
from the CLIMAP (1981) data set and the ice-sheets from the
Peltier (1994) ICE-4G reconstruction. Atmospheric CO2 con-
centration was lowered to 200 ppmv according to the ice-core
record (Raynaud et al., 1993) and orbital parameters adjusted
to 21,000 cal BP values (Berger, 1978). The results of this sim-ulation have been compared to pollen-based climatic recon-
structions, with fairly close agreement for summer and
annual mean temperatures but some underestimation of winter
cooling and drying over Western Europe and the Mediterra-
nean (Jost et al., 2005). From this simulation, we derived the
following variables for input into GARP: warmest month tem-
perature, coldest month temperature, mean annual tempera-
ture, and mean annual precipitation (Fig. 2). The values of
warmest and coldest months refer to the warmest/coldest
month in a climatic cycle averaged over 10 yr of simulation.
In GARP, geographic locations of archaeological sites are
resampled randomly by the algorithm to create training andtest data sets. An iterative process of rule selection is then per-
formed within the program’s functioning, in which an inferen-
tial tool is chosen from a suite of possibilities (e.g., logistic
regression and bioclimatic rules) and applied to the training
data to develop specific rules (Stockwell, 1999). These rules
maximize predictivity by using independent data to evaluate
them. Predictive accuracy is evaluated based on the known
presence data and a set of pseudoabsence points (i.e., points
sampled randomly from among points across the region of
study where the species has not yet been detected) (Stockwell,
1999). This evaluation process is used to develop a rule-set
that defines the distribution of a species in ecological space
(i.e., an ecological niche) (Soberon and Peterson, 2005), which
can be projected onto the landscape to predict a potential geo-
graphic distribution (Peterson, 2003: p. 421; Stockwell, 1999;
Stockwell and Peters, 1999). GARP has undergone extensive
improvement and testing in recent years, including detailed
sensitivity analyses (Peterson and Cohoon, 1999; Stockwell
and Peterson, 2002a,b; Anderson et al., 2002).
We applied GARP to archaeological sites dated by AMS to
the LGM, in an effort to minimize the possibility of incorpo-
rating sites for which radiometric determinations are underes-
timates of true ages, as has been shown to be common for
older Upper Paleolithic technocomplexes that date to the
temporal limits of radiocarbon methods (d’Errico and
Fig. 1. (A) Examples of Solutrean projectile points. Drawings are not to scale
(adapted from Smith, 1966); (B) Examples of Epigravettian projectile pointsrecovered from Grotta di Paina. Scale bar is 1 cm (adapted from Palma di Ces-
nola, 2001).
3W.E. Banks et al. / Journal of Archaeological Science xx (2007) 1e11
+ MODEL
ARTICLE IN PRESS
Please cite this article in press as: William E. Banks, d’Errico, F. et al., Human ecological niches and ranges during the LGM in Europe derived from an ap-
plication of eco-cultural niche modeling, J. Archaeol. Sci. (2007), doi:10.1016/j.jas.2007.05.011

7/25/2019 Banks et al 2007 Human_ecological_niches_and_ranges_during_the_LGM_in_Europe_derived_from_an_application_of…
http://slidepdf.com/reader/full/banks-et-al-2007-humanecologicalnichesandrangesduringthelgmineuropederivedfromanapplicati… 4/11
Sanchez-Go~ni, 2003; Van der Plicht, 1999; Zilh~ao and d’Er-
rico, 1999). The lack of agreement between conventionaland AMS ages has been attributed by these authors to ineffec-
tive sample treatments, and the application of conventional14C counting methods to samples that fall near the limits of
this dating method. While these factors should have a lesser
impact concerning sites dated to the LGM, they still may be
a source of error considering this period’s relatively narrow
time window. Fig. 3, presenting distributions of conventional
and AMS ages from sites attributed to the Solutrean, indicates
that such sources of error are present for ages during the LGM:
conventional ages are slightly younger relative to AMS ages,
suggesting that some underestimate the true age of their sites.
For this reason, the site samples used to create our Solu-
trean and Epigravettian ECNMs are composed primarily of
sites radiometrically dated by AMS to the height of the
LGM (defined here as 21 1 kyr cal BP), and that contain di-
agnostic material assemblages associated with these techno-
complexes (Table 1). AMS ages for sites assigned to the two
technocomplexes of interest were calibrated using CALIB
5.0.2 html (Reimer et al., 2004; Stuiver et al., 2005). The geo-
graphic coordinates of those sites that fell within our targeted
time frame were used as occurrence points. We included five
undated sites in Italy reliably attributed to the early Epigravet-
tian of the LGM based on their stratigraphic contexts and di-
agnostic material assemblages to increase sample size for this
technocomplex.
Fig. 2. High-resolution temperature and precipitation simulations for the Last Glacial Maximum (LGM) used in the GARP analyses: (A) warmest month temper-
ature (C), (B) coldest month temperature (C), (C) mean annual precipitation (mm 100), (D) mean annual temperature (C). The values of warmest and coldest
months refer to the warmest/coldest month in a climatic cycle averaged over 10 yrs of simulation.
Fig. 3. Histograms of the percentages of uncalibrated conventional and AMS
radiocarbon age determinations for the Solutrean technocomplex.
4 W.E. Banks et al. / Journal of Archaeological Science xx (2007) 1e11
+ MODEL
ARTICLE IN PRESS
Please cite this article in press as: William E. Banks, d’Errico, F. et al., Human ecological niches and ranges during the LGM in Europe derived from an ap-
plication of eco-cultural niche modeling, J. Archaeol. Sci. (2007), doi:10.1016/j.jas.2007.05.011
7/25/2019 Banks et al 2007 Human_ecological_niches_and_ranges_during_the_LGM_in_Europe_derived_from_an_application_of…
http://slidepdf.com/reader/full/banks-et-al-2007-humanecologicalnichesandrangesduringthelgmineuropederivedfromanapplicati… 5/11
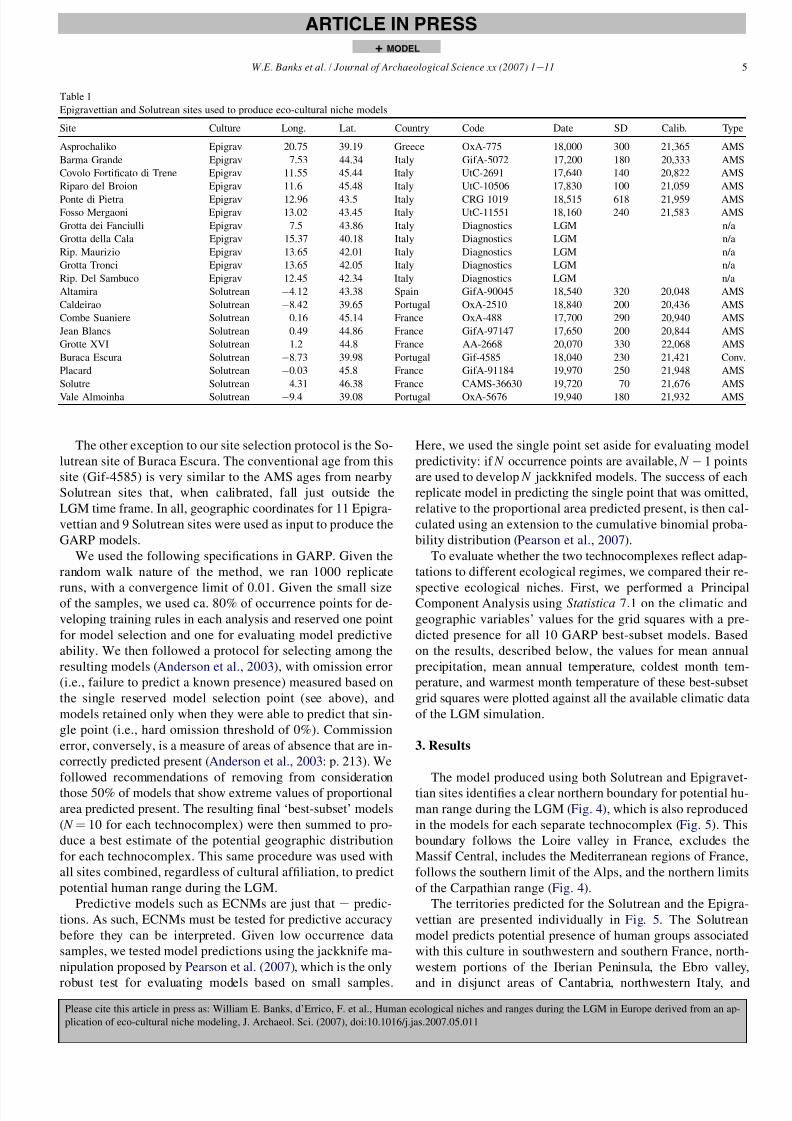
The other exception to our site selection protocol is the So-
lutrean site of Buraca Escura. The conventional age from this
site (Gif-4585) is very similar to the AMS ages from nearby
Solutrean sites that, when calibrated, fall just outside the
LGM time frame. In all, geographic coordinates for 11 Epigra-
vettian and 9 Solutrean sites were used as input to produce the
GARP models.
We used the following specifications in GARP. Given the
random walk nature of the method, we ran 1000 replicate
runs, with a convergence limit of 0.01. Given the small sizeof the samples, we used ca. 80% of occurrence points for de-
veloping training rules in each analysis and reserved one point
for model selection and one for evaluating model predictive
ability. We then followed a protocol for selecting among the
resulting models (Anderson et al., 2003), with omission error
(i.e., failure to predict a known presence) measured based on
the single reserved model selection point (see above), and
models retained only when they were able to predict that sin-
gle point (i.e., hard omission threshold of 0%). Commission
error, conversely, is a measure of areas of absence that are in-
correctly predicted present (Anderson et al., 2003: p. 213). We
followed recommendations of removing from consideration
those 50% of models that show extreme values of proportional
area predicted present. The resulting final ‘best-subset’ models
( N ¼ 10 for each technocomplex) were then summed to pro-
duce a best estimate of the potential geographic distribution
for each technocomplex. This same procedure was used with
all sites combined, regardless of cultural affiliation, to predict
potential human range during the LGM.
Predictive models such as ECNMs are just that e predic-
tions. As such, ECNMs must be tested for predictive accuracy
before they can be interpreted. Given low occurrence data
samples, we tested model predictions using the jackknife ma-
nipulation proposed by Pearson et al. (2007), which is the only
robust test for evaluating models based on small samples.
Here, we used the single point set aside for evaluating model
predictivity: if N occurrence points are available, N 1 points
are used to develop N jackknifed models. The success of each
replicate model in predicting the single point that was omitted,
relative to the proportional area predicted present, is then cal-
culated using an extension to the cumulative binomial proba-
bility distribution (Pearson et al., 2007).
To evaluate whether the two technocomplexes reflect adap-
tations to different ecological regimes, we compared their re-
spective ecological niches. First, we performed a PrincipalComponent Analysis using Statistica 7.1 on the climatic and
geographic variables’ values for the grid squares with a pre-
dicted presence for all 10 GARP best-subset models. Based
on the results, described below, the values for mean annual
precipitation, mean annual temperature, coldest month tem-
perature, and warmest month temperature of these best-subset
grid squares were plotted against all the available climatic data
of the LGM simulation.
3. Results
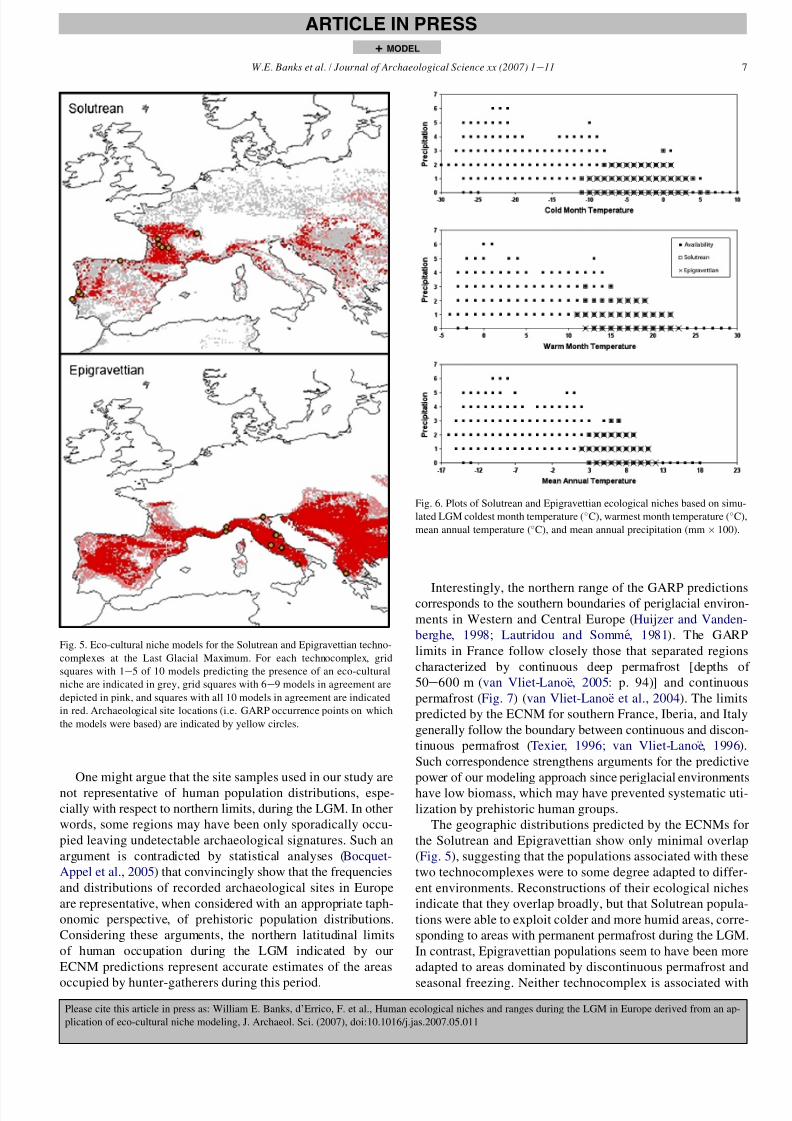
The model produced using both Solutrean and Epigravet-
tian sites identifies a clear northern boundary for potential hu-
man range during the LGM (Fig. 4), which is also reproduced
in the models for each separate technocomplex (Fig. 5). This
boundary follows the Loire valley in France, excludes the
Massif Central, includes the Mediterranean regions of France,
follows the southern limit of the Alps, and the northern limits
of the Carpathian range (Fig. 4).
The territories predicted for the Solutrean and the Epigra-
vettian are presented individually in Fig. 5. The Solutrean
model predicts potential presence of human groups associated
with this culture in southwestern and southern France, north-
western portions of the Iberian Peninsula, the Ebro valley,
and in disjunct areas of Cantabria, northwestern Italy, and
Table 1
Epigravettian and Solutrean sites used to produce eco-cultural niche models
Site Culture Long. Lat. Country Code Date SD Calib. Type
Asprochaliko Epigrav 20.75 39.19 Greece OxA-775 18,000 300 21,365 AMS
Barma Grande Epigrav 7.53 44.34 Italy GifA-5072 17,200 180 20,333 AMS
Covolo Fortificato di Trene Epigrav 11.55 45.44 Italy UtC-2691 17,640 140 20,822 AMS
Riparo del Broion Epigrav 11.6 45.48 Italy UtC-10506 17,830 100 21,059 AMS
Ponte di Pietra Epigrav 12.96 43.5 Italy CRG-1019 18,515 618 21,959 AMSFosso Mergaoni Epigrav 13.02 43.45 Italy UtC-11551 18,160 240 21,583 AMS
Grotta dei Fanciulli Epigrav 7.5 43.86 Italy Diagnostics LGM n/a
Grotta della Cala Epigrav 15.37 40.18 Italy Diagnostics LGM n/a
Rip. Maurizio Epigrav 13.65 42.01 Italy Diagnostics LGM n/a
Grotta Tronci Epigrav 13.65 42.05 Italy Diagnostics LGM n/a
Rip. Del Sambuco Epigrav 12.45 42.34 Italy Diagnostics LGM n/a
Altamira Solutrean 4.12 43.38 Spain GifA-90045 18,540 320 20,048 AMS
Caldeirao Solutrean 8.42 39.65 Portugal OxA-2510 18,840 200 20,436 AMS
Combe Suaniere Solutrean 0.16 45.14 France OxA-488 17,700 290 20,940 AMS
Jean Blancs Solutrean 0.49 44.86 France GifA-97147 17,650 200 20,844 AMS
Grotte XVI Solutrean 1.2 44.8 France AA-2668 20,070 330 22,068 AMS
Buraca Escura Solutrean 8.73 39.98 Portugal Gif-4585 18,040 230 21,421 Conv.
Placard Solutrean 0.03 45.8 France GifA-91184 19,970 250 21,948 AMS
Solutre Solutrean 4.31 46.38 France CAMS-36630 19,720 70 21,676 AMS
Vale Almoinha Solutrean 9.4 39.08 Portugal OxA-5676 19,940 180 21,932 AMS
5W.E. Banks et al. / Journal of Archaeological Science xx (2007) 1e11
+ MODEL
ARTICLE IN PRESS
Please cite this article in press as: William E. Banks, d’Errico, F. et al., Human ecological niches and ranges during the LGM in Europe derived from an ap-
plication of eco-cultural niche modeling, J. Archaeol. Sci. (2007), doi:10.1016/j.jas.2007.05.011

7/25/2019 Banks et al 2007 Human_ecological_niches_and_ranges_during_the_LGM_in_Europe_derived_from_an_application_of…
http://slidepdf.com/reader/full/banks-et-al-2007-humanecologicalnichesandrangesduringthelgmineuropederivedfromanapplicati… 6/11
the Balkans. The model for the Epigravettian predicts a poten-
tial presence of this culture in the Balkans, the Italian Penin-
sula excluding the most southerly regions, the Mediterranean
regions of France as well as the Aude and Garonne corridors,
and the Iberian Peninsula excluding its southern regions. That
these models have high predictive power regarding potential
human distributions is shown by the accuracy observed in
the jackknife manipulations. The independent test point was
correctly predicted in 7 of the 9 jackknife models for theSolutrean and in all 11 models for the Epigravettian, with
associated probabilities of P¼ 0.00005 and P < 0.00001,
respectively.
Although potential distributions predicted for these two
technocomplexes show only minimal overlap geographically,
conclusions of ecological differentiation are complex. These
models are geographic projections of ecological niches defined
by multiple environmental variables, so small differences be-
tween ecological niches can result in different potential geo-
graphic distributions when ecological differences correspond
to environmental conditions present over large regions.
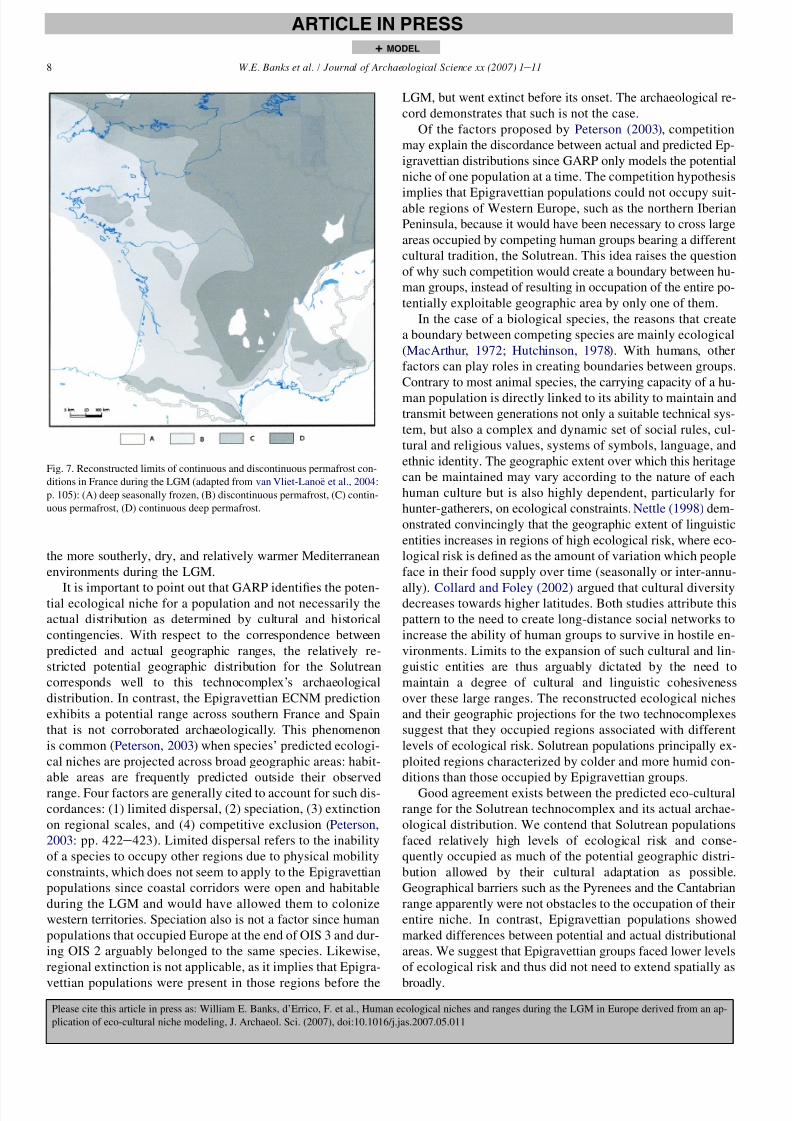
A Principal Component Analysis of the environmental vari-
ables indicated that overall environmental variability in the study
areais satisfactorily explained (85%) by the first twocomponents,
which are most influenced by the different temperature variables
associated with each technocomplex’s predicted distribution.
Plotting the climatic variables’ values of the grid squares where
all best-subset models predicted potential presence against all
of the available climatic data (Fig. 6) showed that the ecological
niches occupied by the two technocomplexes overlap broadly,
with only slight differences on theedges of their predicted niches.
These differences indicate that the Solutrean technocomplex had
the potential to occupy somewhat cooler and more humid envi-
ronments than the Epigravettian. T -tests performed on these
data matrices to compare the two technocomplexes were
uniformly significant ( p 0.05), indicating that the Solutrean
and Epigravettianniches are not drawn fromthe same population.
4. Discussion
The northern limits of the human range predicted by
ECNM for the LGM (Fig. 4) are arguably accurate. These
limits are consistent with the known distribution of archaeo-
logical sites for this period (Bocquet-Appel et al., 2005;Demars, 1996; Soffer and Gamble, 1990). The only radiomet-
rically dated site for our temporal range that seemingly contra-
dicts our results is that of Wiesbaden-Igstadt (Street and
Terberger, 1999), which has yielded seven AMS ages from
a single occupation level ranging from 19,320 to 17,210 BP.
Street and Terberger (1999: p. 267) think that these ages col-
lectively represent the true age of the site but acknowledge,
however, that uncertainties (e.g., contamination) could exist.
When calibrated, two of these dates (UZ-3768 and OxA-
7500) fall within our LGM window, but they are appreciably
younger than the other calibrated dates from the same level
suggesting that they underestimate the true age of the occupa-
tion. This interpretation is supported by the fact that when
these two ages are averaged (t ave¼ 17,356 118 BP) using
the method described by Long and Rippeteau (1974), and
compared to the next youngest age (OxA-7501), the null hy-
pothesis of no difference is rejected (t ¼ 4.0143, P < 0.001).
Because the younger and older ages from Wiesbaden-Igstadt
cannot be considered to be drawn from the same statistical
population, and the older ages fall before the LGM when cali-
brated, we hesitate to accept that this site represents an LGM
human occupation of the Central Rhineland. Wiesbaden-
Igstadt probably dates to DansgaardeOeschger Interstadial 2
to which Shackleton et al. (2004: p. 1515) assign an age of
19.62 0.21 kyr BP.
Fig. 4. GARP prediction based on both Solutrean and Epigravettian sites dated to 21 1 kyr cal BP. Grid squares with 1e5 of 10 models predicting the presence of
an eco-cultural niche are indicated in grey, grid squares with 6e9 models in agreement are depicted in pink, and squares with all 10 models in agreement are
indicated in red. Archaeological site locations (i.e. GARP occurrence points) are indicated by yellow circles.
6 W.E. Banks et al. / Journal of Archaeological Science xx (2007) 1e11
+ MODEL
ARTICLE IN PRESS
Please cite this article in press as: William E. Banks, d’Errico, F. et al., Human ecological niches and ranges during the LGM in Europe derived from an ap-
plication of eco-cultural niche modeling, J. Archaeol. Sci. (2007), doi:10.1016/j.jas.2007.05.011
7/25/2019 Banks et al 2007 Human_ecological_niches_and_ranges_during_the_LGM_in_Europe_derived_from_an_application_of…
http://slidepdf.com/reader/full/banks-et-al-2007-humanecologicalnichesandrangesduringthelgmineuropederivedfromanapplicati… 7/11
One might argue that the site samples used in our study are
not representative of human population distributions, espe-
cially with respect to northern limits, during the LGM. In other
words, some regions may have been only sporadically occu-
pied leaving undetectable archaeological signatures. Such an
argument is contradicted by statistical analyses (Bocquet-
Appel et al., 2005) that convincingly show that the frequencies
and distributions of recorded archaeological sites in Europe
are representative, when considered with an appropriate taph-
onomic perspective, of prehistoric population distributions.
Considering these arguments, the northern latitudinal limits
of human occupation during the LGM indicated by our
ECNM predictions represent accurate estimates of the areas
occupied by hunter-gatherers during this period.
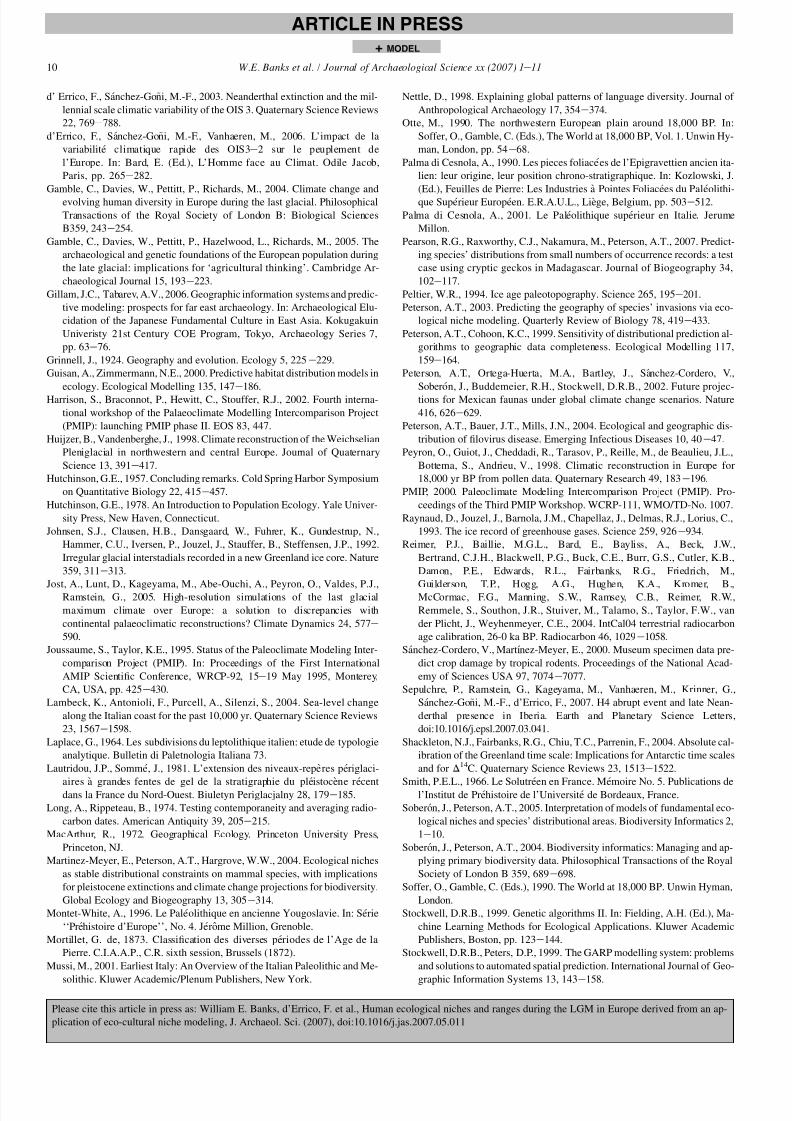
Interestingly, the northern range of the GARP predictionscorresponds to the southern boundaries of periglacial environ-
ments in Western and Central Europe (Huijzer and Vanden-
berghe, 1998; Lautridou and Somme, 1981). The GARP
limits in France follow closely those that separated regions
characterized by continuous deep permafrost [depths of
50e600 m (van Vliet-Lanoe, 2005: p. 94)] and continuous
permafrost (Fig. 7) (van Vliet-Lanoe et al., 2004). The limits
predicted by the ECNM for southern France, Iberia, and Italy
generally follow the boundary between continuous and discon-
tinuous permafrost (Texier, 1996; van Vliet-Lanoe, 1996).
Such correspondence strengthens arguments for the predictive
power of our modeling approach since periglacial environments
have low biomass, which may have prevented systematic uti-
lization by prehistoric human groups.
The geographic distributions predicted by the ECNMs for
the Solutrean and Epigravettian show only minimal overlap
(Fig. 5), suggesting that the populations associated with these
two technocomplexes were to some degree adapted to differ-
ent environments. Reconstructions of their ecological niches
indicate that they overlap broadly, but that Solutrean popula-
tions were able to exploit colder and more humid areas, corre-
sponding to areas with permanent permafrost during the LGM.
In contrast, Epigravettian populations seem to have been more
adapted to areas dominated by discontinuous permafrost and
seasonal freezing. Neither technocomplex is associated with
Fig. 5. Eco-cultural niche models for the Solutrean and Epigravettian techno-
complexes at the Last Glacial Maximum. For each technocomplex, grid
squares with 1e5 of 10 models predicting the presence of an eco-cultural
niche are indicated in grey, grid squares with 6e9 models in agreement are
depicted in pink, and squares with all 10 models in agreement are indicated
in red. Archaeological site locations (i.e. GARP occurrence points on which
the models were based) are indicated by yellow circles.
Fig. 6. Plots of Solutrean and Epigravettian ecological niches based on simu-
lated LGM coldest month temperature (C), warmest month temperature (C),
mean annual temperature (C), and mean annual precipitation (mm 100).
7W.E. Banks et al. / Journal of Archaeological Science xx (2007) 1e11
+ MODEL
ARTICLE IN PRESS
Please cite this article in press as: William E. Banks, d’Errico, F. et al., Human ecological niches and ranges during the LGM in Europe derived from an ap-
plication of eco-cultural niche modeling, J. Archaeol. Sci. (2007), doi:10.1016/j.jas.2007.05.011
7/25/2019 Banks et al 2007 Human_ecological_niches_and_ranges_during_the_LGM_in_Europe_derived_from_an_application_of…
http://slidepdf.com/reader/full/banks-et-al-2007-humanecologicalnichesandrangesduringthelgmineuropederivedfromanapplicati… 8/11
the more southerly, dry, and relatively warmer Mediterranean
environments during the LGM.
It is important to point out that GARP identifies the poten-tial ecological niche for a population and not necessarily the
actual distribution as determined by cultural and historical
contingencies. With respect to the correspondence between
predicted and actual geographic ranges, the relatively re-
stricted potential geographic distribution for the Solutrean
corresponds well to this technocomplex’s archaeological
distribution. In contrast, the Epigravettian ECNM prediction
exhibits a potential range across southern France and Spain
that is not corroborated archaeologically. This phenomenon
is common (Peterson, 2003) when species’ predicted ecologi-
cal niches are projected across broad geographic areas: habit-
able areas are frequently predicted outside their observed
range. Four factors are generally cited to account for such dis-
cordances: (1) limited dispersal, (2) speciation, (3) extinction
on regional scales, and (4) competitive exclusion (Peterson,
2003: pp. 422e423). Limited dispersal refers to the inability
of a species to occupy other regions due to physical mobility
constraints, which does not seem to apply to the Epigravettian
populations since coastal corridors were open and habitable
during the LGM and would have allowed them to colonize
western territories. Speciation also is not a factor since human
populations that occupied Europe at the end of OIS 3 and dur-
ing OIS 2 arguably belonged to the same species. Likewise,
regional extinction is not applicable, as it implies that Epigra-
vettian populations were present in those regions before the
LGM, but went extinct before its onset. The archaeological re-
cord demonstrates that such is not the case.
Of the factors proposed by Peterson (2003), competition
may explain the discordance between actual and predicted Ep-
igravettian distributions since GARP only models the potential
niche of one population at a time. The competition hypothesis
implies that Epigravettian populations could not occupy suit-able regions of Western Europe, such as the northern Iberian
Peninsula, because it would have been necessary to cross large
areas occupied by competing human groups bearing a different
cultural tradition, the Solutrean. This idea raises the question
of why such competition would create a boundary between hu-
man groups, instead of resulting in occupation of the entire po-
tentially exploitable geographic area by only one of them.
In the case of a biological species, the reasons that create
a boundary between competing species are mainly ecological
(MacArthur, 1972; Hutchinson, 1978). With humans, other
factors can play roles in creating boundaries between groups.
Contrary to most animal species, the carrying capacity of a hu-
man population is directly linked to its ability to maintain andtransmit between generations not only a suitable technical sys-
tem, but also a complex and dynamic set of social rules, cul-
tural and religious values, systems of symbols, language, and
ethnic identity. The geographic extent over which this heritage
can be maintained may vary according to the nature of each
human culture but is also highly dependent, particularly for
hunter-gatherers, on ecological constraints. Nettle (1998) dem-
onstrated convincingly that the geographic extent of linguistic
entities increases in regions of high ecological risk, where eco-
logical risk is defined as the amount of variation which people
face in their food supply over time (seasonally or inter-annu-
ally). Collard and Foley (2002) argued that cultural diversitydecreases towards higher latitudes. Both studies attribute this
pattern to the need to create long-distance social networks to
increase the ability of human groups to survive in hostile en-
vironments. Limits to the expansion of such cultural and lin-
guistic entities are thus arguably dictated by the need to
maintain a degree of cultural and linguistic cohesiveness
over these large ranges. The reconstructed ecological niches
and their geographic projections for the two technocomplexes
suggest that they occupied regions associated with different
levels of ecological risk. Solutrean populations principally ex-
ploited regions characterized by colder and more humid con-
ditions than those occupied by Epigravettian groups.
Good agreement exists between the predicted eco-cultural
range for the Solutrean technocomplex and its actual archae-
ological distribution. We contend that Solutrean populations
faced relatively high levels of ecological risk and conse-
quently occupied as much of the potential geographic distri-
bution allowed by their cultural adaptation as possible.
Geographical barriers such as the Pyrenees and the Cantabrian
range apparently were not obstacles to the occupation of their
entire niche. In contrast, Epigravettian populations showed
marked differences between potential and actual distributional
areas. We suggest that Epigravettian groups faced lower levels
of ecological risk and thus did not need to extend spatially as
broadly.
Fig. 7. Reconstructed limits of continuous and discontinuous permafrost con-
ditions in France during the LGM (adapted from van Vliet-Lanoe et al., 2004:
p. 105): (A) deep seasonally frozen, (B) discontinuous permafrost, (C) contin-
uous permafrost, (D) continuous deep permafrost.
8 W.E. Banks et al. / Journal of Archaeological Science xx (2007) 1e11
+ MODEL
ARTICLE IN PRESS
Please cite this article in press as: William E. Banks, d’Errico, F. et al., Human ecological niches and ranges during the LGM in Europe derived from an ap-
plication of eco-cultural niche modeling, J. Archaeol. Sci. (2007), doi:10.1016/j.jas.2007.05.011

7/25/2019 Banks et al 2007 Human_ecological_niches_and_ranges_during_the_LGM_in_Europe_derived_from_an_application_of…
http://slidepdf.com/reader/full/banks-et-al-2007-humanecologicalnichesandrangesduringthelgmineuropederivedfromanapplicati… 9/11
Additionally, the potential geographic range predicted by
the ECNM for the Epigravettian technocomplex during the
LGM is restricted to a latitudinal band determined by geo-
graphic barriers (western Alps and Pyrenees) e given the nar-
rowness of the European Mediterranean coastline, corridors
between areas suitable for Epigravettian groups would have
been restricted. Such irregular potential distributional areaswould certainly have constituted major obstacles to mainte-
nance of viable cultural and linguistic networks across these
regions. These restrictions were probably more effective be-
tween the Italian and Iberian Peninsulas than between the Ital-
ian Peninsula and the Balkans owing to the broad Adriatic
plain created by low sea levels during the LGM (Antonioli
et al., 2004; Lambeck et al., 2004). This difference certainly
facilitated exchange between populations of the Italian Penin-
sula and southeastern Europe, as supported by Epigravettian
affinities to LGM industries of the Balkans (Montet-White,
1996: pp. 121e122).
5. Conclusions
ECNM is an effective approach by which to characterize
and quantify eco-cultural niches associated with specific
technocomplexes, and better understand how environmental
factors influenced distributions of prehistoric human popula-
tions. Future research must focus on methods that can be
used to evaluate more precisely the roles of competition and
cultural cohesiveness in producing discords between predicted
and actual ranges. The role of geography in constraining
niches and creating cultural boundaries must be specifically
targeted. Comparisons between the extent and location of
niches occupied by populations associated with specific tech-nocomplexes under similar climatic and environmental condi-
tions may allow us to better disentangle the influences of
environmental and cultural factors. It also would be useful to
apply these techniques to animal species of the LGM and other
climatic episodes to evaluate whether or not their predicted
ecological niches were associated with those of humans.
Finally, the application of ECNM to historically documented
hunter-gatherers, for which detailed cultural and environmen-
tal data are available and cultural dynamics have been directly
observed, would be instrumental in interpreting predictions
based on archaeological and paleoclimatic data.
Acknowledgements
We thank Marıa Fernanda Sanchez Go~ni, Marco Peresani,
and Paolo Biagi for helpful discussions, and Francoise La-
Garde for making Fig. 7. We especially thank Barbara Wohl-
farth for her support as leader of RESOLuTION, a project with
the European Science Foundation’s EuroCores on EuroCLI-
MATE program, which made this research possible. We also
thank the two anonymous reviewers whose comments im-
proved the manuscript. This research was also funded by the
OMLL program of the European Science Foundation,
a post-doctoral grant given to one of us (WEB) by the Centre
National de la Recherche Scientifique, the French Ministry of
Research (ACI Espace et territoires), and the ECLIPSE pro-
gram of the CNRS.
References
Adjemian, J.C.Z., Girvetz, E.H., Beckett, L., Foley, J.E., 2006. Analysis of Ge-
netic Algorithm for Rule-Set Production (GARP) modeling approach for
predicting distributions of fleas implicated as vectors of plague, Yersinia
pestis, in California. Journal of Medical Entomology 43, 93e103.
Anderson, R.P., Gomez, M., Peterson, A.T., 2002. Geographical distributions
of spiny pocket mice in South America: insights from predictive models.
Global Ecology and Biogeography 11, 131e141.
Anderson, R.P., Lew, D., Peterson, A.T., 2003. Evaluating predictive models of
species’ distributions: criteria for selecting optimal models. Ecological
Modelling 162, 211e232.
Antonioli, F., Lambeck, K., Amorosi, A., Belluomini, G., Correggiari, A.,
Devoti, S., Demuro, S., Monaco, C., Marocco, R., Pagliarulo, R.,
Orru, P., Silenzi, S., 2004. Sea level at 8 and 22 ka cal BP along the Italian
coastline. In: Antonioli, F., Vai, G.B. (Eds.), Climax Maps Italy: Explana-tory Notes, Bologna, Italy, pp. 11e14.
Banks, W.E., d’Errico, F., Dibble, H.L., Krishtalka, L., West, D.,
Olszewski, D.I., Peterson, A.T., Anderson, D.G., Gillam, J.C., Montet-
White, A., Crucifix, M., Marean, C.W., Sanchez-Goni, M.-F.,
Wolfarth, B., Vanhaeran, M., 2006. Eco-cultural niche modeling: new tools
for reconstructing the geography and ecology of past human populations.
PaleoAnthropology 4, 68e83.
Barbujani, G., Bertorelle, G., Chikhi, L., 1998. Evidence for Paleolithic and
Neolithic gene flow in Europe. American Journal of Human Genetics
62, 488e491.
Berger, A., 1978. Long-term variations of caloric solar radiation resulting from
the earth’s orbital elements. Quaternary Research 9, 139e167.
Binford, L.R., 1999. Time as a clue to cause? Proceedings of the British Acad-
emy 101, 1e35.
Binford, L.R., 2001. Constructing Frames of Reference: An Analytical Methodfor Archaeological Theory Building Using Hunter-Gatherer and Environ-
mental Data Sets. University of California Press, Berkeley.
Bocquet-Appel, J.-P., Demars, P.-Y., 2000. Population kinetics in the Upper
Paleolithic of Western Europe. Journal of Archaeological Science 27,
551e570.
Bocquet-Appel, J.P., Demars, P.Y., Noiret, L., Dobrowsky, D., 2005. Estimates
of Upper Paleolithic meta-population size in Europe from archaeological
data. Journal of Archaeological Science 32, 1656e1668.
CLIMAP, 1981. Seasonal Reconstructions of the Earth’s Surface at the Last
Glacial Maximum. Map Chart Series MC-36. Geological Society of Amer-
ica, Boulder, Colorado.
Collard, I.F., Foley, R.A., 2002. Latitudinal patterns and environmental deter-
minants of recent human cultural diversity: do humans follow biogeo-
graphical rules? Evolutionary Ecology Research 4, 371e383.
Dansgaard, W., Johnsen, S.J., Clausen, H.B., Dahl-Jensen, D.,Gundestrup, N.S., Hammer, C.U., Hvidberg, C.S., Steffensen, J.P.,
Sveinbjornsdottir, A.E., Jouzel, J., Bond, G.C., 1993. Evidence for general
instability of past climate from a 250 kyr ice-core record. Nature 264,
218e220.
Davies, W., Valdes, P., Ross, C.A., van Andel, T., 2003. The human presence
in Europe during the last glacial period III: site clusters, regional climates,
and resource attractions. In: van Andel, T., Davies, W. (Eds.), Neanderthals
and Modern Humans in the European Landscape During the Last Glacia-
tion. McDonald Institute for Archaeological Research, Cambridge, pp.
191e220.
Demars, P.Y., 1996. Demographie et occupation de l’espace au Paleolithique
superieur et au Mesolithique en France. Prehistoire Europeene 8, 3e26.
Ditlevsen, P.D., Svensmark, H., Johnsen, S., 1996. Contrasting atmospheric
and climate dynamics of the last-glacial and holocene periods. Nature
379, 810e
812.
9W.E. Banks et al. / Journal of Archaeological Science xx (2007) 1e11
+ MODEL
ARTICLE IN PRESS
Please cite this article in press as: William E. Banks, d’Errico, F. et al., Human ecological niches and ranges during the LGM in Europe derived from an ap-
plication of eco-cultural niche modeling, J. Archaeol. Sci. (2007), doi:10.1016/j.jas.2007.05.011
7/25/2019 Banks et al 2007 Human_ecological_niches_and_ranges_during_the_LGM_in_Europe_derived_from_an_application_of…
http://slidepdf.com/reader/full/banks-et-al-2007-humanecologicalnichesandrangesduringthelgmineuropederivedfromanapplica… 10/11
d’ Errico, F., Sanchez-Go~ni, M.-F., 2003. Neanderthal extinction and the mil-
lennial scale climatic variability of the OIS 3. Quaternary Science Reviews
22, 769e788.
d’Errico, F., Sanchez-Go~ni, M.-F., Vanhaeren, M., 2006. L’impact de la
variabilite climatique rapide des OIS3e2 sur le peuplement de
l’Europe. In: Bard, E. (Ed.), L’Homme face au Climat. Odile Jacob,
Paris, pp. 265e282.
Gamble, C., Davies, W., Pettitt, P., Richards, M., 2004. Climate change and
evolving human diversity in Europe during the last glacial. Philosophical
Transactions of the Royal Society of London B: Biological Sciences
B359, 243e254.
Gamble, C., Davies, W., Pettitt, P., Hazelwood, L., Richards, M., 2005. The
archaeological and genetic foundations of the European population during
the late glacial: implications for ‘agricultural thinking’. Cambridge Ar-
chaeological Journal 15, 193e223.
Gillam, J.C., Tabarev, A.V., 2006. Geographic information systems and predic-
tive modeling: prospects for far east archaeology. In: Archaeological Elu-
cidation of the Japanese Fundamental Culture in East Asia. Kokugakuin
Univeristy 21st Century COE Program, Tokyo, Archaeology Series 7,
pp. 63e76.
Grinnell, J., 1924. Geography and evolution. Ecology 5, 225e229.
Guisan, A., Zimmermann, N.E., 2000. Predictive habitat distribution models in
ecology. Ecological Modelling 135, 147e186.
Harrison, S., Braconnot, P., Hewitt, C., Stouffer, R.J., 2002. Fourth interna-
tional workshop of the Palaeoclimate Modelling Intercomparison Project
(PMIP): launching PMIP phase II. EOS 83, 447.
Huijzer, B., Vandenberghe, J., 1998. Climate reconstruction of the Weichselian
Pleniglacial in northwestern and central Europe. Journal of Quaternary
Science 13, 391e417.
Hutchinson, G.E., 1957. Concluding remarks. Cold Spring Harbor Symposium
on Quantitative Biology 22, 415e457.
Hutchinson, G.E., 1978. An Introduction to Population Ecology. Yale Univer-
sity Press, New Haven, Connecticut.
Johnsen, S.J., Clausen, H.B., Dansgaard, W., Fuhrer, K., Gundestrup, N.,
Hammer, C.U., Iversen, P., Jouzel, J., Stauffer, B., Steffensen, J.P., 1992.
Irregular glacial interstadials recorded in a new Greenland ice core. Nature
359, 311e313.
Jost, A., Lunt, D., Kageyama, M., Abe-Ouchi, A., Peyron, O., Valdes, P.J.,Ramstein, G., 2005. High-resolution simulations of the last glacial
maximum climate over Europe: a solution to discrepancies with
continental palaeoclimatic reconstructions? Climate Dynamics 24, 577e
590.
Joussaume, S., Taylor, K.E., 1995. Status of the Paleoclimate Modeling Inter-
comparison Project (PMIP). In: Proceedings of the First International
AMIP Scientific Conference, WRCP-92, 15e19 May 1995, Monterey,
CA, USA, pp. 425e430.
Lambeck, K., Antonioli, F., Purcell, A., Silenzi, S., 2004. Sea-level change
along the Italian coast for the past 10,000 yr. Quaternary Science Reviews
23, 1567e1598.
Laplace, G., 1964. Les subdivisions du leptolithique italien: etude de typologie
analytique. Bulletin di Paletnologia Italiana 73.
Lautridou, J.P., Somme, J., 1981. L’extension des niveaux-reperes periglaci-
aires a grandes fentes de gel de la stratigraphie du pleistocene recentdans la France du Nord-Ouest. Biuletyn Periglacjalny 28, 179e185.
Long, A., Rippeteau, B., 1974. Testing contemporaneity and averaging radio-
carbon dates. American Antiquity 39, 205e215.
MacArthur, R., 1972. Geographical Ecology. Princeton University Press,
Princeton, NJ.
Martinez-Meyer, E., Peterson, A.T., Hargrove, W.W., 2004. Ecological niches
as stable distributional constraints on mammal species, with implications
for pleistocene extinctions and climate change projections for biodiversity.
Global Ecology and Biogeography 13, 305e314.
Montet-White, A., 1996. Le Paleolithique en ancienne Yougoslavie. In: Serie
‘‘Prehistoire d’Europe’’, No. 4. Jerome Million, Grenoble.
Mortillet, G. de, 1873. Classification des diverses periodes de l’Age de la
Pierre. C.I.A.A.P., C.R. sixth session, Brussels (1872).
Mussi, M., 2001. Earliest Italy: An Overview of the Italian Paleolithic and Me-
solithic. Kluwer Academic/Plenum Publishers, New York.
Nettle, D., 1998. Explaining global patterns of language diversity. Journal of
Anthropological Archaeology 17, 354e374.
Otte, M., 1990. The northwestern European plain around 18,000 BP. In:
Soffer, O., Gamble, C. (Eds.), The World at 18,000 BP, Vol. 1. Unwin Hy-
man, London, pp. 54e68.
Palma di Cesnola, A., 1990. Les pieces foliacees de l’Epigravettien ancien ita-
lien: leur origine, leur position chrono-stratigraphique. In: Kozlowski, J.
(Ed.), Feuilles de Pierre: Les Industries a Pointes Foliacees du Paleolithi-
que Superieur Europeen. E.R.A.U.L., Liege, Belgium, pp. 503e512.
Palma di Cesnola, A., 2001. Le Paleolithique superieur en Italie. Jerume
Millon.
Pearson, R.G., Raxworthy, C.J., Nakamura, M., Peterson, A.T., 2007. Predict-
ing species’ distributions from small numbers of occurrence records: a test
case using cryptic geckos in Madagascar. Journal of Biogeography 34,
102e117.
Peltier, W.R., 1994. Ice age paleotopography. Science 265, 195e201.
Peterson, A.T., 2003. Predicting the geography of species’ invasions via eco-
logical niche modeling. Quarterly Review of Biology 78, 419e433.
Peterson, A.T., Cohoon, K.C., 1999. Sensitivity of distributional prediction al-
gorithms to geographic data completeness. Ecological Modelling 117,
159e164.
Peterson, A.T., Ortega-Huerta, M.A., Bartley, J., Sanchez-Cordero, V.,
Soberon, J., Buddemeier, R.H., Stockwell, D.R.B., 2002. Future projec-
tions for Mexican faunas under global climate change scenarios. Nature
416, 626e629.
Peterson, A.T., Bauer, J.T., Mills, J.N., 2004. Ecological and geographic dis-
tribution of filovirus disease. Emerging Infectious Diseases 10, 40e47.
Peyron, O., Guiot, J., Cheddadi, R., Tarasov, P., Reille, M., de Beaulieu, J.L.,
Bottema, S., Andrieu, V., 1998. Climatic reconstruction in Europe for
18,000 yr BP from pollen data. Quaternary Research 49, 183e196.
PMIP, 2000. Paleoclimate Modeling Intercomparison Project (PMIP). Pro-
ceedings of the Third PMIP Workshop. WCRP-111, WMO/TD-No. 1007.
Raynaud, D., Jouzel, J., Barnola, J.M., Chapellaz, J., Delmas, R.J., Lorius, C.,
1993. The ice record of greenhouse gases. Science 259, 926e934.
Reimer, P.J., Baillie, M.G.L., Bard, E., Bayliss, A., Beck, J.W.,
Bertrand, C.J.H., Blackwell, P.G., Buck, C.E., Burr, G.S., Cutler, K.B.,
Damon, P.E., Edwards, R.L., Fairbanks, R.G., Friedrich, M.,
Guilderson, T.P., Hogg, A.G., Hughen, K.A., Kromer, B.,McCormac, F.G., Manning, S.W., Ramsey, C.B., Reimer, R.W.,
Remmele, S., Southon, J.R., Stuiver, M., Talamo, S., Taylor, F.W., van
der Plicht, J., Weyhenmeyer, C.E., 2004. IntCal04 terrestrial radiocarbon
age calibration, 26-0 ka BP. Radiocarbon 46, 1029e1058.
Sanchez-Cordero, V., Martınez-Meyer, E., 2000. Museum specimen data pre-
dict crop damage by tropical rodents. Proceedings of the National Acad-
emy of Sciences USA 97, 7074e7077.
Sepulchre, P., Ramstein, G., Kageyama, M., Vanhaeren, M., Krinner, G.,
Sanchez-Go~ni, M.-F., d’Errico, F., 2007. H4 abrupt event and late Nean-
derthal presence in Iberia. Earth and Planetary Science Letters,
doi:10.1016/j.epsl.2007.03.041.
Shackleton, N.J., Fairbanks, R.G., Chiu, T.C., Parrenin, F., 2004. Absolute cal-
ibration of the Greenland time scale: Implications for Antarctic time scales
and for D14C. Quaternary Science Reviews 23, 1513e1522.
Smith, P.E.L., 1966. Le Solutreen en France. Memoire No. 5. Publications del’Institut de Prehistoire de l’Universite de Bordeaux, France.
Soberon, J., Peterson, A.T., 2005. Interpretation of models of fundamental eco-
logical niches and species’ distributional areas. Biodiversity Informatics 2,
1e10.
Soberon, J., Peterson, A.T., 2004. Biodiversity informatics: Managing and ap-
plying primary biodiversity data. Philosophical Transactions of the Royal
Society of London B 359, 689e698.
Soffer, O., Gamble, C. (Eds.), 1990. The World at 18,000 BP. Unwin Hyman,
London.
Stockwell, D.R.B., 1999. Genetic algorithms II. In: Fielding, A.H. (Ed.), Ma-
chine Learning Methods for Ecological Applications. Kluwer Academic
Publishers, Boston, pp. 123e144.
Stockwell, D.R.B., Peters, D.P., 1999. The GARP modelling system: problems
and solutions to automated spatial prediction. International Journal of Geo-
graphic Information Systems 13, 143e
158.
10 W.E. Banks et al. / Journal of Archaeological Science xx (2007) 1e11
+ MODEL
ARTICLE IN PRESS
Please cite this article in press as: William E. Banks, d’Errico, F. et al., Human ecological niches and ranges during the LGM in Europe derived from an ap-
plication of eco-cultural niche modeling, J. Archaeol. Sci. (2007), doi:10.1016/j.jas.2007.05.011

7/25/2019 Banks et al 2007 Human_ecological_niches_and_ranges_during_the_LGM_in_Europe_derived_from_an_application_of…
http://slidepdf.com/reader/full/banks-et-al-2007-humanecologicalnichesandrangesduringthelgmineuropederivedfromanapplica… 11/11
Stockwell, D.R.B., Peterson, A.T., 2002a. Effects of sample size on accuracy
of species distribution models. Ecological Modelling 148, 1e13.
Stockwell, D.R.B., Peterson, A.T., 2002b. Controlling bias in biodiversity data.
In: Scott, J.M., Heglund, P.J., Morrison, M.L. (Eds.), Predicting Species
Occurrences: Issues of Scale and Accuracy. Island Press, Washington
DC, pp. 537e546.
Straus, L.G., 2005. The Upper Paleolithic of Cantabrian Spain. Evolutionary
Anthropology 14, 145e158.
Straus, L.G., Bicho, N., Winegardner, A., 2000. Mapping the Upper Paleolithic
regions of Iberia. Journal of Iberian Archaeology 2, 7e42.
Street, M., Terberger, T., 1999. The last Pleniglacial and the human settlement
of central Europe: new information from the Rhineland site of Wiesbaden-
Igstadt. Antiquity 73, 259e272.
Stuiver, M., Reimer, P.J., Reimer, R.W., 2005. CALIB 5.0.2 [WWW Program
and Documentation]. 14CHRONO Centre, Queen’s University Belfast,
Available from: <http://www.calib.org>.
Texier, J.-P., 1996. Presence d’un reseau de grands polygones au sud de l’es-
tuaire de la Gironde (France): Interpretation et implications paleoclima-
tiques. Geographie physique et Quaternaire 50, 103e108.
Torroni, A., Bandelt, H.J., Macaulay, V., Richards, M., Cruciani, F., Rengo, C.,
Martinez-Cabrera, V., Villems, R., Kivisild, T., Metspalu, E., Parik, J.,
Tolk, H.-V., Tambets, K., Forster, P., Karger, B., Francalacci, P., Rudan, P.,
Anicijevic, B., Rickards, O., Savontaus, M.-L., Huoponen, K., Laitinen, V.,
Koivumaki, S., Sykes, B., Hickey, E., Novelletto, A., Moral, P., Sellitto, D.,
Coppa, A., Al-Zaheri, N., Santachiara-Benerecetti, A.S., Semino, O.,
Scozzari, R., 2001. A signal, from human mtDNA, of postglacial recoloniza-
tion in Europe. American Journal of Human Genetics 69, 844e852.
Torroni, A., Bandelt, H.-J., d’Urbano, L., Lahermo, P., Moral, P., Sellitto, D.,
Rengo, C., Forster, P., Savontaus, M.-L., Bonne-Tamir, B., Scozzari, R.,
1998. mtDNA analysis reveals a major late Paleolithic population expan-
sion from southwestern to northeastern Europe. American Journal of Hu-
man Genetics 62, 1137e1152.
Van Andel, T.H.,Davies,W. (Eds.), 2003. Neanderthalsand Modern Humans in the
European Landscape During the Last GlaciationArchaeological Results of the
Stage 3 Project. McDonald Institute for Archaeological Research, Cambridge.
Van der Plicht, J., 1999. Radiocarbon calibration for the Middle/Upper Paleo-
lithic: a comment. Antiquity 73, 119e123.
van Vliet-Lanoe, B., 1996. Relations entre la contraction thermique des sols en
Europedu nord ouest et la dynamique de l’inlandsis nord-europeen au Weichse-
lien.In: SerieII, vol. 322.C.R.de l’AcademiedesSciences,Paris,pp.461e468.
van Vliet-Lanoe, B., 2005. La Planete des Glaces: Histoire et Environnements
de Notre Ere Glaciare. Vuibert, Paris.
van Vliet-Lanoe, B., Meilliez, F., Maygari, A., 2004. Distinguishing between
tectonic and periglacial deformations of quaternary continental deposits in
Europe. Global and Planetary Change 43, 103e127.
Zilh~ao, J., d’Errico, F., 1999. The chronology and taphonomy of the earliest
aurignacian and its implications for the understanding of Neanderthal ex-
tinction. Journal of World Prehistory 13, 1e68.
11W.E. Banks et al. / Journal of Archaeological Science xx (2007) 1e11
+ MODEL
ARTICLE IN PRESS
Please cite this article in press as: William E. Banks, d’Errico, F. et al., Human ecological niches and ranges during the LGM in Europe derived from an ap-


