
*Employed by a non-US affiliate of HSBC Securities (USA) Inc, and is not registered/qualified pursuant to FINRA regulations.
Au
gu
st 2
010
Becalm
ed
?
By James Magness and Robert Clover
We have cut our five year wind industry global demand CAGR estimate to
7.0% from 7.5% previously and our 10-year CAGR estimate to 5.5% from 6.7%
We remain cautious on the wind OEMs, and see few near term catalysts for share
price performance. Our favourite part of the value chain is still the wind
farm developers, and Acciona and EDP R, both rated OW(V),
are our highest conviction investment ideas
We cut target prices on Acciona, Hansen Tranmissions, Iberdrola Renovables, EDP Renovaveis,
EDF Energies Nouvelles, Vestas, Gamesa, Repower, and Suzlon, and increase our target
price on Clipper. We have downgraded Gamesa and Repower to N(V) from OW(V)
and upgraded Clipper from N(V) to OW(V)
Becalmed?Is it all over for the global wind markets?
Disclosures and Disclaimer This report must be read with the disclosures and analyst
certifications in the Disclosure appendix, and with the Disclaimer, which forms part of it
Global Clean Energy – Equity
August 2010
Glo
bal C
lean
En
erg
y –
Eq
uity
James Magness*
Analyst
HSBC Bank Plc
+44 20 7991 3464
James is an analyst in the Alternative Energy team based in London. He joined HSBC in August 2005 from a large accounting firm
where he qualified as a chartered accountant and worked in the Valuation and Strategy team. Prior to that he graduated from
Oxford University with a first class degree in Physics.
Robert Clover*
Analyst
HSBC Bank Plc
+44 20 7991 6741
Robert Clover is the Global Head of Alternative and Renewable Energy Equity Research and he joined HSBC in 2004.
Throughout his career he has been ranked in Extel, II and Greenwich. He has an MA (Hons) from Oxford in
Classics and Modern languages, is ACCA-qualified and has worked as an investment analyst since 1995.
100827_28253 Wind Industry thematic_F2:Layout 1 8/31/2010 1:02 AM Page 1
1
Clean Energy Global Wind Power - Equity August 2010
abc
What’s going on with the markets? Why has the wind sector been so weak?
The wind sector has been weak since the start of the credit crisis in September 2008. Until this point it
had held up pretty well, when most other sectors had already been selling off. However, in the two
months following the collapse of Lehman Brothers, the sector more than halved in value; the wind farm
developers lost 50-60% and the wind turbine manufacturers lost 60-70%. The focus at this time was lack
of availability of project finance.
The sector then recovered some of its share price losses during the March 2009 bear market rally, but
subsequently spent a year in the doldrums, with share prices moving sideways. The main reason for this
was lack of order flow during 2009 due to US regulatory uncertainty and only a modest improvement in
project finance markets throughout the course of 2009. Order flow has finally started to pick up in H1
2010, double the H12009 level, but importantly it remains around 70% below H12008, and the recovery
is less strong than we had hoped for due to the Sovereign debt concerns in Southern Europe, increasing
the possibility of tariff reductions (see our note dated 21 June 2010, entitled ‘Carbon default – real of
imagined?’), and at the same time the Clean Energy regulatory rollercoaster in the US Senate started
heading for derailment. From mid-April onwards, the sector sold off along with the wider Southern
European markets, but whereas the Southern European markets have recovered some 20% since early
June, the wind sector has not; some stocks have recovered slightly but most have not. This, we believe, is
due to continued uncertainty over clean energy legislation in the US, which is now unlikely to pass the
Senate before mid-term elections in November.
Summary
Weak electricity demand resulting from energy efficiency measures and recessionary forces have made national wind installation targets easier to achieve. We have therefore cut our five year wind industry global demand CAGR to 7.0% from 7.5% previously and our 10-year CAGR to 5.5% from 6.7%. We remain cautious on the wind OEMs, and see few near term catalysts for share price performance. Our favourite part of the value chain remains the wind farm developers as we feel that that the developers offer a more compelling combination of earnings visibility and valuation and our preference for this part of the value chain has now increased. Acciona and EDP R, both rated OW(V), are our highest conviction investment ideas

2
Clean Energy Global Wind Power - Equity August 2010
abc
In our view, the sector weakness gives rise to some attractive long-term investment opportunities, but on
a selective basis. We continue to favour the wind farm developers, with our preference for this part of the
value chain increasing. In this note, we reiterate our cautious stance on the OEMs due to regulatory risk
and the impact of energy efficiency measures weighing on our longer-term growth assumptions for the
wind turbine market.
Wind turbine manufacturers – price relative chart since the beginning of September 2008
0
20
40
60
80
100
120
Sep-08 Nov -08 Jan-09 Mar-09 May -09 Jul-09 Sep-09 Nov -09 Jan-10 Mar-10 May -10 Jul-10
Gamesa Vestas Clipper Suzlon Repower Nordex
Source: Thomson Financial DataStream, HSBC
Utility wind farm developers – price relative chart since the beginning of September 2008
30
45
60
75
90
105
120
Sep-08 Nov -08 Jan-09 Mar-09 May -09 Jul-09 Sep-09 Nov -09 Jan-10 Mar-10 May -10 Jul-10
Acciona IBR EDPR EDF EN
Source: Thomson Financial DataStream, HSBC

3
Clean Energy Global Wind Power - Equity August 2010
abc
Wind turbine manufacturers – price relative chart of each stock relative to its local market since mid-April 2010
-60%
-50%
-40%
-30%
-20%
-10%
0%
10%
Apr-10 May -10 Jun-10 Jul-10 Aug-10
GAM/MADRIDI VWS/DKKFXXIN CWP/FTAIM10 SZE/IBOMSENRPW/SDAXIDZ NDX1/MDAXIDX
Source: Thomson Financial DataStream, HSBC
Utility wind farm developers – price relative chart of each stock relative to its local market since mid-April 2010
-25%
-20%
-15%
-10%
-5%
0%
5%
10%
Apr-10 May -10 Jun-10 Jul-10 Aug-10
ANA/IBEX35 IBR/IBEX35 EDPR/DJPORTL EEN/EN1FRU1
Source: Thomson Financial DataStream, HSBC
4
Clean Energy Global Wind Power - Equity August 2010
abc
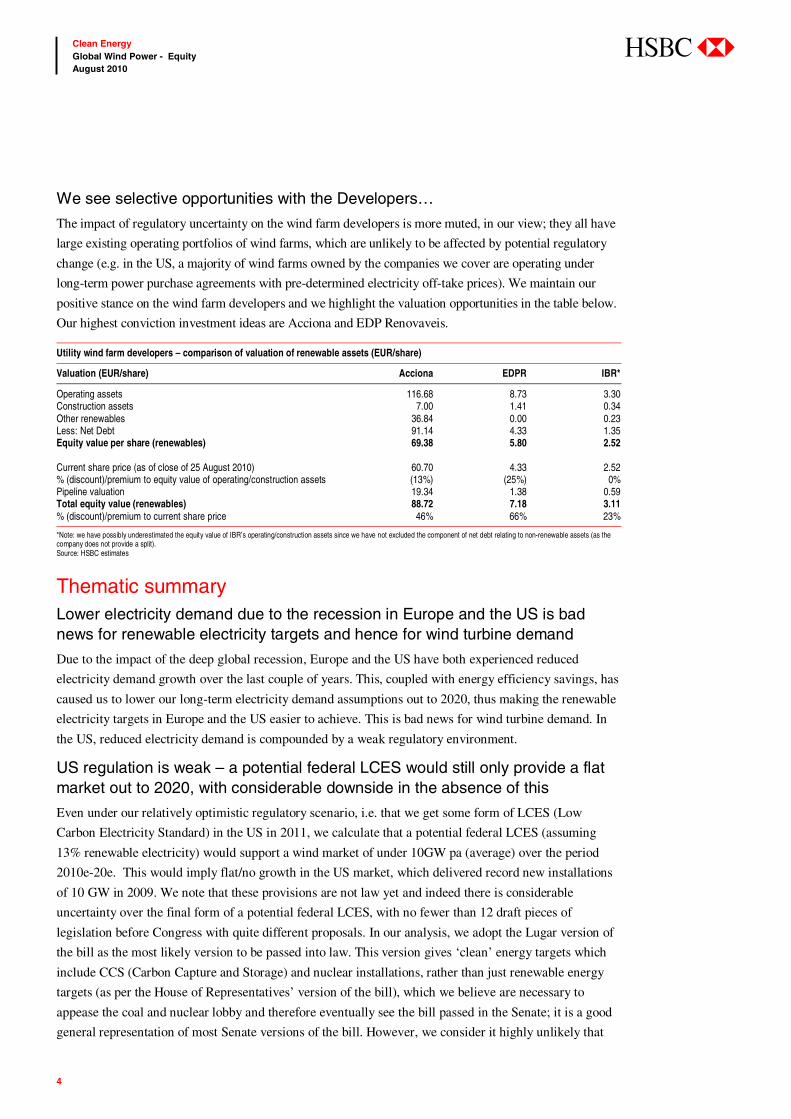
We see selective opportunities with the Developers…
The impact of regulatory uncertainty on the wind farm developers is more muted, in our view; they all have
large existing operating portfolios of wind farms, which are unlikely to be affected by potential regulatory
change (e.g. in the US, a majority of wind farms owned by the companies we cover are operating under
long-term power purchase agreements with pre-determined electricity off-take prices). We maintain our
positive stance on the wind farm developers and we highlight the valuation opportunities in the table below.
Our highest conviction investment ideas are Acciona and EDP Renovaveis.
Utility wind farm developers – comparison of valuation of renewable assets (EUR/share)
Valuation (EUR/share) Acciona EDPR IBR*
Operating assets 116.68 8.73 3.30 Construction assets 7.00 1.41 0.34 Other renewables 36.84 0.00 0.23 Less: Net Debt 91.14 4.33 1.35 Equity value per share (renewables) 69.38 5.80 2.52 Current share price (as of close of 25 August 2010) 60.70 4.33 2.52 % (discount)/premium to equity value of operating/construction assets (13%) (25%) 0% Pipeline valuation 19.34 1.38 0.59 Total equity value (renewables) 88.72 7.18 3.11 % (discount)/premium to current share price 46% 66% 23%
*Note: we have possibly underestimated the equity value of IBR’s operating/construction assets since we have not excluded the component of net debt relating to non-renewable assets (as the company does not provide a split). Source: HSBC estimates
Thematic summary Lower electricity demand due to the recession in Europe and the US is bad news for renewable electricity targets and hence for wind turbine demand
Due to the impact of the deep global recession, Europe and the US have both experienced reduced
electricity demand growth over the last couple of years. This, coupled with energy efficiency savings, has
caused us to lower our long-term electricity demand assumptions out to 2020, thus making the renewable
electricity targets in Europe and the US easier to achieve. This is bad news for wind turbine demand. In
the US, reduced electricity demand is compounded by a weak regulatory environment.
US regulation is weak – a potential federal LCES would still only provide a flat market out to 2020, with considerable downside in the absence of this
Even under our relatively optimistic regulatory scenario, i.e. that we get some form of LCES (Low
Carbon Electricity Standard) in the US in 2011, we calculate that a potential federal LCES (assuming
13% renewable electricity) would support a wind market of under 10GW pa (average) over the period
2010e-20e. This would imply flat/no growth in the US market, which delivered record new installations
of 10 GW in 2009. We note that these provisions are not law yet and indeed there is considerable
uncertainty over the final form of a potential federal LCES, with no fewer than 12 draft pieces of
legislation before Congress with quite different proposals. In our analysis, we adopt the Lugar version of
the bill as the most likely version to be passed into law. This version gives ‘clean’ energy targets which
include CCS (Carbon Capture and Storage) and nuclear installations, rather than just renewable energy
targets (as per the House of Representatives’ version of the bill), which we believe are necessary to
appease the coal and nuclear lobby and therefore eventually see the bill passed in the Senate; it is a good
general representation of most Senate versions of the bill. However, we consider it highly unlikely that
5
Clean Energy Global Wind Power - Equity August 2010
abc
this will be passed before the mid-term elections in November. Furthermore, note that any provisions
coming out of the Senate still need to be reconciled with the House of Representatives’ version of the bill
(the Waxman-Markey bill) before eventually moving for President Obama’s sign-off. The Waxman-
Markey bill gives renewable energy targets rather than ‘clean’ energy targets and is therefore more
favourable for renewables and wind, in our view.
In the absence of federal legislation, the main support mechanism for the US market would be the State
level legislation. Currently, some 31 states have their own targets for renewable electricity, known as
state level RPSs (Renewable Portfolio Standards), and a further 6 states have some sort of informal target
(ie not formally a state RPS). Based on states with an RPS or informal target alone, the US market would
be only a 5GW pa (average) wind market until 2020. If we consider only states with penalty schemes to
support their state level RPS targets (just 16 states), we calculate wind demand in the US of just 3.6GW
pa (average) up to 2020. This eventuality is unlikely, but nevertheless would be disastrous for the wind
companies, in our view.
In our view, GE, Mitsubishi and Clipper will suffer more than most players since these companies all
have more than 85% sales exposure to the US market. Vestas, Gamesa and Suzlon all have around 25%
of their sales from the US.
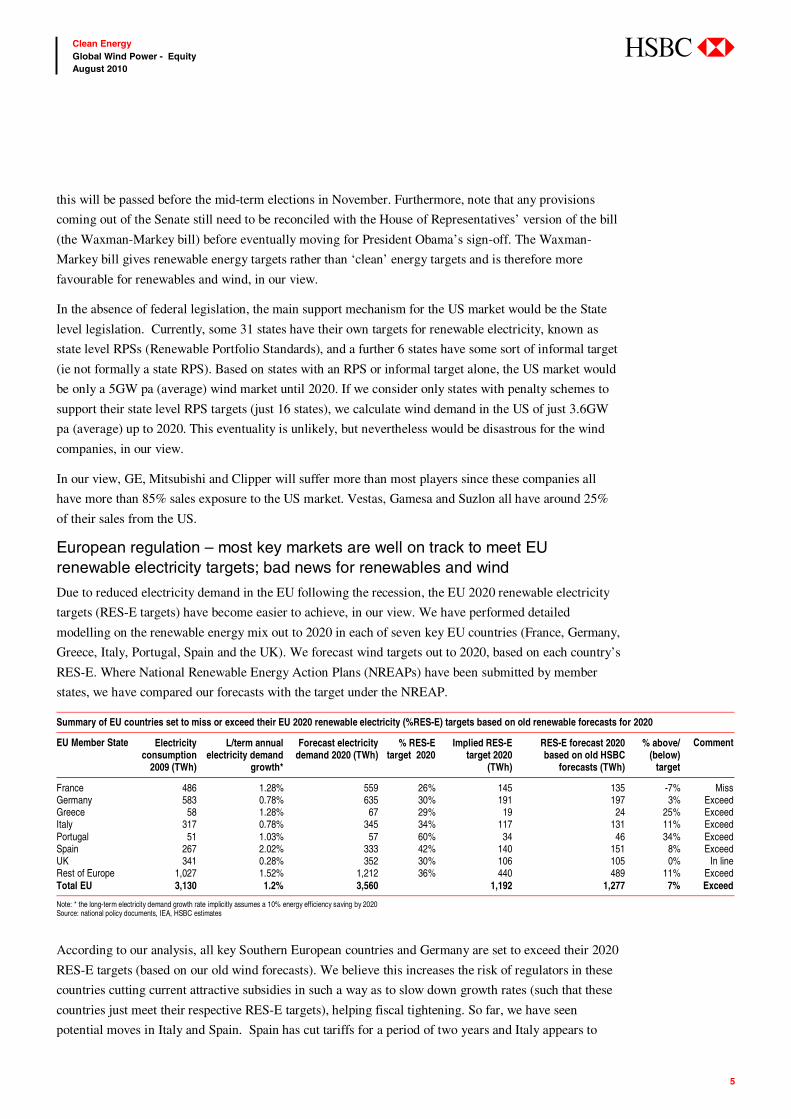
European regulation – most key markets are well on track to meet EU renewable electricity targets; bad news for renewables and wind
Due to reduced electricity demand in the EU following the recession, the EU 2020 renewable electricity
targets (RES-E targets) have become easier to achieve, in our view. We have performed detailed
modelling on the renewable energy mix out to 2020 in each of seven key EU countries (France, Germany,
Greece, Italy, Portugal, Spain and the UK). We forecast wind targets out to 2020, based on each country’s
RES-E. Where National Renewable Energy Action Plans (NREAPs) have been submitted by member
states, we have compared our forecasts with the target under the NREAP.
Summary of EU countries set to miss or exceed their EU 2020 renewable electricity (%RES-E) targets based on old renewable forecasts for 2020
EU Member State Electricity consumption
2009 (TWh)
L/term annual electricity demand
growth*
Forecast electricity demand 2020 (TWh)
% RES-E target 2020
Implied RES-E target 2020
(TWh)
RES-E forecast 2020 based on old HSBC
forecasts (TWh)
% above/ (below)
target
Comment
France 486 1.28% 559 26% 145 135 -7% MissGermany 583 0.78% 635 30% 191 197 3% ExceedGreece 58 1.28% 67 29% 19 24 25% ExceedItaly 317 0.78% 345 34% 117 131 11% ExceedPortugal 51 1.03% 57 60% 34 46 34% ExceedSpain 267 2.02% 333 42% 140 151 8% ExceedUK 341 0.28% 352 30% 106 105 0% In lineRest of Europe 1,027 1.52% 1,212 36% 440 489 11% ExceedTotal EU 3,130 1.2% 3,560 1,192 1,277 7% Exceed
Note: * the long-term electricity demand growth rate implicitly assumes a 10% energy efficiency saving by 2020 Source: national policy documents, IEA, HSBC estimates
According to our analysis, all key Southern European countries and Germany are set to exceed their 2020
RES-E targets (based on our old wind forecasts). We believe this increases the risk of regulators in these
countries cutting current attractive subsidies in such a way as to slow down growth rates (such that these
countries just meet their respective RES-E targets), helping fiscal tightening. So far, we have seen
potential moves in Italy and Spain. Spain has cut tariffs for a period of two years and Italy appears to

6
Clean Energy Global Wind Power - Equity August 2010
abc
have shied away from making cuts, at least for now. In addition, the Spanish government has cut its wind
target for 2020 to 38GW from 41GW. We find that the France is the only country that is set to miss its
2020 RES-E target (relative to our old forecasts). The UK is more or less on track to meet its target.
Enercon and Gamesa have the highest exposure to these markets, from which they both derive around
50% of their sales. Vestas, Nordex and REpower derive around a third of their sales from these markets.
Wind industry demand forecasts – we cut our forecasts in the US and Europe but increase forecasts in China
Due to lower electricity demand following the deep recession in Europe and the US, and weak regulation
in the US, we cut our wind forecasts in these regions. In the US, we now forecast flat new installation
growth over the next five years (from 7% pa previously) and in Europe, we forecast 5% pa growth (from
7% pa previously), although we see pockets of stronger growth in the UK (13% pa) and France (11% pa).
Global wind demand forecasts – summary of changes (MW)
2010e 2011e 2012e 2013e 2014e Total 2010e-14e
Old forecast 36,963 41,896 45,920 50,094 53,810 228,683 New forecast 36,325 40,275 45950 49,275 52,450 225,275 Difference -638 -621 30 -819 -1,360 -3,408 % increase/(decrease) -1.7% -1.5% 0.1% -1.6% -2.5% -1.5% Due to: Decrease in US -1,693 -2,496 -2,995 -3,969 -4,460 -15,613 Decrease in Europe -895 -550 -400 -800 -1,275 -3,920 Increase in China 1,000 1,000 1,500 2,000 2,500 8,000 Increase in RoW 950 1,425 1,925 1,950 1,875 8,125 Total change in forecasts -638 -621 30 -819 -1,360 -3,408
Source: HSBC estimates
We cut our five year global demand CAGR to 7.0% from 7.5% previously and our 10-year industry demand
CAGR forecast to 5.5% from 6.7% previously. We would have cut our global wind market forecasts by
more but for support from a strong Chinese market and also pockets of growth in emerging markets in areas
such as South America, Eastern Europe, Turkey and Canada. China will be the most significant driver of
global growth, in our view. We forecast that it will account for 38% of the global market over the next five
Key EU markets – change in new installation forecast for the period 2010e-20e (LHS) and 5-year annual installation demand CAGR (RHS)
-6,000
-5,000
-4,000
-3,000
-2,000
-1,000
0
1,000
2,000
3,000
4,000
France Germany Greece Italy Portugal Spain UK
-15%
-10%
-5%
0%
5%
10%
15%
20%
25%
30%
Increase/ (decrease) in new installation forecast New 5-y ear CAGR Old 5 y ear CAGR
Source: EU policy documents, HSBC estimates

7
Clean Energy Global Wind Power - Equity August 2010
abc
years (2010e-14e) and will grow at 8% pa. The current National Development and Reform Commission
(NDRC) target for wind in China is 150GW by 2020, but the goal post keeps moving (the target has been
upgraded three times in the last five years). We forecast cumulative capacity of 241GW by 2020.
We analyse the exposure of key wind OEMs to three market groupings that we define as “high growth”,
“growth” and “ex-growth”. The Chinese manufactures, Sinovel, Goldwind and Dongfang, currently have the
best growth prospects in our view, on the back of domestic Chinese market growth. Furthermore they are all
looking to internationalise, particularly into the US; any new market penetration will add to their growth
profile. Clipper, GE and Gamesa are the least exposed to growth markets (roughly 0-25% of sales exposed to
such markets). Vestas, Suzlon, REpower and Nordex all have good exposure to growth markets (roughly 40-
60% of sales exposed to such markets). These are the best positioned of the non-Chinese players, in our view.
We expect no supply bottlenecks in the coming years, in fact we think the market is oversupplied
The wind industry dynamic has changed considerably since early 2008. In early 2008, due to strong
growth in the industry over the period 2005-08 (4-year CAGR of 34%), there were bottlenecks in some
parts of the supply chain. However, the credit crisis (from September 2008) led to a dry up in project
finance for renewable projects and order flow slowed to a trickle. Due to this, today, wind turbine
manufacturers and their sub-suppliers have found themselves with under utilised factory space, following
a period of heavy investment in the run up to the credit crisis.
HSBC forecast global wind turbine demand (grey line) versus global supply of key components in 2012e (MW)
0 5 10 15 20 25 30 35 40 45 50 55 60 65 70 75 80 85 90 95
Tow ers
Castings
Bearings
Blades
Generators
Gearbox es
WTGs (nacelles)
Source: EU policy documents, HSBC estimates
We do not see any bottlenecks of any key components in the coming years (2010e-12e), based on our global
demand forecasts and MAKE Consulting’s supply forecasts. We see bearings as the tightest part of the value
chain but still with 11% overcapacity by 2012e. We also note that increasing demand for larger turbines could
create bottlenecks in some other large-sized (2MW or higher) components. There are, however, important
differences between regional supply chains: Asia is in short supply of larger turbines, these will likely need to
be exported from overseas (which is more expensive than sourcing from within Asia); the Americas are in
short supply of gearboxes and generators, again these will likely need to be imported, probably from Europe.
8
Clean Energy Global Wind Power - Equity August 2010
abc
It is not as important to be vertically integrated as it was pre-2008, when there were shortages in a number
of key components. That said, we still believe it is beneficial for a global wind turbine manufacturer to
have in-house capacity in most key components and ideally with a global spread. This will help quality
control and also reduce transportation costs due to proximity to regional markets, in our view. In the case
of Vestas and Gamesa (and other Western wind turbine manufactures), which have integrated facilities in
China, in-house capacity should also give access to cheaper manufacturing costs. Vestas, Gamesa and
Suzlon all have a good level of in-house manufacturing capacity, although Vestas and Suzlon both have
no in-house gearbox capacity. Vestas has the mostly globally spread manufacturing capacity with
factories in six European countries, the US, India and China.
We expect M&A to return to the sector
Following a period of industry consolidation in the early 2000s, globally, the competitive landscape for
the wind sector is becoming more fragmented once again. This is driven by the emergence of a large
number of domestic, Chinese players, of which a small number (Sinovel, Goldwind and DongFang) are
taking significant global market share on the back of a strong Chinese market. We see further
fragmentation in the coming years due to the emergence of Korean players such as Daewoo, Hyundai,
and Samsung. This increased fragmentation, coupled with anaemic growth (relative to previous years) in
the US and Europe increases the chances of M&A in the coming years.
We see the Chinese and Korean players as potential acquirers as they internationalise. In particular,
acquisition of a European player to penetrate Europe, where the grid codes are more stringent and thus
require higher-tech turbines (with power control electronics), would make sense, in our view.
Long-term (ie ten years out), we see the top 10 players comprising Vestas, one other European player,
GE, and Siemens, with the remainder split between Chinese and Korean players.
Order flow data supports our industry forecasts (near term) and suggests most manufacturers are on track to meet our 2010 volume sales forecasts
We have analysed order data since the start of 2007 for a selection of leading wind OEMs, which publicly
announce their orders (albeit only material ones). We have analysed a total of 49GW worth of orders,
which correspond mostly to ‘global ex-Asia’ orders (44GW). Of the ‘global ex-Asia’ orders, 12.3GW
correspond to 2010 projects, which equate to 67% of our ‘global ex-Asia’ forecast for 2010 (18.4GW).
This compares to 2009 announced orders, which represented just 55% of the wind turbine market
(22.3GW) in that year. Thus, bottom-up data suggests the wind industry is well on track to meet our 2010
market forecast. We note that wind OEMs typically announce c70% of their actual orders for a given
year. The remaining 30% relate to smaller projects that creep under the radar.
We extend our analysis to look at individual wind OEMs’ announced orders versus our volume sales
forecasts. Gamesa, Suzlon and Clipper are all on track to meet our 2010 volume sales forecasts. Vestas is
off track: in 2009, Vestas announced projects relating to 73% of its full year sales; thus far in 2010 it has
only announced projects relating to 53% of our HSBC volume sales forecast (and this is with our cut
2010 forecasts to match the company’s revised EUR6bn revenue target).

9
Clean Energy Global Wind Power - Equity August 2010
abc
Investment ideas Our sector stance
Our preference is for the wind developers and we are cautious on the OEMs. Our highest conviction
investment ideas among wind farm developers remain Acciona and EDP R (both Overweight (V)).
However, in this note we have lowered our lower tariff expectations going forward and this has resulted
in reductions in price targets for the developers. We have cut our target price for Acciona to EUR94
(previously EUR120) and for Iberdrola Renovables to EUR3.50 (previously EUR4.00). We have also cut
our target price on EDP Renovaveis (OW(V)) to EUR7.25 from EUR8.00 and on EDF Energies
Nouvelles (N(V)) to EUR34.00 from EUR40.00. We maintain our rating and target price on Terna
Energy (Overweight (V), TP EUR5.00).
We have developed a qualitative scorecard to rank the wind developers on a number of criteria.
Qualitative scorecard We have developed a performance scorecard for the wind farm developers. EDPR is our highest
conviction idea and Acciona is second as per this scorecard (see table on page 12).
EDPR and Acciona are our highest conviction ideas EDPR provides the best disclosure and is second best (after IBR) in terms of portfolio size, financial
strength and quality of management. EDPR currently provides the most potential return out of the wind
farm developers.
Acciona is amongst the top-three ranked stocks on 4 out of the 6 criteria, and provides second-best
potential return out of the wind farm developers.
We note that based on the first-stage score, IBR is the strongest company but in our view its share price
does not offer as high return potential as EDPR and Acciona, thus overall it is ranked number 3 behind
EDPR and Acciona.
Methodology
Our two-stage scorecard takes into account a) a performance metric (comprising of various qualitative
and quantitative criteria) and b) potential return on the stock.
At the first stage, the quantitative criteria include the portfolio size, grants/allocations received, electricity
pricing risk/ regulatory risk, financial strength, and the future growth profile. For the qualitative criteria, we
include strategic targets/ quality of management and the level of disclosure provided by a particular company.
To the ranks of each company on every criterion, we then apply different weights (which we assign based
on our view of their relative importance to the company’s performance) and arrive at first-stage score.
The second-stage ranks the stocks on the potential return offered by a stock and multiply the rank with a
multiple (10x) to arrive at the second-stage score.
We apply equal weights to the two scores from the end of each stage and the sum total of the two
weighted score gives us our overall ranking.

10
Clean Energy Global Wind Power - Equity August 2010
abc
The scores are given in descending order (from 5 to 1), meaning better a company is on a particular
criterion, the higher the score it gets. For example, the level of disclosure is best for EDPR so it gets a score
of 5 on that criterion while Terna Energy is weakest in disclosures and hence it gets the lowest score of 1.
Stage I – Performance metric In stage I, we compare the major wind farm developers on various qualitative and quantitative factors,
which we believe are important when making an investment decision on their stocks:
Portfolio size: IBR is the largest wind player in the world with 11GW of operating assets. Acciona
has the largest non-wind renewable business in the world with 1.1GW of STEG, Solar PV, small
hydro/hydro and biomass operating assets.
Recent market developments: we focus on (i) US Treasury grant disbursement (USD4.8bn in cash),
(ii) Spanish project pre-registration (9GW of renewable projects allocated out to 2012) and (iii)
recent large offshore development right allocations in the UK totalling 32GW (enough to power a
quarter of the UK’s electricity). IBR was a winner in all three markets.
Electricity pricing risk: how secure are the wind farm developers’ cash flows? Acciona is most
exposed to electricity prices, with 73% exposure to Spain (unhedged). IBR and EDPR are both
hedged. EDF EN has no exposure to Spain.
Financial strength: IBR and EDPR have strong financial support from their parent groups, which
provide credit for the financing of nearly all of their wind farms. EDF EN and Acciona raise project
finance, which has made financing difficult over the last year or so; however, the project finance
markets are now starting to improve.
Growth profile: EDPR offers the most attractive earnings (EPS) growth with a three year EPS
CAGR of 24% over 2010e-13e. EDF EN has the best three year EBITDA CAGR of 20%.
Strategic targets and detailed disclosure: Information disclosure is good at EDPR and IBR at all levels.
Acciona and EDF EN give their long-term new installations (wind and other renewables) as well as their
financial targets but limited or no information on capacity factors and wind tariffs across geographies.

11
Clean Energy Global Wind Power - Equity August 2010
abc
Stage II – Valuation The stage II ranks the stocks on the basis of the potential return currently provided by it. The more
potential return a stock has, the higher score it gets. Out of the wind farm developers, EDPR currently has
the most potential upside while Acciona is the second best.
Wind farm developers – Relative valuation scorecard
INPUT
Stage I – Performance Metric IBR EDPR Acciona EDF EN Terna Energy Portfolio size 5 4 3 2 1 Grants/allocations 5 3 4 2 1 Electricity pricing risk/regulatory risk 3 2 1 5 4 Financial strength 5 4 3 2 1 Growth profile 5 3 2 4 1 Strategic targets/management 3 4 2 5 1 Disclosure 4 5 3 2 1 Score 30 25 18 22 10 1 2 4 3 5 Stage II – Valuation Potential return (%) 39% 67% 55% 10% 46% 2 5 4 1 3 OUTPUT Stage I – Performance Metric Weighting IBR EDPR Acciona EDF EN Terna Energy Portfolio size 10% 5 4 3 2 1 Grants/allocations 10% 5 3 4 2 1 Electricity pricing risk 30% 9 6 3 15 12 Financial strength 20% 10 8 6 4 2 Growth profile 10% 5 3 2 4 1 Strategic targets/management 10% 3 4 2 5 1 Disclosure 10% 4 5 3 2 1 Score – Performance metric 100% 41 33 23 34 19 Stage I ranking 1 3 4 2 5 Stage II – Valuation Score – Potential return (%) 100% 20 50 40 10 30 Valuation ranking 4 1 2 5 3 Total score 61 83 63 44 49
Overall ranking 3 1 2 5 4
Source: HSBC
Among wind turbine manufacturers we downgrade Gamesa from OW(V) to N(V) due to the cuts in our
industry growth expectations. We decrease our target price for Gamesa to EUR5.50 from EUR14.00.
We also cut our target price for REpower to EUR115 from EUR150 and rating from Overweight (V)
rating to Neutral (V). For Vestas, the 27% share price reduction in its value after the August 18th profit
warning has meant that we still see value in Vestas, although short term catalysts for re-rating are harder
to see. We decrease our target price for Vestas to DKK300 from DKK425. We maintain our target price
for Nordex of EUR10, and our Overweight (V) rating. We have increased our target price for Clipper to
GBP1.00 (from GBP0.9) and upgrade our Neutral (V) rating on the stock to OW(V), based on our
expectation of potential new orders. We cut our target price for Suzlon to INR42 from INR50, but
maintain our Underweight (V) rating on the stock.

12
Clean Energy Global Wind Power - Equity August 2010
abc
Valuation summary Wind coverage – summary target prices and ratings (Price as close of 25 August 2010)
Stock Bloomberg Currency New TP Previous TP % potential return New rating Previous rating
Wind farm developers Acciona ANA SM EUR 94.00 120.00 55% Overweight (V) Overweight (V) Iberdrola Renovables IBR SM EUR 3.50 4.00 39% Overweight (V) Overweight (V) Terna Energy TENERGY GA EUR 5.00 5.00 45% Overweight (V) Overweight (V) EDP Renovaveis EDPR PL EUR 7.25 8.00 67% Overweight (V) Overweight (V) EDF Energies Nouvelles EEN FP EUR 34.00 40.00 10% Neutral (V) Neutral (V) Wind OEMs Vestas VWS DC DKK 300.00 425.00 32% Overweight (V) Overweight (V) Clipper CWP LN GBP 1.00 0.90 130% Overweight (V) Neutral (V) Nordex NDX1 GR EUR 10.00 10.00 47% Overweight (V) Overweight (V) Gamesa GAM SM EUR 5.50 14.00 8% Neutral (V) Overweight (V) REpower RPW GR EUR 115.00 150.00 17% Neutral (V) Overweight (V) Suzlon SUEL IN INR 42.00 50.00 -15% Underweight (V) Underweight (V)
Hansen Transmissions HSN LN GBP 0.95 1.35 76% Overweight (V) Overweight (V)
Source: Bloomberg, HSBC
Valuation data (price as of close of 25th Aug. 2010)
New Previous C’cy New Previous Current Potential ____EV/sales _____ ____EV/EBITDA _____ __ HSBC PE ____ ________ PEG _________ P/BV rating rating TP TP Price Return 2010e 2011e 2012e 2010e 2011e 2012e 2010e 2011e 2012e 2010e 2011e 2012e 2010e
Wind farm developers Acciona OW(V) OW(V) EUR 94.00 120.00 60.70 55% 1.6 1.6 1.6 9.0 8.1 7.4 18.4 14.5 12.1 1.0 1.0 1.1 0.7IBR OW(V) OW(V) EUR 3.50 4.00 2.52 39% 6.2 5.8 5.3 10.0 9.1 8.1 23.8 20.6 17.2 1.4 1.4 1.2 0.8Terna Energy
OW(V) OW(V) EUR 5.00 5.00 3.43 46% 6.8 6.1 4.4 17.4 12.0 7.3 31.9 18.0 9.9 N/A N/A n.m. 1.0
EDPR OW(V) OW(V) EUR 7.25 8.00 4.33 67% 6.8 6.3 5.8 8.4 7.7 7.0 30.8 26.1 19.7 1.3 1.0 0.8 0.7EDF EN N(V) N(V) EUR 34.00 40.00 30.89 10% 4.7 4.6 4.4 14.5 12.8 11.8 21.9 16.8 13.5 0.9 1.0 1.1 1.7 Mean 5.2 4.9 4.3 11.9 9.9 8.3 25.4 19.2 14.5 1.2 1.1 1.1 1.0 Median 6.2 5.8 4.4 10.0 9.1 7.4 23.8 18.0 13.5 1.2 1.0 1.1 0.8Wind OEMs Vestas OW(V) OW(V) DKK 300.00 425.00 228.00 32% 1.1 0.9 0.8 10.8 6.5 5.4 31.5 11.6 9.2 0.6 0.8 0.9 1.8Clipper OW(V) N(V) GBP 1.00 0.90 0.44 130% 0.1 0.0 0.0 6.2 1.1 0.7 n.m. 12.6 9.2 0.8 0.3 0.2 naNordex OW(V) OW(V) EUR 10.00 10.00 6.82 47% 0.2 0.2 0.1 4.1 2.9 1.9 18.5 11.4 7.1 na n.m. n.m. 1.2Gamesa N(V) OW(V) EUR 5.50 14.00 5.10 8% 0.7 0.6 0.6 7.8 6.7 6.1 21.4 16.4 12.4 0.7 0.7 0.7 0.8REpower N(V) OW(V) EUR 115.00 150.00 98.48 17% 0.5 0.4 0.3 6.0 5.3 4.2 15.8 14.8 12.4 na na n.m. 1.9Suzlon UW(V) UW(V) INR 42.00 50.00 49.60 -15% 1.0 0.9 0.8 17.8 12.5 9.3 n.m. n.m. 41.2 0.2 n.m. 0.7 1.2
Hansen OW(V) OW(V) GBP 0.95 1.35 0.54 76% 1.0 0.8 0.7 10.4 7.2 5.1 n.m. 30.6 10.6 na 0.7 0.2 0.7
Mean 0.6 0.6 0.5 9.0 6.0 4.7 21.8 16.2 10.2 0.6 0.6 0.5 1.3 Median 0.7 0.6 0.6 7.8 6.5 5.1 19.9 13.7 9.9 0.7 0.7 0.7 1.2
Source: Bloomberg, HSBC estimates

13
Clean Energy Global Wind Power - Equity August 2010
abc
Summary of changes to EPS estimates HSBC wind stock coverage – Summary of changes in our EPS forecast for 2010e-12e
Currency _____________2010e ____________ _____________ 2011e ____________ _____________ 2012e ____________ New Old % change New Old % change New Old % change
Windfarm developers Acciona EUR 3.30 5.60 (41%) 4.19 7.03 (40%) 5.00 8.44 (43%) IBR EUR 0.11 0.10 3% 0.12 0.12 2% 0.15 0.15 0% EDPR EUR 0.14 0.17 (15%) 0.17 0.19 (13%) 0.22 0.24 (9%) EDF EN EUR 1.41 1.23 15% 1.84 1.65 11% 2.29 1.67 37% Wind OEMs Vestas EUR 0.97 2.52 -61% 2.65 3.01 -12% 3.32 3.56 -7% Gamesa EUR 0.24 0.42 -43% 0.31 0.64 -52% 0.41 0.81 -49% Clipper USD 0.00 0.00 nm 0.06 0.06 0% 0.07 0.08 -14% REpower EUR 7.05 6.22 -12% 8.29 6.66 -20% 7.96 na na Nordex EUR 0.37 0.37 0% 0.60 0.60 0% 0.96 0.96 0% Suzlon INR -3.70 1.11 nm -0.99 4.36 nm 0.42 6.99 -94% Hansen EUR 0.00 0.00 nm 0.029 0.031 -6% 0.07 0.08 -14%
Source: HSBC estimates. For Suzlon, REpower and Hansen above, 2010-12e refer to FY1-FY13e
Why change forecasts and valuations?
We have made changes to target prices for our coverage universe of wind OEMs and wind farm
developers. The main catalysts are:
Weaker electricity demand in the EU. We have undertaken a detail review of the renewable
electricity (RES-E) targets for 2020 in the EU, including our own proprietary analysis of a possible
renewable energy mix in seven key EU wind markets that will allow these markets to hit their RES-E
targets for 2020. This has caused us to revise down our European market forecasts
Weaker electricity demand and a weak regulatory environment in the US. We have undertaken a
detailed review of the complex US regulatory environment, including an analysis of the state-level
Renewable Portfolio Standards (“RPSs”) and a potential federal Low Carbon Electricity Standard
(“LCES”). This has caused us to revise down our US market forecasts
Detailed analysis of global market data for 2009. This has caused us to revisit our global market
forecasts and market share model. In particular we consider the impact of the Chinese market and
Chinese wind turbine manufacturers (now three top 10 players, albeit on the strength of their
domestic market) on the global wind industry
Detailed analysis of trends in wind order flow over the last three and half years. We have looked at
spot project and framework projects pending in the coming years in order to match our top-down
regulatory analysis to the bottom up data in the coming years. This has caused us to revise down our
near term forecasts globally (in conjunction with our European and US regulatory analysis)
Although not the primary driver of this report, we have also updated our forecasts to reflect recent results
released by a number of our companies.
So what has changed?
Downgrading our global market forecasts
We downgrade our forecasts for the global wind power market, due to cuts to our US and European
forecasts out to 2020, which more than offset the increase we made to our Chinese market forecast. Our
14
Clean Energy Global Wind Power - Equity August 2010
abc
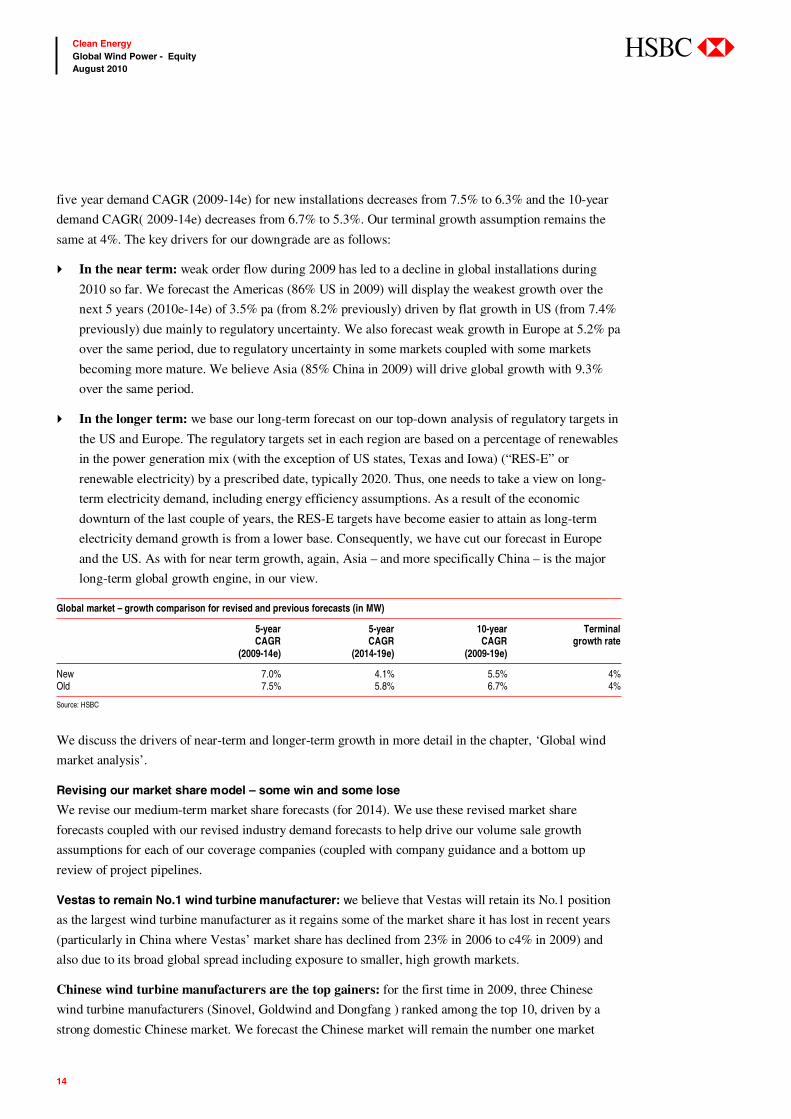
five year demand CAGR (2009-14e) for new installations decreases from 7.5% to 6.3% and the 10-year
demand CAGR( 2009-14e) decreases from 6.7% to 5.3%. Our terminal growth assumption remains the
same at 4%. The key drivers for our downgrade are as follows:
In the near term: weak order flow during 2009 has led to a decline in global installations during
2010 so far. We forecast the Americas (86% US in 2009) will display the weakest growth over the
next 5 years (2010e-14e) of 3.5% pa (from 8.2% previously) driven by flat growth in US (from 7.4%
previously) due mainly to regulatory uncertainty. We also forecast weak growth in Europe at 5.2% pa
over the same period, due to regulatory uncertainty in some markets coupled with some markets
becoming more mature. We believe Asia (85% China in 2009) will drive global growth with 9.3%
over the same period.
In the longer term: we base our long-term forecast on our top-down analysis of regulatory targets in
the US and Europe. The regulatory targets set in each region are based on a percentage of renewables
in the power generation mix (with the exception of US states, Texas and Iowa) (“RES-E” or
renewable electricity) by a prescribed date, typically 2020. Thus, one needs to take a view on long-
term electricity demand, including energy efficiency assumptions. As a result of the economic
downturn of the last couple of years, the RES-E targets have become easier to attain as long-term
electricity demand growth is from a lower base. Consequently, we have cut our forecast in Europe
and the US. As with for near term growth, again, Asia – and more specifically China – is the major
long-term global growth engine, in our view.
Global market – growth comparison for revised and previous forecasts (in MW)
5-year 5-year 10-year Terminal CAGR CAGR CAGR growth rate (2009-14e) (2014-19e) (2009-19e)
New 7.0% 4.1% 5.5% 4% Old 7.5% 5.8% 6.7% 4%
Source: HSBC
We discuss the drivers of near-term and longer-term growth in more detail in the chapter, ‘Global wind
market analysis’.
Revising our market share model – some win and some lose
We revise our medium-term market share forecasts (for 2014). We use these revised market share
forecasts coupled with our revised industry demand forecasts to help drive our volume sale growth
assumptions for each of our coverage companies (coupled with company guidance and a bottom up
review of project pipelines.
Vestas to remain No.1 wind turbine manufacturer: we believe that Vestas will retain its No.1 position
as the largest wind turbine manufacturer as it regains some of the market share it has lost in recent years
(particularly in China where Vestas’ market share has declined from 23% in 2006 to c4% in 2009) and
also due to its broad global spread including exposure to smaller, high growth markets.
Chinese wind turbine manufacturers are the top gainers: for the first time in 2009, three Chinese
wind turbine manufacturers (Sinovel, Goldwind and Dongfang ) ranked among the top 10, driven by a
strong domestic Chinese market. We forecast the Chinese market will remain the number one market
15
Clean Energy Global Wind Power - Equity August 2010
abc
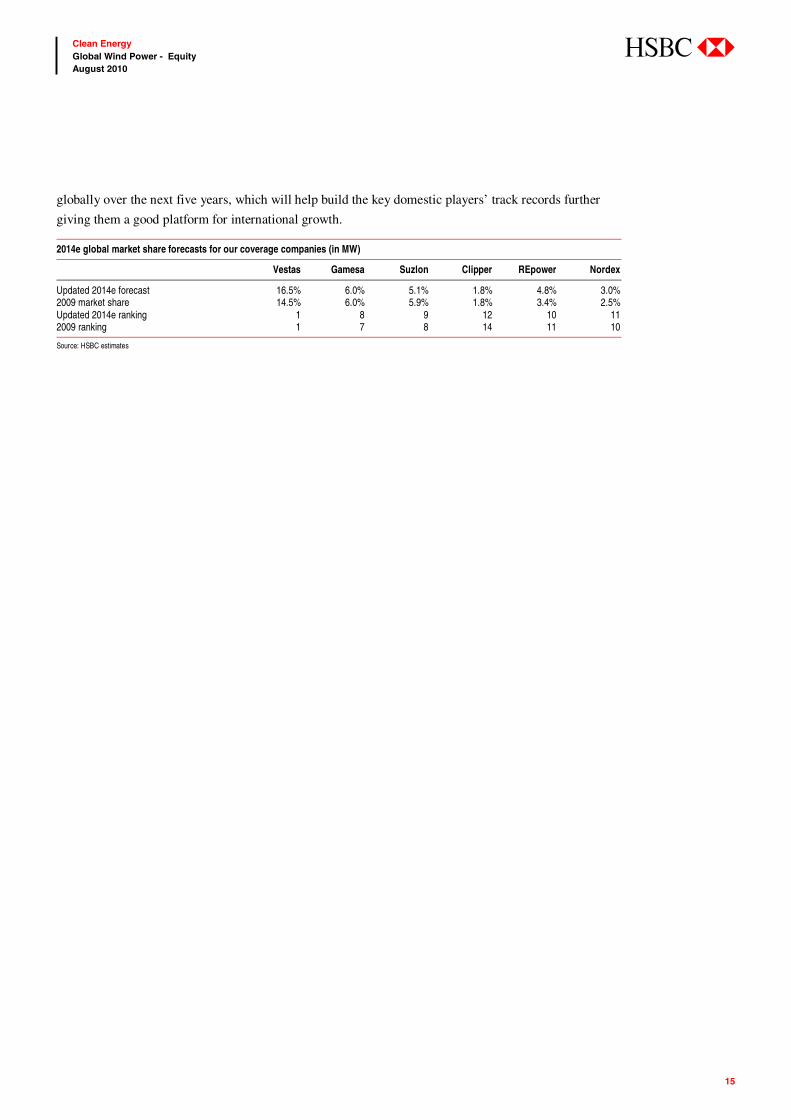
globally over the next five years, which will help build the key domestic players’ track records further
giving them a good platform for international growth.
2014e global market share forecasts for our coverage companies (in MW)
Vestas Gamesa Suzlon Clipper REpower Nordex
Updated 2014e forecast 16.5% 6.0% 5.1% 1.8% 4.8% 3.0% 2009 market share 14.5% 6.0% 5.9% 1.8% 3.4% 2.5% Updated 2014e ranking 1 8 9 12 10 11 2009 ranking 1 7 8 14 11 10
Source: HSBC estimates
16
Clean Energy Global Wind Power - Equity August 2010
abc
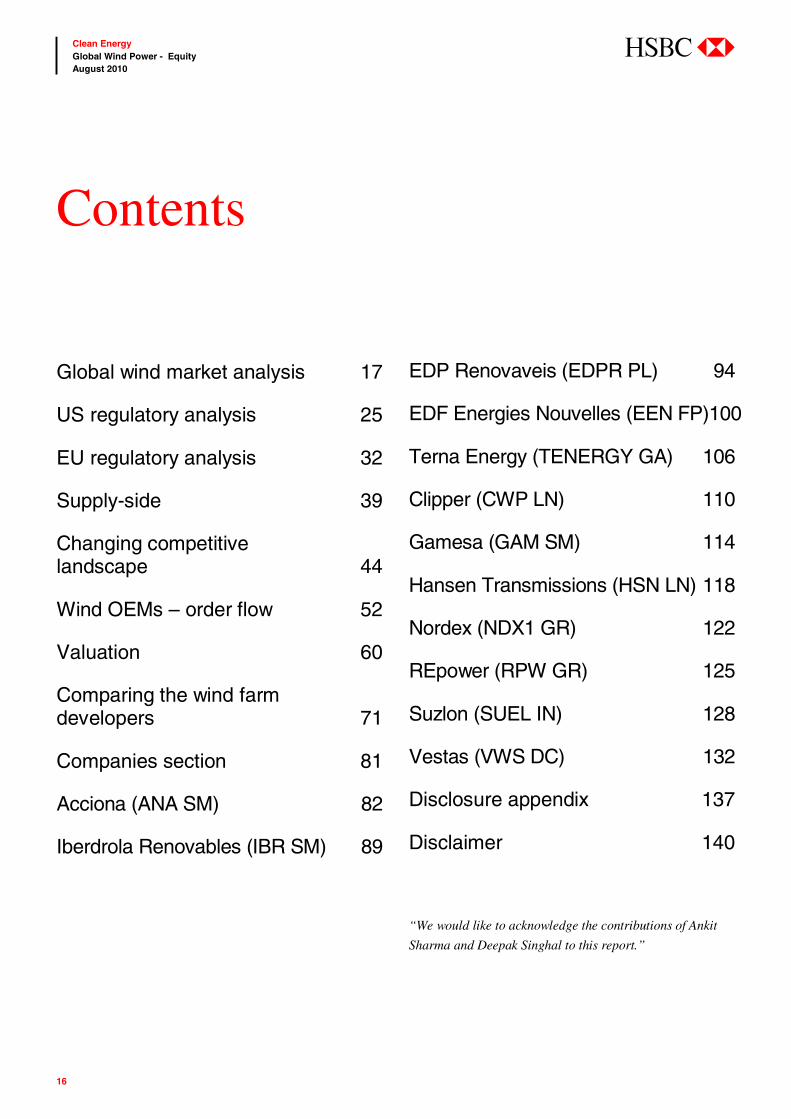
Global wind market analysis 17
US regulatory analysis 25
EU regulatory analysis 32
Supply-side 39
Changing competitive landscape 44
Wind OEMs – order flow 52
Valuation 60
Comparing the wind farm developers 71
Companies section 81
Acciona (ANA SM) 82
Iberdrola Renovables (IBR SM) 89
EDP Renovaveis (EDPR PL) 94
EDF Energies Nouvelles (EEN FP)100
Terna Energy (TENERGY GA) 106
Clipper (CWP LN) 110
Gamesa (GAM SM) 114
Hansen Transmissions (HSN LN) 118
Nordex (NDX1 GR) 122
REpower (RPW GR) 125
Suzlon (SUEL IN) 128
Vestas (VWS DC) 132
Disclosure appendix 137
Disclaimer 140
“We would like to acknowledge the contributions of Ankit
Sharma and Deepak Singhal to this report.”
Contents

17
Clean Energy Global Wind Power - Equity August 2010
abc
Industry forecasts: China the main driver We cut our five year global demand CAGR
estimate to 7.0% from 7.5% previously and our 10-
year industry demand CAGR forecast to 5.5% from
6.7% previously, primarily driven by the following:
Europe: reduced electricity demand resulting in
reduced renewable targets in most key European
markets. We cut our five year demand CAGR
estimate to 5% from 7% previously.
US: reduced electricity demand resulting in
reduced renewable targets, exacerbated by a
weak longer-term regulatory environment.
We cut our five year demand CAGR estimate
to 0% from 7% previously.
Order flow: order flow is picking up but
continues to point towards a weak year in
2010. We cut our 2010 demand growth
forecast to -3.0% from -1.3% previously.
Partially offset by: continued strong growth
in the Chinese markets driven by high
demand for electricity and a willingness on
the part of the Chinese government to be
considered more green, and also pockets of
growth from new emerging markets in areas
such as South America, Eastern Europe,
Canada and Turkey.
In this report, we have undertaken a detailed
analysis of the regulatory environment in the US
and Europe (see “US regulatory analysis” and
“EU regulatory analysis” chapter). We have
performed a top down review of these markets
and derived long-term forecasts out to 2020 based
on renewable targets in each region. We find that
both regions are currently set to exceed their
respective targets (draft target in the US) and thus
we cut our wind forecasts in each region.
China will be the most significant driver of global
growth, in our view. We forecast that it will
Global wind market analysis
We cut our five-year industry demand CAGR forecast to 7.0%
globally from 7.5%
We cut our new installations forecast for the US market by 27%
(15.6GW) over the next five years due reduced electricity demand
and a weak regulatory environment
We cut our forecasts for Europe by 6% (3.9GW) over the next five
years due to reduced electricity demand resulting in reduced
renewable targets

18
Clean Energy Global Wind Power - Equity August 2010
abc
account for 38% of the global market over the
next five years (2010e-14e) and will grow at 8%
pa. The current NDRC target for wind is 150GW
by 2020, but the goal post keeps moving (the
target has been upgraded three times in the last
five years). We forecast cumulative capacity of
241GW by 2020.
We cut our 2010 new installation forecasts to
36.3GW
Following a detailed review of order book data for
the wind turbines manufacturers (see “wind
OEMs – order books” chapter), we cut our global
new installations forecasts for 2010 to 36.3GW,
implying a negative growth rate of 3% (versus
negative1.4% previously), although off of a
record base year in 2009 of 37.5GW. In fact,
excluding China we are now forecasting negative
growth of 13% in 2010, driven by negative
growth of 29% in the US and 14% in Europe.
No growth expected in the US – even with new legislation
We have undertaken a detailed analysis of the
existing state level Renewable Portfolio Standards
(RPSs) available in the US and a potential federal
Renewable Electricity Standards (RESs) (see
chapter on “US regulatory analysis”). Under the
current proposed federal RES, we forecast
average new wind installations of 10GW pa over
the eleven year period to 2020. This is c33%
lower than the 15GW pa (average) we were
previously forecasting over the same period.
US market – new versus old forecasts (MW)
0
2,000
4,000
6,0008,000
10,000
12,00014,000
16,000
2009 2010e 2011e 2012e 2013e 2014eUS - new US - old
Source: MAKE Consulting (for historic data), HSBC estimates
Under these circumstances, we reduce our five
year demand CAGR estimate for the US market to
0% from 7% previously. In terms of new
installations over the five year period 2010-14, we
cut our forecast by 27% from 57.6GW to
42.0GW. This gives the US market a 20% share
of global installations.
The state level RPSs alone are notably worse,
with average demand of just 6GW pa over the
eleven year period to 2020.
Europe – we cut our forecasts in Southern Europe and Germany
We have undertaken a detailed review of EU
20:20:20 targets for seven key EU markets and
their implication for renewable electricity and
wind markets. These seven markets accounted for
more than 80% of wind turbine demand in Europe
in 2009. Based on our analysis, we find that all
Global wind demand forecasts – summary of changes
2010e 2011e 2012e 2013e 2014e Total 2010e-14e
Old forecast 36,963 41,896 45,920 50,094 53,810 228,683 New forecast 36,325 40,275 45950 49,275 52,450 225,275 Difference -638 -621 30 -819 -1,360 -3,408 % increase/(decrease) -1.7% -1.5% 0.1% -1.6% -2.5% -1.5% Explained by: Decrease in US -1,693 -2,496 -2,995 -3,969 -4,460 -15,613 Decrease in Europe -895 -550 -400 -800 -1,275 -3,920 Increase in China 1,000 1,000 1,500 2,000 2,500 8,000 Increase in RoW 950 1,425 1,925 1,950 1,875 8,125 Total -638 -621 30 -819 -1,360 -3,408
Source: HSBC estimates
19
Clean Energy Global Wind Power - Equity August 2010
abc
Southern European markets and Germany are set
to exceed their renewable electricity targets for
2020; we thus cut our wind forecasts for these
countries. We find that France is the only country
likely to miss its target and therefore increase our
wind forecast for France. We keep the UK more
or less the same.
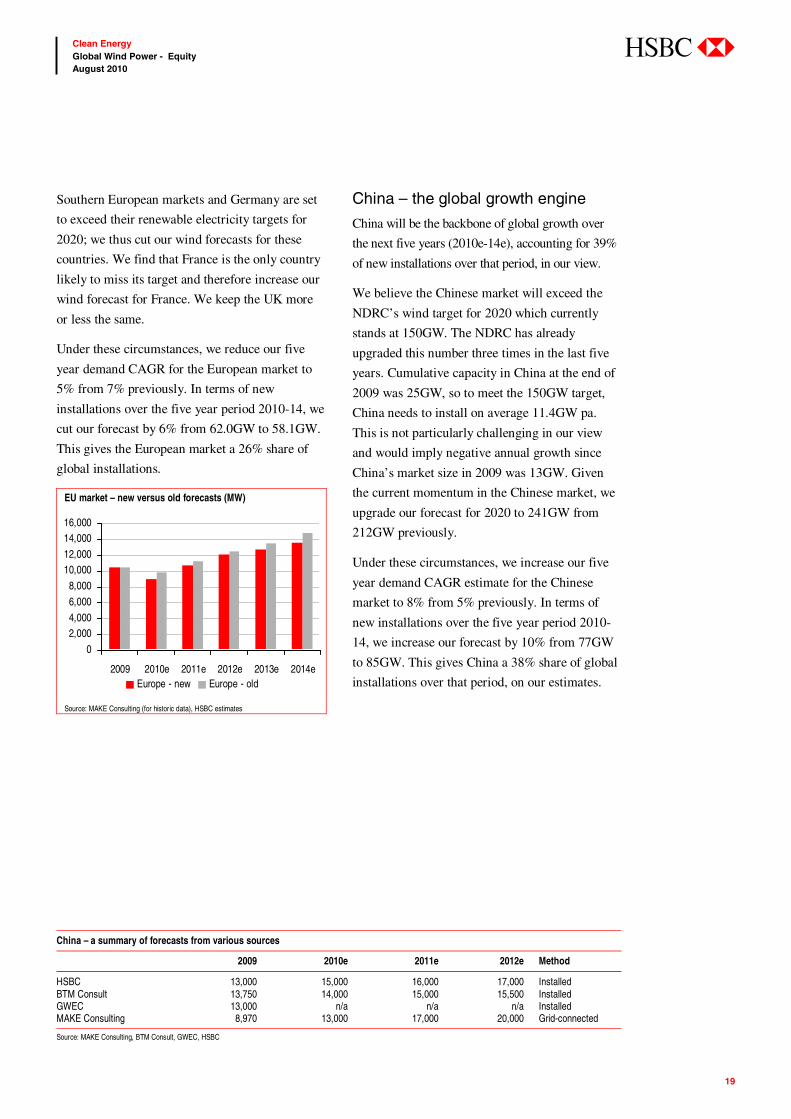
Under these circumstances, we reduce our five
year demand CAGR for the European market to
5% from 7% previously. In terms of new
installations over the five year period 2010-14, we
cut our forecast by 6% from 62.0GW to 58.1GW.
This gives the European market a 26% share of
global installations.
EU market – new versus old forecasts (MW)
0
2,0004,000
6,000
8,000
10,00012,000
14,00016,000
2009 2010e 2011e 2012e 2013e 2014eEurope - new Europe - old
Source: MAKE Consulting (for historic data), HSBC estimates
China – the global growth engine
China will be the backbone of global growth over
the next five years (2010e-14e), accounting for 39%
of new installations over that period, in our view.
We believe the Chinese market will exceed the
NDRC’s wind target for 2020 which currently
stands at 150GW. The NDRC has already
upgraded this number three times in the last five
years. Cumulative capacity in China at the end of
2009 was 25GW, so to meet the 150GW target,
China needs to install on average 11.4GW pa.
This is not particularly challenging in our view
and would imply negative annual growth since
China’s market size in 2009 was 13GW. Given
the current momentum in the Chinese market, we
upgrade our forecast for 2020 to 241GW from
212GW previously.
Under these circumstances, we increase our five
year demand CAGR estimate for the Chinese
market to 8% from 5% previously. In terms of
new installations over the five year period 2010-
14, we increase our forecast by 10% from 77GW
to 85GW. This gives China a 38% share of global
installations over that period, on our estimates.
China – a summary of forecasts from various sources
2009 2010e 2011e 2012e Method
HSBC 13,000 15,000 16,000 17,000 Installed BTM Consult 13,750 14,000 15,000 15,500 Installed GWEC 13,000 n/a n/a n/a Installed MAKE Consulting 8,970 13,000 17,000 20,000 Grid-connected
Source: MAKE Consulting, BTM Consult, GWEC, HSBC

20
Clean Energy Global Wind Power - Equity August 2010
abc
Chinese market – new versus old forecasts (MW)
02,0004,0006,0008,000
10,00012,00014,00016,00018,00020,000
2009 2010e 2011e 2012e 2013e 2014eChina - new China - old
Source: MAKE Consulting (for historic data), HSBC estimates
Grid-connection is one of the biggest challenges
One of the biggest challenges in China at the
moment is connecting installed turbines to the
grid; this issue is particularly pronounced in Inner
Mongolia. This has caused a large mismatch
between installed and grid-connected turbines;
depending on whose numbers one looks at, up to a
third of installed turbines in China are not grid-
connected (ie running idle). MAKE Consulting
bases its Chinese market forecasts on grid-
connected turbines, whereas BTM Consult,
GWEC (the Global Wind Energy Council) base
their forecasts on installed turbines. We fall in the
latter camp.
We believe turbines installed (rather than grid-
connected) best represents the market for wind
turbines (ie a turbine sales contract is typically
complete when the turbines are installed, not
necessarily grid-connected), although tallying
turbines installed is more subjective.
We believe that ensuring existing installed
capacity becomes grid-connected will become
more of a focus for wind farm developers in the
coming years, which is one of the reasons for
growth in the Chinese market slowing to a five
year CAGR of 8%, on our forecasts (based on
installed, not grid-connected capacity) compared
to triple digit growth over the last five years. We
note that grid-connected capacity will grow at a
five-year CAGR of 20%, on our forecasts, due to
the closing of the gap between installed and grid-
connected capacity. The other reason being the
fact China is now the world’s largest wind turbine
market thus the base year of 2009 is at a record
high (for any wind market, ever) of 13GW.
Note that our Chinese market assumptions herein
assume considerable investment in grid
infrastructure to enable nearly all wind farms to
become grid-connected by 2014e. This is
particularly an issue in Inner Mongolia.
China – installed versus grid-connected capacity over the period 2010e-14e
2009 2010e 2011e 2012e 2013e 2014e 2015e 5-year CAGR (2009-14e)
Grid-connected capacity
Cumulative 19,223 32,424 47,695 65,158 84,935 107,146 126,412 41% Annual (or new) 8,970 13,201 15,271 17,463 19,776 22,211 19,266 20% % increase/(decrease) 92% 47% 16% 14% 13% 12% -13%
Installed capacity
Cumulative 24,893 39,893 55,893 72,893 90,893 109,893 129,653 35% Annual (or new) 13,000 15,000 16,000 17,000 18,000 19,000 19,760 8% % increase/(decrease) 106% 15% 7% 6% 6% 6% 4%
Grid-connected as % installed capacity
Cumulative 77% 81% 85% 89% 93% 98% 98% Annual (or new) 69% 88% 95% 103% 110% 117% 98%
Source: MAKE Consulting (for historic data), HSBC estimates

21
Clean Energy Global Wind Power - Equity August 2010
abc
Market analysis: where’s the growth coming from? We have ranked 22 wind markets, worldwide,
based on our forecast new installations over the
next five years (2010e-14e) and also forecast
“other Americas”, “other Europe”, “other
Asia/Pacific and RoW. From this pool of markets,
we form three groups:
Growth markets (out of top 10 markets)
Ex-growth markets (out of top 10 markets)
High growth markets (remaining markets).
Top 10 markets: five growth and five ex-growth
We forecast that the top 10 markets will account
for 85% of all new installations over the period.
We identify two distinct groupings within the top
10 markets, five markets with zero or negative
growth over the next five years and five markets,
which are all growing faster than the global
average of 7.0% pa over the same period:
Growing faster than the global market:
India (five year CAGR estimate of 12%), the
UK (five year CAGR estimate of 13%) and
Canada (five year CAGR estimate of 19%),
France (five year CAGR estimate of 11%)
and China (five year CAGR estimate of 8%)
Negative or zero growth: US (five-year
CAGR estimate of 0%), Germany (five year
CAGR estimate of 1%), Spain (five year
CAGR estimate of minus 8%), Italy (five year
CAGR estimate of 0%) and Portugal (five
year CAGR estimate of minus 6%)
Remaining markets: high growth
The remaining 12 markets plus “other Americas”,
“other Europe” and “other Asia/Pacific” and
RoW, we forecast will in aggregate account for
just 19% of new installations over the period
2010e-20e. However, we believe these smaller
markets will provide the strongest growth
opportunity, mainly due to a low base effect due
to their relative immaturity. We forecast a five
year CAGR for these markets combined of 21%.
Top 10 wind markets by forecast installations over 2010-14 in MW (LHS) and forecast five year demand CAGR for each market (RHS)
0
10,000
20,000
30,000
40,000
50,000
60,000
70,000
80,000
90,000
China US Canada Germany India Spain UK France Italy Portugal
-10%
-5%
0%
5%
10%
15%
20%
5 -year global CAGR of 7.0%
Source: HSBC estimates

22
Clean Energy Global Wind Power - Equity August 2010
abc
Implications for the wind turbine manufacturers We have analysed the exposure of the top 10 wind
turbine manufacturers plus Nordex and Clipper to
the three grouping defined above, namely “high
growth”, “growth” and “ex-growth”.
The Chinese manufactures, Sinovel, Goldwind
and Dongfang, currently have the best growth
prospects in our view, on the back of domestic
Chinese market growth. Furthermore they are all
looking to internationalise, particularly into the
US; any new market penetration should add to
their growth profile.
Clipper, GE and Gamesa are the least exposed to
growth markets with 0%, 13% and 25% sales
exposure to growth markets in 2009 respectively.
In the case of Clipper and GE this is due to their
very high exposure to the US market (100% and
85% of sales respectively), and in the case of
Gamesa is due to its high exposure to Spain and
the US (two-thirds of sales). We note that in the
coming years Clipper is looking to expand outside
of the US into growth markets such as Latin
America and Canada.
The remaining manufacturers, including Vestas,
Suzlon, REpower and Nordex, all have exposure
to growth markets in the range of 40-60% of
sales. These are the best positioned of the non-
Chinese players.
Implications for the wind farm developers Exposure to high growth markets not essential…
It is not a prerequisite that the wind farm
developers are exposed to the highest growth
markets. Based on our forecasts, the wind farm
developers will barely grow their annual
installations over the next five years, with the
exception of Iberdrola Renovables, which we
forecast will growth annual installations at 7% pa
over 2010e-14e). Iberdrola Renovables’ higher
growth is due to a suppressed base in 2009 (just
1.4GW versus the 2GW pa targeted by the
company previously). In fact, we forecast that all
wind farm developers except Iberdrola
Renovables will deliver a lower number of
installations in 2010 than in 2009.
Top 10 wind turbine manufacturers plus Nordex and Clipper – sales exposure to growth, ex-growth and high growth (RoW) markets in MW (LHS) and % sales exposure to growth/high growth markets (RHS) in 2009
42%
13%
100%
42%
100%
50%
25%
55%
100%
48%55%
0%0
1,000
2,000
3,000
4,000
5,000
6,000
Vestas GE Wind Sinovel Enercon Goldw ind Siemens Gamesa Suzlon Dongfang REpow er Nordex Clipper
0%
20%
40%
60%
80%
100%
120%
Growth High growth Ex -grow th % exposure to grow th markets
Source: MAKE Consulting, HSBC estimates

23
Clean Energy Global Wind Power - Equity August 2010
abc
Wind farm developers – HSBC new installations forecasts over the period 2009-2014e
0
500
1,000
1,500
2,000
2009a 2010e 2011e 2012e 2013e 2014e
ANA IBR EDPR EDF EN
Source: HSBC estimates
…quality of pipeline much more important
What is more important for the wind farm
developers is the quality of their pipeline, in terms
of project viability, return, and geographical
spread, and also their access to finance. The focus
at the moment is on which developers are exposed
to markets with high regulatory risk such as
Spain, Italy and the US.
From April, investors have been discounting heavily
developers exposed to Spain due to uncertainty over
the tariff system, including the possibility of a
retroactive cut to tariffs. In early July some visibility
was given on the tariff cuts to wind in the form of a
draft Royal Decree, which looks for temporary tariff
(premium) cuts in 2011 and 2012; this is not
particularly unfavourable and importantly adds some
visibility to an unclear situation. Iberdrola
Renovables, EDPR and Acciona all have operating
asset and pipeline exposure to Spain.
2009: wind power a mainstream technology The wind industry had another record year in 2009
with new wind installations of 37.5GW worldwide.
In Europe, wind was the power generation source
of choice in terms of new installations for the
second year running, accounting for 39% (2008:
36%) of all new installations with gas in second
place accounting for 26% of new installations.
Similarly in the US, wind energy accounted for
39% of new installations in 2009, marginally
beaten by gas with 43%.
Who’s number 1, US or China?
According to the Global Wind Energy Council
(GWEC), in 2009, global wind turbine
installations reached 37.5GW, an increase of 38%
y-o-y (2008: 35%). GWEC’s analysis suggests
that China is the leading market with 13GW of
new installations globally accounting for 35% of
new installations globally (13GW). The global
market for wind turbine installations in 2009 was
worth about EUR45bn (~USD60bn) (source:
GWEC). Cumulative total installations globally
reached 157.9GW.
New power capacity installations in the EU in 2009 (Total 26GW) – by technology
New power capacity installations in the US in 2009 (Total c26GW) – by technology
Wind39%
Solar17%
Coal9%
Otherrenewables
5%
Other2%
Nuclear2%
Gas26%
Wind39%
Solar17%
Coal9%
Otherrenewables
5%
Other2%
Nuclear2%
Gas26%
Wind39%
Gas43%
Other5%
Coal13%
Wind39%
Gas43%
Other5%
Coal13%
Source: EWEA, HSBC Source: AWEA, SEIA, SNL, Lawrence Berkeley Laboratory, HSBC

24
Clean Energy Global Wind Power - Equity August 2010
abc
However, according to MAKE consulting, a
leading wind industry consultant, global wind
turbine installations reached c33GW in 2009, up
27% y-o-y. The main growth drivers were China
(up 92% y-o-y) and US (up 16% y-o-y), which
installed c9GW and 10GW of grid-connected
wind turbines in 2009 respectively.
The difference between MAKE and GWEC
numbers can be explained by the difference in
their methodology. MAKE calculates installation
numbers based on completed projects i.e.
mechanically installed and fully commissioned
wind turbines, grid available and connected, either
operating or fully ready to operate, whereas, we
believe GWEC numbers are based on installed
capacity, irrespective of its grid connection status.
The MAKE number thus understates the size of
the wind turbine market, in our view, since we
believe installed capacity is more relevant when
talking about the market for size for wind turbine
manufacturers as a completed wind farm (albeit
not grid connected) represents a completed
contract for a wind turbine manufacturer.
US: a positive surprise
In the US, new installations increased by 19% y-
o-y to c10GW (2008: 8.4GW), bringing the total
installed capacity to 35GW. At the beginning of
2009, it was widely expected that the US market
will be weak due to a lack of adequate project
financing (in particular tax equity in order to fully
utilise the Production Tax Credit (PTC), the
federal level incentive). However, the swift
implementation of ARRA incentives and the
disbursal of treasury grants in the second half of
2009 had a positive impact on the new
installations with c4GW of new installations
achieved in the fourth quarter.
China: stronger than expected
In China, new installations reached 13GW, more
than double their level in 2008 (6.3GW). This
brings total installed capacity to 25GW at the end
of 2009 (2008: 12GW). Wind energy
development was largely unaffected by the lack of
financing which negatively impacted the rest of
the world. It also overtook US as the world’s
largest market for wind turbines in 2009 (on an
installed, not grid-connected, basis).
EU: robust growth
In the EU, new installations increased by 18% y-
o-y to c10.5GW (2008: 8.9GW), driven by robust
new installations in the UK, France and Italy, and
better than expected new installations in the more
mature markets of Spain and Germany. This
brings the total installed capacity in the EU to
76.5GW and makes the EU by far the largest
region from a total installed base perspective, with
48% of the global total installed base.
Electricity generation goes green in the EU
In the EU, wind energy was the no.1 electricity-
generating technology, in terms of new
installations, for the second year in running, with
39% of new installations in 2009 (2008: 36%). In
fact, 61% of new installations during 2009 were
from renewable sources (2008: more than 50%).
Gas was the next most popular electricity
generation source, with 26% of new installations.

25
Clean Energy Global Wind Power - Equity August 2010
abc
Current US regulation is weak The US wind industry recorded a record year of
10 GW in 2009 but was knocked off its top spot
as the world’s largest market (having been no.1
since 2005 – with c25% of the global wind turbine
market over the period 2005-09) for the first time
by China (13GW). The good news stops there.
Compared to this level of new installations, the
current potential regulatory scenarios in the US do
not bode well for wind turbine demand growth
over the next decade or so. We calculate that the
state RPSs alone would support just a 5.7GW pa
(average) wind market until 2020.
A potential federal LCES (assuming 13%
renewable electricity by 2020) would support a
wind market over the same period of nearly 10GW
pa, we calculate. This is the best possibility, in our
view, and implies only flat demand growth over the
period to 2020. We note that there is considerable
uncertainty over the final form of a potential
federal LCES, and there are a number of draft
pieces of legislation before Congress with quite
different proposals. The House of Representatives
have passed a bill (the Waxman-Markey bill) with
federal RES provisions but this still needs to be
reconciled with any such provisions coming out of
the Senate. Our federal LCES scenario adopts the
Lugar version of the federal LCES (see
assumptions below for detail). The Lugar bill is one
of many versions of the legislation in the Senate
right now. The Lugar bill gives ‘clean’ energy
targets which include CCS (Carbon Capture and
Storage) and nuclear installations, rather than just
renewable energy targets (as per the House of
Representatives’ version of the bill), which we
believe are necessary to appease the coal and
nuclear lobby and therefore eventually see the bill
passed in the Senate; it is a good general
representation of most Senate versions of the bill.
The worst case scenario is unlikely to materialise
In what we consider the worst case regulatory
scenario, which would entail no federal LCES,
and a US market based only on those states with
penalty schemes to support their state level RPS
targets, we calculate wind demand in the US of
just 3.8GW pa (average) up to 2020. We believe
this scenario is unlikely, but nevertheless would
be very negative for the Wind OEMs.
US regulatory analysis
We calculate that the state RPSs alone would support only a 5GW
pa (on average) wind market until 2020
We calculate that a federal LCES (assuming 13% renewable
electricity) could support a 10GW pa wind market until 2020
Based on a federal LCES (assuming 13% renewable electricity by
2020), we cut our new installations forecast for the US market by
27% over the next five years (combined)

26
Clean Energy Global Wind Power - Equity August 2010
abc
Implications for the wind turbine manufacturers Flat demand in the US up to 2020 (and that is the
best case of our three regulatory scenarios) will
have a negative impact for most wind turbine
manufacturers in, perhaps, the most competitive
market globally. In our view, GE, Mitsubishi and
Clipper will suffer more than most players since
these companies all have more than 85% sales
exposure to the US market. Vestas, Gamesa and
Suzlon all have around 25% of their sales exposed
to the US.
The US – the most exposed wind turbine manufacturers
__ Sales exposure (MW) _ __ Market share (MW) _ Average
2007-092009 Average
2007-09 2009
GE 84% 85% 45% 40% Siemens 53% 47% 12% 12% Clipper 100% 92% 3% 6% Mitsubishi 93% 100% 7% 8% Vestas 25% 27% 16% 15% Gamesa 24% 26% 9% 6% Suzlon 23% 32% 5% 7%
Source: MAKE Consulting, HSBC estimates
REpower and Nordex both have under 15% sales
exposure to the US market.
Competition fierce – Asian players trying to penetrate
In our view, the US market is already the most
competitive market globally (China is the second
most competitive). Many European turbine
manufacturers have already set up manufacturing
US regulation - summary of current regulatory scenarios and implications for the wind market
Federal RES (potential) State RPS (all states with an RPS) (ii)
State RPS (penalty scheme only)
No of states 50 37 16
Renewable electricity as % total electricity in 2020 (un-diluted) 20.0% 11.3% 5.7% Dilution to base due to exemptions for large hydro and MSW (ii) 1.5% 15% 10% Clean electricity as % total electricity in 2020 (diluted) 18.5% 9.7% 5.4% Energy efficiency saving (smart grid etc) 3.7% Clean electricity as % total electricity in 2020 (diluted) 14.8% 9.7% 5.4% Dilution due non-renewable but ‘clean’ energy sources 1.9% Renewable electricity as % total electricity in 2020 (diluted) 12.9% 9.7% 5.4% Wind as % renewable electricity 65% 54% 57% Wind as % total electricity in 2020 8.4% 5.4% 3.1% 2020e wind produced electricity (TWh) (i) 370 232 136 2020e wind capacity (GW) (i) 141 88 52 2009 wind capacity (GW) (i) 35 25 10 New wind installations 2010-2020 (GW)* 106 63 42 Average wind installations pa (GW) 9.6 5.7 3.8 2020e cumulative installations (all states) 141 98 87
Note: (i) Summed over states in question only; (ii) Includes states with an informal target as well as a formal RPS; (iii) dilution is due to an exemption for small power producers for RPS schemes Source: DoE website, IEA, EIA, HSBC estimates
27
Clean Energy Global Wind Power - Equity August 2010
abc
facilities in the US. Despite the flat demand
growth we forecast for the US market, we believe
key Chinese players, such as Goldwind, Sinovel,
A1 Power, and Ming Yang, will continue to
penetrate the US market. We have already seen an
Indian manufacturer, Suzlon, enjoy some success
in penetrating the US market over the last couple
of years, with 704MW of US sales in 2010e (c7%
market share).
In addition, we expect a further wave of penetration
from Korean manufacturers such as Samsung,
Hyundai and Daewoo. Furthermore, these are all
already trusted brands in the Western world and
therefore could cause more of a threat to Western
turbine manufacturers than the Chinese
manufacturers, which are less well known.
The emergence of Asian players trying to
penetrate the US market is likely to put
downwards pressure on pricing as they under cut
on price in order to win market share.
Investment in US manufacturing capacity
Many European wind turbine manufacturers,
including Vestas, Gamesa, and Nordex, and also
Suzlon, have invested in the US in recent years as
improved regulatory visibility (ie a more stable
Production Tax Credit (“PTC”)) allowed them to
commit capital to the region. However, Gamesa
and Suzlon have had to make redundancies at
their US plants, which are currently significantly
under-utilised. Vestas has made no redundancies
at its US plants.
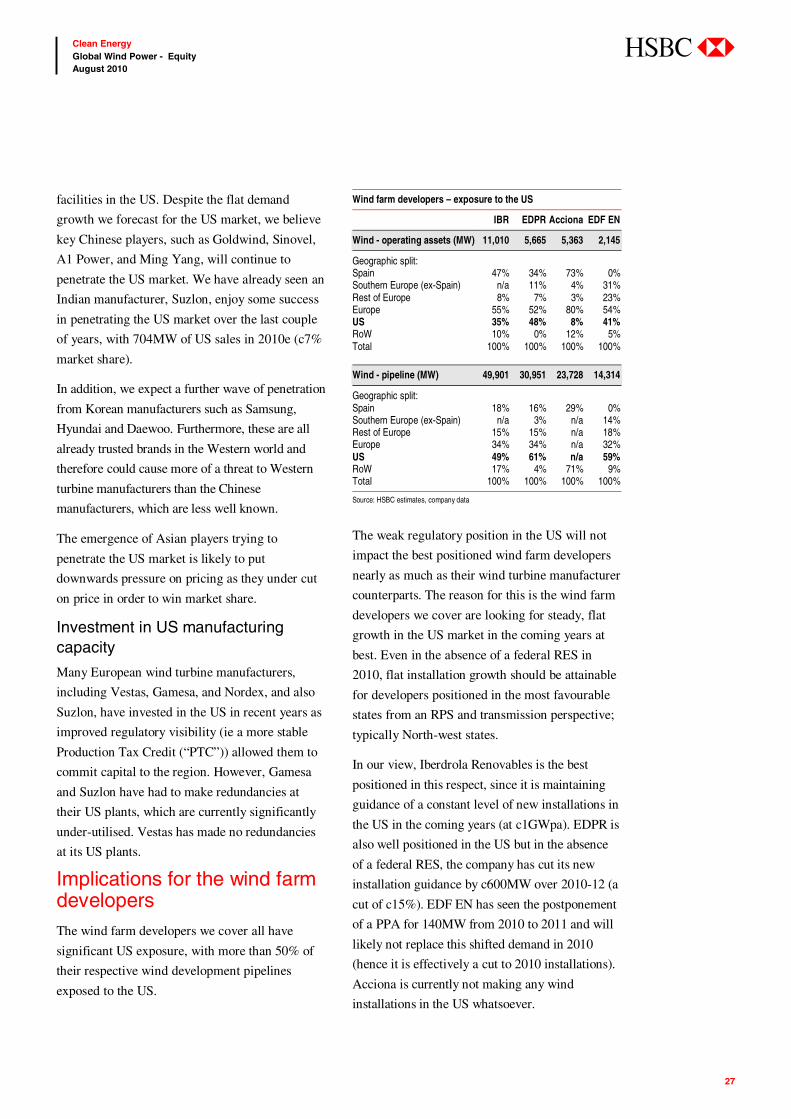
Implications for the wind farm developers The wind farm developers we cover all have
significant US exposure, with more than 50% of
their respective wind development pipelines
exposed to the US.
Wind farm developers – exposure to the US
IBR EDPR Acciona EDF EN
Wind - operating assets (MW) 11,010 5,665 5,363 2,145
Geographic split: Spain 47% 34% 73% 0% Southern Europe (ex-Spain) n/a 11% 4% 31% Rest of Europe 8% 7% 3% 23% Europe 55% 52% 80% 54% US 35% 48% 8% 41% RoW 10% 0% 12% 5% Total 100% 100% 100% 100%
Wind - pipeline (MW) 49,901 30,951 23,728 14,314
Geographic split: Spain 18% 16% 29% 0% Southern Europe (ex-Spain) n/a 3% n/a 14% Rest of Europe 15% 15% n/a 18% Europe 34% 34% n/a 32% US 49% 61% n/a 59% RoW 17% 4% 71% 9% Total 100% 100% 100% 100%
Source: HSBC estimates, company data
The weak regulatory position in the US will not
impact the best positioned wind farm developers
nearly as much as their wind turbine manufacturer
counterparts. The reason for this is the wind farm
developers we cover are looking for steady, flat
growth in the US market in the coming years at
best. Even in the absence of a federal RES in
2010, flat installation growth should be attainable
for developers positioned in the most favourable
states from an RPS and transmission perspective;
typically North-west states.
In our view, Iberdrola Renovables is the best
positioned in this respect, since it is maintaining
guidance of a constant level of new installations in
the US in the coming years (at c1GWpa). EDPR is
also well positioned in the US but in the absence
of a federal RES, the company has cut its new
installation guidance by c600MW over 2010-12 (a
cut of c15%). EDF EN has seen the postponement
of a PPA for 140MW from 2010 to 2011 and will
likely not replace this shifted demand in 2010
(hence it is effectively a cut to 2010 installations).
Acciona is currently not making any wind
installations in the US whatsoever.

28
Clean Energy Global Wind Power - Equity August 2010
abc
Modelling assumptions State RPS scenario
In the US, there are 31 states with a formal
Renewable Portfolio Standard (“RPS”) and a
further 6 states with an informal target. Of these
states, only 16 have a formal penalty system to
deal with non-compliance. The level of renewable
electricity targeted under each RPS varies by
state, typically ranging from 15% of total
electricity generated to 25% (although there are
some RPSs outside of this range), as does the
timeframe for compliance, which typically ranges
from 2015-2025. However, in order to perform a
consistent analysis, we have derived effective
RPS targets for each state as at 2020. For states
with an RPS target with a timeframe longer than
2020, we have used linear interpolation between
the level of renewable in that state and the RPS
target, and for states with a timeframe shorter than
2020, we have simply adopted the target at the
earlier date and assumed that this level is
maintained. The table below sets out the states
which have an RPS, the RPS target, timeframe,
and some other assumptions we have adopted.
Summary of assumptions and outputs for US states with an RPS
____________2020 RES-E target ____________ State REN
target (%) Achieved by end of
Penalty system
2020 target (adjusted)
Exemption USED
2020 target (adjusted)
2009 % RES-E
*Electricity demand in 2020
All states
Penalty only
After dilution (all states)
After dilution (penalty only)
Arizona 15% 2025 N 10% 41% 6% 0% 136 14 8California 33% 2020 Y 33% 2% 32% 12% 233 77 77 76 81Colorado 30% 2020 N 30% 6% 28% 6% 65 19 18Connecticut 23% 2020 Y 23% 0% 23% 2% 32 7 7 7 8Delaware 20% 2019 Y 20% 25% 15% 3% 8 2 2 1 1Hawaii 25% 2020 N 25% 0% 25% 6% 0 0 0Illinois 25% 2025 Y 18% 44% 10% 2% 167 30 30 17 18Iowa 105 2020 N 105 25% 15% 42 0 0Kansas 20% 2020 N 20% 12% 18% 5% 95 19 17Maine 40% 2017 Y 40% 7% 37% 23% 16 6 6 6 6Maryland 20% 2022 Y 17% 2% 17% 1% 45 8 8 8 8Massachusetts 15% 2020 Y 15% 14% 13% 3% 46 7 7 6 6Michigan 10% 2015 N 10% 12% 9% 3% 129 13 11Minnesota 25% 2025 N 21% 0% 21% 12% 76 16 16Missouri 15% 2021 Y 14% 12% 12% 1% 76 11 11 9 10Montana 15% 2015 Y 15% 37% 9% 4% 24 4 4 2 2Nebraska 10% 2020 N 10% 10% 1% 45 5 5Nevada 20% 2025 N 15% 12% 13% 5% 27 4 4New Hampshire 24% 2025 Y 18% 0% 18% 6% 23 4 4 4 4New Jersey 23% 2021 Y 21% 3% 20% 2% 56 12 12 11 12New Mexico 20% 2020 N 20% 12% 18% 4% 43 9 8New York 30% 2013 N 27% 27% 22% 3% 158 47 35North Carolina 13% 2021 N 12% 0% 12% 2% 135 16 16North Dakota 10% 2015 N 10% 12% 9% 8% 43 4 4Ohio 13% 2025 Y 9% 12% 8% 1% 167 15 15 13 14Oklahoma 15% 2015 N 15% 15% 3% 139 21 21Oregon 25% 2025 Y 20% 0% 20% 7% 46 9 9 9 10Pennsylvania 18% 2021 Y 17% 3% 16% 1% 202 34 34 33 35Rhode Island 16% 2020 Y 16% 1% 16% 2% 7 1 1 1 1South Dakota 10% 2015 N 10% 12% 9% 5% 9 1 1Texas 5,580 N 5,580 25% 5% 319 15 0Utah 20% 2025 N 14% 12% 12% 1% 38 5 5Vermont 25% 2017 N 25% 12% 22% 5% 6 1 1Virgina 12% 2025 N 9% 12% 8% 4% 81 8 7Washington 15% 2020 Y 15% 17% 12% 5% 89 13 13 11 12Wisconsin 10% 2015 N 10% 0% 10% 4% 53 5 5West Virgina 25% 2025 N 18% 12% 15% 1% 101 18 16Rest of US 1,531 0 0 0 0Total 4,508 479 239 410 229% total US 11.3 5.7 9.7 5.4
Note: * the long-term electricity demand growth rate implicitly assumes a 6.7% energy efficiency saving by 2020 Source: US Department of Energy, HSBC estimates

29
Clean Energy Global Wind Power - Equity August 2010
abc
Federal LCES
We have based our federal LCES analysis on the
Lugar bill. This requires that utilities generate
20% of their electricity from ‘clean energy’
sources by 2020. We calculate that this target
translates to a ‘pure’ renewable energy target of
13% due to dilution from a number of factors:
1) Large hydro and Municipal solid waste
(MSW) excluded from “base”
The bill states that utilities must exclude
electricity generated from large hydro and MSW
when determining their total electricity generated
(used to calculate the percentage of electricity
generated from renewable sources). This adds a
combined dilution factor of c1.5 percentage points
to our calculation; thus, the ‘clean energy’ target
becomes 18.5%.
2) “Title I” energy efficiency savings of 4% (un-
diluted)
Utilities can offset up to 25% of the target using
energy efficiency savings from demand-side
management/smart grid implementation (“Title I”
energy efficiency savings in the nomenclature of the
bill), ie a maximum of 5 percentage points of the
20%. We have assumed that on average utilities
make 4 percentage points worth of Title I energy
efficiency savings (gross), this converts to a net
figure of 3.7% (taking account of the dilution in 1)
above); thus, the target becomes 14.8%.
3) Dilution due to non-renewable, ‘clean
energy’ sources
The legislation allows carbon capture and
sequestration (CCS), new nuclear plants, new
large hydro plants, MSW and retirement of old
power plants to contribute towards the ‘clean
energy’ target. In our view, none of these factors
will contribute much during the period to 2020
(nuclear and CCS should in the following
decade), however, combined they do cause a
further material reduction to the target. We
estimate this reduction at c2 percentage points
(combined). We note that we have been fairly
conservative on CCS; we assume just nine power
plants use the technology by 2020 contributing
0.4 percentage points of dilution. Under the
Environment Protection Agencies (EPAs) analysis
of the CCS potential up to three times more
dilution (ie total of 1.6 percentage points from
CCS alone) could occur under a more aggressive
CCS scenario.
The ‘pure’ renewable energy target for the US is
therefore 12.9% of total nationwide electricity
generation in 2020.
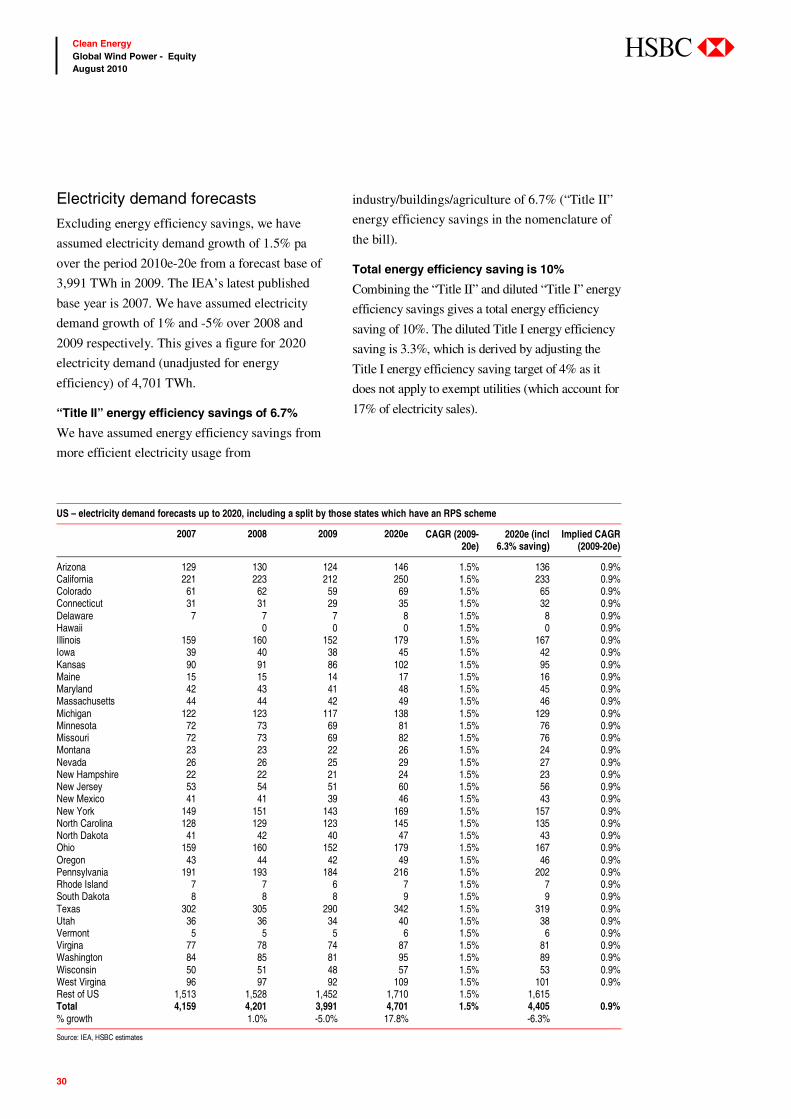
30
Clean Energy Global Wind Power - Equity August 2010
abc
Electricity demand forecasts
Excluding energy efficiency savings, we have
assumed electricity demand growth of 1.5% pa
over the period 2010e-20e from a forecast base of
3,991 TWh in 2009. The IEA’s latest published
base year is 2007. We have assumed electricity
demand growth of 1% and -5% over 2008 and
2009 respectively. This gives a figure for 2020
electricity demand (unadjusted for energy
efficiency) of 4,701 TWh.
“Title II” energy efficiency savings of 6.7%
We have assumed energy efficiency savings from
more efficient electricity usage from
industry/buildings/agriculture of 6.7% (“Title II”
energy efficiency savings in the nomenclature of
the bill).
Total energy efficiency saving is 10%
Combining the “Title II” and diluted “Title I” energy
efficiency savings gives a total energy efficiency
saving of 10%. The diluted Title I energy efficiency
saving is 3.3%, which is derived by adjusting the
Title I energy efficiency saving target of 4% as it
does not apply to exempt utilities (which account for
17% of electricity sales).
US – electricity demand forecasts up to 2020, including a split by those states which have an RPS scheme
2007 2008 2009 2020e CAGR (2009-20e)
2020e (incl 6.3% saving)
Implied CAGR (2009-20e)
Arizona 129 130 124 146 1.5% 136 0.9% California 221 223 212 250 1.5% 233 0.9% Colorado 61 62 59 69 1.5% 65 0.9% Connecticut 31 31 29 35 1.5% 32 0.9% Delaware 7 7 7 8 1.5% 8 0.9% Hawaii 0 0 0 1.5% 0 0.9% Illinois 159 160 152 179 1.5% 167 0.9% Iowa 39 40 38 45 1.5% 42 0.9% Kansas 90 91 86 102 1.5% 95 0.9% Maine 15 15 14 17 1.5% 16 0.9% Maryland 42 43 41 48 1.5% 45 0.9% Massachusetts 44 44 42 49 1.5% 46 0.9% Michigan 122 123 117 138 1.5% 129 0.9% Minnesota 72 73 69 81 1.5% 76 0.9% Missouri 72 73 69 82 1.5% 76 0.9% Montana 23 23 22 26 1.5% 24 0.9% Nevada 26 26 25 29 1.5% 27 0.9% New Hampshire 22 22 21 24 1.5% 23 0.9% New Jersey 53 54 51 60 1.5% 56 0.9% New Mexico 41 41 39 46 1.5% 43 0.9% New York 149 151 143 169 1.5% 157 0.9% North Carolina 128 129 123 145 1.5% 135 0.9% North Dakota 41 42 40 47 1.5% 43 0.9% Ohio 159 160 152 179 1.5% 167 0.9% Oregon 43 44 42 49 1.5% 46 0.9% Pennsylvania 191 193 184 216 1.5% 202 0.9% Rhode Island 7 7 6 7 1.5% 7 0.9% South Dakota 8 8 8 9 1.5% 9 0.9% Texas 302 305 290 342 1.5% 319 0.9% Utah 36 36 34 40 1.5% 38 0.9% Vermont 5 5 5 6 1.5% 6 0.9% Virgina 77 78 74 87 1.5% 81 0.9% Washington 84 85 81 95 1.5% 89 0.9% Wisconsin 50 51 48 57 1.5% 53 0.9% West Virgina 96 97 92 109 1.5% 101 0.9% Rest of US 1,513 1,528 1,452 1,710 1.5% 1,615 Total 4,159 4,201 3,991 4,701 1.5% 4,405 0.9% % growth 1.0% -5.0% 17.8% -6.3%
Source: IEA, HSBC estimates
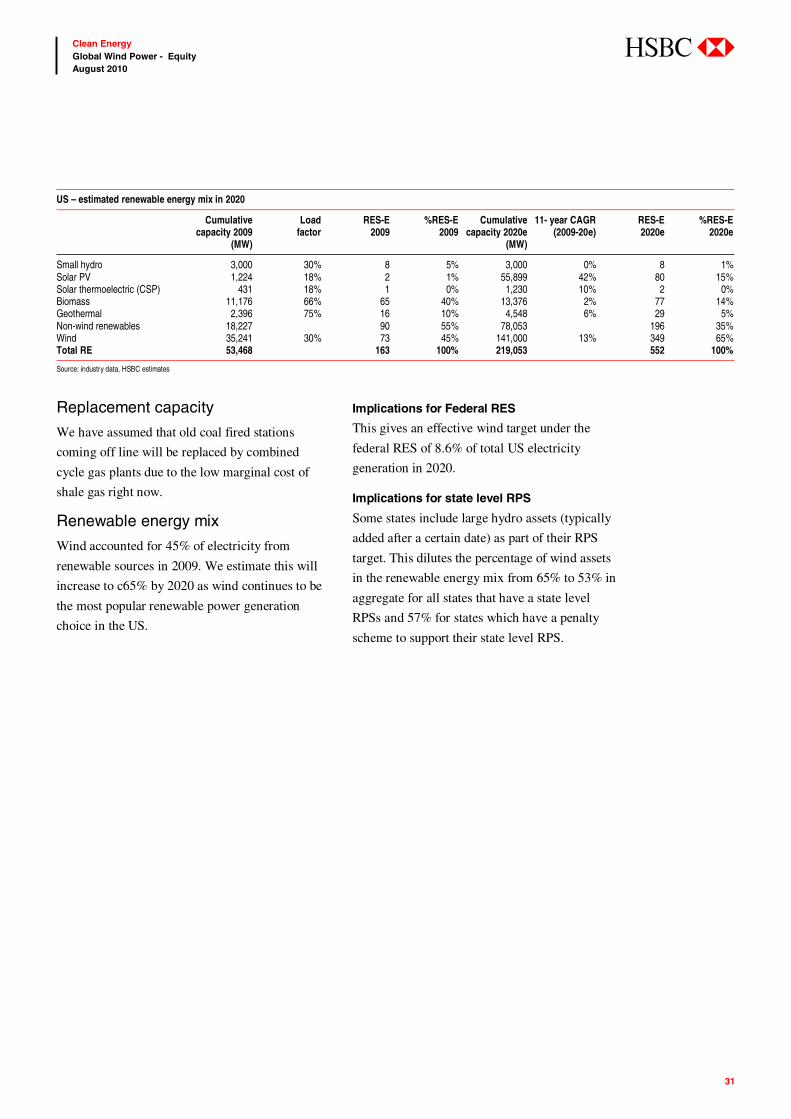
31
Clean Energy Global Wind Power - Equity August 2010
abc
Replacement capacity
We have assumed that old coal fired stations
coming off line will be replaced by combined
cycle gas plants due to the low marginal cost of
shale gas right now.
Renewable energy mix
Wind accounted for 45% of electricity from
renewable sources in 2009. We estimate this will
increase to c65% by 2020 as wind continues to be
the most popular renewable power generation
choice in the US.
Implications for Federal RES
This gives an effective wind target under the
federal RES of 8.6% of total US electricity
generation in 2020.
Implications for state level RPS
Some states include large hydro assets (typically
added after a certain date) as part of their RPS
target. This dilutes the percentage of wind assets
in the renewable energy mix from 65% to 53% in
aggregate for all states that have a state level
RPSs and 57% for states which have a penalty
scheme to support their state level RPS.
US – estimated renewable energy mix in 2020
Cumulative capacity 2009
(MW)
Load factor
RES-E 2009
%RES-E 2009
Cumulative capacity 2020e
(MW)
11- year CAGR (2009-20e)
RES-E 2020e
%RES-E 2020e
Small hydro 3,000 30% 8 5% 3,000 0% 8 1%Solar PV 1,224 18% 2 1% 55,899 42% 80 15%Solar thermoelectric (CSP) 431 18% 1 0% 1,230 10% 2 0%Biomass 11,176 66% 65 40% 13,376 2% 77 14%Geothermal 2,396 75% 16 10% 4,548 6% 29 5%Non-wind renewables 18,227 90 55% 78,053 196 35%Wind 35,241 30% 73 45% 141,000 13% 349 65%Total RE 53,468 163 100% 219,053 552 100%
Source: industry data, HSBC estimates
32
Clean Energy Global Wind Power - Equity August 2010
abc
We cut our wind forecasts to match %RES-E targets Each EU member was required to submit a National
Renewable Energy Action Plan (NREAP) to the
European Commission by 30 June. The NREAPs
should set out formal renewable electricity (RES-E)
targets, expressed as a percentage of total electricity
supply in 2020 (%RES-E) and include a split by
renewable energy source of how the target will be
achieved. Thus far nineteen countries have submitted
their NREAPs.
The recession has effectively lowered renewable targets for 2020
Due to reduced electricity demand in the EU
following a deep recession, the EU 2020
renewable electricity targets (RES-E targets) have
become easier to achieve, in our view.
We have performed detailed modelling on the
renewable energy mix out to 2020 in each of
seven key EU countries. There are two strands to
our analysis:
EU regulatory analysis
Due to reduced electricity demand in the EU following a deep
recession, the EU 2020 renewable electricity targets (RES-E
targets) have become easier to achieve, in our view
We find that all key Southern European countries and Germany
are set to exceed their EU 2020 RES-E (renewable electricity)
targets. France is the only major EU wind market likely to miss
We cut our 2020 cumulative forecasts for wind installations in the
EU to 230GW from 252GW previously; 5 year CAGR estimate
decreases to 5% from 7% previously
Summary of EU countries set to miss or exceed their EU 2020 renewable electricity (%RES-E) targets based on our renewable forecasts for 2020 (for wind, prior to publishing this report)
EU Member State Electricity consumption
2009 (TWh)
L/term annual electricity demand
growth*
Forecast electricity demand 2020 (TWh)
% RES-E target 2020
Implied RES-E target 2020 (TWh)
RES-E forecast 2020 based on old HSBC
forecasts (TWh)
% above/ (below)
target
Comment
France 486 1.28% 559 26% 145 135 -7% MissGermany 583 0.78% 635 30% 191 197 3% ExceedGreece 58 1.28% 67 29% 19 24 25% ExceedItaly 317 0.78% 345 34% 117 131 11% ExceedPortugal 51 1.03% 57 60% 34 46 34% ExceedSpain 267 2.02% 333 42% 140 151 8% ExceedUK 341 0.28% 352 30% 106 105 0% In lineRest of Europe 1,027 1.52% 1,212 36% 440 489 11% ExceedTotal EU 3,130 1.2% 3,560 1,192 1,277 7% Exceed
Note: * the long-term electricity demand growth rate implicitly assumes a 10% energy efficiency saving by 2020 Source: national policy documents, IEA, HSBC estimates
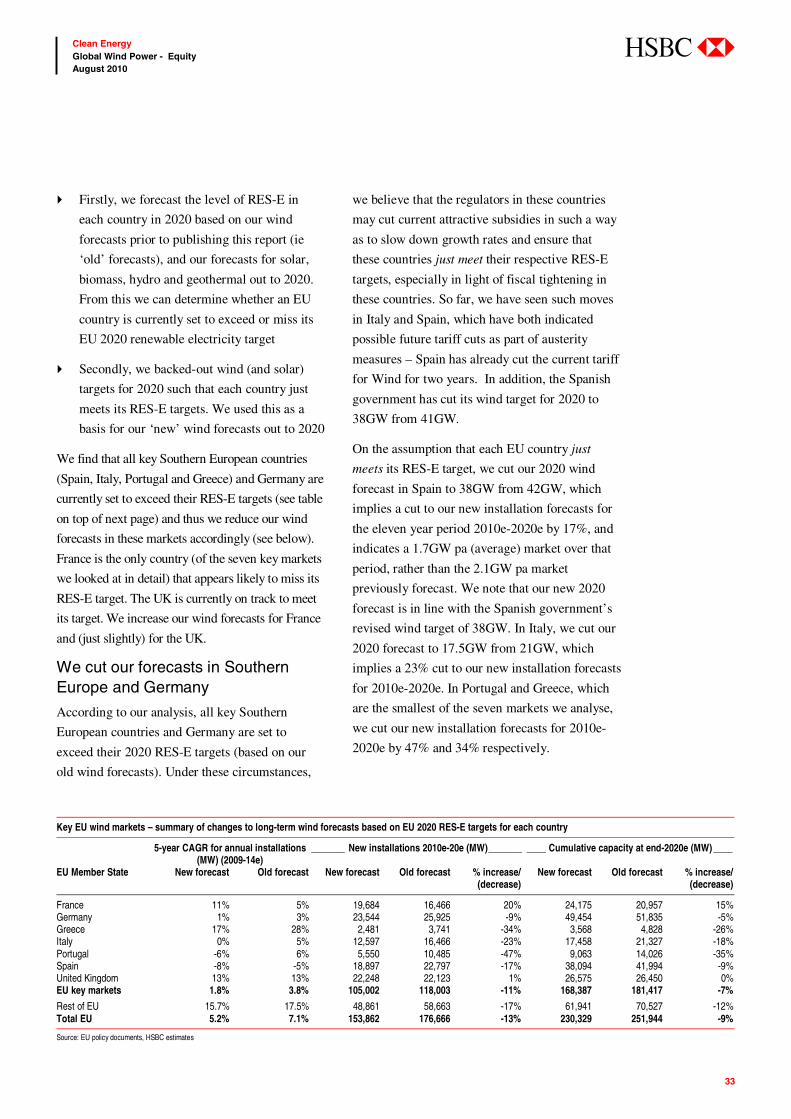
33
Clean Energy Global Wind Power - Equity August 2010
abc
Firstly, we forecast the level of RES-E in
each country in 2020 based on our wind
forecasts prior to publishing this report (ie
‘old’ forecasts), and our forecasts for solar,
biomass, hydro and geothermal out to 2020.
From this we can determine whether an EU
country is currently set to exceed or miss its
EU 2020 renewable electricity target
Secondly, we backed-out wind (and solar)
targets for 2020 such that each country just
meets its RES-E targets. We used this as a
basis for our ‘new’ wind forecasts out to 2020
We find that all key Southern European countries
(Spain, Italy, Portugal and Greece) and Germany are
currently set to exceed their RES-E targets (see table
on top of next page) and thus we reduce our wind
forecasts in these markets accordingly (see below).
France is the only country (of the seven key markets
we looked at in detail) that appears likely to miss its
RES-E target. The UK is currently on track to meet
its target. We increase our wind forecasts for France
and (just slightly) for the UK.
We cut our forecasts in Southern Europe and Germany
According to our analysis, all key Southern
European countries and Germany are set to
exceed their 2020 RES-E targets (based on our
old wind forecasts). Under these circumstances,
we believe that the regulators in these countries
may cut current attractive subsidies in such a way
as to slow down growth rates and ensure that
these countries just meet their respective RES-E
targets, especially in light of fiscal tightening in
these countries. So far, we have seen such moves
in Italy and Spain, which have both indicated
possible future tariff cuts as part of austerity
measures – Spain has already cut the current tariff
for Wind for two years. In addition, the Spanish
government has cut its wind target for 2020 to
38GW from 41GW.
On the assumption that each EU country just
meets its RES-E target, we cut our 2020 wind
forecast in Spain to 38GW from 42GW, which
implies a cut to our new installation forecasts for
the eleven year period 2010e-2020e by 17%, and
indicates a 1.7GW pa (average) market over that
period, rather than the 2.1GW pa market
previously forecast. We note that our new 2020
forecast is in line with the Spanish government’s
revised wind target of 38GW. In Italy, we cut our
2020 forecast to 17.5GW from 21GW, which
implies a 23% cut to our new installation forecasts
for 2010e-2020e. In Portugal and Greece, which
are the smallest of the seven markets we analyse,
we cut our new installation forecasts for 2010e-
2020e by 47% and 34% respectively.
Key EU wind markets – summary of changes to long-term wind forecasts based on EU 2020 RES-E targets for each country
5-year CAGR for annual installations (MW) (2009-14e)
_______ New installations 2010e-20e (MW)_______ ____ Cumulative capacity at end-2020e (MW) ____
EU Member State New forecast Old forecast New forecast Old forecast % increase/ (decrease)
New forecast Old forecast % increase/ (decrease)
France 11% 5% 19,684 16,466 20% 24,175 20,957 15%Germany 1% 3% 23,544 25,925 -9% 49,454 51,835 -5%Greece 17% 28% 2,481 3,741 -34% 3,568 4,828 -26%Italy 0% 5% 12,597 16,466 -23% 17,458 21,327 -18%Portugal -6% 6% 5,550 10,485 -47% 9,063 14,026 -35%Spain -8% -5% 18,897 22,797 -17% 38,094 41,994 -9%United Kingdom 13% 13% 22,248 22,123 1% 26,575 26,450 0%EU key markets 1.8% 3.8% 105,002 118,003 -11% 168,387 181,417 -7%
Rest of EU 15.7% 17.5% 48,861 58,663 -17% 61,941 70,527 -12%Total EU 5.2% 7.1% 153,862 176,666 -13% 230,329 251,944 -9%
Source: EU policy documents, HSBC estimates
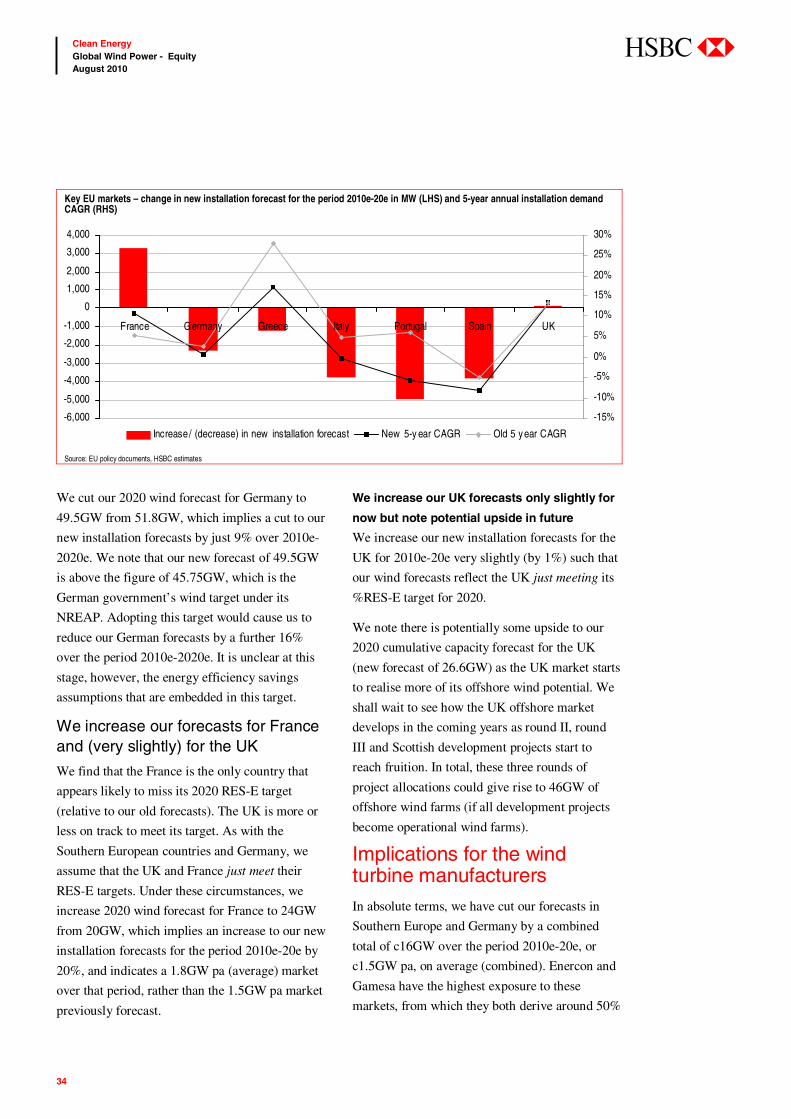
34
Clean Energy Global Wind Power - Equity August 2010
abc
We cut our 2020 wind forecast for Germany to
49.5GW from 51.8GW, which implies a cut to our
new installation forecasts by just 9% over 2010e-
2020e. We note that our new forecast of 49.5GW
is above the figure of 45.75GW, which is the
German government’s wind target under its
NREAP. Adopting this target would cause us to
reduce our German forecasts by a further 16%
over the period 2010e-2020e. It is unclear at this
stage, however, the energy efficiency savings
assumptions that are embedded in this target.
We increase our forecasts for France and (very slightly) for the UK
We find that the France is the only country that
appears likely to miss its 2020 RES-E target
(relative to our old forecasts). The UK is more or
less on track to meet its target. As with the
Southern European countries and Germany, we
assume that the UK and France just meet their
RES-E targets. Under these circumstances, we
increase 2020 wind forecast for France to 24GW
from 20GW, which implies an increase to our new
installation forecasts for the period 2010e-20e by
20%, and indicates a 1.8GW pa (average) market
over that period, rather than the 1.5GW pa market
previously forecast.
We increase our UK forecasts only slightly for
now but note potential upside in future
We increase our new installation forecasts for the
UK for 2010e-20e very slightly (by 1%) such that
our wind forecasts reflect the UK just meeting its
%RES-E target for 2020.
We note there is potentially some upside to our
2020 cumulative capacity forecast for the UK
(new forecast of 26.6GW) as the UK market starts
to realise more of its offshore wind potential. We
shall wait to see how the UK offshore market
develops in the coming years as round II, round
III and Scottish development projects start to
reach fruition. In total, these three rounds of
project allocations could give rise to 46GW of
offshore wind farms (if all development projects
become operational wind farms).
Implications for the wind turbine manufacturers In absolute terms, we have cut our forecasts in
Southern Europe and Germany by a combined
total of c16GW over the period 2010e-20e, or
c1.5GW pa, on average (combined). Enercon and
Gamesa have the highest exposure to these
markets, from which they both derive around 50%
Key EU markets – change in new installation forecast for the period 2010e-20e in MW (LHS) and 5-year annual installation demand CAGR (RHS)
-6,000
-5,000
-4,000
-3,000
-2,000
-1,000
0
1,000
2,000
3,000
4,000
France Germany Greece Italy Portugal Spain UK
-15%
-10%
-5%
0%
5%
10%
15%
20%
25%
30%
Increase/ (decrease) in new installation forecast New 5-y ear CAGR Old 5 year CAGR
Source: EU policy documents, HSBC estimates

35
Clean Energy Global Wind Power - Equity August 2010
abc
of their sales. Vestas, Nordex and REpower derive
around a third of their sales from these markets.
Southern Europe and Germany – the most exposed wind turbine manufacturers
_ Sales exposure (MW) _ _Market share (MW) __
Average 2007-09
2009 Average 2007-09
2009
Enercon 55% 58% 28% 31% Gamesa 49% 49% 25% 19% Nordex 28% 38% 4% 6% Vestas 30% 31% 27% 28% REpower 35% 26% 5% 6%
Note: this analysis excludes Greece, which is the smallest of these markets by far Source: MAKE Consulting, HSBC
We expect competition from Asia to be less intense than in the US
In the medium term, we believe the US market will
be the focal point of Chinese and Korean wind
turbine manufacturers’ internationalisation efforts
plus select emerging markets in South America,
Africa and Asia. We believe there will be less focus
on Europe, where the grid codes are typically more
complex thus requiring more sophisticated, higher-
tech turbines (basically variable speed turbines with
more advanced power controls). We believe
European market penetration will come in the longer
term (ie 10+ years).
Implications for the wind farm developers Acciona, Iberdrola Renovables, EDP Renovaveis
and EDF EN all have some degree of exposure to
Southern Europe and Germany. EDF EN’s exposure
is the lowest. Acciona’s exposure is the highest.
However, they are all internationalising and reducing
their exposure in particular to Spain (except EDF
EN, which already has no exposure there). Their
pipelines are all diversified enough to support
growth outside Southern Europe, in our view.
Wind farm developers – exposure to Southern Europe
IBR EDPR Acciona EDF EN
Wind - operating assets (MW) 11,010 5,665 5,363 2,145
Geographic split: Spain 47% 34% 73% 0% Southern Europe (ex-Spain) 11% 4% 31% Rest of Europe 8% 7% 3% 23% Europe 55% 52% 80% 54% US 35% 48% 8% 41% RoW 10% 12% 5% Total 100% 100% 100% 100%
Wind - pipeline (MW) 49,901 30,951 23,728 14,314
Geographic split: Spain 18% 16% 29% 0% Southern Europe (ex-Spain) n/a 3% n/a 14% Rest of Europe 15% 15% n/a 18% Europe 34% 34% n/a 32% US 49% 61% n/a 59% RoW 17% 4% 71% 9% Total 100% 100% 100% 100%
Source: HSBC estimates
Modelling assumptions RES-E targets
NREAPs will give formal RES-E, wind, solar
and other renewables targets
The European Commission requested each EU
member to submit a National Renewable Energy
Action Plan (NREAP) by 30 June. Only two
countries submitted their NREAPs by the deadline
(Denmark and the Netherlands), but 19 member
states have now submitted their NREAPs. The
NREAPs set out formal RES-E targets and
include a split by renewable energy source of how
the target will be achieved. Thus, under the
NREAPs, we effectively get a national target for
wind, solar, biomass etc for all EU members.

36
Clean Energy Global Wind Power - Equity August 2010
abc
We compare our wind forecasts with the wind
targets under each NREAP below. Our forecast is
in line with the Spanish target and a bit above the
German target. We are a bit below the French and
UK targets. However, we do not yet have detail of
the energy efficiency saving assumptions
embedded in any of these targets.
Comparison of HSBC wind forecasts for 2020 (MW) with NREAP national wind targets (MW)
HSBC wind forecast for 2020
(cumulative)
National wind target according NREAPs
% difference
France 24,175 25,000 -3% Germany 49,454 45,750 8% Greece 3,568 7,500 -52% Italy 17,458 12,680 38%
Portugal 9,063 6,875 32%
Spain 38,094 38,000 0% UK 26,576 27,880 -5%
Source: HSBC estimates
Electricity demand forecasts – long-term growth rates are subjective
We have adopted long-term electricity demand
growth assumptions that are in line with HSBC
Utilities team forecasts. Our base year is 2009.
Our 2020 electricity demand forecast is in line
with the IEA’s forecast, which is 3,561TWh, but
is below the EIA’s forecast of 4,204TWh, which
does not adjust for energy efficiency savings.
Comparison of 2020 electricity demand forecasts for Europe
Source of forecast Electricity demand forecast 2020
(TWh)
Energy efficiency saving embedded
in forecast
HSBC Clean Energy team 3,560 10% IEA 3,561 20% EIA 4,204 0%
Source: IEA, EIA, HSBC estimates
We assume energy efficiency savings from
electricity of 10%
In our assumptions, we have reduced demand by
10% due to energy efficiency savings. This takes
account of both demand-side management/smart
grid implementation and from more efficient
electricity usage from
industry/buildings/agriculture. This is below the
20% target under the EU 20:20:20 plan as we
believe a higher portion of energy efficiency
savings will fall outside of the electricity sector.
Clearly, increased energy efficiency savings will
reduce the renewable energy targets.
Renewable energy mix
In order to back out wind forecasts for 2020, we
took a view on the renewable energy mix in each
country. The table below sets out our forecasts by
renewable energy source for each country,
including our capacity factor assumptions.
2020 electricity demand forecasts and RES-E demand forecasts for Europe split by key markets
Gross National Electricity consumption (TWh)* _____ Electricity demand forecast 2020 (TWh) _____
EU Member State 2006 2007 2008 2009 2020e (before
EE)
11 year CAGR (2009-20e)
2020e (10% EE)
Implied 11 year CAGR (2009-20e)
%RES-E 2020e
Forecast RES-E demand 2020e (10%
EE)
France 564 570 525 486 621 2.25% 559 1.28% 26% 145Germany 637 637 557 583 706 1.75% 635 0.78% 30% 191Greece 63 63 60 58 74 2.25% 67 1.28% 29% 19Italy 314 314 356 317 384 1.75% 345 0.78% 34% 117Portugal 47 47 41 51 63 2.00% 57 1.03% 60% 34Spain 303 303 282 267 370 3.00% 333 2.02% 42% 140United Kingdom 396 396 401 341 391 1.25% 352 0.28% 30% 106Sub-total – key markets 752Rest of Europe 1,030 1,031 1,053 1,027 1,347 2.50% 1,212 1.52% 38% 440Total Europe 3,355 3,362 3,275 3,130 3,955 2.20% 3,560 1.2% 34% 1,192
%growth 0.2% -2.6% -4.4%
Source: IEA , European Commission, national policy documents, HSBC estimates
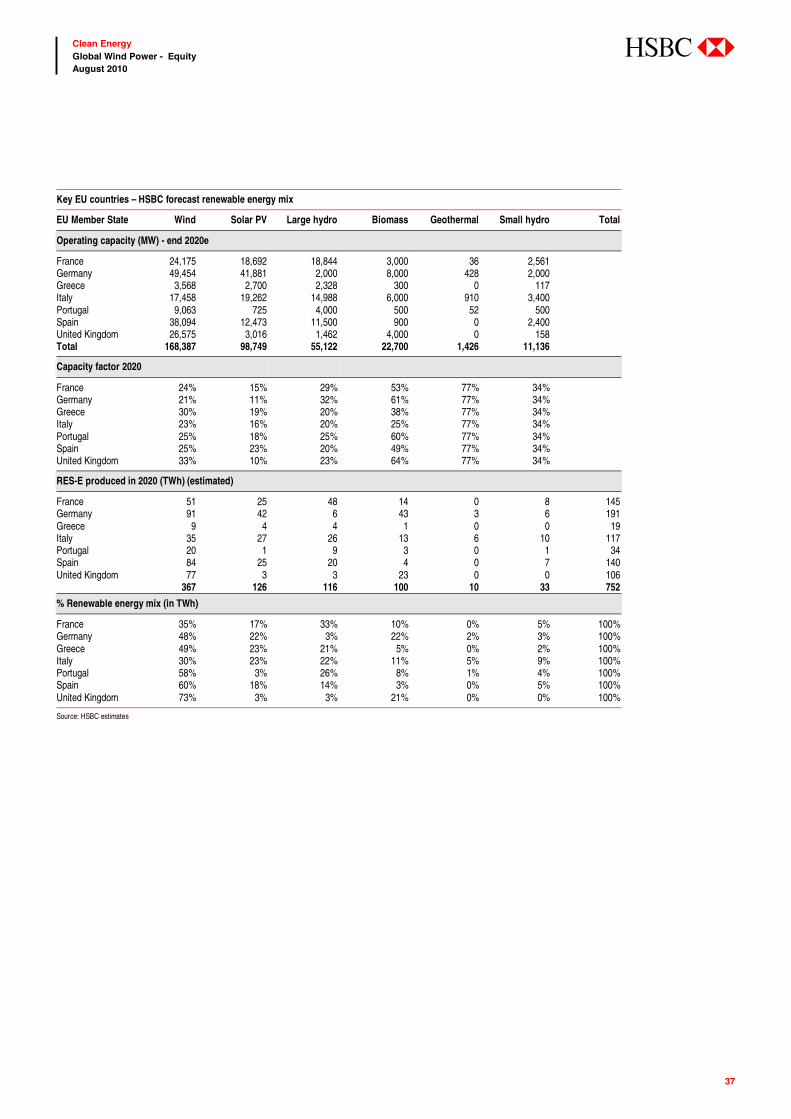
37
Clean Energy Global Wind Power - Equity August 2010
abc
Key EU countries – HSBC forecast renewable energy mix
EU Member State Wind Solar PV Large hydro Biomass Geothermal Small hydro Total
Operating capacity (MW) - end 2020e
France 24,175 18,692 18,844 3,000 36 2,561 Germany 49,454 41,881 2,000 8,000 428 2,000 Greece 3,568 2,700 2,328 300 0 117 Italy 17,458 19,262 14,988 6,000 910 3,400 Portugal 9,063 725 4,000 500 52 500 Spain 38,094 12,473 11,500 900 0 2,400 United Kingdom 26,575 3,016 1,462 4,000 0 158 Total 168,387 98,749 55,122 22,700 1,426 11,136
Capacity factor 2020
France 24% 15% 29% 53% 77% 34% Germany 21% 11% 32% 61% 77% 34% Greece 30% 19% 20% 38% 77% 34% Italy 23% 16% 20% 25% 77% 34% Portugal 25% 18% 25% 60% 77% 34% Spain 25% 23% 20% 49% 77% 34% United Kingdom 33% 10% 23% 64% 77% 34%
RES-E produced in 2020 (TWh) (estimated)
France 51 25 48 14 0 8 145 Germany 91 42 6 43 3 6 191 Greece 9 4 4 1 0 0 19 Italy 35 27 26 13 6 10 117 Portugal 20 1 9 3 0 1 34 Spain 84 25 20 4 0 7 140 United Kingdom 77 3 3 23 0 0 106 367 126 116 100 10 33 752
% Renewable energy mix (in TWh)
France 35% 17% 33% 10% 0% 5% 100% Germany 48% 22% 3% 22% 2% 3% 100% Greece 49% 23% 21% 5% 0% 2% 100% Italy 30% 23% 22% 11% 5% 9% 100% Portugal 58% 3% 26% 8% 1% 4% 100% Spain 60% 18% 14% 3% 0% 5% 100% United Kingdom 73% 3% 3% 21% 0% 0% 100%
Source: HSBC estimates
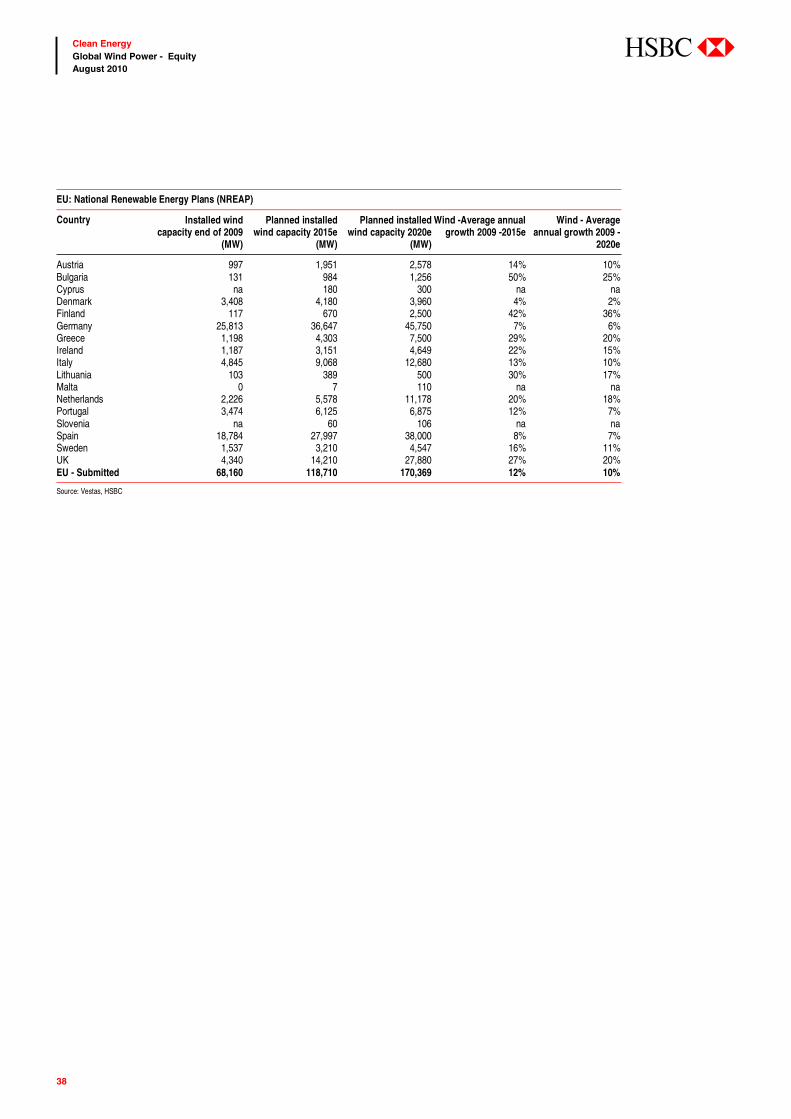
38
Clean Energy Global Wind Power - Equity August 2010
abc
EU: National Renewable Energy Plans (NREAP)
Country Installed wind capacity end of 2009
(MW)
Planned installed wind capacity 2015e
(MW)
Planned installed wind capacity 2020e
(MW)
Wind -Average annual growth 2009 -2015e
Wind - Average annual growth 2009 -
2020e
Austria 997 1,951 2,578 14% 10% Bulgaria 131 984 1,256 50% 25% Cyprus na 180 300 na na Denmark 3,408 4,180 3,960 4% 2% Finland 117 670 2,500 42% 36% Germany 25,813 36,647 45,750 7% 6% Greece 1,198 4,303 7,500 29% 20% Ireland 1,187 3,151 4,649 22% 15% Italy 4,845 9,068 12,680 13% 10% Lithuania 103 389 500 30% 17% Malta 0 7 110 na na Netherlands 2,226 5,578 11,178 20% 18% Portugal 3,474 6,125 6,875 12% 7% Slovenia na 60 106 na na Spain 18,784 27,997 38,000 8% 7% Sweden 1,537 3,210 4,547 16% 11% UK 4,340 14,210 27,880 27% 20% EU - Submitted 68,160 118,710 170,369 12% 10%
Source: Vestas, HSBC
39
Clean Energy Global Wind Power - Equity August 2010
abc
From component shortage to excess supply The wind industry dynamic has changed
considerably since early 2008. In early 2008, due
to strong growth in the industry over the period
2005-08 (4-year CAGR of 34%), there were
bottlenecks in the supply chain. However, the
credit crisis (from September 2008) led to a dry
up in project finance for renewable projects and
order flow slowed to a trickle. Due to this, today,
wind turbine manufacturers and their sub-
suppliers have found themselves with under
utilised factory space, following a period of heavy
investment in the run up to the credit crisis.
Wind turbines have nine key components (see table
on following page) and thousands of smaller ones
(5,000+) The main bottlenecks that had arisen in the
supply chain by early 2008 were the following:
Gearboxes and bearings
Casting of large components, such as the hub,
bedplate and gearbox housing
Carbon fibre.
Bottlenecks? None expected
By the end of 2009, enough capacity had come on
line to ensure that all key bottlenecks had eased.
We do not see any bottlenecks of any key
components in the coming years (2010e-12e),
based on our global demand forecasts and MAKE
Consulting’s supply forecasts. We see bearings as
the tightest part of the value chain with 14% over
capacity by 2012e (see charts at the end of this
chapter). We also note that increasing demand for
larger turbines could create bottlenecks in some
other large-sized (2MW or higher) components.
There are, however, important differences
between regional supply chains.
Asia – overcapacity in low MW-sized components, short supply of larger ones
Demand in China thus far has been driven mainly
by kW-class and low MW-class turbines. There
has been significant capacity built for all key
components for this turbine class. We believe
some consolidation is likely. However, demand in
Asia is rapidly changing towards larger turbines
(2+MW) and we expect the supply chain to come
Supply-side
We expect no major bottlenecks in the global wind value chain in
the coming years
There are, however, important differences between regional
supply chains: Asia is over-supplied; the Americas under-supplied
The most successful manufacturers will have a globally integrated
supply chain with in-house capacity in most key components, in
our view

40
Clean Energy Global Wind Power - Equity August 2010
abc
under pressure in this area in the coming years,
particularly with respect to large bearings, large
blades and advanced gearboxes. In addition, there
is an emerging offshore market in China that will
need supply chain support in the coming years.
The Americas – shortage of some key components should be rectified by exports from Asia
Many European wind turbine manufacturers,
including Vestas, Gamesa, Nordex and Acciona,
and also Suzlon have invested in the US in recent
years as improved regulatory visibility (ie a more
stable Production Tax Credit (“PTC”)) allowed
them to commit capital to the region. However, in
the last year or so, regulatory uncertainty has
returned to the US with various versions of draft
clean energy/climate change legislation struggling
to move through the Senate. Under these
circumstances, we are forecasting a flat US
market (on average), albeit from a high 2010e
base of 10GW, over the period to 2020e (see
chapter on US Regulation). We believe, there will
be demand growth in the Americas as a whole,
however, driven by emerging markets in South
America and also Canada.
None of the European/Asian manufacturers we
cover have a gearbox or generator facility in the
Americas. This has caused a shortage of capacity
at this part of the value chain. This will, however,
be rectified by exports from Europe and Asia
where there is excess capacity. Hansen, for
example, also does not have a US gearbox facility
but is exporting to the US mainly from its
European facility.
Europe – the most established supply chain
Europe is the birthplace of the wind industry some
30 years ago. It has the most established supply
chain of any region and is the local region of the
most integrated wind turbine manufacturers
(Vestas, Gamesa and Enercon). There is a
significant excess capacity in gearboxes and
generators, but as noted above this is likely to be
exported to the Americas to fill the supply
shortage there.
Implications for the wind turbine manufacturers/wind farm developers Integrated supply chain is still beneficial for a global manufacturer
It is not as important to be vertically integrated as
it was pre-2008, when there were shortages in a
number of key components. That said, we still
Top 15 wind turbine manufacturers – summary of level of in-house manufacturing of key components*
Company Blades Generators Gearboxes Bearings Castings Forgings Towers Control Systems
Converters Level of vertical
integration
Acciona 10% 0% 0% 0% 0% 0% 0% 0% 0% Low DEC 50% 70% 0% 0% 50% 0% 0% 0% 40% Medium Enercon 100% 100% n/a 0% 15% 0% 50% 100% 100% High Gamesa 75% 30% 20% 0% 10% 0% 40% 50% 0% Medium GE 0% 0% 5% 0% 0% 0% 0% 80% 25% Low Goldwind 0% 0% 0% 0% 0% 0% 0% 30% 0% Low Mingyang 100% 0% 0% 0% 0% 0% 0% 0% 0% Low Mitsubishi 100% 80% 100% 0% 0% 0% 0% 100% 0% High Nordex 50% 0% 0% 0% 0% 0% 0% 50% 0% Low REpower 5% 0% 0% 0% 0% 0% 0% 20% 0% Low Siemens 100% 80% 80% 0% 0% 0% 0% 20% 0% High Sinovel 0% 0% 20% 0% 80% 20% 0% 0% 0% Low Suzlon 95% 25% 0% 0% 100% 60% 30% 60% n/a High United Power 70% 0% 0% 0% 0% 0% 0% 100% 80% Medium Vestas 95% 50% 0% 0% 40% 0% 40% 100% 30% High
Source: MAKE Consulting, Companies
41
Clean Energy Global Wind Power - Equity August 2010
abc
believe it is beneficial for a global wind turbine
manufacturer to have in-house capacity in most
key components and ideally with a global spread.
This should help quality control and also reduce
transportation costs due to proximity to regional
markets. In the case of Vestas and Gamesa (and
other Western wind turbine manufactures), which
have integrated facilities in China, this should also
give access to cheaper manufacturing costs.
Vestas, Gamesa and Suzlon all have a good level
of in-house manufacturing capacity, although
Vestas and Suzlon both have no in-house gearbox
capacity. Vestas has the mostly globally spread
manufacturing capacity with factories in six
European countries, the US, India and China.
Pricing – pressure is on the downside
Turbine prices have already fallen by some 5-15%
from their peak price in 2008 following a dry up
in order flow due to the credit crisis. As noted
above, we forecast that the supply chain will
tighten but remain bottleneck free in key
components. Under these circumstances, we see
further downward pressure on wind turbine prices
in our view, albeit only mild in comparison to the
price falls the industry saw last year. We forecast
price reductions for the wind turbine
manufacturers we cover of c3-10% in total during
2010e-12e. Longer term, we see additional
downward pressure on pricing due to increased
competition, in particular from Chinese players
expanding overseas.
Chinese players’ turbines are cheaper on a per
MW basis but not on a ‘cost of energy’ basis
We have spoken to a leading wind farm
developer, which has evaluated the possibility of
sourcing turbines from Chinese players. It has
said that although the Chinese players’ turbines
are cheaper on a per MW basis, when one takes
into account reliability and efficiency in a total
cost of energy basis (ie cost per MWh), Chinese
players are typically more expensive than their
Western counterparts.

42
Clean Energy Global Wind Power - Equity August 2010
abc
HSBC forecast global demand versus global supply HSBC forecast global wind turbine demand (grey line) versus global supply of key components in 2010e (MW)
0 5 10 15 20 25 30 35 40 45 50 55 60 65 70 75 80 85 90 95
Tow ers
Castings
Bearings
Blades
Generators
Gearboxes
WTGs (nacelles)
Source: MAKE Consulting, HSBC estimates
HSBC forecast global wind turbine demand (grey line) versus global supply of key components in 2011e (MW)
0 5 10 15 20 25 30 35 40 45 50 55 60 65 70 75 80 85 90 95
Tow ers
Castings
Bearings
Blades
Generators
Gearboxes
WTGs (nacelles)
Source: MAKE Consulting, HSBC estimates
HSBC forecast global wind turbine demand (grey line) versus global supply of key components in 2012e (MW)
0 5 10 15 20 25 30 35 40 45 50 55 60 65 70 75 80 85 90 95
Tow ers
Castings
Bearings
Blades
Generators
Gearbox es
WTGs (nacelles)
Source: MAKE Consulting, HSBC estimates
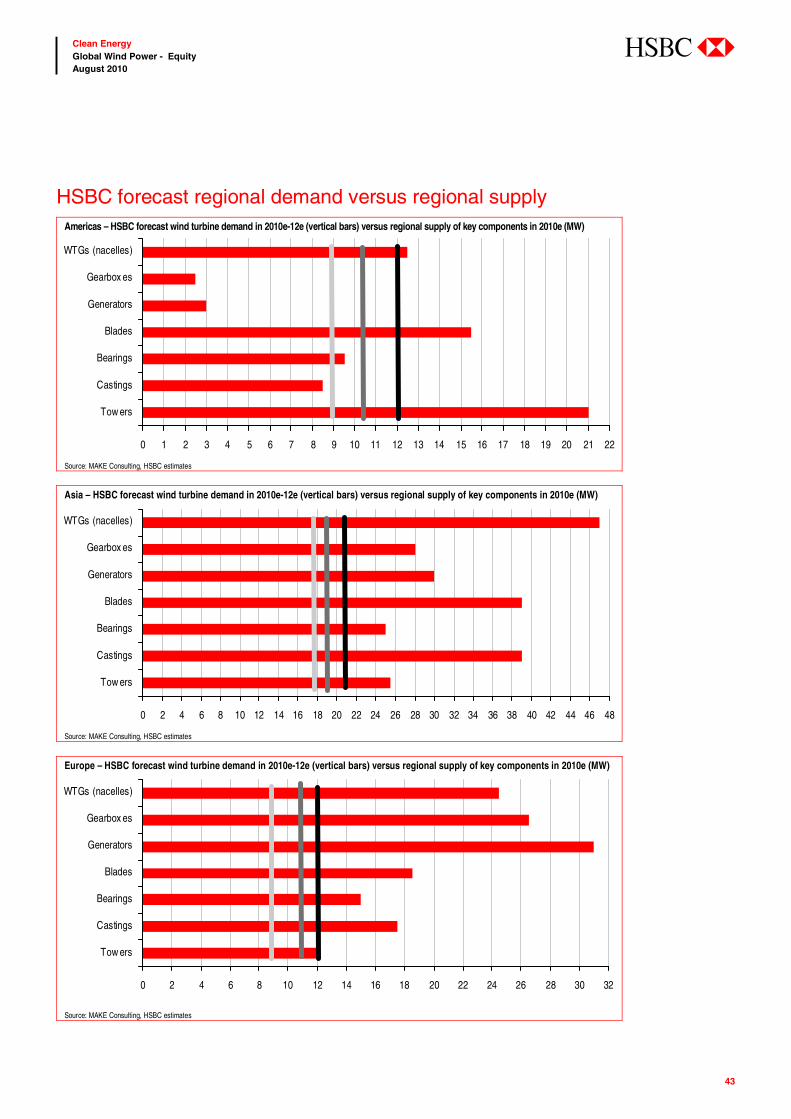
43
Clean Energy Global Wind Power - Equity August 2010
abc
HSBC forecast regional demand versus regional supply Americas – HSBC forecast wind turbine demand in 2010e-12e (vertical bars) versus regional supply of key components in 2010e (MW)
0 1 2 3 4 5 6 7 8 9 10 11 12 13 14 15 16 17 18 19 20 21 22
Tow ers
Castings
Bearings
Blades
Generators
Gearbox es
WTGs (nacelles)
Source: MAKE Consulting, HSBC estimates
Asia – HSBC forecast wind turbine demand in 2010e-12e (vertical bars) versus regional supply of key components in 2010e (MW)
0 2 4 6 8 10 12 14 16 18 20 22 24 26 28 30 32 34 36 38 40 42 44 46 48
Tow ers
Castings
Bearings
Blades
Generators
Gearbox es
WTGs (nacelles)
Source: MAKE Consulting, HSBC estimates
Europe – HSBC forecast wind turbine demand in 2010e-12e (vertical bars) versus regional supply of key components in 2010e (MW)
0 2 4 6 8 10 12 14 16 18 20 22 24 26 28 30 32
Tow ers
Castings
Bearings
Blades
Generators
Gearbox es
WTGs (nacelles)
Source: MAKE Consulting, HSBC estimates

44
Clean Energy Global Wind Power - Equity August 2010
abc
Updating our global market share model In this section, we revise our medium-term market
share forecasts (for 2014e). We use these revised
market share forecasts coupled with our revised
industry demand forecasts to help drive our
volume sale growth assumptions for each of our
coverage companies (we also take company
guidance into consideration).
The main conclusions from our revised our
market share forecasts (for 2014e) are:
The market has become more fragmented in recent years…
The wind turbine market is becoming increasingly
more competitive, due in particular to the
emergence of a number of key Chinese wind
turbine manufacturers, such as Sinovel, Goldwind
and Dongfang, which have dramatically increased
their global market share on the back of a very
strong Chinese market. We see even more intense
competition in the coming years due to the
emergence of Korean players such as Daewoo,
Hyundai, and Samsung, plus internationalisation
of the Chinese manufacturers.
Following a period of consolidation in the early
2000s, the wind turbine industry is once again
becoming fragmented. The top 10 players now
collectively hold 80% market share compared to
96% five years ago; in particular Vestas’ market
share has declined from 35% to 15% over the last
five years. There are now three Chinese players in
the top 10 compared to none five years ago.
…increasing the chances of M&A, in our view
We see this increasing market fragmentation as a
driver for increased M&A activity and see the
Chinese and Korean players as potential acquirers
as they internationalise.
Changing competitive landscape
We expect Vestas to defend its position as global no.1 due to its
broad global spread including exposure to smaller, high growth
markets
Chinese manufacturers, Sinovel, Goldwind and Dongfang, are set
to gain the most share in the coming years, in our view, due to
overseas expansion as well as strong domestic demand
We see increased chances of consolidation in the coming years
with Chinese and Korean players, potentially as acquirers
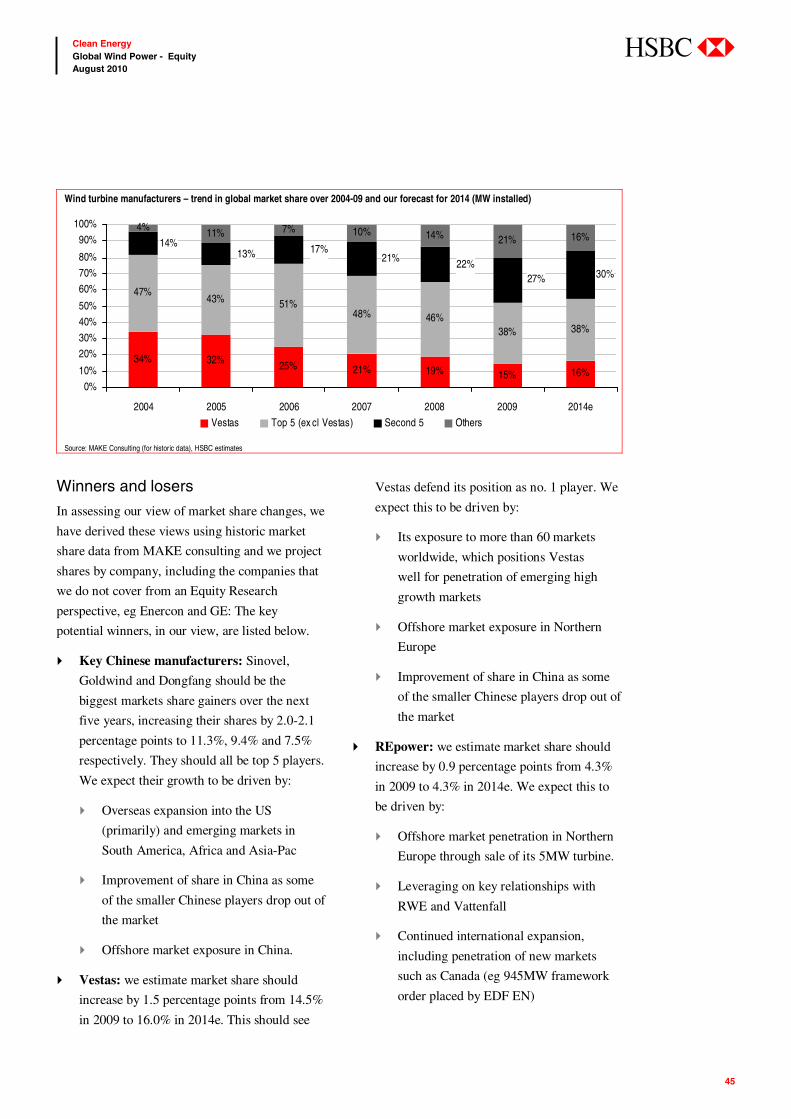
45
Clean Energy Global Wind Power - Equity August 2010
abc
Winners and losers
In assessing our view of market share changes, we
have derived these views using historic market
share data from MAKE consulting and we project
shares by company, including the companies that
we do not cover from an Equity Research
perspective, eg Enercon and GE: The key
potential winners, in our view, are listed below.
Key Chinese manufacturers: Sinovel,
Goldwind and Dongfang should be the
biggest markets share gainers over the next
five years, increasing their shares by 2.0-2.1
percentage points to 11.3%, 9.4% and 7.5%
respectively. They should all be top 5 players.
We expect their growth to be driven by:
Overseas expansion into the US
(primarily) and emerging markets in
South America, Africa and Asia-Pac
Improvement of share in China as some
of the smaller Chinese players drop out of
the market
Offshore market exposure in China.
Vestas: we estimate market share should
increase by 1.5 percentage points from 14.5%
in 2009 to 16.0% in 2014e. This should see
Vestas defend its position as no. 1 player. We
expect this to be driven by:
Its exposure to more than 60 markets
worldwide, which positions Vestas
well for penetration of emerging high
growth markets
Offshore market exposure in Northern
Europe
Improvement of share in China as some
of the smaller Chinese players drop out of
the market
REpower: we estimate market share should
increase by 0.9 percentage points from 4.3%
in 2009 to 4.3% in 2014e. We expect this to
be driven by:
Offshore market penetration in Northern
Europe through sale of its 5MW turbine.
Leveraging on key relationships with
RWE and Vattenfall
Continued international expansion,
including penetration of new markets
such as Canada (eg 945MW framework
order placed by EDF EN)
Wind turbine manufacturers – trend in global market share over 2004-09 and our forecast for 2014 (MW installed)
34% 32% 25% 21% 19% 15% 16%
47%43% 51%
48% 46%38% 38%
4% 11% 7% 10% 14% 21% 16%
30%27%22%21%
17%13%14%
0%
10%
20%
30%
40%
50%
60%
70%
80%
90%
100%
2004 2005 2006 2007 2008 2009 2014e
Vestas Top 5 (ex cl Vestas) Second 5 Others
Source: MAKE Consulting (for historic data), HSBC estimates
46
Clean Energy Global Wind Power - Equity August 2010
abc
The key potential losers, in our view, are listed
below:
Suzlon: we estimate market share should
decrease by 0.8 percentage points from 5.9%
in 2009 to 5.1% in 2014e. We expect this to
be driven by:
A decline in share in domestic market
(from 55% in 2009 to 45% in 2014) due
to increased competition from Vestas and
Gamesa, amongst others
A decline in share in some overseas
markets such as the US, Spain and Portugal
We believe, however, Suzlon will have
some success in South America and
Australia where its lower tech turbine
offering is better suited
GE Wind: we estimate market share should
decrease by 1.9 percentage points from 12.6%
in 2009 to 10.7% in 2014e, pushing GE Wind
into no.3 position globally (from no.2
previously) behind Sinovel and Vestas. We
expect this to be purely driven by GE Wind’s
high exposure to the US market:
GE Wind is 87% exposed to its domestic
US market
We forecast that GE will lose market
share (from 40% in 2009 to 35% in
2014e) as Chinese manufacturers enter an
already competitive US market
This is compounded by our forecast of
flat growth in the US over the next five
years due to weak regulation
We expect GE Wind to increase its
penetration of overseas markets in Europe
and the Americas but this will likely not
be enough to offset the negative impact of
its US market exposure
Enercon: we estimate market share should
decrease by 1.9 percentage points from 8.5%
in 2009 to 6.6% in 2014e. We expect this to
be driven by:
A decline in share in some key European
markets (partly due to Enercon achieving
higher than trend market share in some
markets in 2009)
Compounded by the European market
growing slower than the global market (5
year CAGR of 4.8% versus 6.3% globally)
(Enercon is the market leader in Europe)

47
Clean Energy Global Wind Power - Equity August 2010
abc
Global market share in 2009
It is no surprise that three of our four
underperformers (in terms of market share
performance out to 2014e), GE Wind, Gamesa and
Enercon, are all market leaders in their respective
domestic markets, which we forecast to be ex-
growth markets in the coming years. Suzlon is also
set to be an underperformer in our view, but due to
a loss of market share in its domestic market, not
due to a weak Indian market itself (the Indian
market is in fact one of our “growth” markets).
Domestic market leaders
Domestic market
Global ranking*
Forecast installations
during 2010-14e
5-year CAGR
(2009-14e)
Market share in
2009
Sinovel China 1 85,000 8% 25% GE Wind US 2 42,000 0% 40% Suzlon India 3 10,450 12% 55% Enercon Germany 5 9,500 1% 60% Gamesa Spain 6 8,200 -8% 37%
Note: * in terms of forecast installations during 2010-14 Source: HSBC estimates
Sinovel, one of our top performers (from a market
share perspective), is the domestic market leader
in China, the number one market and one of our
“growth” markets.
It is noteworthy that Vestas is not a domestic
market leader. In our view, this is an advantage to
Vestas right now as it protects against over
exposure to domestic market downturns. Vestas
has the most globally spread supply chain and is
able to manoeuvre the best growth markets
globally, and is well positioned to be a first-mover
in early stage growth markets, in our view.
Vestas – position in the top 10 markets
Global ranking*
1st place 2nd place 3rd place
China 1 US 2 15% India 3 Canada 4 50% Germany 5 20% Spain 6 34% UK 7 11% France 8 15% Italy 9 32% Portugal 10 15%
Note: * in terms of forecast installations during 2010-14 Source: HSBC estimates
Vestas is a top three player in eight of the top 10
markets, including dominant market leader in
Canada, which we forecast to be the strongest
growing top 10 market with a 5-year CAGR of 19%.
Wind turbine manufacturers – global market share of top 10 players plus Nordex and Clipper for 2008 and 2009 (value included for 2009) and our forecasts for 2014e (MW installed)
14.5%12.6%
9.3% 8.5% 7.3% 6.6% 6.0% 5.9% 5.4%3.4% 2.5% 1.8%
16.3%
0.0%
5.0%
10.0%
15.0%
20.0%
25.0%
Vest
as
GE
Win
d
Sino
vel
Ener
con
Gol
dwin
d
Siem
ens
Gam
esa
Suzl
on
Don
gfan
g
REp
ower
Nor
dex
Clip
per
Oth
er
2008 2009 2014e
Source: MAKE Consulting (for historic data), HSBC estimates
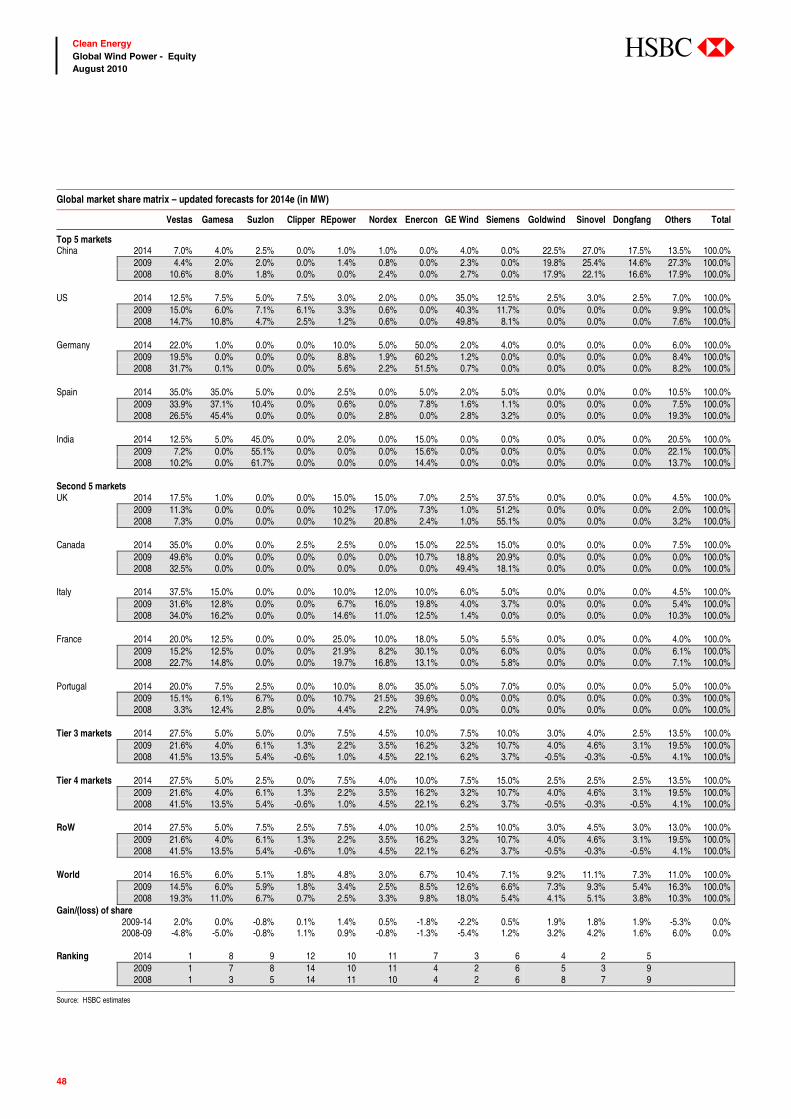
48
Clean Energy Global Wind Power - Equity August 2010
abc
Global market share matrix – updated forecasts for 2014e (in MW)
Vestas Gamesa Suzlon Clipper REpower Nordex Enercon GE Wind Siemens Goldwind Sinovel Dongfang Others Total
Top 5 markets China 2014 7.0% 4.0% 2.5% 0.0% 1.0% 1.0% 0.0% 4.0% 0.0% 22.5% 27.0% 17.5% 13.5% 100.0%
2009 4.4% 2.0% 2.0% 0.0% 1.4% 0.8% 0.0% 2.3% 0.0% 19.8% 25.4% 14.6% 27.3% 100.0%2008 10.6% 8.0% 1.8% 0.0% 0.0% 2.4% 0.0% 2.7% 0.0% 17.9% 22.1% 16.6% 17.9% 100.0%
US 2014 12.5% 7.5% 5.0% 7.5% 3.0% 2.0% 0.0% 35.0% 12.5% 2.5% 3.0% 2.5% 7.0% 100.0%
2009 15.0% 6.0% 7.1% 6.1% 3.3% 0.6% 0.0% 40.3% 11.7% 0.0% 0.0% 0.0% 9.9% 100.0%2008 14.7% 10.8% 4.7% 2.5% 1.2% 0.6% 0.0% 49.8% 8.1% 0.0% 0.0% 0.0% 7.6% 100.0%
Germany 2014 22.0% 1.0% 0.0% 0.0% 10.0% 5.0% 50.0% 2.0% 4.0% 0.0% 0.0% 0.0% 6.0% 100.0%
2009 19.5% 0.0% 0.0% 0.0% 8.8% 1.9% 60.2% 1.2% 0.0% 0.0% 0.0% 0.0% 8.4% 100.0%2008 31.7% 0.1% 0.0% 0.0% 5.6% 2.2% 51.5% 0.7% 0.0% 0.0% 0.0% 0.0% 8.2% 100.0%
Spain 2014 35.0% 35.0% 5.0% 0.0% 2.5% 0.0% 5.0% 2.0% 5.0% 0.0% 0.0% 0.0% 10.5% 100.0%
2009 33.9% 37.1% 10.4% 0.0% 0.6% 0.0% 7.8% 1.6% 1.1% 0.0% 0.0% 0.0% 7.5% 100.0%2008 26.5% 45.4% 0.0% 0.0% 0.0% 2.8% 0.0% 2.8% 3.2% 0.0% 0.0% 0.0% 19.3% 100.0%
India 2014 12.5% 5.0% 45.0% 0.0% 2.0% 0.0% 15.0% 0.0% 0.0% 0.0% 0.0% 0.0% 20.5% 100.0%
2009 7.2% 0.0% 55.1% 0.0% 0.0% 0.0% 15.6% 0.0% 0.0% 0.0% 0.0% 0.0% 22.1% 100.0%2008 10.2% 0.0% 61.7% 0.0% 0.0% 0.0% 14.4% 0.0% 0.0% 0.0% 0.0% 0.0% 13.7% 100.0%
Second 5 markets UK 2014 17.5% 1.0% 0.0% 0.0% 15.0% 15.0% 7.0% 2.5% 37.5% 0.0% 0.0% 0.0% 4.5% 100.0%
2009 11.3% 0.0% 0.0% 0.0% 10.2% 17.0% 7.3% 1.0% 51.2% 0.0% 0.0% 0.0% 2.0% 100.0%2008 7.3% 0.0% 0.0% 0.0% 10.2% 20.8% 2.4% 1.0% 55.1% 0.0% 0.0% 0.0% 3.2% 100.0%
Canada 2014 35.0% 0.0% 0.0% 2.5% 2.5% 0.0% 15.0% 22.5% 15.0% 0.0% 0.0% 0.0% 7.5% 100.0%
2009 49.6% 0.0% 0.0% 0.0% 0.0% 0.0% 10.7% 18.8% 20.9% 0.0% 0.0% 0.0% 0.0% 100.0%2008 32.5% 0.0% 0.0% 0.0% 0.0% 0.0% 0.0% 49.4% 18.1% 0.0% 0.0% 0.0% 0.0% 100.0%
Italy 2014 37.5% 15.0% 0.0% 0.0% 10.0% 12.0% 10.0% 6.0% 5.0% 0.0% 0.0% 0.0% 4.5% 100.0%
2009 31.6% 12.8% 0.0% 0.0% 6.7% 16.0% 19.8% 4.0% 3.7% 0.0% 0.0% 0.0% 5.4% 100.0%2008 34.0% 16.2% 0.0% 0.0% 14.6% 11.0% 12.5% 1.4% 0.0% 0.0% 0.0% 0.0% 10.3% 100.0%
France 2014 20.0% 12.5% 0.0% 0.0% 25.0% 10.0% 18.0% 5.0% 5.5% 0.0% 0.0% 0.0% 4.0% 100.0%
2009 15.2% 12.5% 0.0% 0.0% 21.9% 8.2% 30.1% 0.0% 6.0% 0.0% 0.0% 0.0% 6.1% 100.0%2008 22.7% 14.8% 0.0% 0.0% 19.7% 16.8% 13.1% 0.0% 5.8% 0.0% 0.0% 0.0% 7.1% 100.0%
Portugal 2014 20.0% 7.5% 2.5% 0.0% 10.0% 8.0% 35.0% 5.0% 7.0% 0.0% 0.0% 0.0% 5.0% 100.0%
2009 15.1% 6.1% 6.7% 0.0% 10.7% 21.5% 39.6% 0.0% 0.0% 0.0% 0.0% 0.0% 0.3% 100.0%2008 3.3% 12.4% 2.8% 0.0% 4.4% 2.2% 74.9% 0.0% 0.0% 0.0% 0.0% 0.0% 0.0% 100.0%
Tier 3 markets 2014 27.5% 5.0% 5.0% 0.0% 7.5% 4.5% 10.0% 7.5% 10.0% 3.0% 4.0% 2.5% 13.5% 100.0%
2009 21.6% 4.0% 6.1% 1.3% 2.2% 3.5% 16.2% 3.2% 10.7% 4.0% 4.6% 3.1% 19.5% 100.0%2008 41.5% 13.5% 5.4% -0.6% 1.0% 4.5% 22.1% 6.2% 3.7% -0.5% -0.3% -0.5% 4.1% 100.0%
Tier 4 markets 2014 27.5% 5.0% 2.5% 0.0% 7.5% 4.0% 10.0% 7.5% 15.0% 2.5% 2.5% 2.5% 13.5% 100.0%
2009 21.6% 4.0% 6.1% 1.3% 2.2% 3.5% 16.2% 3.2% 10.7% 4.0% 4.6% 3.1% 19.5% 100.0%2008 41.5% 13.5% 5.4% -0.6% 1.0% 4.5% 22.1% 6.2% 3.7% -0.5% -0.3% -0.5% 4.1% 100.0%
RoW 2014 27.5% 5.0% 7.5% 2.5% 7.5% 4.0% 10.0% 2.5% 10.0% 3.0% 4.5% 3.0% 13.0% 100.0%
2009 21.6% 4.0% 6.1% 1.3% 2.2% 3.5% 16.2% 3.2% 10.7% 4.0% 4.6% 3.1% 19.5% 100.0%2008 41.5% 13.5% 5.4% -0.6% 1.0% 4.5% 22.1% 6.2% 3.7% -0.5% -0.3% -0.5% 4.1% 100.0%
World 2014 16.5% 6.0% 5.1% 1.8% 4.8% 3.0% 6.7% 10.4% 7.1% 9.2% 11.1% 7.3% 11.0% 100.0%
2009 14.5% 6.0% 5.9% 1.8% 3.4% 2.5% 8.5% 12.6% 6.6% 7.3% 9.3% 5.4% 16.3% 100.0%2008 19.3% 11.0% 6.7% 0.7% 2.5% 3.3% 9.8% 18.0% 5.4% 4.1% 5.1% 3.8% 10.3% 100.0%
Gain/(loss) of share 2009-14 2.0% 0.0% -0.8% 0.1% 1.4% 0.5% -1.8% -2.2% 0.5% 1.9% 1.8% 1.9% -5.3% 0.0%2008-09 -4.8% -5.0% -0.8% 1.1% 0.9% -0.8% -1.3% -5.4% 1.2% 3.2% 4.2% 1.6% 6.0% 0.0%
Ranking 2014 1 8 9 12 10 11 7 3 6 4 2 5
2009 1 7 8 14 10 11 4 2 6 5 3 9 2008 1 3 5 14 11 10 4 2 6 8 7 9
Source: HSBC estimates

49
Clean Energy Global Wind Power - Equity August 2010
abc
Market share analysis – our coverage companies Vestas – will successfully defend its no.1 position, in our view
Vestas has been the market leader since the wind
industry began back in the 1980s. Its market share
has, however, been eroded over time due to
increasing competition from GE and Siemens,
amongst others, and more recently Goldwind,
Sinovel and Dongfang.
In particular, since 2004, Vestas’ market share has
decreased from nearly 35% to 14.5% in 2009.
However, we believe that Vestas will continue to
successfully defend its no.1 position and should
increase its market share slightly over the next
five years. It is the most globally spread
manufacturer, with exposure to more than 60
markets worldwide, including good exposure to
growth markets (see Global wind market analysis
section); thus we believe Vestas is well positioned
to penetrate some of the smaller, high growth
markets. We forecast a market share of 16.5% in
2014e, an increase of 2 percentage points over
2009. We note that Vestas is likely to face tough
competition from Chinese turbine manufacturers
internationalising.
Vestas – trend in market share over the period 2004-09 and our forecasts from 2010e-14e (MW) including trend line
0%
5%
10%
15%
20%
25%
30%
35%
40%
2004 2005 2006 2007 2008 2009 2010e 2011e 2012e 2013e 2014e
Source: MAKE Consulting (historic data), HSBC estimates
Gamesa – trend in market share over the period 2004-09 and our forecasts from 2010e-14e (MW) including trend line
0%
2%
4%
6%
8%
10%
12%
14%
16%
18%
2004 2005 2006 2007 2008 2009 2010e 2011e 2012e 2013e 2014e
Source: MAKE Consulting (historic data), HSBC estimates
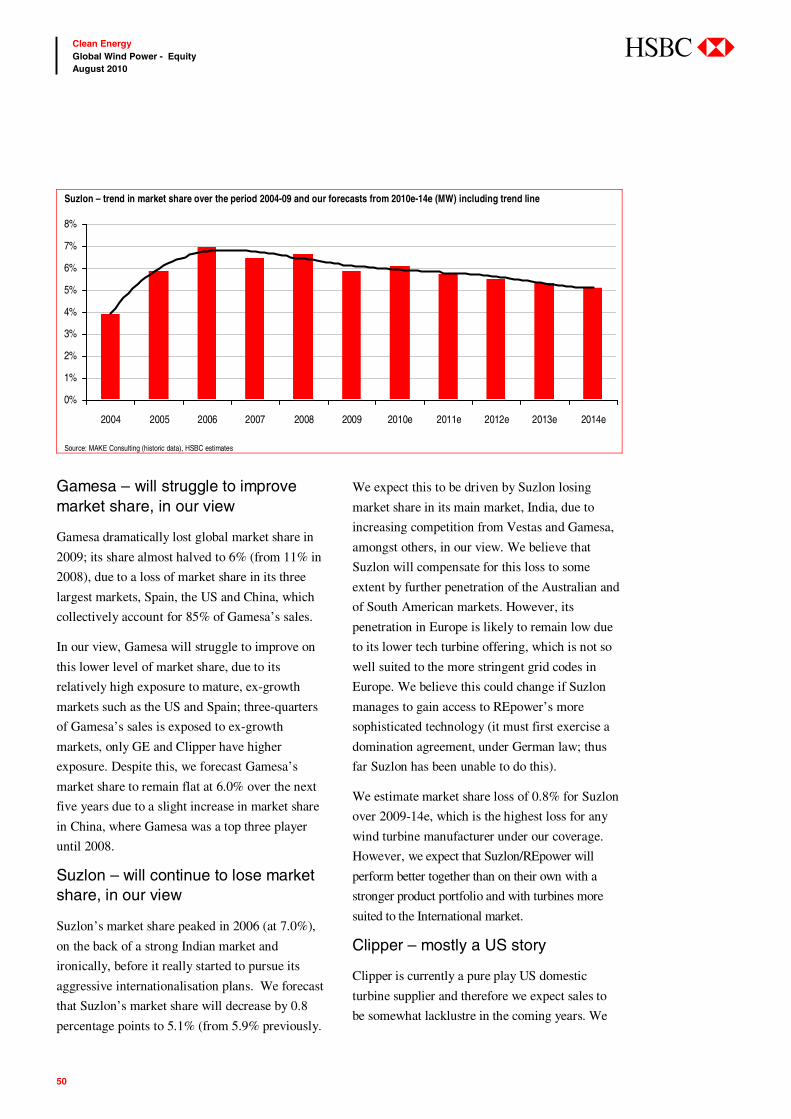
50
Clean Energy Global Wind Power - Equity August 2010
abc
Gamesa – will struggle to improve market share, in our view
Gamesa dramatically lost global market share in
2009; its share almost halved to 6% (from 11% in
2008), due to a loss of market share in its three
largest markets, Spain, the US and China, which
collectively account for 85% of Gamesa’s sales.
In our view, Gamesa will struggle to improve on
this lower level of market share, due to its
relatively high exposure to mature, ex-growth
markets such as the US and Spain; three-quarters
of Gamesa’s sales is exposed to ex-growth
markets, only GE and Clipper have higher
exposure. Despite this, we forecast Gamesa’s
market share to remain flat at 6.0% over the next
five years due to a slight increase in market share
in China, where Gamesa was a top three player
until 2008.
Suzlon – will continue to lose market share, in our view
Suzlon’s market share peaked in 2006 (at 7.0%),
on the back of a strong Indian market and
ironically, before it really started to pursue its
aggressive internationalisation plans. We forecast
that Suzlon’s market share will decrease by 0.8
percentage points to 5.1% (from 5.9% previously.
We expect this to be driven by Suzlon losing
market share in its main market, India, due to
increasing competition from Vestas and Gamesa,
amongst others, in our view. We believe that
Suzlon will compensate for this loss to some
extent by further penetration of the Australian and
of South American markets. However, its
penetration in Europe is likely to remain low due
to its lower tech turbine offering, which is not so
well suited to the more stringent grid codes in
Europe. We believe this could change if Suzlon
manages to gain access to REpower’s more
sophisticated technology (it must first exercise a
domination agreement, under German law; thus
far Suzlon has been unable to do this).
We estimate market share loss of 0.8% for Suzlon
over 2009-14e, which is the highest loss for any
wind turbine manufacturer under our coverage.
However, we expect that Suzlon/REpower will
perform better together than on their own with a
stronger product portfolio and with turbines more
suited to the International market.
Clipper – mostly a US story
Clipper is currently a pure play US domestic
turbine supplier and therefore we expect sales to
be somewhat lacklustre in the coming years. We
Suzlon – trend in market share over the period 2004-09 and our forecasts from 2010e-14e (MW) including trend line
0%
1%
2%
3%
4%
5%
6%
7%
8%
2004 2005 2006 2007 2008 2009 2010e 2011e 2012e 2013e 2014e
Source: MAKE Consulting (historic data), HSBC estimates
51
Clean Energy Global Wind Power - Equity August 2010
abc
expect Clipper to look for growth through
international expansion and believe it will gain
some traction in South America and Canada;
however, only enough to maintain its global
market share at c1.8%. In the longer-term, Clipper
could make some traction in the UK offshore
market with its Britannia, 10MW turbine, although
we do not expect Clipper to have a commercial,
proven model ready until much before the round
three projects go out to tender (we expect around
2013-14), at the earliest.
We forecast a market share of 1.8% in 2014e, the
same as in 2009.
REpower – momentum will continue
Repower increased its market share by 0.9
percentage points to 3.4% in 2009. We believe
this momentum will continue in the coming years
as it continues to internationalise. We expect
increased exposure to the Americas (Canada and
South America) and Asia-Pac (India and
Australia). We believe parent company Suzlon’s
relationships will help
We forecast a market share of 4.8% in 2014e, an
increase of 1.4 percentage points over 2009 (3.4%).
Nordex – share should increase but falling further behind REpower
We believe that Nordex will increase its market
share over the next five years, albeit from a low
base, as it continues to internationalise. We forecast
a market share of 3.0% in 2014e, an increase of 0.5
percentage points over 2009 (2.5%).
52
Clean Energy Global Wind Power - Equity August 2010
abc
Announced orders – allocated by year Methodology
In this section, we have analysed announced order
data since the start of 2007 for a selection of
leading wind OEMs, which publicly announce
their orders (albeit only material ones). We have
analysed a total of 49GW worth of orders. The
only Chinese manufacturer where order data is
readily available is Goldwind. We have split our
analysis into two strands:
Spot orders: these are announced orders that
typically relate to a specific project, with
specific delivery dates, typically in the current or
following year but sometimes further out. These
orders can be supply only, supply and
installation or turnkey projects. We only include
firm/unconditional orders in our analysis
Framework agreements: these orders are
typically for a larger number of turbines to be
delivered over a pre-defined period. These
orders are typically supply only, or supply
and installation but can also be turnkey
projects. They typically allow some flexibility
for developers to shift turbines to different
projects and time periods but are essentially
firm orders in terms of total turbines to be
delivered over the pre-defined period. We
have excluded any optional/contingent part of
the agreement from our analysis.
Global order flow data – supports our 2010 industry forecasts
Of the 49GW of projects we have analysed, we
believe that 15.2GW are for delivery in 2010e.
This equates to 42% of our global industry
forecast for 2010e (36.1GW) (see chart below).
This does not seem a particularly high portion,
given that there are just a couple of months left
this year if a developer wants to order turbines for
a 2010 project (ie lead times for turbines are
around 3 months), however, in fact, a similar
analysis indicates that 14.6GW of projects were
for delivery in 2009, which is just 39% of actual
demand in 2009 (see chart below). We note that
our analysis does not include the Chinese
manufacturers (with the exception of Goldwind)
nor does it pick up all of GE, Siemens,
Mitsubishi and Enercon’s projects. The seven
pure play wind OEMs, which announce all
material projects, represent a majority of projects
Wind OEMs – order flow
Vestas has announced c5.7GW of order YTD and we believe it is
on course to meet its guidance of 8-9GW of order inflow in 2010
Our 2010 industry forecast for ‘global ex-Asia’ looks achievable
based on our bottom-up analysis
We note signs of order flow picking up, in particular with a
number of large US orders announced by Vestas
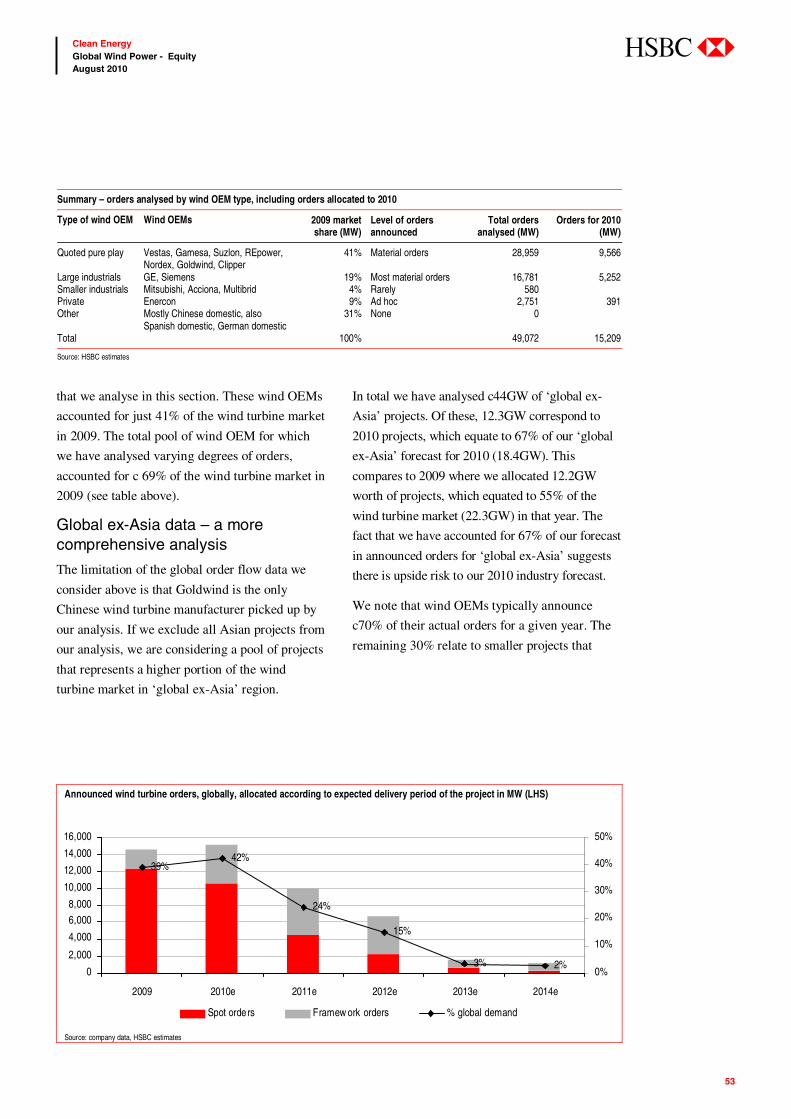
53
Clean Energy Global Wind Power - Equity August 2010
abc
that we analyse in this section. These wind OEMs
accounted for just 41% of the wind turbine market
in 2009. The total pool of wind OEM for which
we have analysed varying degrees of orders,
accounted for c 69% of the wind turbine market in
2009 (see table above).
Global ex-Asia data – a more comprehensive analysis
The limitation of the global order flow data we
consider above is that Goldwind is the only
Chinese wind turbine manufacturer picked up by
our analysis. If we exclude all Asian projects from
our analysis, we are considering a pool of projects
that represents a higher portion of the wind
turbine market in ‘global ex-Asia’ region.
In total we have analysed c44GW of ‘global ex-
Asia’ projects. Of these, 12.3GW correspond to
2010 projects, which equate to 67% of our ‘global
ex-Asia’ forecast for 2010 (18.4GW). This
compares to 2009 where we allocated 12.2GW
worth of projects, which equated to 55% of the
wind turbine market (22.3GW) in that year. The
fact that we have accounted for 67% of our forecast
in announced orders for ‘global ex-Asia’ suggests
there is upside risk to our 2010 industry forecast.
We note that wind OEMs typically announce
c70% of their actual orders for a given year. The
remaining 30% relate to smaller projects that
Announced wind turbine orders, globally, allocated according to expected delivery period of the project in MW (LHS)
39%42%
24%
15%
3% 2%0
2,000
4,000
6,000
8,000
10,000
12,000
14,000
16,000
2009 2010e 2011e 2012e 2013e 2014e
0%
10%
20%
30%
40%
50%
Spot orders Framew ork orders % global demand
Source: company data, HSBC estimates
Summary – orders analysed by wind OEM type, including orders allocated to 2010
Type of wind OEM Wind OEMs 2009 market share (MW)
Level of orders announced
Total orders analysed (MW)
Orders for 2010 (MW)
Quoted pure play Vestas, Gamesa, Suzlon, REpower, Nordex, Goldwind, Clipper
41% Material orders 28,959 9,566
Large industrials GE, Siemens 19% Most material orders 16,781 5,252 Smaller industrials Mitsubishi, Acciona, Multibrid 4% Rarely 580 Private Enercon 9% Ad hoc 2,751 391 Other Mostly Chinese domestic, also
Spanish domestic, German domestic 31% None 0
Total 100% 49,072 15,209
Source: HSBC estimates
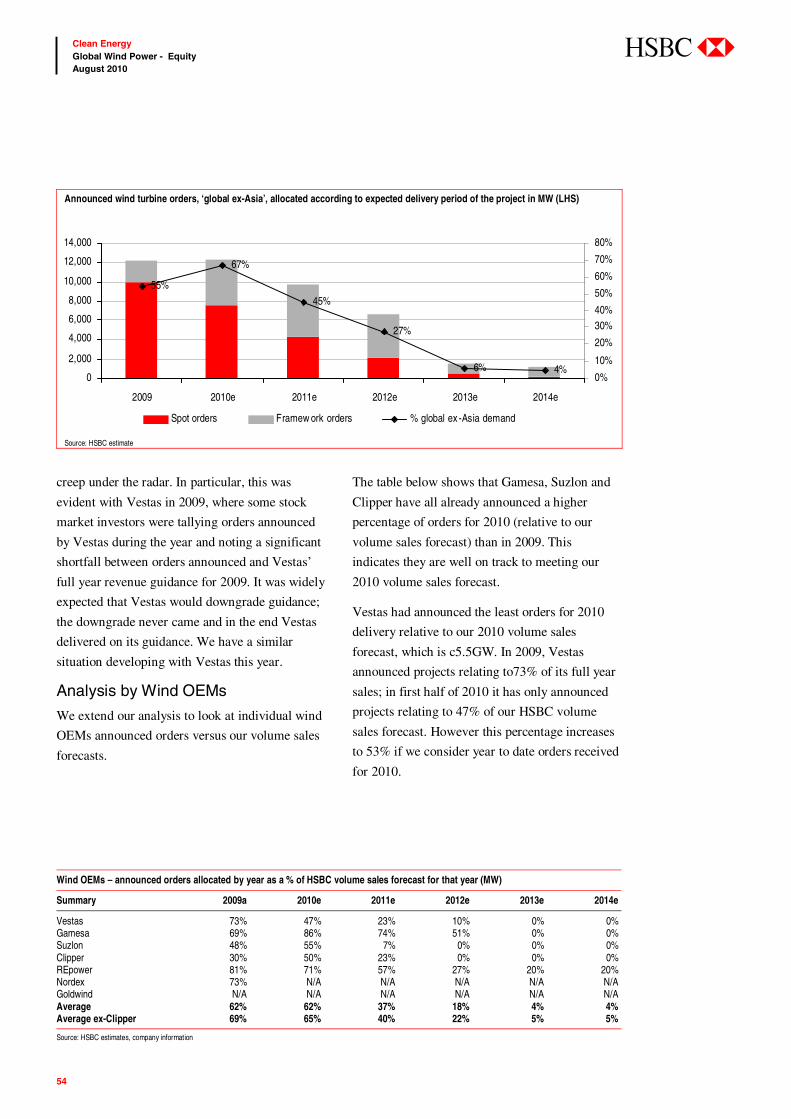
54
Clean Energy Global Wind Power - Equity August 2010
abc
creep under the radar. In particular, this was
evident with Vestas in 2009, where some stock
market investors were tallying orders announced
by Vestas during the year and noting a significant
shortfall between orders announced and Vestas’
full year revenue guidance for 2009. It was widely
expected that Vestas would downgrade guidance;
the downgrade never came and in the end Vestas
delivered on its guidance. We have a similar
situation developing with Vestas this year.
Analysis by Wind OEMs
We extend our analysis to look at individual wind
OEMs announced orders versus our volume sales
forecasts.
The table below shows that Gamesa, Suzlon and
Clipper have all already announced a higher
percentage of orders for 2010 (relative to our
volume sales forecast) than in 2009. This
indicates they are well on track to meeting our
2010 volume sales forecast.
Vestas had announced the least orders for 2010
delivery relative to our 2010 volume sales
forecast, which is c5.5GW. In 2009, Vestas
announced projects relating to73% of its full year
sales; in first half of 2010 it has only announced
projects relating to 47% of our HSBC volume
sales forecast. However this percentage increases
to 53% if we consider year to date orders received
for 2010.
Announced wind turbine orders, ‘global ex-Asia’, allocated according to expected delivery period of the project in MW (LHS)
55%
67%
45%
27%
6% 4%0
2,000
4,000
6,000
8,000
10,000
12,000
14,000
2009 2010e 2011e 2012e 2013e 2014e
0%
10%
20%
30%40%
50%
60%
70%
80%
Spot orders Framew ork orders % global ex -Asia demand
Source: HSBC estimate
Wind OEMs – announced orders allocated by year as a % of HSBC volume sales forecast for that year (MW)
Summary 2009a 2010e 2011e 2012e 2013e 2014e
Vestas 73% 47% 23% 10% 0% 0% Gamesa 69% 86% 74% 51% 0% 0% Suzlon 48% 55% 7% 0% 0% 0% Clipper 30% 50% 23% 0% 0% 0% REpower 81% 71% 57% 27% 20% 20% Nordex 73% N/A N/A N/A N/A N/A Goldwind N/A N/A N/A N/A N/A N/A Average 62% 62% 37% 18% 4% 4% Average ex-Clipper 69% 65% 40% 22% 5% 5%
Source: HSBC estimates, company information
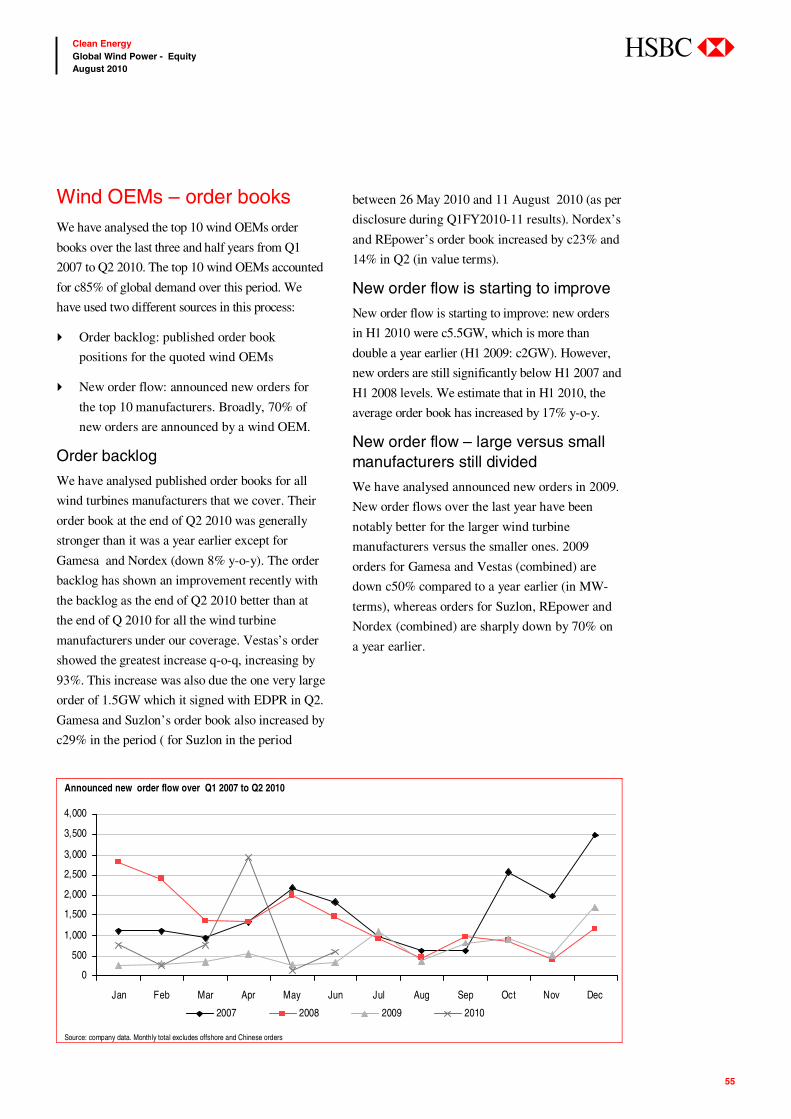
55
Clean Energy Global Wind Power - Equity August 2010
abc
Wind OEMs – order books We have analysed the top 10 wind OEMs order
books over the last three and half years from Q1
2007 to Q2 2010. The top 10 wind OEMs accounted
for c85% of global demand over this period. We
have used two different sources in this process:
Order backlog: published order book
positions for the quoted wind OEMs
New order flow: announced new orders for
the top 10 manufacturers. Broadly, 70% of
new orders are announced by a wind OEM.
Order backlog
We have analysed published order books for all
wind turbines manufacturers that we cover. Their
order book at the end of Q2 2010 was generally
stronger than it was a year earlier except for
Gamesa and Nordex (down 8% y-o-y). The order
backlog has shown an improvement recently with
the backlog as the end of Q2 2010 better than at
the end of Q 2010 for all the wind turbine
manufacturers under our coverage. Vestas’s order
showed the greatest increase q-o-q, increasing by
93%. This increase was also due the one very large
order of 1.5GW which it signed with EDPR in Q2.
Gamesa and Suzlon’s order book also increased by
c29% in the period ( for Suzlon in the period
between 26 May 2010 and 11 August 2010 (as per
disclosure during Q1FY2010-11 results). Nordex’s
and REpower’s order book increased by c23% and
14% in Q2 (in value terms).
New order flow is starting to improve
New order flow is starting to improve: new orders
in H1 2010 were c5.5GW, which is more than
double a year earlier (H1 2009: c2GW). However,
new orders are still significantly below H1 2007 and
H1 2008 levels. We estimate that in H1 2010, the
average order book has increased by 17% y-o-y.
New order flow – large versus small manufacturers still divided
We have analysed announced new orders in 2009.
New order flows over the last year have been
notably better for the larger wind turbine
manufacturers versus the smaller ones. 2009
orders for Gamesa and Vestas (combined) are
down c50% compared to a year earlier (in MW-
terms), whereas orders for Suzlon, REpower and
Nordex (combined) are sharply down by 70% on
a year earlier.
Announced new order flow over Q1 2007 to Q2 2010
0
500
1,000
1,500
2,000
2,500
3,000
3,500
4,000
Jan Feb Mar Apr May Jun Jul Aug Sep Oct Nov Dec
2007 2008 2009 2010
Source: company data. Monthly total excludes offshore and Chinese orders

56
Clean Energy Global Wind Power - Equity August 2010
abc
Vestas most highly geared to a demand recovery
Following the freeze in the credit markets in
September 2008, investors focused on the
exposure of the wind turbine manufacturers to
different customer types. Future sales for Gamesa
were seen as safer than Vestas as Gamesa has a
higher portion of utility customers compared to
Vestas which has a higher exposure to medium
sized Independent Power Producers (IPPs). In our
view, the reverse should now happen. As the
project finance markets become easier month by
month it is the medium sized IPPs which have
found credit more difficult to obtain over the last
year or so, which should now start to receive
finance once again (assuming they have not gone
bankrupt) and therefore start to place orders again.
Vestas is more highly geared towards this
customer type.
Vestas has received the largest numbers of orders for onshore and Siemens for offshore turbines
As per our analysis of 2009 order flow, Vestas
remains the leader in the onshore segment of the
wind turbine market. It received the orders for
c1.8GW of onshore turbines in 2009 .Gamesa also
had a fairly strong order flow and stood at third
New wind turbine order flow in 2009 by Manufacturer
1,825
1,3901,222 1,171 1,064 951
313 29170165
2,453
150400
470
0
500
1,000
1,500
2,000
2,500
3,000
Vestas GE Gamesa Siemens Goldw ind Suzlon REpow er Nordex Clipper Other
Onshore orders (MW) Offshore orders (MW)
Note Only publicly disclosed orders Source: HSBC, Company data.
Announced wind turbine new order flow from Q1 2007 to Q2 2010 (MW)
0
2,000
4,000
6,000
8,000
10,000
12,000
14,000
Q1 Q2 Q3 Q4
2007 2008 2009 2010
Source: Company data, HSBC. Note : Monthly total excluding offshore and Chinese wind turbine manufacturers orders
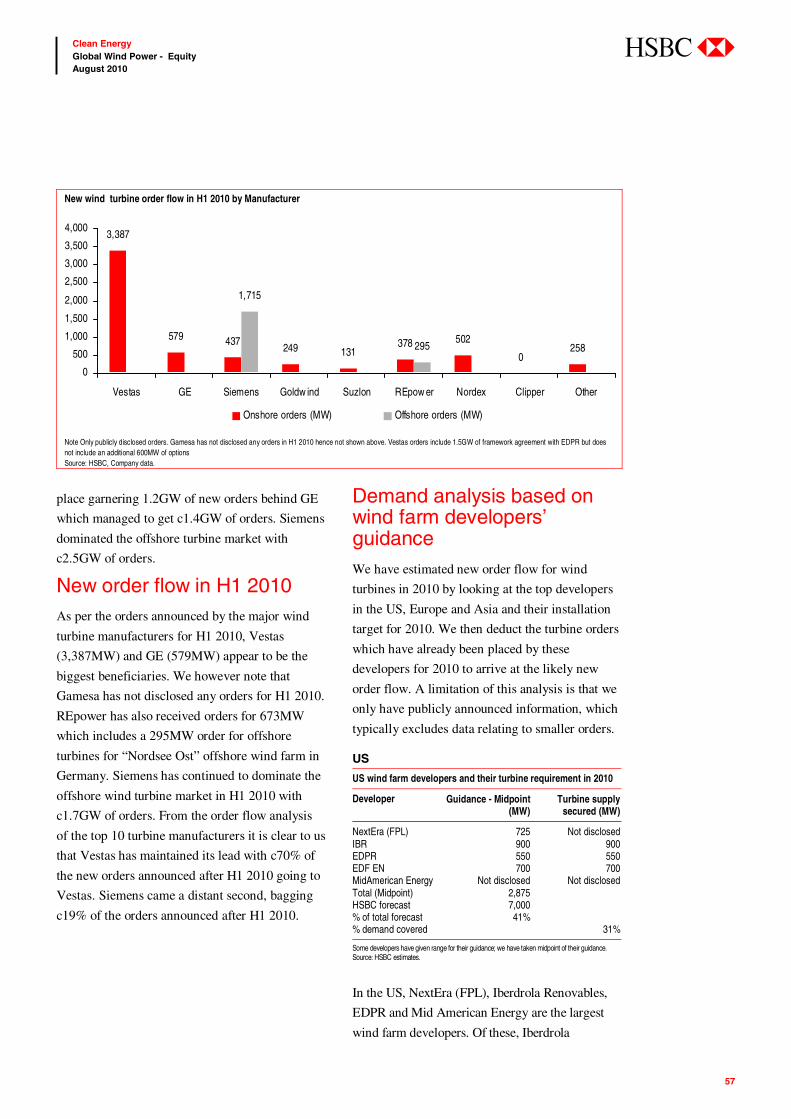
57
Clean Energy Global Wind Power - Equity August 2010
abc
place garnering 1.2GW of new orders behind GE
which managed to get c1.4GW of orders. Siemens
dominated the offshore turbine market with
c2.5GW of orders.
New order flow in H1 2010 As per the orders announced by the major wind
turbine manufacturers for H1 2010, Vestas
(3,387MW) and GE (579MW) appear to be the
biggest beneficiaries. We however note that
Gamesa has not disclosed any orders for H1 2010.
REpower has also received orders for 673MW
which includes a 295MW order for offshore
turbines for “Nordsee Ost” offshore wind farm in
Germany. Siemens has continued to dominate the
offshore wind turbine market in H1 2010 with
c1.7GW of orders. From the order flow analysis
of the top 10 turbine manufacturers it is clear to us
that Vestas has maintained its lead with c70% of
the new orders announced after H1 2010 going to
Vestas. Siemens came a distant second, bagging
c19% of the orders announced after H1 2010.
Demand analysis based on wind farm developers’ guidance We have estimated new order flow for wind
turbines in 2010 by looking at the top developers
in the US, Europe and Asia and their installation
target for 2010. We then deduct the turbine orders
which have already been placed by these
developers for 2010 to arrive at the likely new
order flow. A limitation of this analysis is that we
only have publicly announced information, which
typically excludes data relating to smaller orders.
US
US wind farm developers and their turbine requirement in 2010
Developer Guidance - Midpoint (MW)
Turbine supply secured (MW)
NextEra (FPL) 725 Not disclosed IBR 900 900 EDPR 550 550 EDF EN 700 700 MidAmerican Energy Not disclosed Not disclosed Total (Midpoint) 2,875 HSBC forecast 7,000 % of total forecast 41% % demand covered 31%
Some developers have given range for their guidance; we have taken midpoint of their guidance. Source: HSBC estimates.
In the US, NextEra (FPL), Iberdrola Renovables,
EDPR and Mid American Energy are the largest
wind farm developers. Of these, Iberdrola
New wind turbine order flow in H1 2010 by Manufacturer
3,387
579 437249 131
378 502
0258
1,715
295
0
500
1,000
1,500
2,000
2,500
3,000
3,500
4,000
Vestas GE Siemens Goldw ind Suzlon REpow er Nordex Clipper Other
Onshore orders (MW) Offshore orders (MW)
Note Only publicly disclosed orders. Gamesa has not disclosed any orders in H1 2010 hence not shown above. Vestas orders include 1.5GW of framework agreement with EDPR but does not include an additional 600MW of options Source: HSBC, Company data.
58
Clean Energy Global Wind Power - Equity August 2010
abc
Renovables has stated that their requirements for
2010 are covered. EDPR had in an earlier
presentation also stated that its turbine needs for
2010 are covered. FPL has said in April 2010 that it
has a development target of 600-850MW in 2010
FPL and Mid American energy have not provided
any details as to their turbine requirement coverage.
EDF-EN, though a relatively smaller developer in
US, had also stated that its turbine requirement is
totally covered for 2010.
Europe
European wind farm developers and their turbine requirement in 2010
Major developers Guidance - Midpoint (MW)
Turbine supply secured (MW)
IBR 900 900 EDPR 550 550 Acciona 600 600 EDF EN 400 400 Total 2,450 2,450 HSBC forecast 9,000 % of total forecast 27% % demand covered 27%
Some developers have given range for their guidance; we have taken midpoint of their guidance. Source: HSBC estimates.
In Europe, Iberdrola Renovables, EDF-EN, EDPR
and Acciona are the major developers. Of these,
Iberdrola Renovables, EDF-EN's turbine need for
2010 is totally covered. EDPR in a presentation
had also stated that its turbine needs for 2010 are
covered. Acciona sources turbines largely
internally.
Spanish Demand in 2010
Gamesa in its Annual Results presentation said
that new turbine demand in 2010 in Spain will be
c1,000MW as the installations are capped at
1,855MW for 2010.
Asia
Chinese wind farm developers and their turbine requirement in 2010
Major developers Guidance - Midpoint (MW)
Turbine supply secured (MW)
China Longyuan 1,600 1,600 China Datang Not disclosed Not disclosed China Huaneng Not disclosed Not disclosed Guohua Not disclosed Not disclosed Beijing Energy Not disclosed Not disclosed HSBC forecast 15,000 % of total forecast 11% % demand covered 11%
Some developers have given range for their guidance; we have taken midpoint of their guidance. Source: HSBC estimates.
There is very low visibility for China, Asia's
largest market with respect to new turbine orders.
We estimate that Chinese installations in 2010
will be c86% of the Asia-Pacific demand
However, most of the supply is by domestic
manufacturers. Vestas and Gamesa had 4.4%
(2008:11%) and 2.0% (2008:8%) market share in
2009 (source: MAKE consulting). Though
estimates for wind turbine installations in China
are high (2010 HSBCe of 15GW), we expect
domestic manufacturers like Sinovel, Goldwind
and Dongfang, Mingyang etc, which supplied
>85% of wind turbine requirements in 2009 (as
per MAKE Consulting), to continue to meet a
large part of this demand leaving little for the
foreign turbine manufacturers.

59
Clean Energy Global Wind Power - Equity August 2010
abc
Wind OEMs – order backlog at the end of each quarter over the last two years (MW)
0
2,000
4,000
6,000
8,000
Q2 08 Q3 08 Q4 08 Q1 09 Q2 09 Q3 09 Q4 09 Q1 10 Q2 10
Vestas Gamesa Suzlon REpow er Clipper Nordex (EURm)
Note: Nordex’s backlog is in EURm not in MW. For Gamesa and Clipper, order backlog is calculated on the basis of adding the new orders announced to the backlog at end of previous quarter and then deducting the MW sold in that quarter. Source: Company data, HSBC

60
Clean Energy Global Wind Power - Equity August 2010
abc
How we value the Wind OEMs Valuation methodology - DCF is our primary tool
Given the difficulties involved in multiple
analysis for a relatively young sector with poor
profitability, we don’t focus primarily on relative
multiple analysis or valuation. We have used DCF
as our primary valuation tool because it is an
absolute valuation methodology.
We have used two slightly different DCF
methodologies – the HSBC four-stage ROIC-
based DCF and a ‘classic’ FCF-based DCF. The
key elements in the HSBC ROIC-based valuation
approach are:
Four-stage cash-flow model: explicit forecast
period; semi-explicit forecast period; fade
period; and terminal period
Full reconciliation of discounted cash-flow
variables with return on invested capital/
weighted average cost of capital approach
WACCs calculated using local-currency long-
bond yields, local-equity-market risk premia,
HSBC-assigned beta values (based on
observed raw betas from Bloomberg)
Common assumption of 28-year DCF period
for all stocks’ returns
Four other key valuation model inputs:
terminal period growth rate in invested
capital; terminal period asset turnover rate;
terminal period pre-tax margin; terminal
period tax rate
Default assumption that terminal ROIC will
not materially deviate from WACC, although
we are prepared to change that assumption
when we think it is right to do so
The classic FCF-based DCF approach
incorporates the following features:
WACC calculations as above
10 years of discounted forecast FCFs
A terminal value calculated using an assumed
terminal growth rate
We convert the fair-value estimates we arrive at
through these methodologies into a fair-value
target price by taking a simple average of the two
prices along and applying either a premium or
discount if necessary.
Valuation
Vestas is trading on a 2011e PE basis of 11.6x, at a discount to
the sector average of 13.5x
EDP Renovaveis is currently trading at the lowest multiples
relative to peers on EV/EBITDA for 2010e-12e
PEG ratio analysis has its limitations since it does not capture the
medium- to long-term growth prospects of the wind sector

61
Clean Energy Global Wind Power - Equity August 2010
abc
Assignation of ratings
The HSBC Equity Research methodology calls
for allocating hurdle rates to establish ratings.
They are based on the local cost of equity for any
given stock plus a volatility band. That band is +/-
5 percentage points for stocks defined as not
volatile and +/- 10 percentage points for stocks
defined by HSBC as volatile.
The stocks covered have a volatility indicator, as
defined by our Quants team. That is not
surprising, given the sector’s volatile performance
and the lack of history for most of the stocks.
For example, for an Indian stock such as Suzlon,
we calculate the hurdle rate as follows: we
calculate the Indian cost of equity is 11.0%. The
stock is considered volatile, so this translates into
a Neutral band of +1.0% to +21.0% above the
current share price. Any potential return above or
below that range would give an Overweight (V)
or an Underweight (V) rating. The cost of equity
for UK stocks is 8%, and the cost of equity for
European stocks is 8.5%.
Details on valuation and individual company
assumptions are in the companies section of this
report.
Peer comparison for the OEMs We include a full sector analysis of multiples below.
We note that a full sector comparison is subject to
certain limitations in that it is difficult to undertake a
meaningful peer comparison since the smaller
manufacturers (Suzlon, Nordex and REpower) have
lower profitability than the larger ones.
In terms of 2010e EV/Sales, Clipper is the
cheapest, trading at 0.1x versus the sector average
of 0.6x..
In terms of 2010e EV/Sales Nordex at 0.2x is also
trading at a significant discount to the sector average
of 0.6x.REpower at 0.5x 2010e EV/Sales is also
trading slightly below the sector average of 0.6x
In terms of 2011e PE, Vestas is trading at 11.6x,
at a discount to both Gamesa and REpower at
16.4x and 14.8x respectively. We believe that this
is unjustified and Vestas should trade at a
premium as Vestas is the established market
leader and is more geared to demand recovery.
Relative to the market
The concerns about the fiscal position of some of
the countries in Europe and the regulatory
Wind OEMs: valuation summary
Company Rating Curr. Target Current Pot’l ____EV/Sales _____ ____EV/EBITDA_____ _____HSBC PE ______ _______ PEG ________ Price Price Return 2010e 2011e 2012e 2010e 2011e 2012e 2010e 2011e 2012e 2010e 2011e 2012e
Wind Turbine Manufacturers Vestas OW(V) DKK 300.00 228.00 32% 1.1 0.9 0.8 10.8 6.5 5.4 31.5 11.6 9.2 0.6 0.8 0.9Clipper OW(V) GBP 1.00 0.44 130% 0.1 0.0 0.0 6.2 1.1 0.7 n.m. 12.6 9.2 0.8 0.3 0.2Nordex OW(V) EUR 10.00 6.82 47% 0.2 0.2 0.1 4.1 2.9 1.9 18.5 11.4 7.1 na n.m. n.m.Gamesa N(V) EUR 5.50 5.10 8% 0.7 0.6 0.6 7.8 6.7 6.1 21.4 16.4 12.4 0.7 0.7 0.7REpower N(V) EUR 115.00 98.48 17% 0.5 0.4 0.3 6.0 5.3 4.2 15.8 14.8 12.4 na na n.m.Suzlon UW(V) INR 42.00 49.60 -15% 1.0 0.9 0.8 17.8 12.5 9.3 n.m. n.m. 41.2 0.2 n.m. 0.7Goldwind N/R CNY n/a 18.48 n/a 2.5 1.9 1.5 13.3 9.7 8.2 17.9 14.3 11.2 na na na Mean 0.9 0.7 0.6 9.4 6.4 5.1 21.0 13.5 10.3 0.6 0.6 0.6 Median 0.7 0.6 0.6 7.8 6.5 5.4 18.5 13.5 10.2 0.7 0.7 0.7Component Suppliers Hansen Transmissions
OW(V) GBP 0.95 0.54 76% 1.0 0.8 0.7 10.4 7.2 5.1 n.m. 30.6 10.6 na 0.7 0.2
China High Speed
N/R CNY n/a 16.64 n/a 3.1 2.5 2.1 11.8 9.7 8.0 15.7 12.9 11.9 na na na
Mean 2.1 1.7 1.4 11.1 8.5 6.6 15.7 21.8 11.3 na 0.7 0.2 Median 2.1 1.7 1.4 11.1 8.5 6.6 15.7 21.8 11.3 na 0.7 0.2
Source: Thomson Financial DataStream, HSBC. Prices as on 25 August 2010 Thomson Financial DataStream for estimates for companies not covered Suzlon 2012e PE excluded in calculating Mean and Median

62
Clean Energy Global Wind Power - Equity August 2010
abc
uncertainty in the US over the clean energy
legislation have led to the wider sell off equities
globally. The share prices of all wind turbine
manufacturers under our coverage have declined
YTD and have under-performed their respective
local markets as in the chart below.
Although all the wind turbine manufacturers share
prices have fallen, smaller players have borne the
brunt of the fall. Vestas and Gamesa, the larger
players, have fallen by considerably less than the
smaller players like Clipper and Nordex. Clipper
has fallen by more than 50% YTD.
Wind OEMs versus Capital Goods
The wind OEMs are trading relatively cheaper
than the Capital Goods sector in terms of
EV/Sales multiples for the forecast period 2010e-
12e. On 2010e, wind OEMs are trading at
EV/Sales of 0.6x versus Capital Goods at 1.1x, a
discount of c43%.
The wind OEMs are currently trading at a higher
sector average of 21.8x on 2010e PE compared to
sector average of 16.7x for the capital goods
sector. However, the wind OEMs are trading at
lower PEG 2010e multiple (0.6x) compared to the
capital goods sector (1.1x). This is due to the
much high growth potential offered by the wind
OEMs compared to the capital goods sector.
In terms of 2010e P/BV, the wind OEMs are
trading at a lower multiple of 1.3x versus 2.9x for
the capital goods sector, a discount of c56%,
again highlighting the fact that the sector has
witnessed a dramatic sell-off primarily caused by
the regulatory uncertainty in Europe and the US,
the two biggest wind markets, and the
deteriorating order book position of wind OEMs.
Thus, though wind OEMs may appear to be a bit
expensive in terms of PE multiples, considering
their higher growth profile and the intrinsic value
as determined by P/BV, they are attractive relative
to the capital goods sector, in our view.
Wind turbine manufacturers – price relative chart of each stock relative to its local market since the beginning of January 2010
-60%
-50%
-40%
-30%
-20%
-10%
0%
10%
Apr-10 May -10 Jun-10 Jul-10 Aug-10
GAM/MADRIDI VWS/DKKFXXIN CWP/FTAIM10 SZE/IBOMSENRPW/SDAXIDZ NDX1/MDAXIDX
Source: Thomson DataStream

63
Clean Energy Global Wind Power - Equity August 2010
abc
Wind OEMs versus Solar Wind OEMs are also looking attractive relative to
the solar sector, in our r view. We believe that
wind companies are at lower regulatory risk as
compared to solar companies as the subsidy
burden in European countries due to solar sector
is much higher vis-à-vis wind. In terms of 2010e
EV/Sales, wind OEMs are trading at c45%
discount to the solar sector. Wind OEMs are also
trading at a 54% and 18% discount to the solar
sector in terms of 2010e PEG and P/BV.
Relative valuation – Wind OEMs versus Capital Goods and Solar Sectors
Rating C’cy Price Price P’tial ______EV/sales ______ ____ EV/EBITDA _____ ________ PE _________ PEG P/BV Target Current return 2010e 2011e 2012e 2010e 2011e 2012e 2010e 2011e 2012e 2010e 2010e
Wind OEMs Vestas OW(V) DKK 300.00228.00 32% 1.1 0.9 0.8 10.8 6.5 5.4 31.5 11.6 9.2 0.6 1.8Clipper OW(V) GBP 1.000.44 130% 0.1 0.0 0.0 6.2 1.1 0.7 n.m. 12.6 9.2 0.8 naNordex OW(V) EUR 10.006.82 47% 0.2 0.2 0.1 4.1 2.9 1.9 18.5 11.4 7.1 na 1.2Gamesa N(V) EUR 5.505.10 8% 0.7 0.6 0.6 7.8 6.7 6.1 21.4 16.4 12.4 0.7 0.8REpower N(V) EUR 115.0098.48 17% 0.5 0.4 0.3 6.0 5.3 4.2 15.8 14.8 12.4 na 1.9Suzlon UW(V) INR 42.0049.60 -15% 1.0 0.9 0.8 17.8 12.5 9.3 n.m. n.m. 41.2 0.2 1.2Hansen Transmissions
OW(V) GBP 0.95 0.54 76% 1.0 0.8 0.7 10.4 7.2 5.1 n.m. 30.6 10.6 na 0.7
Mean 0.6 0.6 0.5 9.0 6.0 4.7 21.8 16.2 10.2 0.6 1.3Median 0.7 0.6 0.6 7.8 6.5 5.1 19.9 13.7 9.9 0.7 1.2Capital Goods Aerospace & Defence 0.8 0.7 0.7 7.0 6.2 5.4 13.5 10.8 9.3 1.5 3.0Appliances 0.4 0.3 0.3 4.5 3.3 2.7 9.2 7.0 6.3 0.4 1.9Building Technology 1.7 1.6 1.4 9.7 8.5 7.4 16.2 14.1 12.6 1.4 3.4Commercial Vehicles 1.1 1.0 0.9 10.2 7.6 6.0 26.1 15.4 12.5 0.6 2.4Diversifieds 1.5 1.3 1.1 12.4 10.3 8.2 20.5 16.2 13.1 0.8 3.2Power Technology 1.1 0.9 0.7 8.9 6.7 5.2 16.4 12.1 10.5 2.6 3.2Production Technology 1.6 1.4 1.2 10.0 8.0 6.9 18.5 14.2 12.1 0.9 3.5Shipbuilding 0.9 1.0 0.9 6.7 7.8 7.0 13.1 14.4 12.3 0.8 2.4Mean 1.1 1.0 0.9 8.7 7.3 6.1 16.7 13.0 11.1 1.1 2.9Median 1.1 1.0 0.9 9.3 7.7 6.4 16.3 14.1 12.2 0.9 3.1Solar Downstream - solar cells/panels manufacture 0.9 0.8 0.7 10.0 7.4 6.0 32.7 22.5 14.6 1.4 1.2Upstream - silicon/wafer production 1.4 1.4 1.4 7.6 7.0 6.6 17.6 17.7 16.2 1.2 1.9Integrated 1.2 1.1 0.9 5.9 5.2 4.3 11.2 12.7 9.7 1.2 1.4Mean 1.2 1.1 1.0 8.2 6.8 5.8 21.1 18.7 14.1 1.2 1.5Median 1.1 1.0 0.9 6.7 6.2 5.4 14.9 15.3 12.6 1.0 1.3
Source: HSBC estimates. Price as of 25 August. Suzlon 2012e PE excluded in calculating Mean and Median
64
Clean Energy Global Wind Power - Equity August 2010
abc
How we value Wind farm developers Detailed valuation summaries for each company
can be found in the companies section of this
note, but we summarise our approach here.
Acciona, IBR and EDPR all operate ‘build to
keep’ wind farm development models and
therefore maximise the value derived from their
projects, by owning and operating the wind farms
they develop, as opposed to a ‘build to sell’
model, where the developer chooses to sell the
project to a third party, either as an operational
wind farm or as a fully consented pre-construction
project. EDF EN operates a mixture of both
models – it keeps some (most actually) and sells
some, which helps cash flow and thus financing of
future development projects.
Valuation summary Wind farm developers – valuation summary
IBR EDPR Acciona EDF EN
Operating assets
Installed capacity (MW) 11,010 5,665 5,363 2,145 Value (EURm) 13,935 7,612 7,241 3,523Value per MW (EURm) 1.27 1.34 1.35 1.64
Construction assets
Total capacity (MW) 1,464 1,319 453 318 Value (EURm) 1,440 1,230 434 381Value per MW (EURm) 0.98 0.93 0.96 1.20
Pipeline
Total capacity (MW) 49,901 30,951 23,747 14,919 Pipeline (EURm) 2,475 1,200 1,200 500Value per MW (EUR'000) 50 39 51 34
Source: company data, HSBC estimates
EDF EN and Acciona have higher valued
operating portfolios, on a per MW basis, than IBR
and EDPR, at EUR1.65 and EUR1.35 per MW
respectively, since these companies both use
project finance, with higher leverage (typically,
80% debt, 20% equity (although Acciona’s value
per MW is lower than EDF EN’s due to Acciona’s
Spanish market exposure). IBR and EDPR both
mainly finance their projects using credit from
their parent companies (with an optimal capital
structure of 50% debt, 50% equity).
EDF EN has the highest value of operating
portfolio on a per MW basis (EUR1.64 per MW),
on our estimates. This is due to its higher
exposure (in relative terms) to regions such as
Italy, Greece and the UK, which have favourable
tariff pricing regimes and thus achieve higher
project NPVs.
We estimate that Acciona and IBR have the
highest quality development portfolio at
EUR51,000 per MW and EUR50,000 per MW
respectively. This is due to their projects being at
a more advanced stage than say EDPR’s, which
includes nearly 10GW of ‘prospecting’ rights in
its c31GW development portfolio (also, Acciona
should realise a higher value per MW from its
pipeline due to higher leverage – see above). The
reason for the lower value per MW for EDF EN’s
pipeline is that EDF EN operates a ‘keep some,
sell some’ business model, whereby it builds and
sells some wind farms, rather than a pure ‘build to
keep’ model like IBR, EDPR and Acciona.
SOTP methodology – valuing wind farm assets
In order to calculate the value of the company’s
‘build to keep’ wind assets under this method we
have set up project valuation models to estimate
the DCF-derived NPV per kW for projects in the
wind farm developers main markets, paying
particular attention to unifying assumptions in
those markets where more than one of the wind
farm developers are present (ie US, Spain,
Portugal, UK and France).
We calculate the value per MW of the wind
business in each market by adding together two
components: the investment cost and the NPV
element. We outline these components and related
assumptions below.

65
Clean Energy Global Wind Power - Equity August 2010
abc
Investment cost element: we estimate the
investment costs of existing installations and
projects under construction
NPV element: we forecast the DCF-derived
NPV expected from operating assets. We
perform separate calculations for assets
acquired in 2009 (ie following the impact of
the credit market freeze of September 08) and
those calculated pre-freeze.
For existing assets, we reduce the total of these
two components by 5% pa to reflect the 20 year
life of the wind farms
Assumptions under the ‘build to keep’ approach
Our NPV calculation assumes that the developer
keeps the wind farm, which it has developed from
greenfield, and therefore represents the maximum
NPV available to a developer.
We have made the following additional
assumptions:
1) Wind regime
Our capacity (or load) factor assumptions are
based on historic performance and guidance
provided by the company, where available,
coupled with average capacity factor data for each
market. EDPR, IBR and Acciona provide good
information on the average capacity factors by
market. EDF EN does not provide detailed
historic information on the capacity factors by
market. Thus, when there is overlap between one
of its main markets and one of the remaining three
wind farm developers, we have taken the lower of
the three capacity factors and the average capacity
factor in that market.
2) Tariffs
Our tariff assumptions are based on current tariff
prices/PPA prices in each market coupled with
implied tariff prices deduced from information
provided by the wind farm developers. Again,
EDPR, in particular, and also IBR, provide good
information in this area.
3) Other incentives
We have included other incentives in our model,
ie, Treasury grant, PTC and MACRs (accelerated
tax depreciation) in the US.
4) Financing structure
For EDF EN and Acciona, which adopt a project
financing model for their wind farms, we have
adopted a debt:equity structure of 80:20 for all
markets except the US. In the US, we have
prepared our model based on a tax equity
partnership flip structure except for forecasting
new installations during 2009, where we have
used an 80:20 debt:equity structure and we have
assumed the Treasury grant is received.
For IBR and EDPR, which receive credit from
their parent companies to finance their wind farms
(as well as use of retained profits), we have
adopted an optimal debt:equity structure of 50:50.
This decreased leverage gives rise to a higher
WACC (despite a lower cost of debt) and
therefore reduces project NPVs.
5) Cost of debt
For EDF EN and Acciona, we have assumed a
margin of 300bps over the 10 year EURO mid
swap rate for wind farms added in 2009 and
100bps for wind farms added prior to that. The
large difference in margin is due to the impact of
the credit freeze of September 2008.
We have assumed lower debt margins for EDPR
and IBR, which receive cheaper credit from their
parent companies. For both companies we have
adopted a margin of 250bps in 2009 and 100bps
in 2008.
The impact on cost of debt is lessened as a result of
EURIBOR (and the 10 year EURO mid swap rate)
falling over the period. We have assumed 10 year

66
Clean Energy Global Wind Power - Equity August 2010
abc
EURO mid swap rate of 3.5% for 2009 wind farms
and 4.5% for wind farms installed prior to that.
6) Cost of equity
We have used a beta of 1 in our cost of equity
calculations and have adopted a different cost of
equity depending on the market but have been
consistent for companies that are present in the
same markets.
Using the example of EDF EN and EDPR in
Portugal, we have adopted an equity market risk
premium of 4.5% in both cases for 2008 and
2009, and risk free rates of 4.5% and 4.0% in
2009 and 2008 respectively. This gives rise to a
cost of equity in both cases of 9.0% in 2009 and
8.5% in 2008.
Similar trends apply for other market ie the cost of
equity reduces slightly over 2009 due to a
decrease in the risk free rate (and an EMRP that
remains unchanged).
7) Capital costs
We have observed an upward trend in capital
costs over the period 2006-08 and then we assume
a downward trend thereafter. We have also
assumed different prices in different regions.
Utility wind farm developers – trend in average capital cost (EURm/MW)
1.20
1.25
1.30
1.35
1.40
1.45
2009a 2010e 2011e 2012e 2013e
ANA IBR EDPR EDF EN
Source: HSBC estimates
The drop in capital cost for EDPR is partly due to
a lower price per MW under its framework
agreement with Vestas.
8) Operating costs
These can vary a lot within each region. Broadly,
operating margin for European projects are of the
order 80-85% and US projects are of the order 75-
80%. We have assumed EUR30-40k per kWpa for
the European markets, excluding the UK where
we have assumed EUR55 per kW pa.
DCF limitations
In our view, the DCF methodology has its
limitations for valuing a wind-farm
developer/operator on a high and long-term
growth track, such as the wind farm developers.
The main reasons are:
The high upfront investment costs required
for the company’s wind farms are included
over the DCF period, but the revenue stream
from all wind farms is not fully reflected
(unless a steady state is reached and a suitable
terminal value is used)
DCF does not allow for the different
financing structures of the SPVs that hold
wind farms in different regions
The terminal value in the DCF does not
sufficiently capture the decommissioning of the
wind farm at the end of its UEL (Useful
Economic Life) (about 20 years) and
subsequent re-powering if applicable
DCF does not capture the value of the
pipeline (needs to be added on separately)
We thus only use DCF in valuing the wind turbine
manufacturing business and not the wind farm
development and other renewable business.

67
Clean Energy Global Wind Power - Equity August 2010
abc
Peer comparison for the Developers We expect the utility wind farm developers to
receive a steady flow of income on their
renewable assets over the next 20 years or so. The
return on these assets is fairly predictable: the
revenue stream is determined largely by fixed
government incentives on tariffs or Power
Purchase Agreements (PPAs) over the life of the
renewable asset. In the case of wind assets, this is
coupled with wind measurements, which can be
predicted within reasonable error bounds from
year to year. Thus, their renewable assets are
reasonably easy to value.
Relative to fair value of renewable assets
Amongst the wind farm developers we cover,
Acciona, EDPR and IBR all operate a build-to-
keep business model (ie develop, build, own and
operate their wind farms). Acciona and EDPR are
trading below the fair value of their operating plus
construction renewable assets, which we calculate
are worth EUR69.4 and EUR5.8 per share,
compared to their current share prices of EUR60.7
and EUR4.3 respectively. IBR, on the other hand,
is trading at par to the fair value of its operating
plus construction renewable assets, which we
calculate are worth EUR2.5 per share (current
share price is EUR2.52). However, we believe
this is more because investors are attributing some
value to IBR’s non-renewable businesses (gas
storage, thermal and energy management.
In all cases, no value seems to be attributed to
future growth in the renewable business of any of
the three wind farm developers.
The discount of the current share price to the fair
value of assets becomes even more pronounced in
the case of Acciona, if we include the value of its
other business units (construction, real estate,
concessions, water and environmental services,
wine and fund management), which we do not
currently include in our valuation.
Relative to EV per MW of operational wind assets
Wind farm developers – relative valuation EV per MW (operational wind assets) (as close of 25 August 2010)
Company Currency EV (m) MW EV/MW
IBR EUR 16,329 11,010 1.48 ANA EUR 9,513 5,363 1.77 EDPR EUR 7,556 5,665 1.33 EDF EN EUR 5,617 2,145 2.62 Terna EUR 345 142 2.43 Infigen EUR 1,176 1,726 0.68 Plambeck EUR 124 788 0.16 Enertad EUR 446 208.4 2.14 Greentech EUR 132 68 1.94
Source: company data, Bloomberg , HSBC
We compare the wind farm developers on their
indicative EV/MW valuation multiple. Amongst
the top wind farm developers (ANA, IBR, EDPR
and EDF EN), EDPR is the cheapest on a per MW
basis with an EV/MW of 1.33x while EDF EN is
trading at the highest multiple of 2.62x. The
reason for this is two fold: firstly, EDF EN
operates a project finance based financing model,
thus its projects are more highly levered than IBR
and EDPR and the equity return is therefore
higher; secondly, it sells some its wind farms,
which creates value that is included in the EV (but
not the MW kept).
Comparison of valuation of renewable assets (EUR/share)
Valuation (EUR/share) Acciona EDPR IBR*
Operating assets 116.7 8.7 3.3 Construction assets 7.0 1.4 0.3 Other renewables 36.8 0 0.2 Less: Net Debt 91.1 4.3 1.4 Equity value per (renewables) 69.4 5.8 2.5 Current share price (as close of 25 August 2010)
60.7 4.3 2.5
% (discount)/premium to equity value of operating/construction assets
(13%) (25%) 0%
Pipeline valuation 19.3 1.4 0.6 Total equity value (renewables) 88.7 7.2 3.1
% (discount)/premium to current share price
46% 66% 23%
*Note: We have possibly underestimated the equity value of IBR’s operating/construction assets since we have not excluded the component of net debt relating to non-renewable assets (as the company does not provide a split). Source: HSBC estimates
68
Clean Energy Global Wind Power - Equity August 2010
abc
However, this is only a limited exercise for the
following reasons:
The business model of the wind farm
developers is not identical for all, some
operate ‘build-to-keep’ while some operate
‘keep some – sell some’ business model
We take only the operational wind farm assets
and not the under construction wind assets
and other renewable assets (operational and
under construction)
Companies do not provide a split of net debt
by business division meaning while we only
take the wind operational assets, the net debt
is for the group level (clearly some portion of
net debt should be associated to other
business segments as well, for the instance
solar division of EDF EN). For Acciona,
which provides a split of net debt by business
segments, we have taken net debt associated
with only the Energy division
We take the last reported Net Debt and
operational MW to calculate the EV
Utility wind farm developers – relative valuation (Prices as close of 25 August 2010)
Rating Currency Target Current P’tial ____ EV/Sales ____ ___ EV/EBITDA ___ ______ PE _______ ______PEG_______ P/BV price price return 2010e 2011e 2012e 2010e 2011e 2012e 2010e 2011e 2012e 2010e 2011e 2012e 2010e
IBR OW(V) EUR 3.5 2.5 39% 6.2 5.8 5.3 10.0 9.1 8.1 23.8 20.6 17.2 1.4 1.4 1.2 0.8Terna Energy OW(V) EUR 5.0 3.4 46% 6.8 6.1 4.4 17.4 12.0 7.3 31.9 18.0 9.9 N/A N/A n.m. 1.0EDP R OW(V) EUR 7.3 4.3 67% 6.8 6.3 5.8 8.4 7.7 7.0 30.8 26.1 19.7 1.3 1.0 0.8 0.7Acciona OW(V) EUR 94.0 60.7 55% 1.6 1.6 1.6 9.0 8.1 7.4 18.4 14.5 12.1 1.0 1.0 1.1 0.7EDF EN N(V) EUR 34.0 30.9 10% 4.7 4.6 4.4 14.5 12.8 11.8 21.9 16.8 13.5 0.9 1.0 1.1 1.7Infigen Energy NR AUD N/A 0.7 N/A 8.6 7.0 1.3 14.0 10.5 1.9 n.m. 65.0 N/A N/A N/A N/A 0.6PNE Wind NR EUR N/A 1.8 N/A 1.2 0.9 0.7 8.2 7.2 5.6 12.0 7.8 N/A N/A N/A N/A 1.2ERG Renewable NR EUR N/A 0.8 N/A 10.1 5.8 5.1 18.9 8.5 7.4 n.m. 78.5 N/A N/A N/A N/A 1.1Greentech Energy NR DKK N/A 11.3 N/A 6.7 6.5 5.1 12.2 10.4 7.8 94.2 14.7 N/A N/A N/A N/A 0.3 Mean 5.9 4.9 3.7 12.5 9.6 7.1 33.3 29.1 14.5 1.2 1.1 1.0 0.9 Median 6.7 5.8 4.4 12.2 9.1 7.4 23.8 18.0 13.5 1.1 1.0 1.1 0.8
*Note: PNE Wind was earlier known as Plambeck Neue Energia and ERG Renewable was earlier known as Enertad Source: HSBC estimates, Thomson Financial DataStream (for stocks not covered by HSBC)

69
Clean Energy Global Wind Power - Equity August 2010
abc
Relative to the market
The sovereign debt risk in Europe and in particular
Southern Europe has led to wider sell off in
equities globally. The share prices of all wind farm
developers under our coverage are down some
15%-35% each since the beginning of January
2010 and have under-performed their respective
local markets as shown in the chart below (except
EDF EN which has outperformed its local market
by 6% since beginning of Jan. 2010).
Utility wind farm developers – price relative chart of each stock relative to its local market since the beginning of January 2010
-25%
-20%
-15%
-10%
-5%
0%
5%
10%
15%
20%
Jan-10 Feb-10 Mar-10 Apr-10 May -10 Jun-10 Jul-10 Aug-10
ANA/IBEX35 IBR/IBEX35 EDPR/DJPORTL EEN/EN1FRU1
Source: Thomson DataStream

70
Clean Energy Global Wind Power - Equity August 2010
abc
Wind farm developers versus European electric utilities
The wind farm developers are currently trading at
the sector average of 23.7x on 2010e PE
compared to sector average of 11x for the
European utilities. However, the utilities sector is
trading at higher PEG 2010e multiple (2.1x)
compared to the wind farm developers sector (1x).
This is due to the much high growth potential
offered by the wind farm developers sector
compared to the utilities sector.
On 2010e P/BV, the wind developers are trading
at sector average of 1x which is attractive
compared to the sector average of 1.7x for
European utilities. This again highlights the fact
that the wind developer sector has witnessed
dramatic sell-off primarily caused by the
regulatory uncertainty in Spain and US, the two
biggest wind markets.
Amongst the wind developers, Acciona is
cheapest on all multiples compared to its peers
(except EV/EBITDA where EDPR is cheapest).
This is mainly due to its large exposure to Spanish
construction and real estate market which has
caused weakness in its share price, which we
consider unjustified. We believe that as Acciona
increases its exposure to renewable energy, the
stock will experience a re-rating.
EDF EN is trading at 3x 2010e EV/MW multiple
which is highest in its peer group. This is due to
the fact that EDF EN has been least sold-out on
the back of its well-diversified portfolio which has
considerably reduced the regulatory uncertainty
that is being faced by IBR, EDPR and Acciona,
all of which are have large exposure to Spain, in
terms of operating assets.
.
Relative valuation – Wind farm developers versus European Utilities (Price as of close of 25th Aug. 2010)
Rating Currency Target Current _____ EV/sales ______ ____ EV/EBITDA ______ _________PE _________ PEG P/BV EV/MW price price 2010e 2011e 2012e 2010e 2011e 2012e 2010e 2011e 2012e 2010e 2010e 2010e
Wind farm developer
IBR OW(V) EUR 3.50 2.52 6.2 5.8 5.3 10.0 9.1 8.1 23.8 20.6 17.2 1.3 0.8 1.4EDP R OW(V) EUR 7.25 4.33 6.8 6.3 5.8 8.4 7.7 7.0 30.8 26.1 19.7 1.2 0.7 1.1EDF EN OW(V) EUR 34.00 30.89 4.7 4.6 4.4 14.5 12.8 11.8 21.9 16.8 13.5 0.8 1.7 3.0Acciona OW(V) EUR 94.00 60.70 1.6 1.6 1.6 9.0 8.1 7.4 18.4 14.5 12.1 0.8 0.7 1.7Mean 4.8 4.6 4.3 10.5 9.4 8.6 23.7 19.5 15.6 1.0 1.0 1.8Median 5.5 5.2 4.9 9.5 8.6 7.8 22.9 18.7 15.3 1.0 0.8 1.6 Utilities CEZ a.s. UW CZK 900.00 820.00 2.9 3.0 3.0 6.5 6.7 6.8 9.4 9.4 9.1 4.8 2.0 1.6Drax Group OW GBP 4.50 3.86 1.0 0.9 0.9 3.7 4.1 4.2 6.5 7.1 7.3 n.m. 1.2 0.4Fortum OYJ OW EUR 21.00 17.96 3.5 3.4 3.2 8.1 8.0 7.5 11.4 11.3 10.6 2.9 1.9 1.4Verbund UW EUR 22.00 27.79 3.1 3.0 2.7 9.2 8.5 7.8 17.4 16.7 15.2 2.4 2.4 1.2International Power
N(V) GBP 4.00 3.67 2.1 1.9 1.8 8.4 7.5 6.7 16.6 13.7 11.7 0.9 1.1 1.6
EDF UW EUR 39.00 31.48 1.8 1.8 1.7 7.2 6.8 6.6 16.9 14.7 13.7 1.5 2.0 1.3ENEL OW EUR 4.50 3.68 1.5 1.4 1.4 6.1 5.9 5.6 7.9 7.8 7.3 1.9 1.0 1.1EDP OW EUR 3.20 2.41 1.8 1.8 1.7 6.8 6.7 6.3 8.3 7.8 7.1 1.1 1.2 1.2Iberdrola N EUR 6.26 5.28 2.2 2.1 2.0 8.1 7.7 7.2 10.9 10.0 9.1 1.2 1.0 1.4Enagas OW EUR 16.00 13.68 6.5 6.2 5.9 8.3 7.9 7.5 10.1 9.8 9.2 2.1 1.9 n/aGas Natural OW EUR 14.10 11.63 2.0 1.9 1.7 6.7 6.3 5.9 8.3 7.3 7.0 0.9 0.9 2.0GDF Suez N EUR 28.00 24.30 1.2 1.2 1.1 7.4 6.2 5.8 12.7 11.5 10.1 1.1 0.9 1.8Centrica OW GBP 3.50 3.25 0.8 0.8 0.8 6.0 5.7 5.5 13.0 12.3 11.4 2.0 3.5 3.0E.ON N EUR 25.00 22.10 0.8 0.8 0.8 5.5 5.4 5.1 8.2 9.2 8.6 n.m. 0.9 1.0RWE UW EUR 52.00 52.26 1.0 1.0 1.0 5.5 5.6 5.5 7.4 8.8 8.6 n.m. 1.8 1.1SSE N GBP 12.20 11.26 0.9 0.9 0.9 8.5 8.7 8.3 10.4 10.0 9.9 4.2 3.1 1.7Mean 2.1 2.0 1.9 7.0 6.7 6.4 11.0 10.5 9.7 2.1 1.7 1.5Median 1.8 1.8 1.7 7.0 6.7 6.5 10.2 9.9 9.2 1.9 1.5 1.4
Source: HSBC estimates

71
Clean Energy Global Wind Power - Equity August 2010
abc
Qualitative scorecard We have developed a performance scorecard for
the wind farm developers. EDPR is our highest
conviction idea and Acciona is second as per this
scorecard (see table on next page).
Methodology
Our two-stage scorecard takes into account a) a
performance metric (comprising of various
qualitative and quantitative criteria) and b)
potential return on the stock.
At the first stage, the quantitative criteria include
the portfolio size, grants/allocations received,
electricity pricing risk/ regulatory risk, financial
strength, and the future growth profile. For the
qualitative criteria, we include strategic targets/
quality of management and the level of disclosure
provided by a particular company.
To the ranks of each company on each criterion,
we then apply different weights (which we assign
based on their relative importance to the
company’s performance, in our view) and arrive
at first-stage score.
The second-stage ranks the stocks on the potential
return offered by a stock and multiplies the rank with
a multiple (10x) to arrive at the second-stage score.
We apply equal weights to the two scores arrived
at the end of each stage and the sum total of the
two weighted score gives us our overall ranking.
The scores are given in descending order (from 6
to 1), meaning the better a company is on a
particular criterion, the higher score it gets. For
example, we believe the level of disclosure is best
for EDPR so it gets a score of 6 on that criterion
while Terna Energy is weakest in disclosures and
hence it gets the lowest score of 1.
Analysis
EDPR and Acciona are our highest conviction
ideas
EDPR provides the best disclosure and is second
best (after IBR) in terms of portfolio size,
financial strength and quality of management. It
also currently provides the most potential return
of the wind farm developers.
Comparing the wind farm developers
EDPR is our highest conviction idea – provides most potential
return
Acciona is second
IBR is third – consistently scores highest on qualitative criteria but
currently offers less potential return
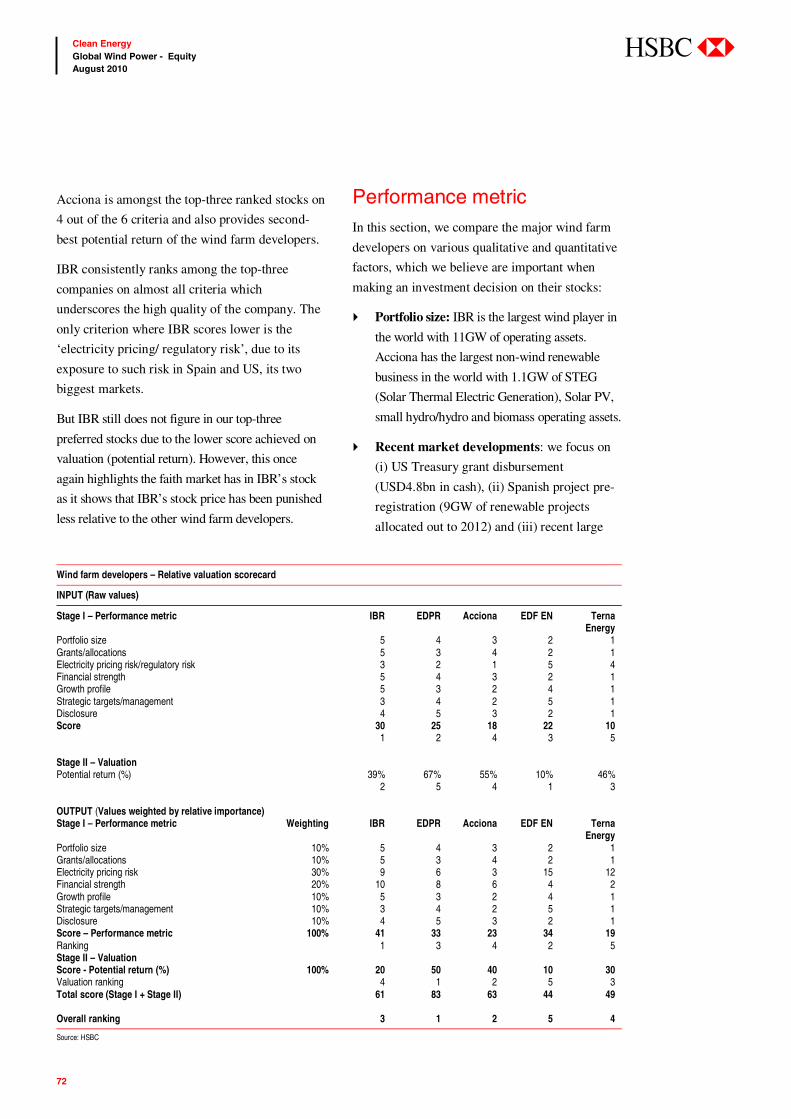
72
Clean Energy Global Wind Power - Equity August 2010
abc
Acciona is amongst the top-three ranked stocks on
4 out of the 6 criteria and also provides second-
best potential return of the wind farm developers.
IBR consistently ranks among the top-three
companies on almost all criteria which
underscores the high quality of the company. The
only criterion where IBR scores lower is the
‘electricity pricing/ regulatory risk’, due to its
exposure to such risk in Spain and US, its two
biggest markets.
But IBR still does not figure in our top-three
preferred stocks due to the lower score achieved on
valuation (potential return). However, this once
again highlights the faith market has in IBR’s stock
as it shows that IBR’s stock price has been punished
less relative to the other wind farm developers.
Performance metric In this section, we compare the major wind farm
developers on various qualitative and quantitative
factors, which we believe are important when
making an investment decision on their stocks:
Portfolio size: IBR is the largest wind player in
the world with 11GW of operating assets.
Acciona has the largest non-wind renewable
business in the world with 1.1GW of STEG
(Solar Thermal Electric Generation), Solar PV,
small hydro/hydro and biomass operating assets.
Recent market developments: we focus on
(i) US Treasury grant disbursement
(USD4.8bn in cash), (ii) Spanish project pre-
registration (9GW of renewable projects
allocated out to 2012) and (iii) recent large
Wind farm developers – Relative valuation scorecard
INPUT (Raw values)
Stage I – Performance metric IBR EDPR Acciona EDF EN Terna Energy
Portfolio size 5 4 3 2 1 Grants/allocations 5 3 4 2 1 Electricity pricing risk/regulatory risk 3 2 1 5 4 Financial strength 5 4 3 2 1 Growth profile 5 3 2 4 1 Strategic targets/management 3 4 2 5 1 Disclosure 4 5 3 2 1 Score 30 25 18 22 10 1 2 4 3 5 Stage II – Valuation Potential return (%) 39% 67% 55% 10% 46% 2 5 4 1 3 OUTPUT (Values weighted by relative importance) Stage I – Performance metric Weighting IBR EDPR Acciona EDF EN Terna
Energy Portfolio size 10% 5 4 3 2 1 Grants/allocations 10% 5 3 4 2 1 Electricity pricing risk 30% 9 6 3 15 12 Financial strength 20% 10 8 6 4 2 Growth profile 10% 5 3 2 4 1 Strategic targets/management 10% 3 4 2 5 1 Disclosure 10% 4 5 3 2 1 Score – Performance metric 100% 41 33 23 34 19 Ranking 1 3 4 2 5 Stage II – Valuation Score - Potential return (%) 100% 20 50 40 10 30 Valuation ranking 4 1 2 5 3 Total score (Stage I + Stage II) 61 83 63 44 49 Overall ranking 3 1 2 5 4
Source: HSBC
73
Clean Energy Global Wind Power - Equity August 2010
abc
offshore development right allocations in the
UK totalling 32GW (enough to power a
quarter of the UK’s electricity). IBR was a
winner in all three markets.
Electricity pricing risk: how secure are the
wind farm developers’ cash flows? Acciona is
most exposed to electricity prices, with 73%
exposure to Spain (unhedged). IBR and
EDPR are both hedged. EDF EN has no
exposure to Spain.
Financial strength: IBR and EDPR have
strong financial support from their parent
groups, which provide credit for the financing
of nearly all of their wind farms. EDF EN and
Acciona raise project finance, which has
made financing difficult over the last year or
so; however, the project finance market is
now starting to improve.
Growth profile: EDPR offers the most
attractive earnings growth with a three year
EPS CAGR of 24% over 2010e-13e. EDF EN
has the best estimated three year EBITDA
CAGR of 21%.
Strategic targets and detailed disclosure:
Information disclosure is good at EDPR and
IBR at all levels. Acciona and EDF EN give
their long-term new installations (wind and
other renewables) as well as financial targets
but limited or no information on capacity
factors and wind tariffs across geographies.
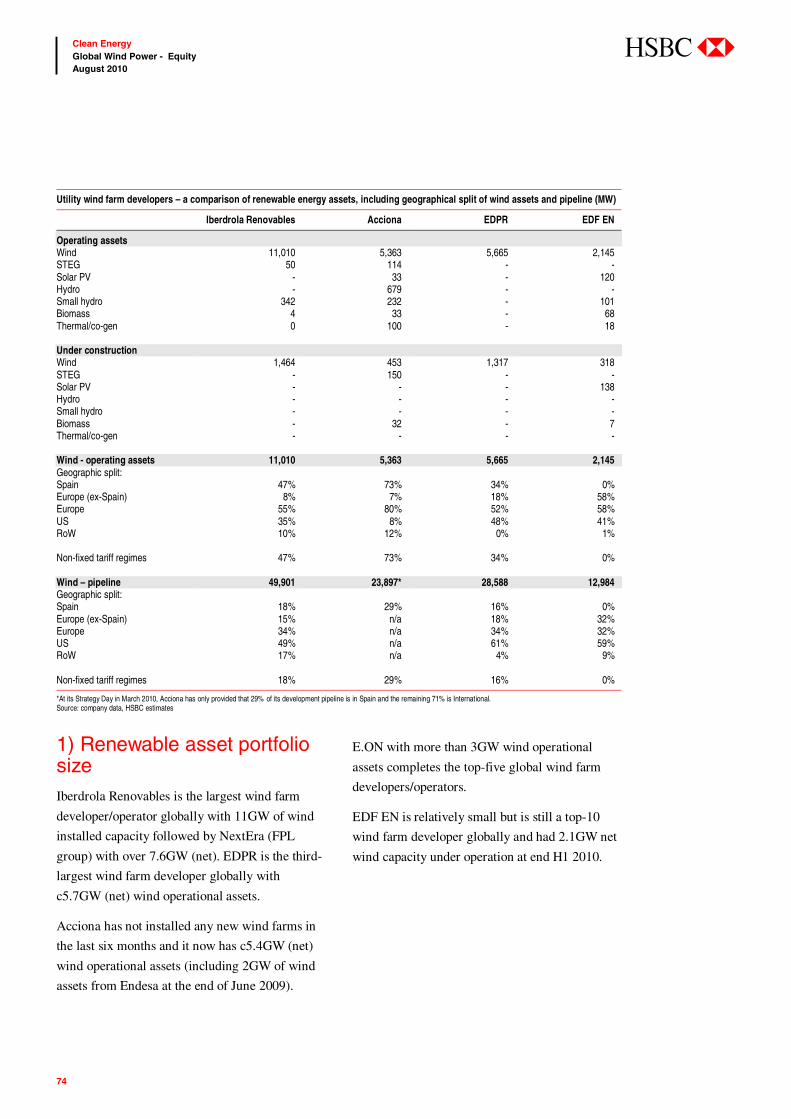
74
Clean Energy Global Wind Power - Equity August 2010
abc
1) Renewable asset portfolio size Iberdrola Renovables is the largest wind farm
developer/operator globally with 11GW of wind
installed capacity followed by NextEra (FPL
group) with over 7.6GW (net). EDPR is the third-
largest wind farm developer globally with
c5.7GW (net) wind operational assets.
Acciona has not installed any new wind farms in
the last six months and it now has c5.4GW (net)
wind operational assets (including 2GW of wind
assets from Endesa at the end of June 2009).
E.ON with more than 3GW wind operational
assets completes the top-five global wind farm
developers/operators.
EDF EN is relatively small but is still a top-10
wind farm developer globally and had 2.1GW net
wind capacity under operation at end H1 2010.
Utility wind farm developers – a comparison of renewable energy assets, including geographical split of wind assets and pipeline (MW)
Iberdrola Renovables Acciona EDPR EDF EN
Operating assets Wind 11,010 5,363 5,665 2,145 STEG 50 114 - - Solar PV - 33 - 120 Hydro - 679 - - Small hydro 342 232 - 101 Biomass 4 33 - 68 Thermal/co-gen 0 100 - 18 Under construction Wind 1,464 453 1,317 318 STEG - 150 - - Solar PV - - - 138 Hydro - - - - Small hydro - - - - Biomass - 32 - 7 Thermal/co-gen - - - - Wind - operating assets 11,010 5,363 5,665 2,145 Geographic split: Spain 47% 73% 34% 0% Europe (ex-Spain) 8% 7% 18% 58% Europe 55% 80% 52% 58% US 35% 8% 48% 41% RoW 10% 12% 0% 1% Non-fixed tariff regimes 47% 73% 34% 0% Wind – pipeline 49,901 23,897* 28,588 12,984 Geographic split: Spain 18% 29% 16% 0% Europe (ex-Spain) 15% n/a 18% 32% Europe 34% n/a 34% 32% US 49% n/a 61% 59% RoW 17% n/a 4% 9% Non-fixed tariff regimes 18% 29% 16% 0%
*At its Strategy Day in March 2010, Acciona has only provided that 29% of its development pipeline is in Spain and the remaining 71% is International. Source: company data, HSBC estimates
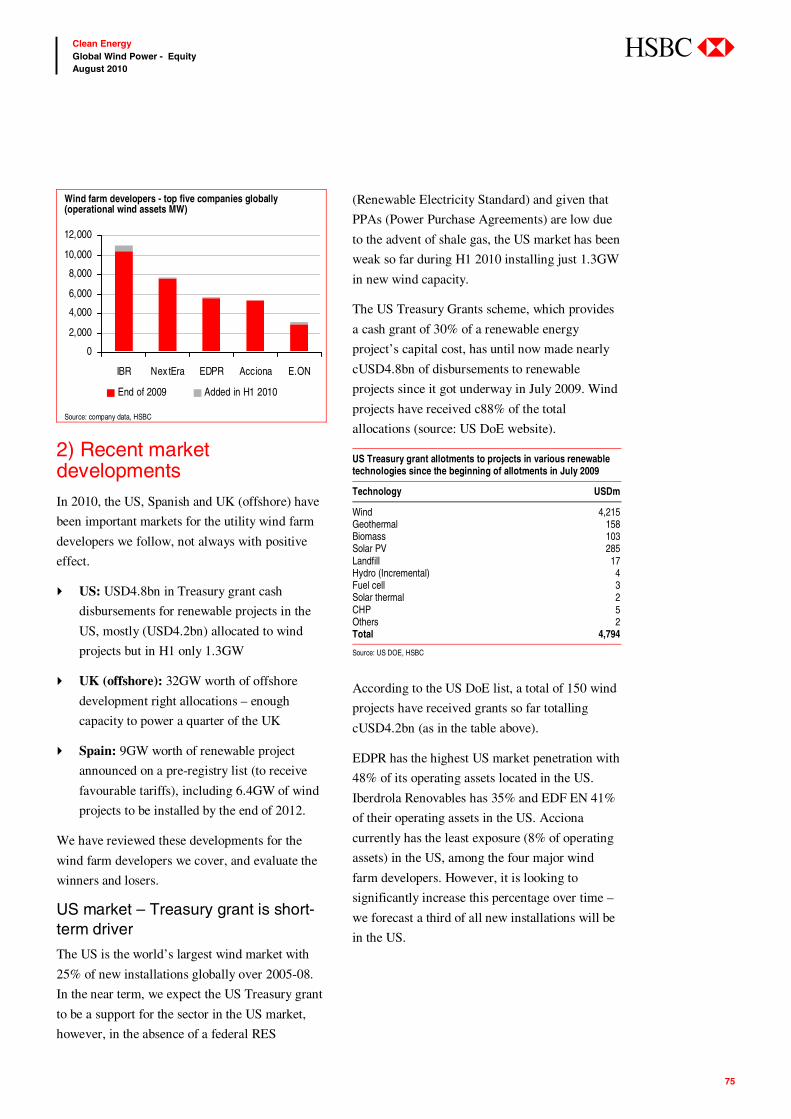
75
Clean Energy Global Wind Power - Equity August 2010
abc
Wind farm developers - top five companies globally (operational wind assets MW)
0
2,000
4,000
6,000
8,000
10,000
12,000
IBR Nex tEra EDPR Acciona E.ON
End of 2009 Added in H1 2010
Source: company data, HSBC
2) Recent market developments In 2010, the US, Spanish and UK (offshore) have
been important markets for the utility wind farm
developers we follow, not always with positive
effect.
US: USD4.8bn in Treasury grant cash
disbursements for renewable projects in the
US, mostly (USD4.2bn) allocated to wind
projects but in H1 only 1.3GW
UK (offshore): 32GW worth of offshore
development right allocations – enough
capacity to power a quarter of the UK
Spain: 9GW worth of renewable project
announced on a pre-registry list (to receive
favourable tariffs), including 6.4GW of wind
projects to be installed by the end of 2012.
We have reviewed these developments for the
wind farm developers we cover, and evaluate the
winners and losers.
US market – Treasury grant is short-term driver
The US is the world’s largest wind market with
25% of new installations globally over 2005-08.
In the near term, we expect the US Treasury grant
to be a support for the sector in the US market,
however, in the absence of a federal RES
(Renewable Electricity Standard) and given that
PPAs (Power Purchase Agreements) are low due
to the advent of shale gas, the US market has been
weak so far during H1 2010 installing just 1.3GW
in new wind capacity.
The US Treasury Grants scheme, which provides
a cash grant of 30% of a renewable energy
project’s capital cost, has until now made nearly
cUSD4.8bn of disbursements to renewable
projects since it got underway in July 2009. Wind
projects have received c88% of the total
allocations (source: US DoE website).
US Treasury grant allotments to projects in various renewable technologies since the beginning of allotments in July 2009
Technology USDm
Wind 4,215 Geothermal 158 Biomass 103 Solar PV 285 Landfill 17 Hydro (Incremental) 4 Fuel cell 3 Solar thermal 2 CHP 5 Others 2 Total 4,794
Source: US DOE, HSBC
According to the US DoE list, a total of 150 wind
projects have received grants so far totalling
cUSD4.2bn (as in the table above).
EDPR has the highest US market penetration with
48% of its operating assets located in the US.
Iberdrola Renovables has 35% and EDF EN 41%
of their operating assets in the US. Acciona
currently has the least exposure (8% of operating
assets) in the US, among the four major wind
farm developers. However, it is looking to
significantly increase this percentage over time –
we forecast a third of all new installations will be
in the US.
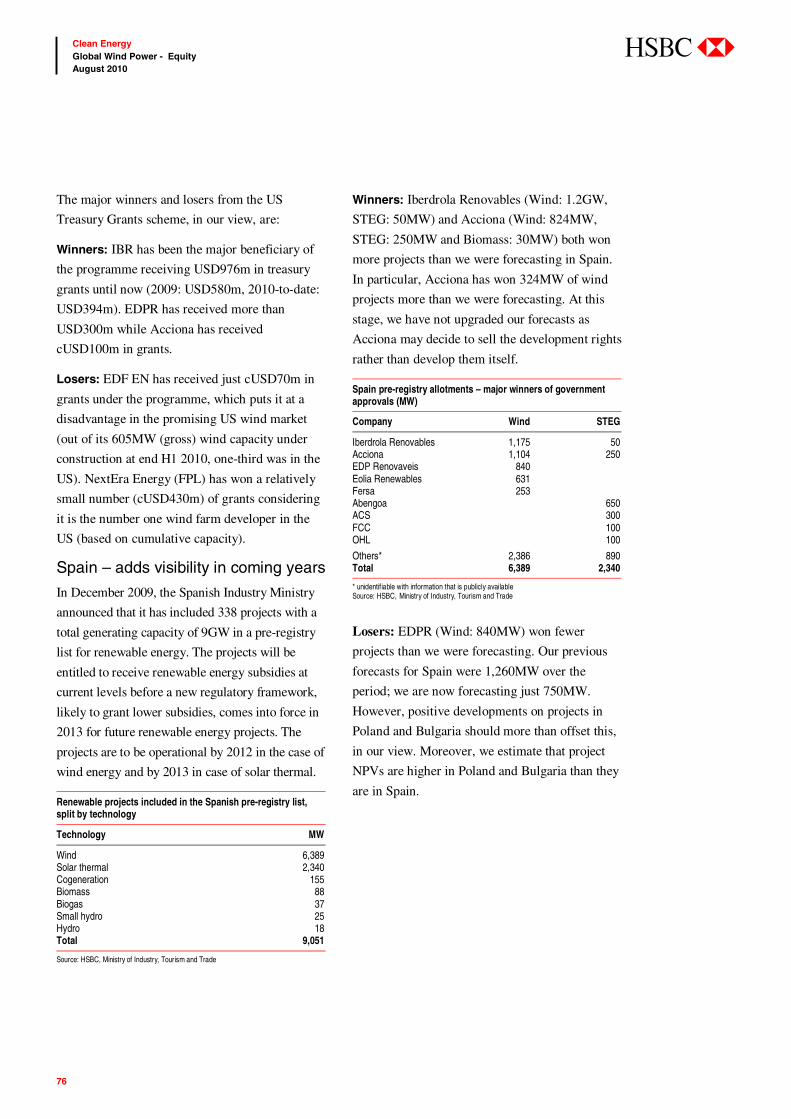
76
Clean Energy Global Wind Power - Equity August 2010
abc
The major winners and losers from the US
Treasury Grants scheme, in our view, are:
Winners: IBR has been the major beneficiary of
the programme receiving USD976m in treasury
grants until now (2009: USD580m, 2010-to-date:
USD394m). EDPR has received more than
USD300m while Acciona has received
cUSD100m in grants.
Losers: EDF EN has received just cUSD70m in
grants under the programme, which puts it at a
disadvantage in the promising US wind market
(out of its 605MW (gross) wind capacity under
construction at end H1 2010, one-third was in the
US). NextEra Energy (FPL) has won a relatively
small number (cUSD430m) of grants considering
it is the number one wind farm developer in the
US (based on cumulative capacity).
Spain – adds visibility in coming years
In December 2009, the Spanish Industry Ministry
announced that it has included 338 projects with a
total generating capacity of 9GW in a pre-registry
list for renewable energy. The projects will be
entitled to receive renewable energy subsidies at
current levels before a new regulatory framework,
likely to grant lower subsidies, comes into force in
2013 for future renewable energy projects. The
projects are to be operational by 2012 in the case of
wind energy and by 2013 in case of solar thermal.
Renewable projects included in the Spanish pre-registry list, split by technology
Technology MW
Wind 6,389 Solar thermal 2,340 Cogeneration 155 Biomass 88 Biogas 37 Small hydro 25 Hydro 18 Total 9,051
Source: HSBC, Ministry of Industry, Tourism and Trade
Winners: Iberdrola Renovables (Wind: 1.2GW,
STEG: 50MW) and Acciona (Wind: 824MW,
STEG: 250MW and Biomass: 30MW) both won
more projects than we were forecasting in Spain.
In particular, Acciona has won 324MW of wind
projects more than we were forecasting. At this
stage, we have not upgraded our forecasts as
Acciona may decide to sell the development rights
rather than develop them itself.
Spain pre-registry allotments – major winners of government approvals (MW)
Company Wind STEG
Iberdrola Renovables 1,175 50 Acciona 1,104 250 EDP Renovaveis 840 Eolia Renewables 631 Fersa 253 Abengoa 650 ACS 300 FCC 100 OHL 100
Others* 2,386 890 Total 6,389 2,340
* unidentifiable with information that is publicly available Source: HSBC, Ministry of Industry, Tourism and Trade
Losers: EDPR (Wind: 840MW) won fewer
projects than we were forecasting. Our previous
forecasts for Spain were 1,260MW over the
period; we are now forecasting just 750MW.
However, positive developments on projects in
Poland and Bulgaria should more than offset this,
in our view. Moreover, we estimate that project
NPVs are higher in Poland and Bulgaria than they
are in Spain.
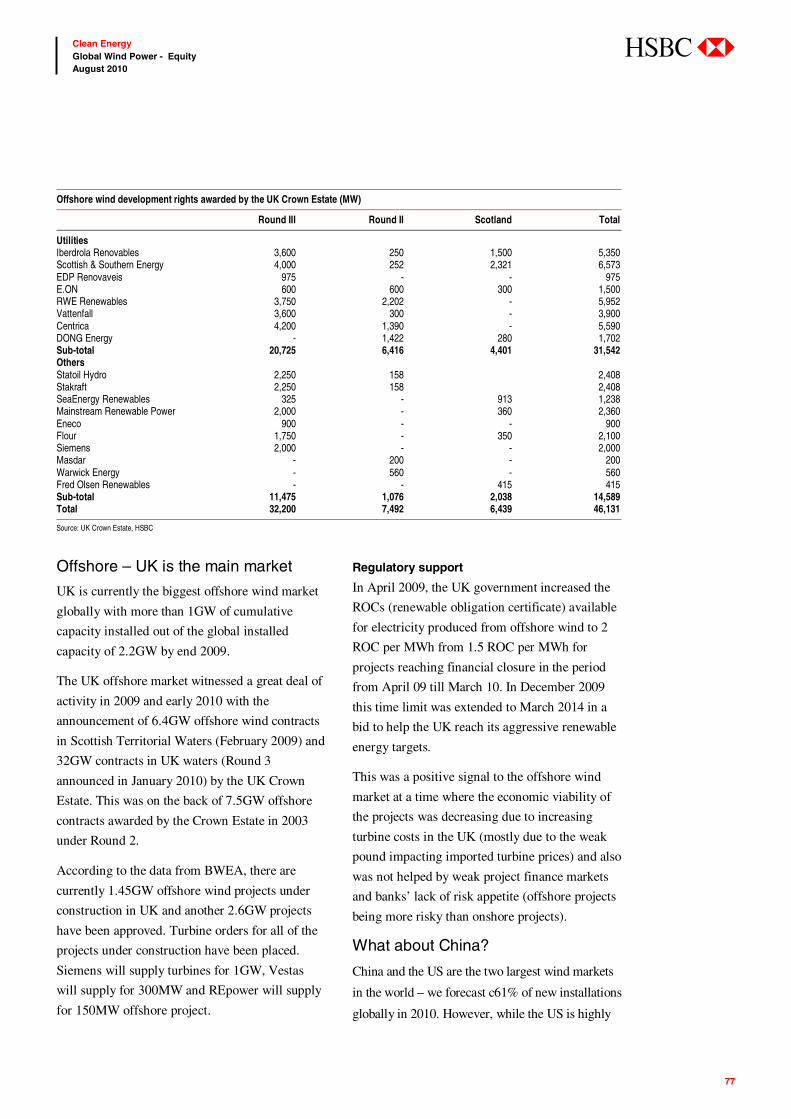
77
Clean Energy Global Wind Power - Equity August 2010
abc
Offshore – UK is the main market
UK is currently the biggest offshore wind market
globally with more than 1GW of cumulative
capacity installed out of the global installed
capacity of 2.2GW by end 2009.
The UK offshore market witnessed a great deal of
activity in 2009 and early 2010 with the
announcement of 6.4GW offshore wind contracts
in Scottish Territorial Waters (February 2009) and
32GW contracts in UK waters (Round 3
announced in January 2010) by the UK Crown
Estate. This was on the back of 7.5GW offshore
contracts awarded by the Crown Estate in 2003
under Round 2.
According to the data from BWEA, there are
currently 1.45GW offshore wind projects under
construction in UK and another 2.6GW projects
have been approved. Turbine orders for all of the
projects under construction have been placed.
Siemens will supply turbines for 1GW, Vestas
will supply for 300MW and REpower will supply
for 150MW offshore project.
Regulatory support
In April 2009, the UK government increased the
ROCs (renewable obligation certificate) available
for electricity produced from offshore wind to 2
ROC per MWh from 1.5 ROC per MWh for
projects reaching financial closure in the period
from April 09 till March 10. In December 2009
this time limit was extended to March 2014 in a
bid to help the UK reach its aggressive renewable
energy targets.
This was a positive signal to the offshore wind
market at a time where the economic viability of
the projects was decreasing due to increasing
turbine costs in the UK (mostly due to the weak
pound impacting imported turbine prices) and also
was not helped by weak project finance markets
and banks’ lack of risk appetite (offshore projects
being more risky than onshore projects).
What about China?
China and the US are the two largest wind markets
in the world – we forecast c61% of new installations
globally in 2010. However, while the US is highly
Offshore wind development rights awarded by the UK Crown Estate (MW)
Round III Round II Scotland Total
Utilities Iberdrola Renovables 3,600 250 1,500 5,350 Scottish & Southern Energy 4,000 252 2,321 6,573 EDP Renovaveis 975 - - 975 E.ON 600 600 300 1,500 RWE Renewables 3,750 2,202 - 5,952 Vattenfall 3,600 300 - 3,900 Centrica 4,200 1,390 - 5,590 DONG Energy - 1,422 280 1,702 Sub-total 20,725 6,416 4,401 31,542 Others Statoil Hydro 2,250 158 2,408 Stakraft 2,250 158 2,408 SeaEnergy Renewables 325 - 913 1,238 Mainstream Renewable Power 2,000 - 360 2,360 Eneco 900 - - 900 Flour 1,750 - 350 2,100 Siemens 2,000 - - 2,000 Masdar - 200 - 200 Warwick Energy - 560 - 560 Fred Olsen Renewables - - 415 415 Sub-total 11,475 1,076 2,038 14,589 Total 32,200 7,492 6,439 46,131
Source: UK Crown Estate, HSBC
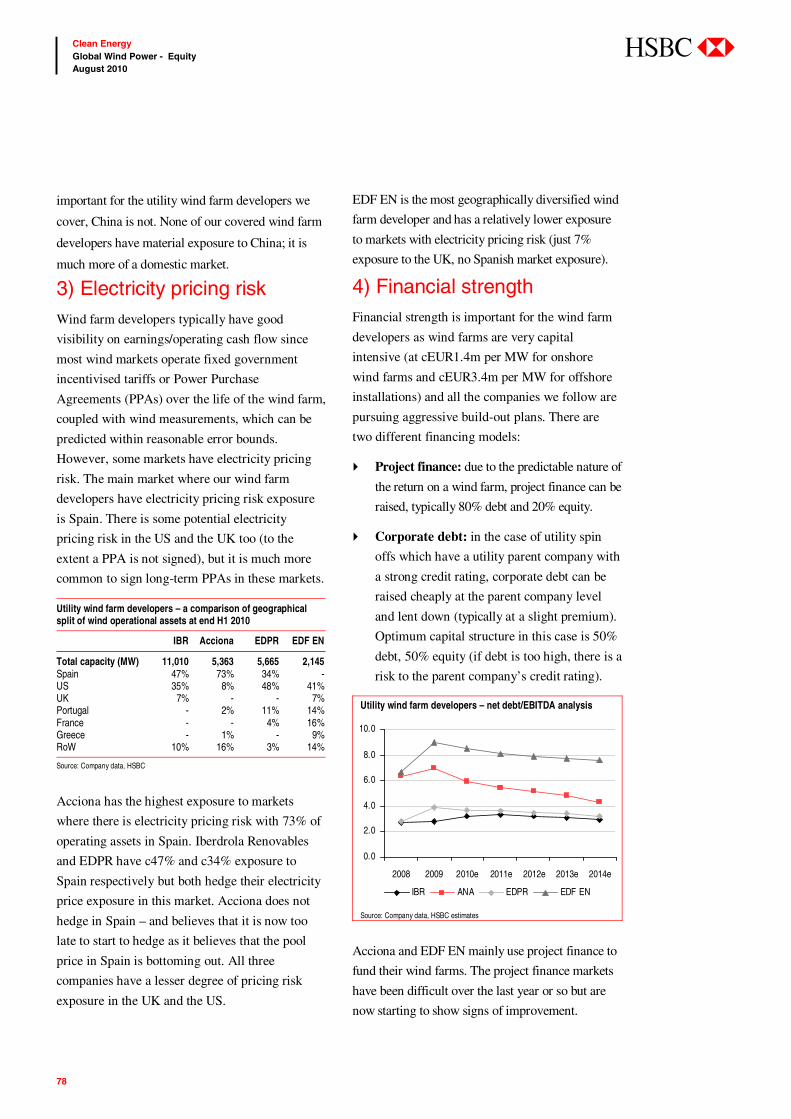
78
Clean Energy Global Wind Power - Equity August 2010
abc
important for the utility wind farm developers we
cover, China is not. None of our covered wind farm
developers have material exposure to China; it is
much more of a domestic market.
3) Electricity pricing risk Wind farm developers typically have good
visibility on earnings/operating cash flow since
most wind markets operate fixed government
incentivised tariffs or Power Purchase
Agreements (PPAs) over the life of the wind farm,
coupled with wind measurements, which can be
predicted within reasonable error bounds.
However, some markets have electricity pricing
risk. The main market where our wind farm
developers have electricity pricing risk exposure
is Spain. There is some potential electricity
pricing risk in the US and the UK too (to the
extent a PPA is not signed), but it is much more
common to sign long-term PPAs in these markets.
Utility wind farm developers – a comparison of geographical split of wind operational assets at end H1 2010
IBR Acciona EDPR EDF EN
Total capacity (MW) 11,010 5,363 5,665 2,145 Spain 47% 73% 34% - US 35% 8% 48% 41% UK 7% - - 7% Portugal - 2% 11% 14% France - - 4% 16% Greece - 1% - 9% RoW 10% 16% 3% 14%
Source: Company data, HSBC
Acciona has the highest exposure to markets
where there is electricity pricing risk with 73% of
operating assets in Spain. Iberdrola Renovables
and EDPR have c47% and c34% exposure to
Spain respectively but both hedge their electricity
price exposure in this market. Acciona does not
hedge in Spain – and believes that it is now too
late to start to hedge as it believes that the pool
price in Spain is bottoming out. All three
companies have a lesser degree of pricing risk
exposure in the UK and the US.
EDF EN is the most geographically diversified wind
farm developer and has a relatively lower exposure
to markets with electricity pricing risk (just 7%
exposure to the UK, no Spanish market exposure).
4) Financial strength Financial strength is important for the wind farm
developers as wind farms are very capital
intensive (at cEUR1.4m per MW for onshore
wind farms and cEUR3.4m per MW for offshore
installations) and all the companies we follow are
pursuing aggressive build-out plans. There are
two different financing models:
Project finance: due to the predictable nature of
the return on a wind farm, project finance can be
raised, typically 80% debt and 20% equity.
Corporate debt: in the case of utility spin
offs which have a utility parent company with
a strong credit rating, corporate debt can be
raised cheaply at the parent company level
and lent down (typically at a slight premium).
Optimum capital structure in this case is 50%
debt, 50% equity (if debt is too high, there is a
risk to the parent company’s credit rating).
Utility wind farm developers – net debt/EBITDA analysis
0.0
2.0
4.0
6.0
8.0
10.0
2008 2009 2010e 2011e 2012e 2013e 2014e
IBR ANA EDPR EDF EN
Source: Company data, HSBC estimates
Acciona and EDF EN mainly use project finance to
fund their wind farms. The project finance markets
have been difficult over the last year or so but are
now starting to show signs of improvement.

79
Clean Energy Global Wind Power - Equity August 2010
abc
IBR and EDPR pursue the corporate debt model:
they have strong financial support and
commitment from their respective parent groups,
which provide credit for the financing of nearly
all of their wind farms. This was an advantage for
both companies when the project finance markets
froze a year or so ago.
Currently, IBR is the most financially sound
company based on net debt/EBITDA with a 2010e
multiple of 3.2x. EDPR is close with a multiple of
3.7x for 2010e.
Acciona has significantly reduced its net debt
after the completion of the Endesa transaction. It
plans to keep net debt around this new lower level
by reducing capex in its non-renewables division.
We forecast that its net debt will tend towards 4x
times EBITDA over the next five years as will
IBR’s and EDPR’s to around 3x.
However, we forecast EDF EN to have a net
debt/EBITDA multiple of around 9x over the
same time period. This is not unusual for a
company consolidating a SPV each of which has
raised project finance (of 80% debt).
5) Growth profile We believe EDPR provides the most attractive
earning growth rate during 2010e-13e with 3 year
EPS CAGR of 24%. EDF EN provides the most
attractive EBITDA 3-year CAGR of 21%, on our
estimates.
Utility wind farm developers – HSBC forecast 3 years EPS and EBITDA CAGR
EPS CAGR (2010e-13e)
EBITDA CAGR (2010e-13e)
EDP Renovaveis 24% 17% EDF EN 21% 20% Acciona 19% 13% Iberdrola Renovables 16% 16%
Source: HSBC estimates
6) Detailed disclosure Strategic targets are important for wind farm
developers as they give visibility over installations
and hence capex spend. Investors can also get a
sense as to where the company is planning to invest
in the coming years (ie IBR and EDPR are both
planning to expand out of Spain and into the US).
At its Strategy Day in March 2010, Acciona
disclosed its long-term strategic and financial
targets at the group level and at divisional level as
well. It targets to install 2.4GW in wind capacity
over 2010-13 implying an average run rate of
600MW per annum. In STEG, Acciona has a
target to install 300MW over 2010-13.
EDPR has a strategic target of achieving 10.5GW
installed capacity by 2012 and its parent group
has expressed a firm commitment to ensuring the
necessary financing is in place. In the near-term,
EDPR targets to install 1.0-1.1GW (net) wind
capacity over the next two years.
EDF EN has a strategic target of achieving
4.2GW (net) installed renewable capacity
including 500MW in solar, by 2012, but does not
have such strong support from its parent group.
On the other hand, although Iberdrola Renovables
has financing arrangements commensurate with
EDPR, it does not currently have a long-term
strategic target. It does however give near-term
guidance on achieving renewable installed
capacity of 12.5GW by 2010 and has, fairly
quickly, come back to its guidance of annual
installations of 2GW, guidance initially given at
the time of its IPO back in November 2007.
Currently, EDPR provides the best level of
disclosure on its operating wind farms, which are
of a better than average quality in nearly all of its
markets. IBR provides good information on its
operating wind farm assets and pipeline. Acciona
and EDF EN do not provide much detail on their
operating assets or development pipeline.
80
Clean Energy Global Wind Power - Equity August 2010
abc
This page has been intentionally left blank.

81
Clean Energy Global Wind Power - Equity August 2010
abc
Companies section
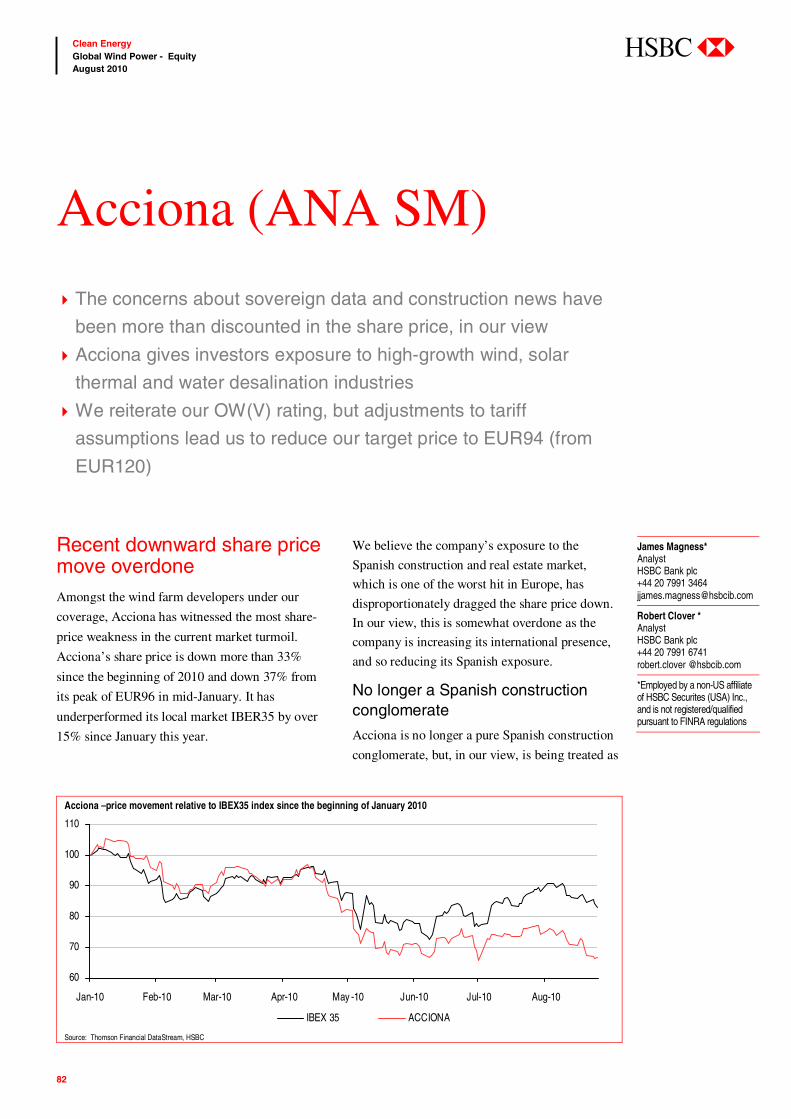
82
Clean Energy Global Wind Power - Equity August 2010
abc
Recent downward share price move overdone Amongst the wind farm developers under our
coverage, Acciona has witnessed the most share-
price weakness in the current market turmoil.
Acciona’s share price is down more than 33%
since the beginning of 2010 and down 37% from
its peak of EUR96 in mid-January. It has
underperformed its local market IBER35 by over
15% since January this year.
We believe the company’s exposure to the
Spanish construction and real estate market,
which is one of the worst hit in Europe, has
disproportionately dragged the share price down.
In our view, this is somewhat overdone as the
company is increasing its international presence,
and so reducing its Spanish exposure.
No longer a Spanish construction conglomerate
Acciona is no longer a pure Spanish construction
conglomerate, but, in our view, is being treated as
Acciona (ANA SM)
The concerns about sovereign data and construction news have
been more than discounted in the share price, in our view
Acciona gives investors exposure to high-growth wind, solar
thermal and water desalination industries
We reiterate our OW(V) rating, but adjustments to tariff
assumptions lead us to reduce our target price to EUR94 (from
EUR120)
James Magness* Analyst HSBC Bank plc +44 20 7991 3464 [email protected]
Robert Clover * Analyst HSBC Bank plc +44 20 7991 6741 robert.clover @hsbcib.com
*Employed by a non-US affiliate of HSBC Securites (USA) Inc., and is not registered/qualified pursuant to FINRA regulations
Acciona –price movement relative to IBEX35 index since the beginning of January 2010
60
70
80
90
100
110
Jan-10 Feb-10 Mar-10 Apr-10 May -10 Jun-10 Jul-10 Aug-10
IBEX 35 ACCIONA
Source: Thomson Financial DataStream, HSBC

83
Clean Energy Global Wind Power - Equity August 2010
abc
if it were. We think the story is one of refocusing
and restructuring. There is an increasing focus on
the renewable energy division and an increased
focus on expansion overseas. According to the
group’s strategic targets, the renewable energy
division will account for 70% of group EBITDA
in 2013e (c76% according to our forecasts, but we
are more conservative on growth in the non-
renewable businesses) up from 60% in 2009.
Acciona – Contribution of Energy division to group EBITDA (HSBC forecast)
60%72% 73% 74% 75%
40%28% 27% 26% 25%
0%
20%
40%
60%
80%
100%
2009 2010e 2011e 2012e 2013e
Energy Others
Source: Company data, HSBC estimates
Furthermore, Acciona is reducing its Spanish
exposure through international expansion. For
example, in the renewable energy division, we
forecast that two-thirds of new wind installations
over the next four years will be outside Spain,
reducing total Spanish exposure to 60% for the
operational wind farms (from 73% in 2009).
High growth wind industry
Acciona is the fourth largest wind-farm
developer/owner globally. At the end of H1 2010,
Acciona had c5.4GW of net wind operating
capacity, 453MW of wind assets under
construction. Acciona also has a large wind
development pipeline of around 24GW.
A rare STEG opportunity
At end H1 2010, Acciona has 114MW of
operational STEG assets (50MW plant in Spain
and a 64MW STEG plant in Nevada, US). This,
coupled with the 150MW of STEG plants under
construction, make Acciona one of only a few
major global STEG players. Acciona is thus a rare
opportunity to gain some STEG exposure.
A world leader in water desalination
Acciona is a global leader in water treatment and
desalination. Acciona Water contributes only a
small part of the group’s earnings right now, but
Water is one of Acciona’s three core strategic
pillars, and is one of Acciona’s fastest growing
business areas and already the most
internationally spread.
Acciona Agua has good exposure to the fast-
growing Australian and higher-growth European
markets.
H1 2010 results Acciona reported weak set of H1 2010 results
which were below market expectations at all
levels (except net income). Revenue was
EUR3bn, 3% up y-o-y but 3% below consensus.
Although Energy division revenue was up 42%
from H1 2009, the group revenue was dragged
down by the infrastructure division, for which
revenue was down 10% y-o-y, impacted by the
lack of activity in Spanish construction market
(the division accounts 50% of the group revenue).
EBITDA was EUR528m, 2% below consensus
but 38% higher than H1 09. This was primarily
due to increased contribution by the high margin
Energy division (75% contribution to group
EBITDA in H1 2010 versus 63% in H1 2009).
Acciona installed no renewable projects during
the first half but construction assets increased to
635MW (including wind assets of 453MW) from
590MW at end Q1 2010.
Acciona’s strategic targets versus our forecast Acciona has a strategic target to add 2,400MW
wind capacity over 2010-13 implying 600MW
addition every year on average. We aim to be
84
Clean Energy Global Wind Power - Equity August 2010
abc
conservative in our new installation forecast due
to weaker project finance market in short term,
and we forecast Acciona to install 1,950MW new
wind capacity over next four years (versus our
earlier forecast of 2,100MW).
Acciona – Net wind installations forecast – new v old
2010e 2011e 2012e 2013e
New forecast 125 525 700 600 Old forecast 375 525 600 600
Source: HSBC estimates
During 2010e-12e, we forecast wind installations
to be weighted more towards 2012e (and peak in
2012e) in order to enable Acciona to meet its
installation targets but also to reduce the impact of
lower wind premiums (35% cut from existing
premiums) under the agreement between the
Spanish Industry Ministry and the Spanish wind
sector that expires in end 2012.
In March 2010, Acciona won a contract to build
three wind farms in Mexico with a total combined
capacity of 306MW. The wind farms are expected
to be commissioned by the end of 2011 and will
comprise 204 units of 1.5MW wind turbines
which Acciona will source internally from its
turbine manufacturing division.
In other renewables, Acciona has a target to install
300MW of STEG capacity over 2010-13 implying
75MW installations pa on average. Again, we aim
to be conservative on our installation forecast and
forecast Acciona to install 150MW over 2010e-
13e (same as our earlier forecast).
Acciona – Net STEG installations forecast – new v old
2010e 2011e 2012e 2013e
New forecast 100 50 0 0 Old forecast 100 50 0 0
Source: HSBC estimates
Impact of changes on our forecast We have cut our assumption for wind tariff in
Spain over 2010e-14e due to the continued
weakness in Spanish pool prices. Due to the
continued lack of activity in the Spanish
construction market, we believe that Acciona’s
Infrastructure and real estate division will
continue to be lacklustre and have cut their y-o-y
growth rates for 2010e-12e.
ANA – HSBC assumption for wind tariff in Spain (EUR/MWh)
2010e 2011e 2012e 2013e 2014e
New assumption 70 75 77 78 79 Old assumption 80 83 85 87 89
Source: HSBC estimates
This results in a 5%-8% reduction in our revenue
forecast for 2010e-12e. We forecast the wind
turbine division to increase its revenue share in
the Energy division going forward but as it is a
low margin business (compared to electricity
sales); we believe it will result in a drop in
EBITDA margin for the Energy division on the
whole. And since the Energy division contributes
over 70% to the group EBITDA, the impact on
EPS is more pronounced. EPS are now down
c40% over 2010e-12e.

85
Clean Energy Global Wind Power - Equity August 2010
abc
ANA – Sales forecast (EURm) – new vs. old
0
2,000
4,000
6,000
8,000
10,000
2010e 2011e 2012e 2013e 2014e
New forecasts Prev ious forecasts
Source: HSBC estimates
ANA – EPS forecast (EUR) – new vs. old
0.00
2.00
4.00
6.00
8.00
10.00
2010e 2011e 2012e 2013e 2014e
New forecasts Prev ious forecasts
Source: HSBC estimates
HSBC versus consensus Acciona – Sales forecast: HSBC vs. consensus (EURm)
Year Low Mean High HSBC HSBC % above/ (below) mean
2010e 6,355 6,946 7,666 6,983 1% 2011e 7,286 7,388 8,162 7,675 4% 2012e 7,389 7,949 8,695 8,124 2%
Source: Bloomberg, HSBC estimates
Acciona – EBITDA forecast: HSBC vs. consensus (EURm)
Low Mean High HSBC HSBC % above/ (below) mean
2010e 1,147 1,262 1,335 1,269 1% 2011e 1,352 1,443 1,526 1,495 4% 2012e 1,614 1,656 1,676 1,708 3%
Source: Bloomberg, HSBC estimates
Valuation We cut our target price to EUR94 from EUR120
earlier but maintain our Overweight (V) rating on
Acciona.
We believe that wider market concerns over
sovereign risk in Southern Europe have caused
weakness in Acciona’s share price since early
2010. Acciona is no longer a pure Spanish
construction conglomerate, but, in our view, is
being treated as if it were.
In order to emphasise the embedded value in
Acciona, we now value all non-
renewable/environmental divisions at zero. These
divisions include the construction and real estate
businesses, areas which have been particularly
badly hit by Spain’s deep recession. Clearly some
value should be attached to these divisions, in our
view. In fact, we believe the divisions still have
the equity value of cEUR27 per share that we
gave them in our initiation report, published 28
October 2009. However, we do not today believe
that the market will currently place an appropriate
value on these in light of current concerns in
Spain. It is clear to us that if these were
appropriately valued it would add further upside
to our price target.
Valuation
Our valuation includes SOTP components for the
operating and construction renewable assets and the
wind farm development pipeline. In order to
calculate the value of Acciona's wind assets, we have
set up project valuation models, taking into account
country-specific wind tariff regimes, capital costs,
capacity factors of a typical wind farm and also
market multiples like equity market risk premium
(EMRP) and risk free rate (RFR), to estimate the
NPV per kW for projects in its main markets,
including the US, Spain, Australia and Germany.
We calculate the value per MW of the operational
assets, under construction assets and probability
86
Clean Energy Global Wind Power - Equity August 2010
abc
weighted development pipeline, separately, in each
market by adding together two components: the
investment cost and the NPV element.
We value Acciona’s operational wind farm assets
of 5,363MW at cEUR7,241m with an average
implied value of EUR1.35m per MW. In addition,
we value the 453MW of construction assets at
EUR434m – assuming 50% of capex has been
incurred and the probability-weighted wind
development pipeline of c24GW at EUR1,200m,
implying a value of EUR51,000/MW.
We value Acciona’s other renewable operational
assets (911MW hydro and mini-hydro, 114MW
solar thermal, 33MW solar PV, 33MW biomass
assets and 100MW cogeneration assets) using the
same valuation methodology.
Wind turbine business
Acciona is a top 10 wind turbine manufacturer
globally but on a group level it is a small business
segment. We value the wind turbine business
using DCF methodology and add 2% to the
group’s WACC of 7.5% to reflect the risk of a
small but growing business.
We have not included any central overheads in our
valuation as we believe they are fully reflected in our
project-valuation models.
This results in a fair valuation for Acciona of
EUR94.27, which we round down to EUR94 to
arrive at our new target price, down from EUR120
previously due to the cut in our wind tariff
assumptions (primarily in Spain) and cut in our
wind installation forecast, explained earlier. Our
new target price implies 55% potential return over
one year, which is above the 18.5% threshold
limit for Neutral band for volatile European stocks
under HSBC’s research model, so we maintain
our Overweight (V) rating on the stock.
Risks Downside risks to our view include:
Acciona operates in a regulated industry
environment and is dependent, in many cases,
on government subsidies (like PTC/ITC or
treasury grants in the US market) to provide
adequate returns on investment. Furthermore,
government subsidy regimes can change
dramatically, impacting the company’s margins
Acciona is mainly dependent on the Spanish
market. This may prove inadequate to
mitigate its business risk.
Acciona may not be able to secure
appropriate power purchasing agreements
(PPAs) for its operating assets in the US.
Acciona may not install all of its planned
wind installations from greenfield
developments. This could lead to lower
project NPV
The recent turmoil in the credit and equity
markets may impact Acciona’s ability to raise
the capital we expect will be necessary to
develop its pipeline fully and at sufficiently
attractive rates to generate an adequate return
on its investment
Climate change could dramatically change the
current observed meteorological wind
conditions under which the company’s existing
and future assets are expected to operate
A longer-than-expected downturn in the
European (in particular Spanish) real estate
and construction industry.

87
Clean Energy Global Wind Power - Equity August 2010
abc
Acciona – changes to our SOTP valuation
New forecast (EURm) Old forecast (EURm) Absolute difference (EURm) % difference
Operational wind 7,241 8,227 (986) (12%) Construction 434 108 327 304% Pipeline 1,200 1,800 (600) (33%) Total wind assets 8,876 10,134 (1,259) (12%) wind turbine business 305 413 (108) (26%) Total wind 9,180 10,548 (1,367) (13%) Other renewable 2,286 2,325 (39) (2%) Total Energy 11,467 12,873 (1,406) (11%) Environment (ex-water) 114 121 (7) (4%) Water 232 264 (32) (10%) Construction - Concessions - Real Estate - Logistics & airports - Others - Total 11,813 13,258 (1,445) (11%) Adjust: Net debt/(cash) 5,656 5,499 157 3% Minority interest 306 306 0 0% Equity value 5,858 7,453 (1,602) (21%) Value per share (EUR) 94.27 120.09 (25.82) (22%) Target price (rounded) (EUR) 94.00 120.00 (26.00) (22%)
Source: HSBC estimates

88
Clean Energy Global Wind Power - Equity August 2010
abc
Financials & valuation: Acciona Overweight (V) Financial statements
Year to 12/2009a 12/2010e 12/2011e 12/2012e
Profit & loss summary (EURm)
Revenue 6,512 6,983 7,675 8,124EBITDA 1,043 1,269 1,495 1,707Depreciation & amortisation -595 -620 -714 -810Operating profit/EBIT 448 649 781 897Net interest -214 -315 -369 -405PBT 214 334 412 492HSBC PBT 214 334 412 493Taxation -44 -100 -124 -148Net profit 1,262 205 260 310HSBC net profit 107 205 260 310
Cash flow summary (EURm)
Cash flow from operations 10,712 819 952 1,158Capex -4,372 -1,007 -1,491 -1,702Cash flow from investment -4,229 -1,036 -1,519 -1,736Dividends 62 -51 -65 -78Change in net debt -12,220 268 633 656FCF equity -3,734 -187 -539 -544
Balance sheet summary (EURm)
Intangible fixed assets 1,596 1,596 1,596 1,596Tangible fixed assets 10,838 11,225 12,002 12,893Current assets 6,325 6,878 7,286 7,515Cash & others 1,451 1,451 1,451 1,451Total assets 20,532 21,473 22,657 23,777Operating liabilities 4,856 5,375 5,732 5,964Gross debt 8,716 8,984 9,617 10,272Net debt 7,265 7,533 8,166 8,821Shareholders funds 5,758 5,911 6,106 6,339Invested capital 12,452 12,873 13,701 14,589
Ratio, growth and per share analysis
Year to 12/2009a 12/2010e 12/2011e 12/2012e
Y-o-y % change
Revenue -9.7 7.2 9.9 5.9EBITDA -2.5 21.7 17.8 14.2Operating profit -16.4 44.9 20.3 14.8PBT -35.3 56.1 23.4 19.4HSBC EPS -62.1 91.3 27.0 19.4
Ratios (%)
Revenue/IC (x) 0.4 0.6 0.6 0.6ROIC 2.1 3.6 4.1 4.4ROE 2.1 3.5 4.3 5.0ROA -0.3 -0.5 -0.4 -0.2EBITDA margin 16.0 18.2 19.5 21.0Operating profit margin 6.9 9.3 10.2 11.0EBITDA/net interest (x) 4.9 4.0 4.1 4.2Net debt/equity 119.8 121.2 127.3 132.8Net debt/EBITDA (x) 7.0 5.9 5.5 5.2CF from operations/net debt 147.4 10.9 11.7 13.1
Per share data (EUR)
EPS Rep (fully diluted) 20.33 3.30 4.19 5.00HSBC EPS (fully diluted) 1.72 3.30 4.19 5.00DPS 0.43 0.82 1.05 1.25Book value 90.60 93.02 96.08 99.75
Valuation data
Year to 12/2009a 12/2010e 12/2011e 12/2012e
EV/sales 1.6 1.5 1.5 1.5EV/EBITDA 10.1 8.5 7.7 7.1EV/IC 0.8 0.8 0.8 0.8PE* 35.2 18.4 14.5 12.1P/Book value 0.7 0.7 0.6 0.6FCF yield (%) -114.1 -5.7 -16.5 -16.6Dividend yield (%) 0.7 1.4 1.7 2.1
Note: * = Based on HSBC EPS (fully diluted)
Issuer information
Share price (EUR) 60.70 Target price (EUR) 94.00 Potent'l return (%) 54.9
Reuters (Equity) ANA.MC Bloomberg (Equity) ANA SMMarket cap (USDm) 4,872 Market cap (EURm) 3,857Free float (%) 40 Enterprise value (EURm) 10807Country Spain Sector Construction & EngineeringAnalyst James Magness Contact 44 20 7991 3464
Price relative
35557595
115135155175195215235
2008 2009 2010 2011
35557595115135155175195215235
Acciona Rel to MADRID SE
Source: HSBC Note: price at close of 25 Aug 2010
89
Clean Energy Global Wind Power - Equity August 2010
abc
Steady as she goes… Iberdrola Renovables (IBR) is the largest wind-
farm developer/operator globally with more than
11GW operational wind assets.
IBR has been the biggest beneficiary of the US
Treasury Grant program receiving cUSD400m in
grants in 2010-to-date and cUSD580m in 2009.
Development pipeline
At c50GW, (excluding 10GW as contribution of
Gamesa under the Strategic development
agreement), it has a larger wind-development
pipeline than any other wind farm developer.
IBR – wind capacity at end H1 2010 (MW)
Operational Under construction
Pipeline
Spain 5,194 155 9,100 US 3,877 850 24,565 UK 816 206 7,653 RoW 1,123 253 8,583 Total 11,010 1,464 49,901
Source: company data
.
Biggest beneficiary of US Treasury grant allocations IBR has received close to USD1bn in US
Treasury grants allocations since the program got
underway in July 2009. This is more than any of
its European peers have received (EDPR has
received around USD300m, Acciona has received
around USD100m while EDF EN has received
cUSD70m until now) and more even than
NextEra Energy, which is the largest wind farm
operator in US in terms of operating capacity, has
received (cUSD430m).
Back to its ‘pre-crisis’ installation guidance In 2009, IBR returned to its old guidance of
installing 2GW per annum (a target given at the
time of its IPO back in November 2007) fairly
quickly. This is much better compared to the other
wind farm developers who have either cut their
long term installation targets or have shifted their
installation targets to the near future.
Iberdrola Renovables(IBR SM)
Largest Renewable utility player in the world
Firmly on track to meet 2010-end guidance of 12.5GW installed
renewable capacity
We reiterate our OW(V) rating. Removal of 10% liquidity premium
and reductions in our tariff assumptions, however, lead us to cut
our target price from EUR4.00 to EUR3.50.
James Magness* Analyst HSBC Bank plc +44 20 7991 3464 [email protected]
Robert Clover * Analyst HSBC Bank plc +44 20 7991 6741 robert.clover @hsbcib.com
*Employed by a non-US affiliate of HSBC Securites (USA) Inc., and is not registered/qualified pursuant to FINRA regulations
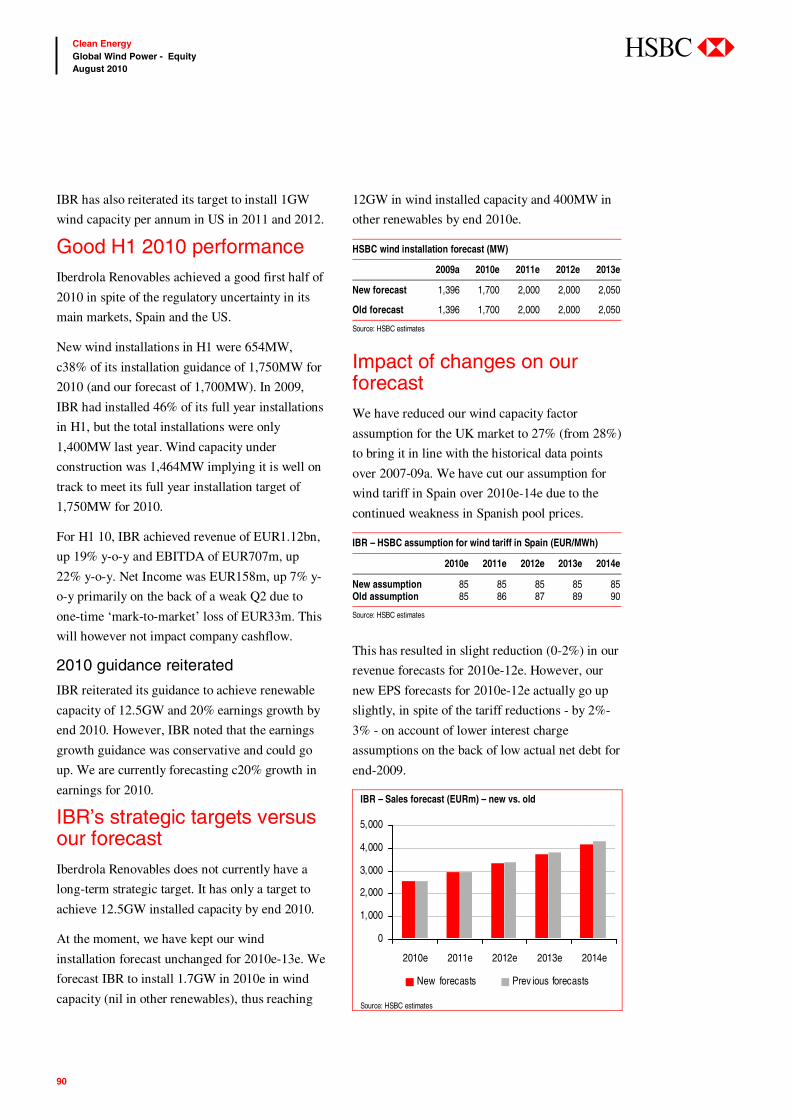
90
Clean Energy Global Wind Power - Equity August 2010
abc
IBR has also reiterated its target to install 1GW
wind capacity per annum in US in 2011 and 2012.
Good H1 2010 performance Iberdrola Renovables achieved a good first half of
2010 in spite of the regulatory uncertainty in its
main markets, Spain and the US.
New wind installations in H1 were 654MW,
c38% of its installation guidance of 1,750MW for
2010 (and our forecast of 1,700MW). In 2009,
IBR had installed 46% of its full year installations
in H1, but the total installations were only
1,400MW last year. Wind capacity under
construction was 1,464MW implying it is well on
track to meet its full year installation target of
1,750MW for 2010.
For H1 10, IBR achieved revenue of EUR1.12bn,
up 19% y-o-y and EBITDA of EUR707m, up
22% y-o-y. Net Income was EUR158m, up 7% y-
o-y primarily on the back of a weak Q2 due to
one-time ‘mark-to-market’ loss of EUR33m. This
will however not impact company cashflow.
2010 guidance reiterated
IBR reiterated its guidance to achieve renewable
capacity of 12.5GW and 20% earnings growth by
end 2010. However, IBR noted that the earnings
growth guidance was conservative and could go
up. We are currently forecasting c20% growth in
earnings for 2010.
IBR’s strategic targets versus our forecast Iberdrola Renovables does not currently have a
long-term strategic target. It has only a target to
achieve 12.5GW installed capacity by end 2010.
At the moment, we have kept our wind
installation forecast unchanged for 2010e-13e. We
forecast IBR to install 1.7GW in 2010e in wind
capacity (nil in other renewables), thus reaching
12GW in wind installed capacity and 400MW in
other renewables by end 2010e.
HSBC wind installation forecast (MW)
2009a 2010e 2011e 2012e 2013e
New forecast 1,396 1,700 2,000 2,000 2,050
Old forecast 1,396 1,700 2,000 2,000 2,050
Source: HSBC estimates
Impact of changes on our forecast We have reduced our wind capacity factor
assumption for the UK market to 27% (from 28%)
to bring it in line with the historical data points
over 2007-09a. We have cut our assumption for
wind tariff in Spain over 2010e-14e due to the
continued weakness in Spanish pool prices.
IBR – HSBC assumption for wind tariff in Spain (EUR/MWh)
2010e 2011e 2012e 2013e 2014e
New assumption 85 85 85 85 85 Old assumption 85 86 87 89 90
Source: HSBC estimates
This has resulted in slight reduction (0-2%) in our
revenue forecasts for 2010e-12e. However, our
new EPS forecasts for 2010e-12e actually go up
slightly, in spite of the tariff reductions - by 2%-
3% - on account of lower interest charge
assumptions on the back of low actual net debt for
end-2009.
IBR – Sales forecast (EURm) – new vs. old
0
1,000
2,000
3,000
4,000
5,000
2010e 2011e 2012e 2013e 2014e
New forecasts Prev ious forecasts
Source: HSBC estimates
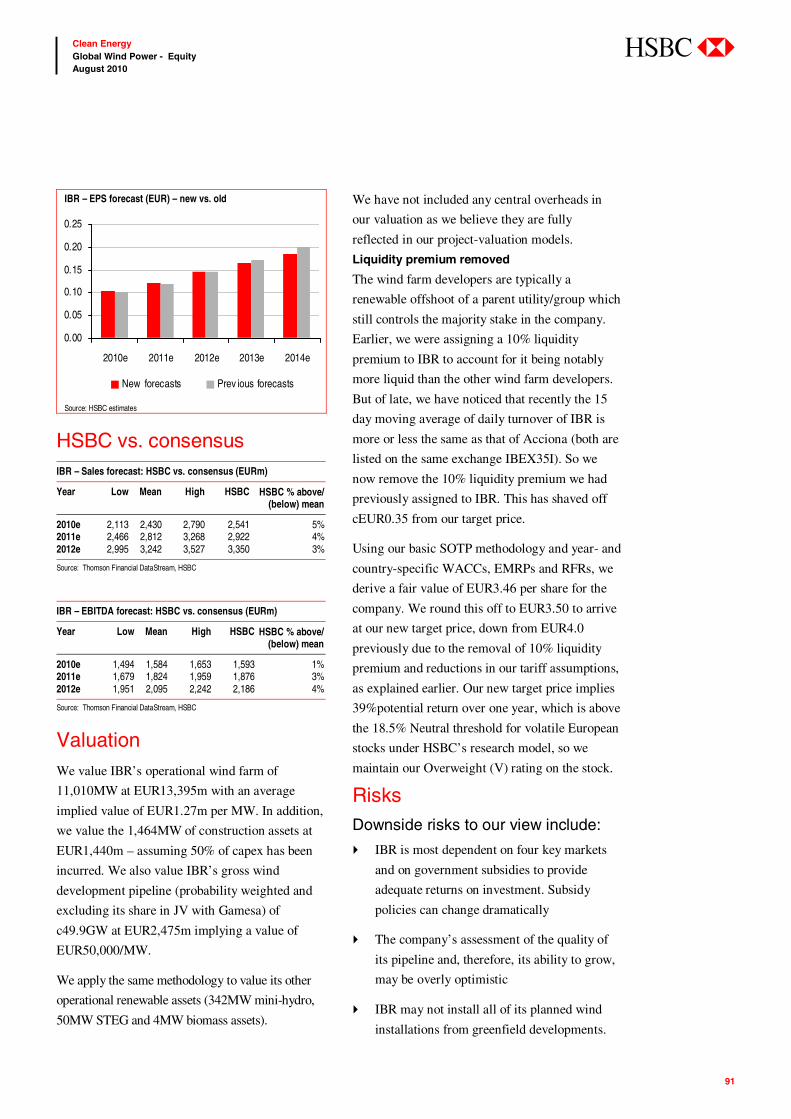
91
Clean Energy Global Wind Power - Equity August 2010
abc
IBR – EPS forecast (EUR) – new vs. old
0.00
0.05
0.10
0.15
0.20
0.25
2010e 2011e 2012e 2013e 2014e
New forecasts Prev ious forecasts
Source: HSBC estimates
HSBC vs. consensus IBR – Sales forecast: HSBC vs. consensus (EURm)
Year Low Mean High HSBC HSBC % above/ (below) mean
2010e 2,113 2,430 2,790 2,541 5% 2011e 2,466 2,812 3,268 2,922 4% 2012e 2,995 3,242 3,527 3,350 3%
Source: Thomson Financial DataStream, HSBC IBR – EBITDA forecast: HSBC vs. consensus (EURm)
Year Low Mean High HSBC HSBC % above/ (below) mean
2010e 1,494 1,584 1,653 1,593 1% 2011e 1,679 1,824 1,959 1,876 3% 2012e 1,951 2,095 2,242 2,186 4%
Source: Thomson Financial DataStream, HSBC
Valuation We value IBR’s operational wind farm of
11,010MW at EUR13,395m with an average
implied value of EUR1.27m per MW. In addition,
we value the 1,464MW of construction assets at
EUR1,440m – assuming 50% of capex has been
incurred. We also value IBR’s gross wind
development pipeline (probability weighted and
excluding its share in JV with Gamesa) of
c49.9GW at EUR2,475m implying a value of
EUR50,000/MW.
We apply the same methodology to value its other
operational renewable assets (342MW mini-hydro,
50MW STEG and 4MW biomass assets).
We have not included any central overheads in
our valuation as we believe they are fully
reflected in our project-valuation models.
Liquidity premium removed
The wind farm developers are typically a
renewable offshoot of a parent utility/group which
still controls the majority stake in the company.
Earlier, we were assigning a 10% liquidity
premium to IBR to account for it being notably
more liquid than the other wind farm developers.
But of late, we have noticed that recently the 15
day moving average of daily turnover of IBR is
more or less the same as that of Acciona (both are
listed on the same exchange IBEX35I). So we
now remove the 10% liquidity premium we had
previously assigned to IBR. This has shaved off
cEUR0.35 from our target price.
Using our basic SOTP methodology and year- and
country-specific WACCs, EMRPs and RFRs, we
derive a fair value of EUR3.46 per share for the
company. We round this off to EUR3.50 to arrive
at our new target price, down from EUR4.0
previously due to the removal of 10% liquidity
premium and reductions in our tariff assumptions,
as explained earlier. Our new target price implies
39%potential return over one year, which is above
the 18.5% Neutral threshold for volatile European
stocks under HSBC’s research model, so we
maintain our Overweight (V) rating on the stock.
Risks Downside risks to our view include:
IBR is most dependent on four key markets
and on government subsidies to provide
adequate returns on investment. Subsidy
policies can change dramatically
The company’s assessment of the quality of
its pipeline and, therefore, its ability to grow,
may be overly optimistic
IBR may not install all of its planned wind
installations from greenfield developments.
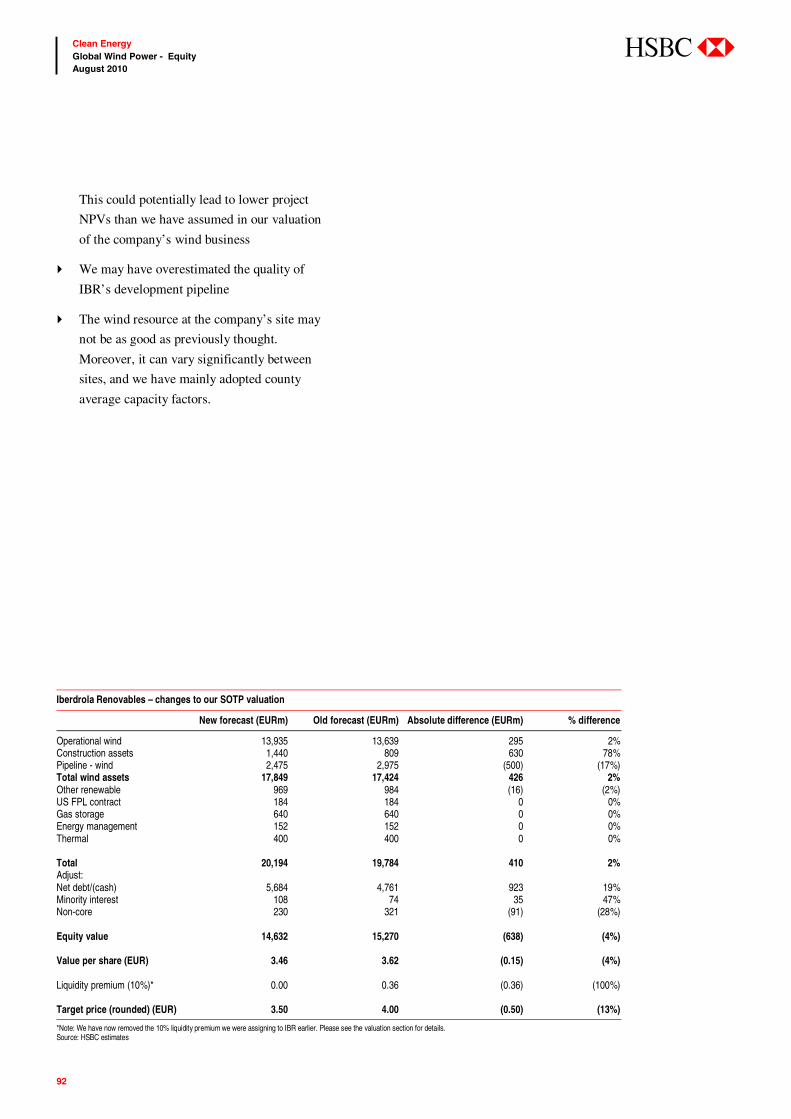
92
Clean Energy Global Wind Power - Equity August 2010
abc
This could potentially lead to lower project
NPVs than we have assumed in our valuation
of the company’s wind business
We may have overestimated the quality of
IBR’s development pipeline
The wind resource at the company’s site may
not be as good as previously thought.
Moreover, it can vary significantly between
sites, and we have mainly adopted county
average capacity factors.
Iberdrola Renovables – changes to our SOTP valuation
New forecast (EURm) Old forecast (EURm) Absolute difference (EURm) % difference
Operational wind 13,935 13,639 295 2% Construction assets 1,440 809 630 78% Pipeline - wind 2,475 2,975 (500) (17%) Total wind assets 17,849 17,424 426 2% Other renewable 969 984 (16) (2%) US FPL contract 184 184 0 0% Gas storage 640 640 0 0% Energy management 152 152 0 0% Thermal 400 400 0 0% Total 20,194 19,784 410 2% Adjust: Net debt/(cash) 5,684 4,761 923 19% Minority interest 108 74 35 47% Non-core 230 321 (91) (28%) Equity value 14,632 15,270 (638) (4%) Value per share (EUR) 3.46 3.62 (0.15) (4%) Liquidity premium (10%)* 0.00 0.36 (0.36) (100%) Target price (rounded) (EUR) 3.50 4.00 (0.50) (13%)
*Note: We have now removed the 10% liquidity premium we were assigning to IBR earlier. Please see the valuation section for details. Source: HSBC estimates
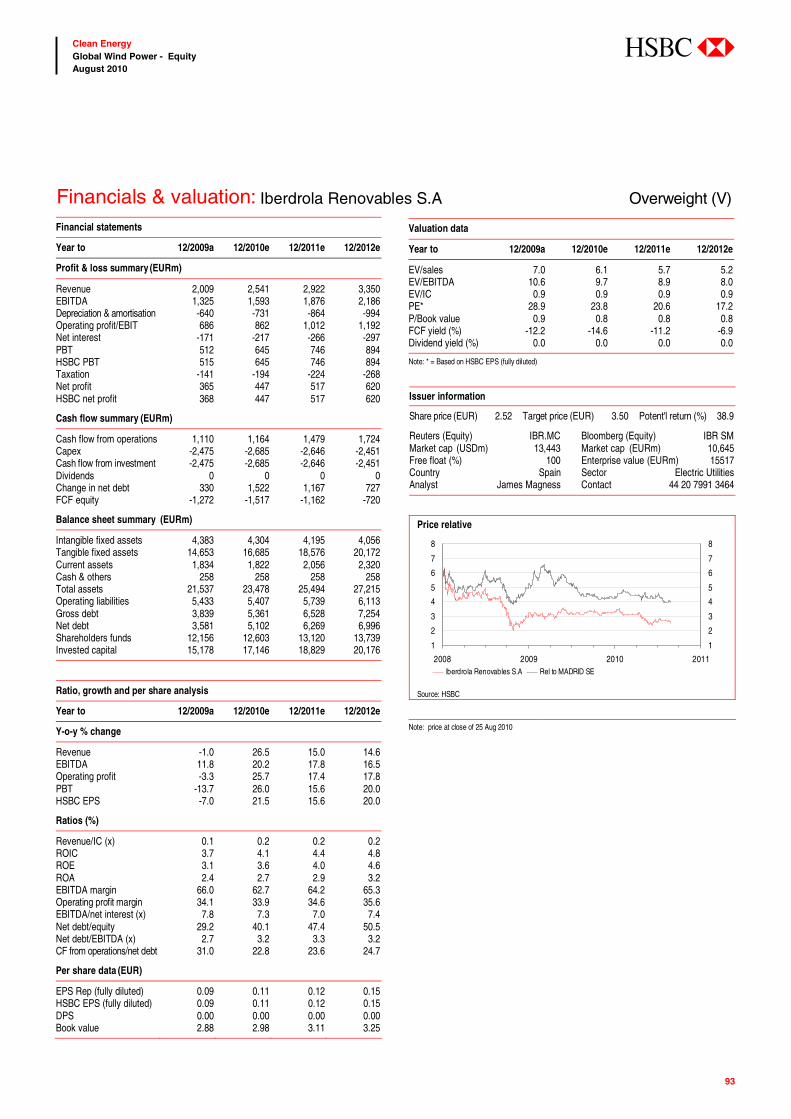
93
Clean Energy Global Wind Power - Equity August 2010
abc
Financials & valuation: Iberdrola Renovables S.A Overweight (V) Financial statements
Year to 12/2009a 12/2010e 12/2011e 12/2012e
Profit & loss summary (EURm)
Revenue 2,009 2,541 2,922 3,350EBITDA 1,325 1,593 1,876 2,186Depreciation & amortisation -640 -731 -864 -994Operating profit/EBIT 686 862 1,012 1,192Net interest -171 -217 -266 -297PBT 512 645 746 894HSBC PBT 515 645 746 894Taxation -141 -194 -224 -268Net profit 365 447 517 620HSBC net profit 368 447 517 620
Cash flow summary (EURm)
Cash flow from operations 1,110 1,164 1,479 1,724Capex -2,475 -2,685 -2,646 -2,451Cash flow from investment -2,475 -2,685 -2,646 -2,451Dividends 0 0 0 0Change in net debt 330 1,522 1,167 727FCF equity -1,272 -1,517 -1,162 -720
Balance sheet summary (EURm)
Intangible fixed assets 4,383 4,304 4,195 4,056Tangible fixed assets 14,653 16,685 18,576 20,172Current assets 1,834 1,822 2,056 2,320Cash & others 258 258 258 258Total assets 21,537 23,478 25,494 27,215Operating liabilities 5,433 5,407 5,739 6,113Gross debt 3,839 5,361 6,528 7,254Net debt 3,581 5,102 6,269 6,996Shareholders funds 12,156 12,603 13,120 13,739Invested capital 15,178 17,146 18,829 20,176
Ratio, growth and per share analysis
Year to 12/2009a 12/2010e 12/2011e 12/2012e
Y-o-y % change
Revenue -1.0 26.5 15.0 14.6EBITDA 11.8 20.2 17.8 16.5Operating profit -3.3 25.7 17.4 17.8PBT -13.7 26.0 15.6 20.0HSBC EPS -7.0 21.5 15.6 20.0
Ratios (%)
Revenue/IC (x) 0.1 0.2 0.2 0.2ROIC 3.7 4.1 4.4 4.8ROE 3.1 3.6 4.0 4.6ROA 2.4 2.7 2.9 3.2EBITDA margin 66.0 62.7 64.2 65.3Operating profit margin 34.1 33.9 34.6 35.6EBITDA/net interest (x) 7.8 7.3 7.0 7.4Net debt/equity 29.2 40.1 47.4 50.5Net debt/EBITDA (x) 2.7 3.2 3.3 3.2CF from operations/net debt 31.0 22.8 23.6 24.7
Per share data (EUR)
EPS Rep (fully diluted) 0.09 0.11 0.12 0.15HSBC EPS (fully diluted) 0.09 0.11 0.12 0.15DPS 0.00 0.00 0.00 0.00Book value 2.88 2.98 3.11 3.25
Valuation data
Year to 12/2009a 12/2010e 12/2011e 12/2012e
EV/sales 7.0 6.1 5.7 5.2EV/EBITDA 10.6 9.7 8.9 8.0EV/IC 0.9 0.9 0.9 0.9PE* 28.9 23.8 20.6 17.2P/Book value 0.9 0.8 0.8 0.8FCF yield (%) -12.2 -14.6 -11.2 -6.9Dividend yield (%) 0.0 0.0 0.0 0.0
Note: * = Based on HSBC EPS (fully diluted)
Issuer information
Share price (EUR) 2.52 Target price (EUR) 3.50 Potent'l return (%) 38.9
Reuters (Equity) IBR.MC Bloomberg (Equity) IBR SMMarket cap (USDm) 13,443 Market cap (EURm) 10,645Free float (%) 100 Enterprise value (EURm) 15517Country Spain Sector Electric UtilitiesAnalyst James Magness Contact 44 20 7991 3464
Price relative
1
2
3
4
5
6
7
8
2008 2009 2010 2011
1
2
3
4
5
6
7
8
Iberdrola Renovables S.A Rel to MADRID SE
Source: HSBC Note: price at close of 25 Aug 2010

94
Clean Energy Global Wind Power - Equity August 2010
abc
Recently more ‘sold-off’ than other wind developers EDPR has underperformed its local market
Wider market concerns due to sovereign issues in
Southern Europe have caused weakness in the
share prices of all wind farm developers. EDPR
has suffered more share price weakness than peers
in the last three months.
EDPR has underperformed its local market by
some 15% during the last three months, which is
more than other wind farm developers. IBR and
ANA have underperformed IBEX35 by some
10% while EDF EN has outperformed its local
market by 4% over the same time period.
EDP Renovaveis (EDPR PL)
Trading at highest discount to the fair value of operating and
construction assets amongst the wind farm developers
EDP R is one of two favoured players in the developer space
We reiterate our Overweight (V) rating, but changes to tariff and
installation assumptions lead us to cut to our target price to
EUR7.25 (from EUR8.0)
James Magness* Analyst HSBC Bank plc +44 20 7991 3464 [email protected]
Robert Clover * Analyst HSBC Bank plc +44 20 7991 6741 robert.clover @hsbcib.com
*Employed by a non-US affiliate of HSBC Securites (USA) Inc., and is not registered/qualified pursuant to FINRA regulations
Wind farm developers –price movement relative to local exchange during the last three months (since mid-May 2010)
-20%
-15%
-10%
-5%
0%
5%
10%
May -10 Jun-10 Jul-10 Aug-10
ANA/IBEX35 IBR/IBEX35 EDPR/DJPORTL EEN/EN1FRU1
Source: Thomson Financial DataStream, HSBC

95
Clean Energy Global Wind Power - Equity August 2010
abc
Trading much below the fair value of operating assets
EDPR is currently trading at a 25% discount to
the fair value of its operating and under
construction assets (on our estimates, which we
consider to be conservative). For Acciona, the
discount is 13% while IBR is trading at par (see
table below).
Currently, no value seems to be attributed to
future growth in the renewable business of any of
the three wind farm developers. However, if we
include the valuation of the pipeline, we calculate
a total equity fair value per share for EDPR which
is 66% above the current share price. This
difference from the current share price is highest
among its peer group (46% for Acciona and 23%
for IBR).
Comparison of valuation of renewable assets (EUR/share)
Valuation (EUR/share) Acciona EDPR IBR
Operating assets 116.7 8.7 3.3 Construction assets 7.0 1.4 0.3 Other renewables 36.8 0.0 0.2 Less: Net Debt 91.1 4.3 1.4 Equity value per share (renewables) 69.4 5.8 2.5 Current share price 60.7 4.3 2.5 % (discount)/premium to equity value of operating/construction assets
(13%) (25%) 0%
Pipeline valuation 19.3 1.4 0.6 Total equity value (renewables) 88.7 7.2 3.1 % (discount)/premium to current share price
46% 66% 23%
*Note: We have possibly underestimated the equity value of IBR’s operating/construction assets since we have not excluded the component of net debt relating to non-renewable assets (as the company does not provide a split). (Price as close of 25th Aug. 2010) Source: HSBC estimates
Increasing exposure to high growth wind markets
EDPR has one of the largest wind development
pipelines worldwide of c31GW (net/gross) and
1.3GW of under construction assets at H1 2010.
EDPR targets to install 1.0-1.1GW (net) wind
capacity per annum over the next three years.
The US is the biggest market for EDPR,
accounting for almost 60% of its development
pipeline and 40% of under construction assets.
But EDPR has cut its wind installation guidance
in the US by 600MW over 2010-12 due to the
high level of regulatory uncertainty (federal RES).
However, EDPR has around 25% of its
development pipeline in high growth wind
markets like Poland, Romania, Bulgaria etc.
which have more favourable wind tariff regime
than Spain and the US.
We believe that a reduction in installations in the
US will result in higher number of new
installations in more favourable regions in the
Rest of Europe in future.
EDPR’s geographical split of wind development pipeline and under construction assets at end H1 2010
Pipeline Under construction
Total 30,949 1,319 US 61% 39% Spain 16% 25% Poland 5% 0% Brazil 4% 5% UK 4% 0% France 4% 3% Romania 2% 17% RoW 3% 11%
Source: company data, HSBC estimates
Better turbine prices due to framework agreement with Vestas
We believe the long term framework agreement
signed with Vestas for 1,500MW (plus an option
of further 600MW) should enable EDPR to source
turbines at lower prices which will help it to
reduce its capital expenditure going forward. This
is also indicated by EDPR’s forecast of a 10%
reduction in capex/MW for 2011e-12e from 2009-
10e levels.
H1 2010 results For H1 2010, revenue was EUR413mm, up 32%
y-o-y and EBITDA was EUR343mm, up 20% on
the back of increased generating capacity which
was up 27% on H1 2009. However, net income
was down 47% but that was due to higher
depreciation and financing charge on the back of
increased installed and under construction

96
Clean Energy Global Wind Power - Equity August 2010
abc
capacity. The wind capacity factors were 31% at
group level, same as H1 09. They were lower in
the US (32% vs. 36% in H1 09) but this was more
than offset by particularly strong capacity factors
in Europe, primarily in Spain (28% vs. 26%) and
Portugal (31% vs. 25%). Wind farms under
construction increased to 1.3GW from 1.1GW at
the end Q1 2010.
EDPR’s strategic targets versus our forecast We have cut our new wind installation forecast
for 2010e-12e on account of the regulatory
uncertainty in the US and Spanish market, both of
which are EDPR’s biggest markets. We forecast
EDPR to install 1,050MW wind capacity per year
through 2010e-12e.
EDPR – Net wind installation forecast – EDPR, HSBC new v old
MW 2010e 2011e 2012e 2013e
EDPR target 1,100-1,200 1,100-1,200 1,100-1,200 n/a HSBC New forecast
1,050 1,050 1,050 1,250
HSBC Old forecast
1,400 1,450 1,350 1,350
Source: HSBC estimates, company information
EDPR has a target to achieve a greater than 30%
CAGR growth in EBITDA and net income over
the period 2009-12e. We believe we are
conservative on the build out of wind assets over
the short term. We currently forecast that EDPR
will achieve a 22% EBITDA and 19% net income
3-year CAGR over 2009-12e.
EDPR – EBITDA and Net Income 2009-12e CAGR
EDPR guidance HSBC forecast
EBITDA +30% 22% Net Income +30% 19%
Source: company data, HSBC estimates
Impact of changes on our forecast We have updated the financials to reflect the Q2
10 performance. We have cut our assumption for
wind tariff in Spain over 2010e-14e due to the
continued weakness in Spanish pool prices.
EDPR – HSBC assumption for wind tariff in Spain (EUR/MWh)
2010e 2011e 2012e 2013e 2014e
New assumption 80 83 85 85 85 Old assumption 85 86 87 89 90
Source: HSBC estimates
This coupled with the cut in new wind installation
forecast has resulted in a 2-12% cut in our
revenue forecast for 2010e-12e. The cut is more
pronounced at the EPS level, which is down 9%-
15% for 2010e-12e. This is due to higher
depreciation charges on an increased number of
under construction assets.
EDPR – Sales forecast (EURm) – new vs. old
0
500
1,000
1,500
2,000
2010e 2011e 2012e 2013e 2014e
New forecasts Prev ious forecasts
Source: HSBC estimates
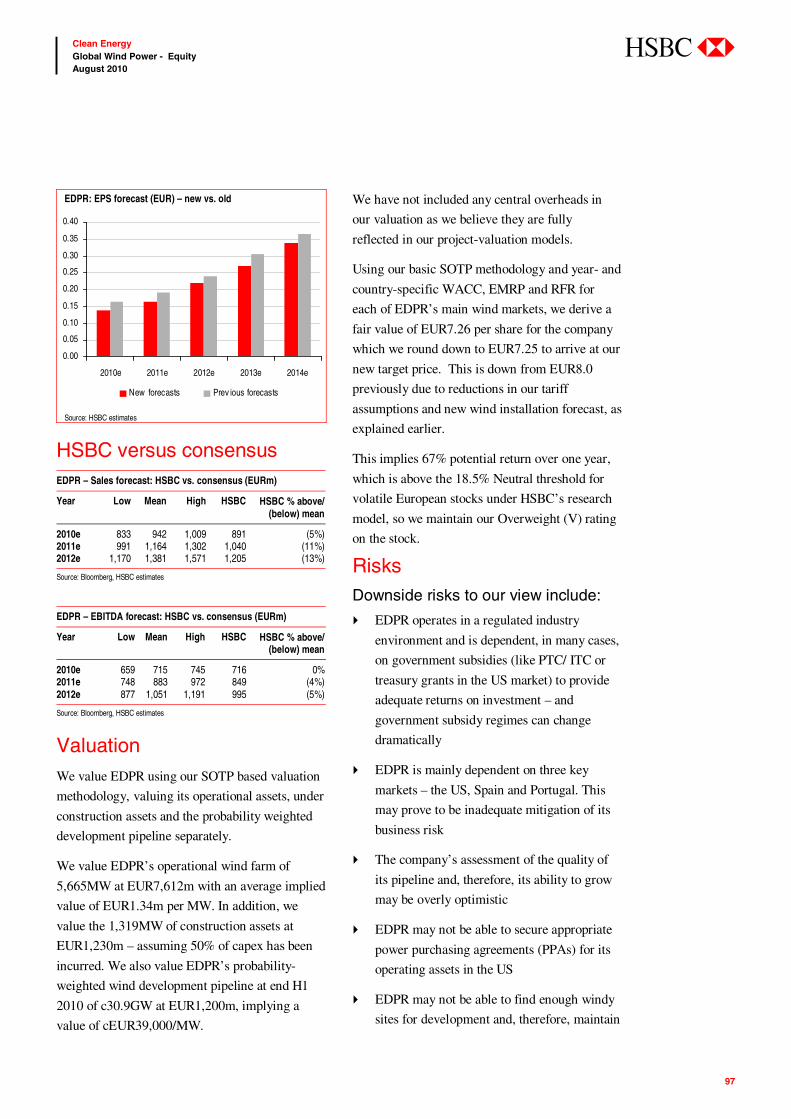
97
Clean Energy Global Wind Power - Equity August 2010
abc
EDPR: EPS forecast (EUR) – new vs. old
0.00
0.05
0.10
0.15
0.20
0.25
0.30
0.35
0.40
2010e 2011e 2012e 2013e 2014e
New forecasts Prev ious forecasts
Source: HSBC estimates
HSBC versus consensus EDPR – Sales forecast: HSBC vs. consensus (EURm)
Year Low Mean High HSBC HSBC % above/ (below) mean
2010e 833 942 1,009 891 (5%) 2011e 991 1,164 1,302 1,040 (11%) 2012e 1,170 1,381 1,571 1,205 (13%)
Source: Bloomberg, HSBC estimates EDPR – EBITDA forecast: HSBC vs. consensus (EURm)
Year Low Mean High HSBC HSBC % above/ (below) mean
2010e 659 715 745 716 0% 2011e 748 883 972 849 (4%) 2012e 877 1,051 1,191 995 (5%)
Source: Bloomberg, HSBC estimates
Valuation We value EDPR using our SOTP based valuation
methodology, valuing its operational assets, under
construction assets and the probability weighted
development pipeline separately.
We value EDPR’s operational wind farm of
5,665MW at EUR7,612m with an average implied
value of EUR1.34m per MW. In addition, we
value the 1,319MW of construction assets at
EUR1,230m – assuming 50% of capex has been
incurred. We also value EDPR’s probability-
weighted wind development pipeline at end H1
2010 of c30.9GW at EUR1,200m, implying a
value of cEUR39,000/MW.
We have not included any central overheads in
our valuation as we believe they are fully
reflected in our project-valuation models.
Using our basic SOTP methodology and year- and
country-specific WACC, EMRP and RFR for
each of EDPR’s main wind markets, we derive a
fair value of EUR7.26 per share for the company
which we round down to EUR7.25 to arrive at our
new target price. This is down from EUR8.0
previously due to reductions in our tariff
assumptions and new wind installation forecast, as
explained earlier.
This implies 67% potential return over one year,
which is above the 18.5% Neutral threshold for
volatile European stocks under HSBC’s research
model, so we maintain our Overweight (V) rating
on the stock.
Risks Downside risks to our view include:
EDPR operates in a regulated industry
environment and is dependent, in many cases,
on government subsidies (like PTC/ ITC or
treasury grants in the US market) to provide
adequate returns on investment – and
government subsidy regimes can change
dramatically
EDPR is mainly dependent on three key
markets – the US, Spain and Portugal. This
may prove to be inadequate mitigation of its
business risk
The company’s assessment of the quality of
its pipeline and, therefore, its ability to grow
may be overly optimistic
EDPR may not be able to secure appropriate
power purchasing agreements (PPAs) for its
operating assets in the US
EDPR may not be able to find enough windy
sites for development and, therefore, maintain
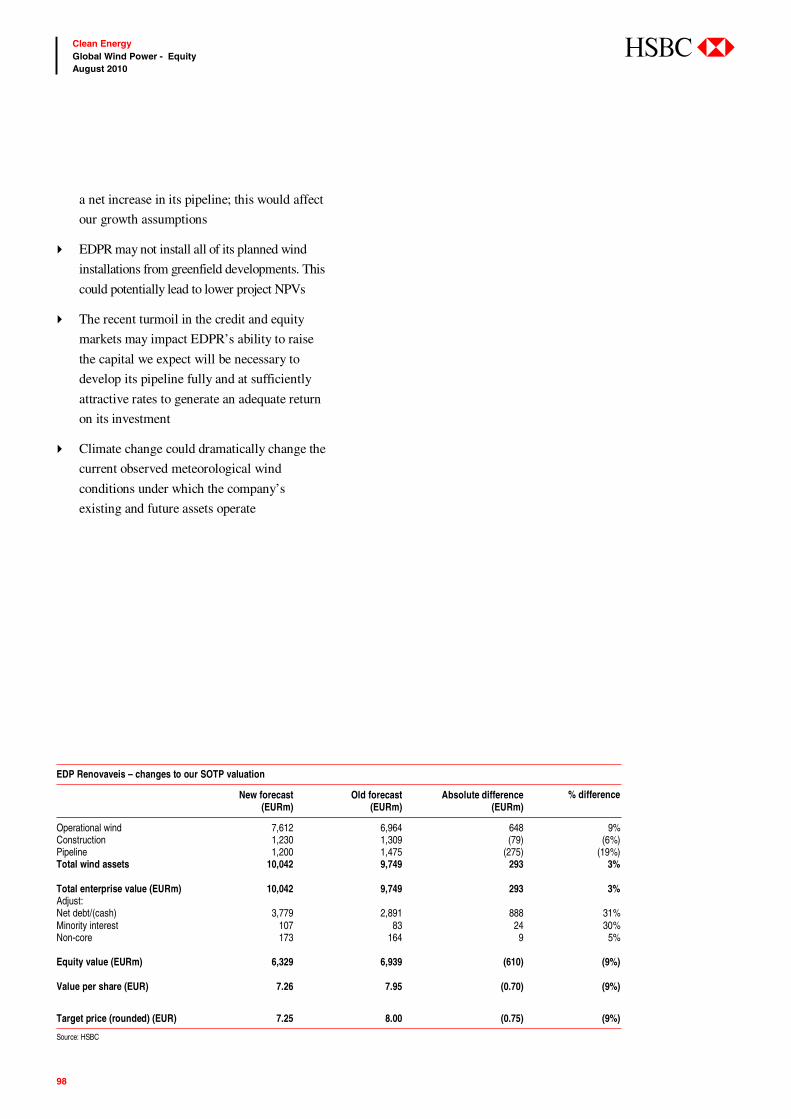
98
Clean Energy Global Wind Power - Equity August 2010
abc
a net increase in its pipeline; this would affect
our growth assumptions
EDPR may not install all of its planned wind
installations from greenfield developments. This
could potentially lead to lower project NPVs
The recent turmoil in the credit and equity
markets may impact EDPR’s ability to raise
the capital we expect will be necessary to
develop its pipeline fully and at sufficiently
attractive rates to generate an adequate return
on its investment
Climate change could dramatically change the
current observed meteorological wind
conditions under which the company’s
existing and future assets operate
EDP Renovaveis – changes to our SOTP valuation
New forecast (EURm)
Old forecast (EURm)
Absolute difference (EURm)
% difference
Operational wind 7,612 6,964 648 9% Construction 1,230 1,309 (79) (6%) Pipeline 1,200 1,475 (275) (19%) Total wind assets 10,042 9,749 293 3% Total enterprise value (EURm) 10,042 9,749 293 3% Adjust: Net debt/(cash) 3,779 2,891 888 31% Minority interest 107 83 24 30% Non-core 173 164 9 5% Equity value (EURm) 6,329 6,939 (610) (9%) Value per share (EUR) 7.26 7.95 (0.70) (9%)
Target price (rounded) (EUR) 7.25 8.00 (0.75) (9%)
Source: HSBC
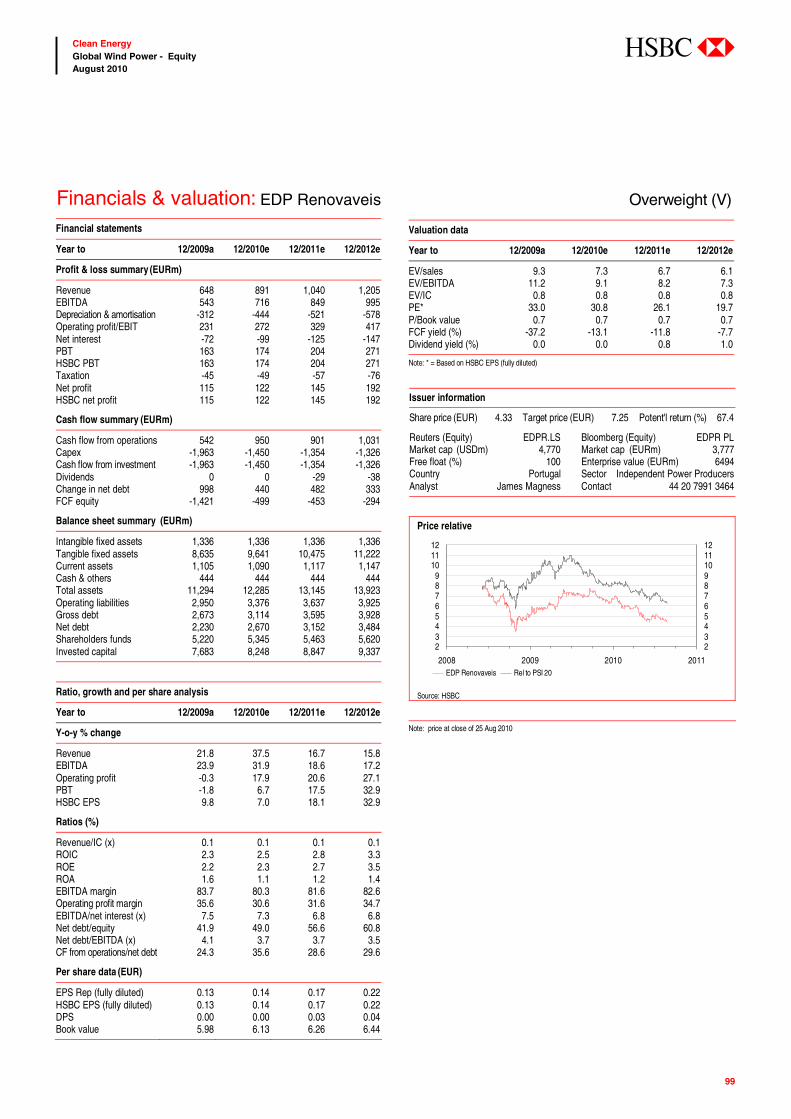
99
Clean Energy Global Wind Power - Equity August 2010
abc
Financials & valuation: EDP Renovaveis Overweight (V) Financial statements
Year to 12/2009a 12/2010e 12/2011e 12/2012e
Profit & loss summary (EURm)
Revenue 648 891 1,040 1,205EBITDA 543 716 849 995Depreciation & amortisation -312 -444 -521 -578Operating profit/EBIT 231 272 329 417Net interest -72 -99 -125 -147PBT 163 174 204 271HSBC PBT 163 174 204 271Taxation -45 -49 -57 -76Net profit 115 122 145 192HSBC net profit 115 122 145 192
Cash flow summary (EURm)
Cash flow from operations 542 950 901 1,031Capex -1,963 -1,450 -1,354 -1,326Cash flow from investment -1,963 -1,450 -1,354 -1,326Dividends 0 0 -29 -38Change in net debt 998 440 482 333FCF equity -1,421 -499 -453 -294
Balance sheet summary (EURm)
Intangible fixed assets 1,336 1,336 1,336 1,336Tangible fixed assets 8,635 9,641 10,475 11,222Current assets 1,105 1,090 1,117 1,147Cash & others 444 444 444 444Total assets 11,294 12,285 13,145 13,923Operating liabilities 2,950 3,376 3,637 3,925Gross debt 2,673 3,114 3,595 3,928Net debt 2,230 2,670 3,152 3,484Shareholders funds 5,220 5,345 5,463 5,620Invested capital 7,683 8,248 8,847 9,337
Ratio, growth and per share analysis
Year to 12/2009a 12/2010e 12/2011e 12/2012e
Y-o-y % change
Revenue 21.8 37.5 16.7 15.8EBITDA 23.9 31.9 18.6 17.2Operating profit -0.3 17.9 20.6 27.1PBT -1.8 6.7 17.5 32.9HSBC EPS 9.8 7.0 18.1 32.9
Ratios (%)
Revenue/IC (x) 0.1 0.1 0.1 0.1ROIC 2.3 2.5 2.8 3.3ROE 2.2 2.3 2.7 3.5ROA 1.6 1.1 1.2 1.4EBITDA margin 83.7 80.3 81.6 82.6Operating profit margin 35.6 30.6 31.6 34.7EBITDA/net interest (x) 7.5 7.3 6.8 6.8Net debt/equity 41.9 49.0 56.6 60.8Net debt/EBITDA (x) 4.1 3.7 3.7 3.5CF from operations/net debt 24.3 35.6 28.6 29.6
Per share data (EUR)
EPS Rep (fully diluted) 0.13 0.14 0.17 0.22HSBC EPS (fully diluted) 0.13 0.14 0.17 0.22DPS 0.00 0.00 0.03 0.04Book value 5.98 6.13 6.26 6.44
Valuation data
Year to 12/2009a 12/2010e 12/2011e 12/2012e
EV/sales 9.3 7.3 6.7 6.1EV/EBITDA 11.2 9.1 8.2 7.3EV/IC 0.8 0.8 0.8 0.8PE* 33.0 30.8 26.1 19.7P/Book value 0.7 0.7 0.7 0.7FCF yield (%) -37.2 -13.1 -11.8 -7.7Dividend yield (%) 0.0 0.0 0.8 1.0
Note: * = Based on HSBC EPS (fully diluted)
Issuer information
Share price (EUR) 4.33 Target price (EUR) 7.25 Potent'l return (%) 67.4
Reuters (Equity) EDPR.LS Bloomberg (Equity) EDPR PLMarket cap (USDm) 4,770 Market cap (EURm) 3,777Free float (%) 100 Enterprise value (EURm) 6494Country Portugal Sector Independent Power ProducersAnalyst James Magness Contact 44 20 7991 3464
Price relative
23456789
101112
2008 2009 2010 2011
23456789101112
EDP Renovaveis Rel to PSI 20
Source: HSBC Note: price at close of 25 Aug 2010

100
Clean Energy Global Wind Power - Equity August 2010
abc
Well diversified portfolio comes to rescue Whilst we have EDF EN on a Neutral (V) rating
really for valuation reasons, it has performed
relatively better than the rest of the developers due to
its lack of Spanish exposure and its well diversified
wind and solar installed capacity and development
pipeline. Compared to the other large wind-farm
developers/operators (see table on next page), EDF
EN has a much higher percentage of its wind farm
capacity (and sales) in the markets where there are
fixed tariffs or fixed-price PPAs.
This has helped EDF EN to considerably mitigate
regulatory risks due to change in wind regime in
one or more of its markets.
For example, EDF EN has zero exposure to the
Spanish wind market which has seen significant
regulatory uncertainty and considerable pressure
on spot electricity prices in the recent past.
EDF Energies Nouvelles (EEN FP)
Well diversified portfolio with good visibility on tariffs
Higher growth than other utility developers due to smaller
operating base
We have cut our target price to EUR34 (from EUR40) but maintain
our Neutral (V) rating
James Magness* Analyst HSBC Bank plc +44 20 7991 3464 [email protected]
Robert Clover * Analyst HSBC Bank plc +44 20 7991 6741 robert.clover @hsbcib.com
*Employed by a non-US affiliate of HSBC Securites (USA) Inc., and is not registered/qualified pursuant to FINRA regulations
EDF EN – geographical split of installed wind capacity at end H1 2010
EDF EN – geographical split of installed solar capacity at end H1 2010
Portugal
14%
Greece
9%UK
7%Italy
8%
US
41%
RoW 5% France
16%
France
44%
Spain
19%
US
5%
Italy
12%
Canada
20%
Source: company data, HSBC estimates Source: company data, HSBC estimates
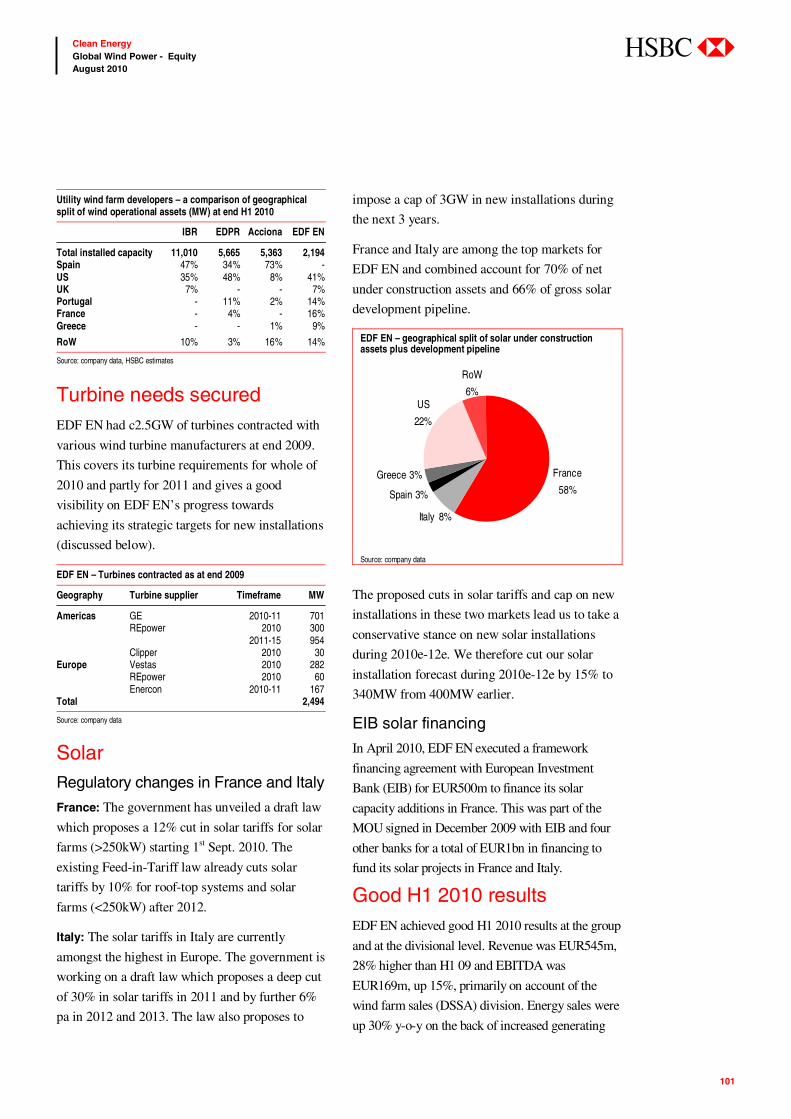
101
Clean Energy Global Wind Power - Equity August 2010
abc
Utility wind farm developers – a comparison of geographical split of wind operational assets (MW) at end H1 2010
IBR EDPR Acciona EDF EN
Total installed capacity 11,010 5,665 5,363 2,194 Spain 47% 34% 73% - US 35% 48% 8% 41% UK 7% - - 7% Portugal - 11% 2% 14% France - 4% - 16% Greece - - 1% 9%
RoW 10% 3% 16% 14%
Source: company data, HSBC estimates Turbine needs secured EDF EN had c2.5GW of turbines contracted with
various wind turbine manufacturers at end 2009.
This covers its turbine requirements for whole of
2010 and partly for 2011 and gives a good
visibility on EDF EN’s progress towards
achieving its strategic targets for new installations
(discussed below).
EDF EN – Turbines contracted as at end 2009
Geography Turbine supplier Timeframe MW
Americas GE 2010-11 701 REpower 2010 300 2011-15 954 Clipper 2010 30 Europe Vestas 2010 282 REpower 2010 60 Enercon 2010-11 167 Total 2,494
Source: company data
Solar Regulatory changes in France and Italy
France: The government has unveiled a draft law
which proposes a 12% cut in solar tariffs for solar
farms (>250kW) starting 1st Sept. 2010. The
existing Feed-in-Tariff law already cuts solar
tariffs by 10% for roof-top systems and solar
farms (<250kW) after 2012.
Italy: The solar tariffs in Italy are currently
amongst the highest in Europe. The government is
working on a draft law which proposes a deep cut
of 30% in solar tariffs in 2011 and by further 6%
pa in 2012 and 2013. The law also proposes to
impose a cap of 3GW in new installations during
the next 3 years.
France and Italy are among the top markets for
EDF EN and combined account for 70% of net
under construction assets and 66% of gross solar
development pipeline.
EDF EN – geographical split of solar under construction assets plus development pipeline
France
58%
Italy 8%
Spain 3%
Greece 3%
US
22%
RoW
6%
Source: company data
The proposed cuts in solar tariffs and cap on new
installations in these two markets lead us to take a
conservative stance on new solar installations
during 2010e-12e. We therefore cut our solar
installation forecast during 2010e-12e by 15% to
340MW from 400MW earlier.
EIB solar financing
In April 2010, EDF EN executed a framework
financing agreement with European Investment
Bank (EIB) for EUR500m to finance its solar
capacity additions in France. This was part of the
MOU signed in December 2009 with EIB and four
other banks for a total of EUR1bn in financing to
fund its solar projects in France and Italy.
Good H1 2010 results EDF EN achieved good H1 2010 results at the group
and at the divisional level. Revenue was EUR545m,
28% higher than H1 09 and EBITDA was
EUR169m, up 15%, primarily on account of the
wind farm sales (DSSA) division. Energy sales were
up 30% y-o-y on the back of increased generating

102
Clean Energy Global Wind Power - Equity August 2010
abc
capacity in the US and France and good wind
conditions in Portugal and in spite of unfavourable
wind conditions in the US and UK. Net wind
capacity under construction was 318MW.
Strong solar installations in H1 2010
During H1 2010, EDF EN installed 52MW (net)
which is much better than 6MW (net) installed in
H1 09. This was due to higher installations in
France and Spain during H1 10. Net solar capacity
under construction was 138MW.
On the back of strong installations in the first half
and higher capacity under construction, we raise
our solar installation forecast for 2010e to
120MW (net) from 100MW (net) earlier.
EDF EN’s strategic targets versus our forecast EDF EN has a strategic target of achieving
4.2GW of net installed capacity, including
500MW in solar capacity by 2012. This implies a
target to achieve 3,700MW net wind installed
capacity (a net addition of 1,667MW during 2010-
12 over its FY09 end capacity of 2,033MW).
We have cut our wind installation forecast for the
year 2010e mainly on account of short-term
regulatory uncertainty in the US but over the
period 2010e-12e we now forecast EDF EN to
add 1,525MW (previously 1,500MW) net wind
capacity reaching a net wind installed capacity of
3,558MW by 2012e.
EDF EN – Net wind installations forecast – new v old
MW 2010e 2011e 2012e
New forecast 375 625 525 Old forecast 475 525 500
Source: HSBC estimates
In solar, we have raised our installation forecast
for 2010e to 120MW from 100MW earlier due to
the strong solar installations and higher
construction assets at H1 2010 end. However, we
cut our installation forecast during 2010e-12e to
340MW from 400MW on the back of regulatory
changes in France and Italy, as mentioned earlier.
We now forecast EDF EN to achieve a net
installed capacity of 408MW by 2012e.
EDF EN – Net solar installations forecast – new v old
MW 2010e 2011e 2012e
New forecast 120 110 110 Old forecast 100 150 150
Source: HSBC estimates
Impact of changes on our forecast We update our model for FY2009 and H1 2010
actual figures. We raise our revenue forecast for
2010e-12e by around 9-12% and our 2010e-12e EPS
forecast by 8%-27% primarily on account of the
base effect due to better than expected H1 results.
EDF EN – Sales forecast (EURm) – new vs. old
0
500
1,000
1,500
2,000
2,500
2010e 2011e 2012e 2013e 2014e
New forecasts Prev ious forecasts
Source: HSBC estimates

103
Clean Energy Global Wind Power - Equity August 2010
abc
EDF EN – EPS forecast (EUR) – new vs. old
0.00
0.50
1.00
1.50
2.00
2.50
3.00
2010e 2011e 2012e 2013e 2014e
New forecasts Prev ious forecasts
Source: HSBC estimates
HSBC versus consensus EDF EN – Sales forecast: HSBC vs. consensus (EURm)
Year Low Mean High HSBC HSBC % above/ (below) mean
2010e 1,194 1,370 1,483 1,376 0% 2011e 1,409 1,565 1,681 1,599 2% 2012e 1,651 1,788 1,963 1,836 3%
Source: HSBC estimates EDF EN – EBITDA forecast: HSBC vs. consensus (EURm)
Low Mean High HSBC HSBC % above/ (below) mean
2010e 409 444 473 446 0% 2011e 521 575 613 569 -1% 2012e 713 728 741 690 -5%
Source: HSBC estimates
Valuation We value EDF EN using our DCF-derived SOTP
based valuation methodology, valuing its
operational assets, under construction assets and
the probability weighted development pipeline
separately.
EDF EN operates on “keep some – sell some”
business model meaning that it sells some of the
wind farms it develops and keep the rest for its
own account. (IBR, EDPR and ANA all operate a
100% build-to-keep business model).
We value EDF EN’s operational wind farm of
2,145MW at EUR3,523m with an average implied
value of EUR1.64m per MW. In addition, we
value the 318MW of construction assets at
EUR381m – assuming 50% of capex has been
incurred. We also value its gross wind
development pipeline (probability weighted) at
end H1 2010 of c14.9GW at EUR500m, implying
a value of EUR34,000/MW.
We value EDF EN’s other renewable assets
(mainly solar) using the same valuation
methodology.
We have not included any central overheads in
our valuation as we believe they are fully
reflected in our project-valuation models.
Using our basic SOTP methodology and year- and
country-specific WACC, EMRP and RFR for
each of EDF EN’s major markets, we derive a fair
value of EUR34.01 per share for the company
which we round off to EUR34 to arrive at our
target price, down from EUR40 previously. Our
new target price implies 11% potential return over
one year, which is within the Neutral band of -
1.5% to 18.5% for volatile European stocks, under
HSBC’s research model, so we maintain our
Neutral (V) rating on the stock.
In spite of our earnings estimate upgrades, our
price target has come down 15% relative to our
previously published target of EUR40, due to
reclassification of assets under construction on
account of project delays.
Risks Downside risks to our view include:
EDF EN operates in a regulated industry and
depends, in many cases, on government
subsidies to provide adequate returns on
investment – and government subsidy
regimes can change dramatically
EDF EN may not install all of its planned
wind installations from greenfield
developments. This could potentially lead to

104
Clean Energy Global Wind Power - Equity August 2010
abc
lower project NPVs than we have assumed in
our valuation of the company’s wind business
The recent turmoil in the credit and equity
markets may affect EDF EN’s ability to raise
the capital we expect will be necessary to
develop its pipeline fully and at rates
attractive enough to generate an adequate
return on its investment
We may have overestimated the quality of
EDF EN’s development pipeline
The wind resource at the company’s site may
not be as good as previously thought.
Moreover, it can vary significantly between
sites, and we have mainly adopted county
average capacity factor
Upside risks to our view include:
We may have underestimated the load factors
on EDF EN’s generation installations. These
may turn out to be better than forecast
We may get an unexpectedly positive result to
the regulatory uncertainty in the US.
EDF EN – changes to our SOTP valuation
New forecast (EURm) Old forecast (EURm) Absolute difference (EURm) % difference
Operational 3,523 2,753 771 28% Construction assets 381 755 (374) (49%) Pipeline 500 450 50 11% Build to keep wind assets 4,405 3,958 447 11% Build to sell wind assets 291 364 (73) (20%) O&M - 3rd party sales 156 135 21 16% Total wind 4,851 4,456 395 9% Other renewable 842 405 437 108% Distributed energies 289 244 44 18% Total enterprise value 5,982 5,105 877 17% Adjust: Net debt/(cash) 3,221 1,911 1,310 69% Minority interest 263 249 14 5% Non-core assets 140 122 18 15% Equity value (EURm) 2,638 3,067 (429.1) (14%) Value per share (EUR) 34.01 39.54 (5.5) (14%) Target price (rounded) (EUR) 34.00 40.00 (6.0) (15%)
Source: HSBC estimates

105
Clean Energy Global Wind Power - Equity August 2010
abc
Financials & valuation: Edf Energies Nouvelles Neutral (V) Financial statements
Year to 12/2009a 12/2010e 12/2011e 12/2012e
Profit & loss summary (EURm)
Revenue 1,173 1,376 1,599 1,836EBITDA 334 446 569 690Depreciation & amortisation -104 -142 -187 -228Operating profit/EBIT 230 305 381 461Net interest -104 -143 -173 -204PBT 126 161 208 257HSBC PBT 126 161 208 257Taxation -21 -45 -58 -72Net profit 98 109 143 178HSBC net profit 98 109 143 178
Cash flow summary (EURm)
Cash flow from operations -57 447 336 333Capex -1,278 -1,220 -1,096 -1,115Cash flow from investment -1,262 -1,220 -1,096 -1,115Dividends -23 -29 -33 -43Change in net debt 1,486 802 792 825FCF equity -1,262 -772 -759 -782
Balance sheet summary (EURm)
Intangible fixed assets 135 135 135 135Tangible fixed assets 3,594 4,672 5,580 6,466Current assets 2,006 1,684 1,810 2,015Cash & others 466 100 100 100Total assets 6,125 6,881 7,916 9,006Operating liabilities 945 1,178 1,304 1,427Gross debt 3,476 3,912 4,705 5,530Net debt 3,010 3,812 4,605 5,430Shareholders funds 1,310 1,390 1,499 1,634Invested capital 4,324 5,213 6,122 7,090
Ratio, growth and per share analysis
Year to 12/2009a 12/2010e 12/2011e 12/2012e
Y-o-y % change
Revenue 15.5 17.3 16.2 14.8EBITDA 47.3 33.6 27.4 21.3Operating profit 39.1 32.4 25.1 21.0PBT 8.6 28.2 28.9 23.6HSBC EPS 20.2 11.7 30.5 24.6
Ratios (%)
Revenue/IC (x) 0.3 0.3 0.3 0.3ROIC 5.4 4.6 4.8 5.0ROE 7.6 8.1 9.9 11.3ROA 2.0 1.8 2.0 2.2EBITDA margin 28.5 32.4 35.6 37.6Operating profit margin 19.6 22.1 23.8 25.1EBITDA/net interest (x) 3.2 3.1 3.3 3.4Net debt/equity 191.4 229.8 259.3 283.1Net debt/EBITDA (x) 9.0 8.5 8.1 7.9CF from operations/net debt 11.7 7.3 6.1
Per share data (EUR)
EPS Rep (fully diluted) 1.26 1.41 1.84 2.29HSBC EPS (fully diluted) 1.26 1.41 1.84 2.29DPS 0.38 0.42 0.55 0.69Book value 16.89 17.92 19.33 21.07
Valuation data
Year to 12/2009a 12/2010e 12/2011e 12/2012e
EV/sales 4.3 4.3 4.2 4.1EV/EBITDA 15.2 13.2 11.7 10.9EV/IC 1.2 1.1 1.1 1.1PE* 24.5 21.9 16.8 13.5P/Book value 1.8 1.7 1.6 1.5FCF yield (%) -61.2 -37.5 -36.8 -37.9Dividend yield (%) 1.2 1.4 1.8 2.2
Note: * = Based on HSBC EPS (fully diluted)
Issuer information
Share price (EUR) 30.89 Target price (EUR) 34.00 Potent'l return (%) 10.1
Reuters (Equity) EEN.PA Bloomberg (Equity) EEN FPMarket cap (USDm) 3,026 Market cap (EURm) 2,396Free float (%) 100 Enterprise value (EURm) 5875Country France Sector Independent Power ProducersAnalyst James Magness Contact 44 20 7991 3464
Price relative
14
24
34
44
54
64
2008 2009 2010 2011
14
24
34
44
54
64
Edf Energies Nouvelles Rel to SBF-120
Source: HSBC Note: price at close of 25 Aug 2010
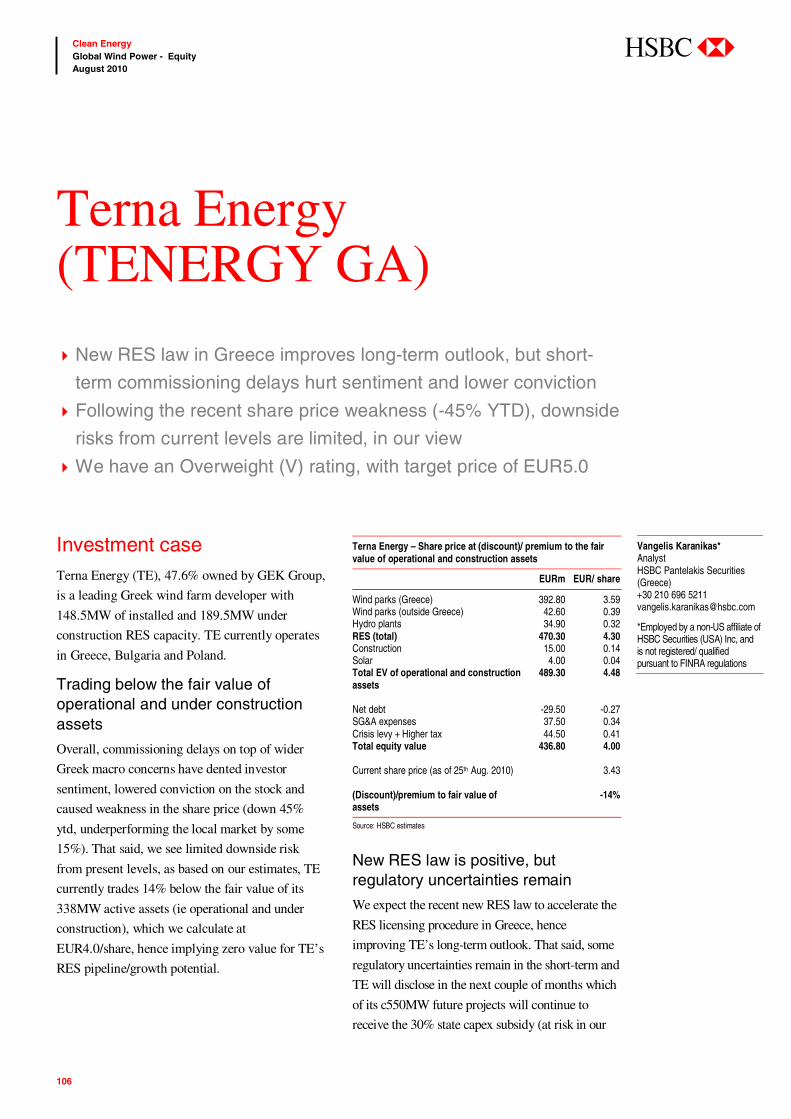
106
Clean Energy Global Wind Power - Equity August 2010
abc
Investment case Terna Energy (TE), 47.6% owned by GEK Group,
is a leading Greek wind farm developer with
148.5MW of installed and 189.5MW under
construction RES capacity. TE currently operates
in Greece, Bulgaria and Poland.
Trading below the fair value of operational and under construction assets
Overall, commissioning delays on top of wider
Greek macro concerns have dented investor
sentiment, lowered conviction on the stock and
caused weakness in the share price (down 45%
ytd, underperforming the local market by some
15%). That said, we see limited downside risk
from present levels, as based on our estimates, TE
currently trades 14% below the fair value of its
338MW active assets (ie operational and under
construction), which we calculate at
EUR4.0/share, hence implying zero value for TE’s
RES pipeline/growth potential.
Terna Energy – Share price at (discount)/ premium to the fair value of operational and construction assets
EURm EUR/ share
Wind parks (Greece) 392.80 3.59 Wind parks (outside Greece) 42.60 0.39 Hydro plants 34.90 0.32 RES (total) 470.30 4.30 Construction 15.00 0.14 Solar 4.00 0.04 Total EV of operational and construction assets
489.30 4.48
Net debt -29.50 -0.27 SG&A expenses 37.50 0.34 Crisis levy + Higher tax 44.50 0.41 Total equity value 436.80 4.00 Current share price (as of 25th Aug. 2010) 3.43 (Discount)/premium to fair value of assets
-14%
Source: HSBC estimates
New RES law is positive, but regulatory uncertainties remain
We expect the recent new RES law to accelerate the
RES licensing procedure in Greece, hence
improving TE’s long-term outlook. That said, some
regulatory uncertainties remain in the short-term and
TE will disclose in the next couple of months which
of its c550MW future projects will continue to
receive the 30% state capex subsidy (at risk in our
Terna Energy (TENERGY GA)
New RES law in Greece improves long-term outlook, but short-
term commissioning delays hurt sentiment and lower conviction
Following the recent share price weakness (-45% YTD), downside
risks from current levels are limited, in our view
We have an Overweight (V) rating, with target price of EUR5.0
Vangelis Karanikas* Analyst HSBC Pantelakis Securities (Greece) +30 210 696 5211 [email protected]
*Employed by a non-US affiliate of HSBC Securities (USA) Inc, and is not registered/ qualified pursuant to FINRA regulations

107
Clean Energy Global Wind Power - Equity August 2010
abc
view, given the weak public finances) or enjoy a
20% higher feed-in tariff instead. On our estimates,
any change is valuation neutral for TE.
Changes to our forecasts At this juncture, we are keeping our installation
and financial forecasts for Terna Energy
unchanged as from our last note on Terna
(“Commissioning delays lower conviction” by
Vangelis Karanikas, published on 16 June 2010).
Outlook for 2010 We overall expect 2010 to be poor, with 2010e
recurring EPS seen falling 32% y-o-y to EUR0.11
(largely driven by construction activities, 19%
below consensus), before a strong recovery in
2011e (+78% to EUR0.19, 2% below consensus)
purely on the back of capacity additions and
abroad, as we expect the 2010e-11e feed-in tariffs
to remain at current levels of EUR87.8/MWh. All
in all, we forecast TE to have installed capacity of
177MW and 380MW by end-2010e and 2011e,
respectively (below TE’s guidance).
HSBC v consensus Terna Energy – Sales forecast: HSBC vs. consensus (EURm)
Year Low Mean High HSBC HSBC % above/ (below) mean
2010e 65 75 98 65 -13% 2011e 91 106 145 91 -14% 2012e 119 152 232 136 -11%
Source: HSBC estimates, Bloomberg Terna Energy – EBITDA forecast: HSBC vs. consensus (EURm)
Low Mean High HSBC HSBC % above/ (below) mean
2010e 26 33 51 26 -23% 2011e 46 58 89 46 -21% 2012e 68 94 157 81 -14%
Source: HSBC estimates, Bloomberg
Terna Energy – EPS forecast: HSBC vs. consensus (EUR)
Low Mean High HSBC HSBC % above/ (below) mean
2010e 0.10 0.15 0.29 0.11 -25% 2011e 0.15 0.23 0.45 0.19 -17% 2012e 0.20 0.39 0.84 0.35 -10%
Source: HSBC estimates, Bloomberg
Catalysts A new RES law was recently voted by the Greek
parliament, which we expect to significantly
reduce red tape and accelerate the RES licensing
procedure in the country, hence improving the
sector’s long-term outlook. Furthermore, the new
law introduces a new tariff regime, effectively
applying a 20% feed-in tariff increase for those
RES projects that will not receive the 30% state
capex subsidy. TE said that the evaluation process
for 550MW of wind farm capacity is currently
underway by the relevant authorities and TE will
be informed by September which of the above
projects will receive state subsidies or enjoy the
20% tariff hike. Based on our initial estimates,
ceteris paribus, the new tariff regime should have
little or no impact on TE’s valuation but it should
positively affect TE’s operating profitability. In
our view, the potential abolition of the current
state subsidy regime should overall favour larger
industry players with strong balance sheets and
easier access to project financing. That said, we
do not expect TE to face any financing constraints
in light of the higher borrowing needs.
In our view, the key catalysts to TE’s short-term
performance are good progress in a)
commissioning new capacity in Greece, b) the
200-300MW of installation licences that TE
expects to receive by year-end in Greece, and c)
international expansion. We expect TE to provide
a more detailed target on new installations in H2
2010. Assuming 250MW start construction by
year-end in Greece, our SOTP based fair value
would rise to EUR6.1 (or 22%) on our estimates.
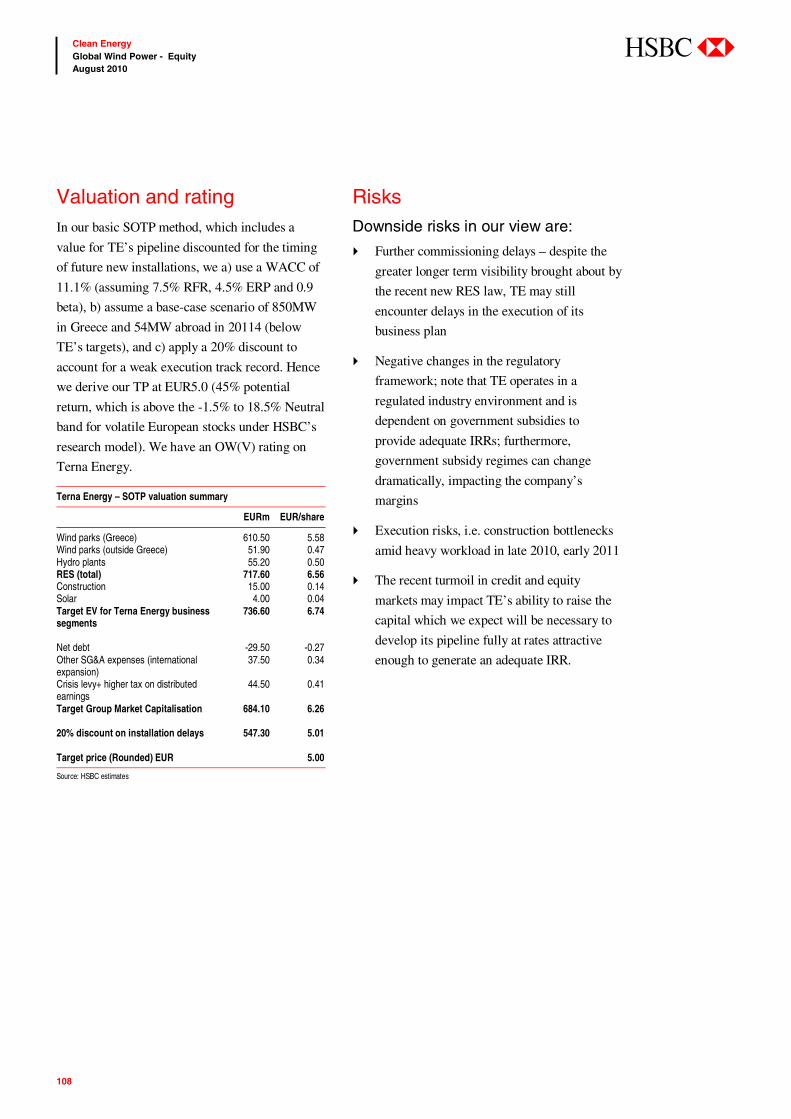
108
Clean Energy Global Wind Power - Equity August 2010
abc
Valuation and rating In our basic SOTP method, which includes a
value for TE’s pipeline discounted for the timing
of future new installations, we a) use a WACC of
11.1% (assuming 7.5% RFR, 4.5% ERP and 0.9
beta), b) assume a base-case scenario of 850MW
in Greece and 54MW abroad in 20114 (below
TE’s targets), and c) apply a 20% discount to
account for a weak execution track record. Hence
we derive our TP at EUR5.0 (45% potential
return, which is above the -1.5% to 18.5% Neutral
band for volatile European stocks under HSBC’s
research model). We have an OW(V) rating on
Terna Energy.
Terna Energy – SOTP valuation summary
EURm EUR/share
Wind parks (Greece) 610.50 5.58 Wind parks (outside Greece) 51.90 0.47 Hydro plants 55.20 0.50 RES (total) 717.60 6.56 Construction 15.00 0.14 Solar 4.00 0.04 Target EV for Terna Energy business segments
736.60 6.74
Net debt -29.50 -0.27 Other SG&A expenses (international expansion)
37.50 0.34
Crisis levy+ higher tax on distributed earnings
44.50 0.41
Target Group Market Capitalisation 684.10 6.26 20% discount on installation delays 547.30 5.01 Target price (Rounded) EUR 5.00
Source: HSBC estimates
Risks Downside risks in our view are:
Further commissioning delays – despite the
greater longer term visibility brought about by
the recent new RES law, TE may still
encounter delays in the execution of its
business plan
Negative changes in the regulatory
framework; note that TE operates in a
regulated industry environment and is
dependent on government subsidies to
provide adequate IRRs; furthermore,
government subsidy regimes can change
dramatically, impacting the company’s
margins
Execution risks, i.e. construction bottlenecks
amid heavy workload in late 2010, early 2011
The recent turmoil in credit and equity
markets may impact TE’s ability to raise the
capital which we expect will be necessary to
develop its pipeline fully at rates attractive
enough to generate an adequate IRR.
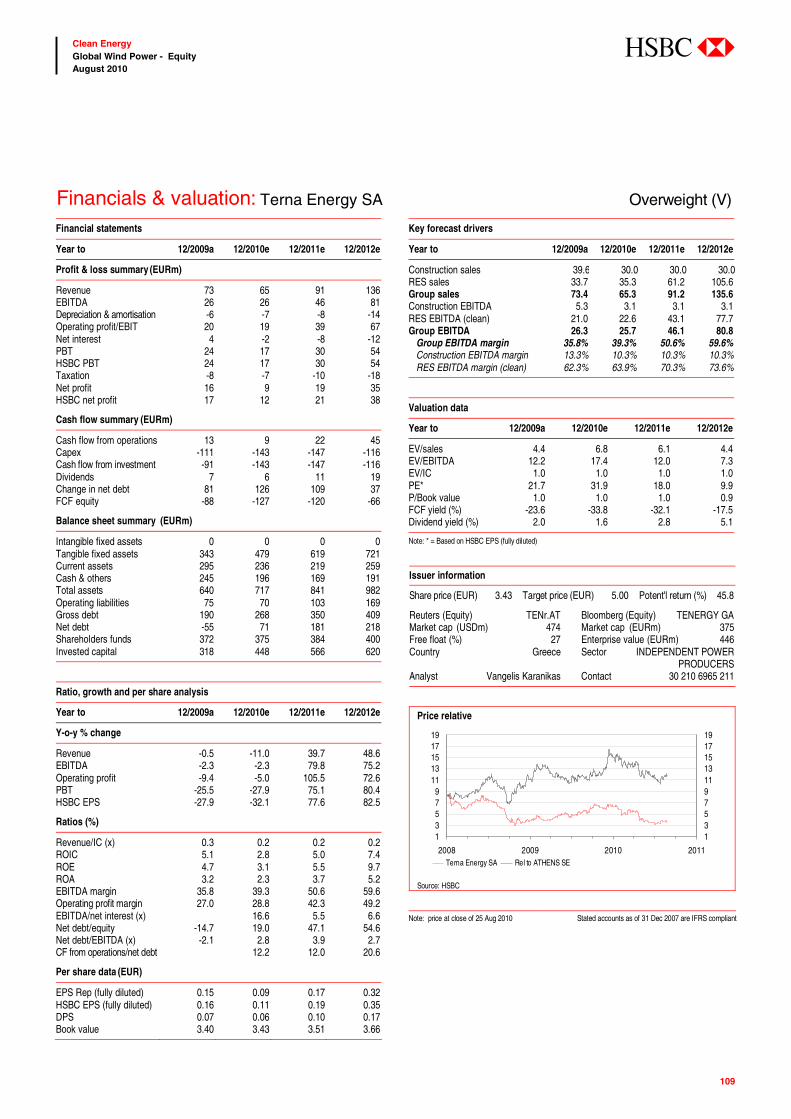
109
Clean Energy Global Wind Power - Equity August 2010
abc
Financials & valuation: Terna Energy SA Overweight (V) Financial statements
Year to 12/2009a 12/2010e 12/2011e 12/2012e
Profit & loss summary (EURm)
Revenue 73 65 91 136EBITDA 26 26 46 81Depreciation & amortisation -6 -7 -8 -14Operating profit/EBIT 20 19 39 67Net interest 4 -2 -8 -12PBT 24 17 30 54HSBC PBT 24 17 30 54Taxation -8 -7 -10 -18Net profit 16 9 19 35HSBC net profit 17 12 21 38
Cash flow summary (EURm)
Cash flow from operations 13 9 22 45Capex -111 -143 -147 -116Cash flow from investment -91 -143 -147 -116Dividends 7 6 11 19Change in net debt 81 126 109 37FCF equity -88 -127 -120 -66
Balance sheet summary (EURm)
Intangible fixed assets 0 0 0 0Tangible fixed assets 343 479 619 721Current assets 295 236 219 259Cash & others 245 196 169 191Total assets 640 717 841 982Operating liabilities 75 70 103 169Gross debt 190 268 350 409Net debt -55 71 181 218Shareholders funds 372 375 384 400Invested capital 318 448 566 620
Ratio, growth and per share analysis
Year to 12/2009a 12/2010e 12/2011e 12/2012e
Y-o-y % change
Revenue -0.5 -11.0 39.7 48.6EBITDA -2.3 -2.3 79.8 75.2Operating profit -9.4 -5.0 105.5 72.6PBT -25.5 -27.9 75.1 80.4HSBC EPS -27.9 -32.1 77.6 82.5
Ratios (%)
Revenue/IC (x) 0.3 0.2 0.2 0.2ROIC 5.1 2.8 5.0 7.4ROE 4.7 3.1 5.5 9.7ROA 3.2 2.3 3.7 5.2EBITDA margin 35.8 39.3 50.6 59.6Operating profit margin 27.0 28.8 42.3 49.2EBITDA/net interest (x) 16.6 5.5 6.6Net debt/equity -14.7 19.0 47.1 54.6Net debt/EBITDA (x) -2.1 2.8 3.9 2.7CF from operations/net debt 12.2 12.0 20.6
Per share data (EUR)
EPS Rep (fully diluted) 0.15 0.09 0.17 0.32HSBC EPS (fully diluted) 0.16 0.11 0.19 0.35DPS 0.07 0.06 0.10 0.17Book value 3.40 3.43 3.51 3.66
Key forecast drivers
Year to 12/2009a 12/2010e 12/2011e 12/2012e
Construction sales 39.6 30.0 30.0 30.0RES sales 33.7 35.3 61.2 105.6Group sales 73.4 65.3 91.2 135.6Construction EBITDA 5.3 3.1 3.1 3.1RES EBITDA (clean) 21.0 22.6 43.1 77.7Group EBITDA 26.3 25.7 46.1 80.8 Group EBITDA margin 35.8% 39.3% 50.6% 59.6% Construction EBITDA margin 13.3% 10.3% 10.3% 10.3% RES EBITDA margin (clean) 62.3% 63.9% 70.3% 73.6%
Valuation data
Year to 12/2009a 12/2010e 12/2011e 12/2012e
EV/sales 4.4 6.8 6.1 4.4EV/EBITDA 12.2 17.4 12.0 7.3EV/IC 1.0 1.0 1.0 1.0PE* 21.7 31.9 18.0 9.9P/Book value 1.0 1.0 1.0 0.9FCF yield (%) -23.6 -33.8 -32.1 -17.5Dividend yield (%) 2.0 1.6 2.8 5.1
Note: * = Based on HSBC EPS (fully diluted)
Issuer information
Share price (EUR) 3.43 Target price (EUR) 5.00 Potent'l return (%) 45.8
Reuters (Equity) TENr.AT Bloomberg (Equity) TENERGY GAMarket cap (USDm) 474 Market cap (EURm) 375Free float (%) 27 Enterprise value (EURm) 446Country Greece Sector INDEPENDENT POWER
PRODUCERSAnalyst Vangelis Karanikas Contact 30 210 6965 211
Price relative
13579
1113151719
2008 2009 2010 2011
135791113151719
Terna Energy SA Rel to ATHENS SE
Source: HSBC Note: price at close of 25 Aug 2010 Stated accounts as of 31 Dec 2007 are IFRS compliant

110
Clean Energy Global Wind Power - Equity August 2010
abc
Clipper: above average growth We are upgrading Clipper from N(V) to OW(V)
on the basis of both valuation and expected
catalysts. We note that on valuation terms, at just
44p, Clipper is trading below the value of the cash
on balance sheet of 46p .We believe that this is
unjustified as it completely discounts the value of
its wind turbine business and its project
development pipeline. The recent agreement with
UTC to provide warranty support should be a
major step in helping Clipper realise potential
orders.
Thus while it may appear to be a US play, where
we note that the market is currently difficult, we
feel that Clipper looks better placed than some of
its larger competitors to show above average
growth from a lower base.
Agreement with UTC & Pratt & Whitney Clipper announced in a trading update on 27 July
that it is finalizing an agreement with UTC, its
majority shareholder, to provide Liberty wind
turbines warranty support. We believe that this
will help Clipper in marketing its turbines.
Clipper also announced that it is targeting
international expansion outside of the US into the
major global economies and the emerging
markets. We believe that this is a positive
development as it will diversify its customer base
geographically and reduce its reliance on the US
market where we expect growth to be flat over the
next five years (2009-14e).
Valuation looks appealing Clipper has been one of the worst performing
wind stock over the last couple of years. It is
currently trading at an all-time low and is c90%
below its level immediately pre-credit crisis (and
95% below its all-time high of 918p). It has
underperformed its local market by 50% since
mid-April.
We believe that Clipper’s stock is currently
trading at attractive levels and offers significant
potential return.
Apart from its core wind turbine business, Clipper
also has c9GW of wind development assets of
which more than 1,000MW are advanced stage
Clipper (CWP LN)
Clipper is looking to reduce its reliance on the US domestic
market by expanding its sales abroad
Agreements with UTC regarding warranty and with Pratt &
Whitney to sell & service its turbines are positive developments
We increase our target price to 100p (from 90p) and we upgrade
the stock to Overweight (V) from Neutral (V)
Robert Clover * Analyst HSBC Bank plc +44 20 7991 6741 robert.clover @hsbcib.com
James Magness* Analyst HSBC Bank plc +44 20 7991 3464 [email protected]
*Employed by a non-US affiliate of HSBC Securites (USA) Inc., and is not registered/qualified pursuant to FINRA regulations
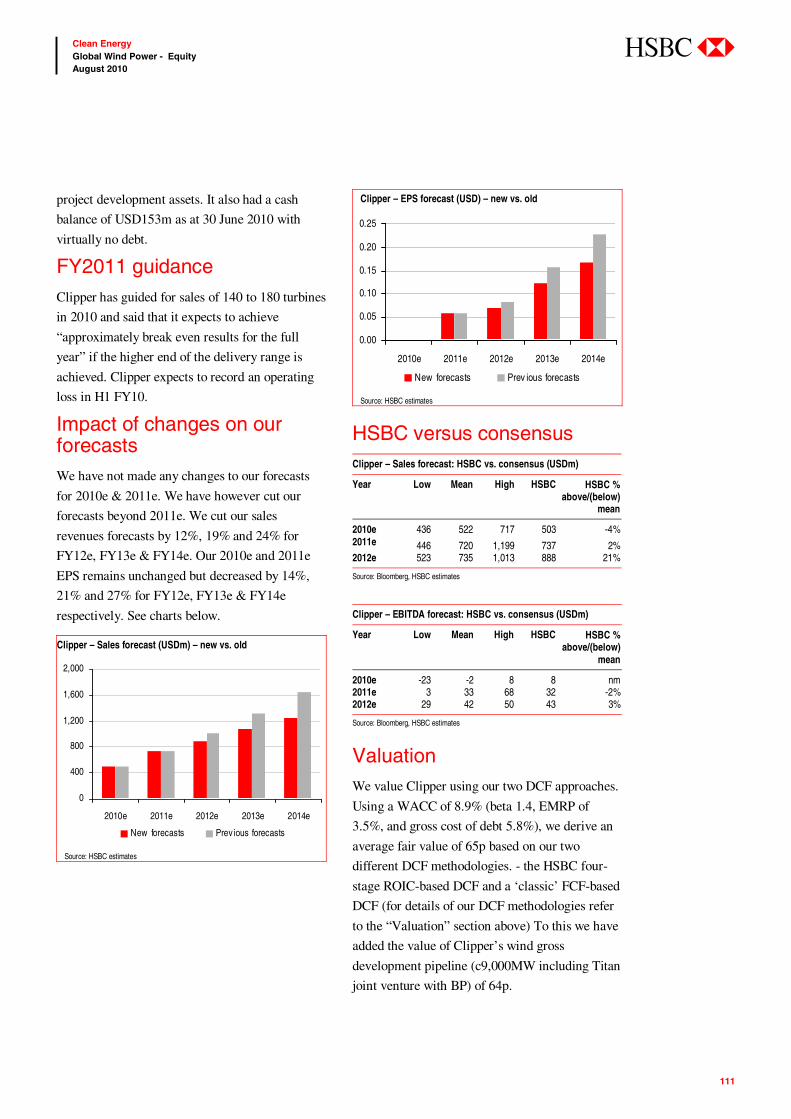
111
Clean Energy Global Wind Power - Equity August 2010
abc
project development assets. It also had a cash
balance of USD153m as at 30 June 2010 with
virtually no debt.
FY2011 guidance Clipper has guided for sales of 140 to 180 turbines
in 2010 and said that it expects to achieve
“approximately break even results for the full
year” if the higher end of the delivery range is
achieved. Clipper expects to record an operating
loss in H1 FY10.
Impact of changes on our forecasts We have not made any changes to our forecasts
for 2010e & 2011e. We have however cut our
forecasts beyond 2011e. We cut our sales
revenues forecasts by 12%, 19% and 24% for
FY12e, FY13e & FY14e. Our 2010e and 2011e
EPS remains unchanged but decreased by 14%,
21% and 27% for FY12e, FY13e & FY14e
respectively. See charts below.
Clipper – Sales forecast (USDm) – new vs. old
0
400
800
1,200
1,600
2,000
2010e 2011e 2012e 2013e 2014e
New forecasts Prev ious forecasts
Source: HSBC estimates
Clipper – EPS forecast (USD) – new vs. old
0.00
0.05
0.10
0.15
0.20
0.25
2010e 2011e 2012e 2013e 2014e
New forecasts Prev ious forecasts
Source: HSBC estimates
HSBC versus consensus Clipper – Sales forecast: HSBC vs. consensus (USDm)
Year Low Mean High HSBC HSBC % above/(below)
mean
2010e 436 522 717 503 -4% 2011e 446 720 1,199 737 2% 2012e 523 735 1,013 888 21%
Source: Bloomberg, HSBC estimates Clipper – EBITDA forecast: HSBC vs. consensus (USDm)
Year Low Mean High HSBC HSBC % above/(below)
mean
2010e -23 -2 8 8 nm 2011e 3 33 68 32 -2% 2012e 29 42 50 43 3%
Source: Bloomberg, HSBC estimates
Valuation We value Clipper using our two DCF approaches.
Using a WACC of 8.9% (beta 1.4, EMRP of
3.5%, and gross cost of debt 5.8%), we derive an
average fair value of 65p based on our two
different DCF methodologies. - the HSBC four-
stage ROIC-based DCF and a ‘classic’ FCF-based
DCF (for details of our DCF methodologies refer
to the “Valuation” section above) To this we have
added the value of Clipper’s wind gross
development pipeline (c9,000MW including Titan
joint venture with BP) of 64p.

112
Clean Energy Global Wind Power - Equity August 2010
abc
For valuing Clipper’s wind development
portfolio, we have assumed that all of its wind
development assets are in an early stage (implying
initial land control and active negotiations and
holdings), to which we ascribe a value of
USD45.5 per KW (versus USD 34 previously)
using a probability-weighted model. This gives us
a fair value including pipeline of 128p. To this
we apply a discount of 20% due to the prevailing
uncertainty over the climate bill in the US. This
gives us our target price of 100p (rounded) (from
90p before). Our target price has gone up, not
down, in spite of our medium term estimate
reductions as this impact has been more than
offset by the increase in our estimate of the
development pipeline.
Under our research model, for stocks with a
volatility indicator, the Neutral band is +/-10ppt
around the hurdle rate of 8% for UK stocks. Our
12-month target price of 100p implies a potential
return of c130%, which is above the Neutral band;
thus, we rate the stock Overweight (V).
Risks Downside risks to our view include: Lack of financing could seriously impact the
company’s performance and could also dent
the ability of its clients to develop their
pipelines
Our MW sales assumptions may be too
optimistic if the market recovery is slower or
less pronounced than our expectations
Favourable tariffs and incentives could be
withdrawn by governments, which may turn
less supportive of renewables in light of
increasing government borrowings
Orders expected by us may not materialise
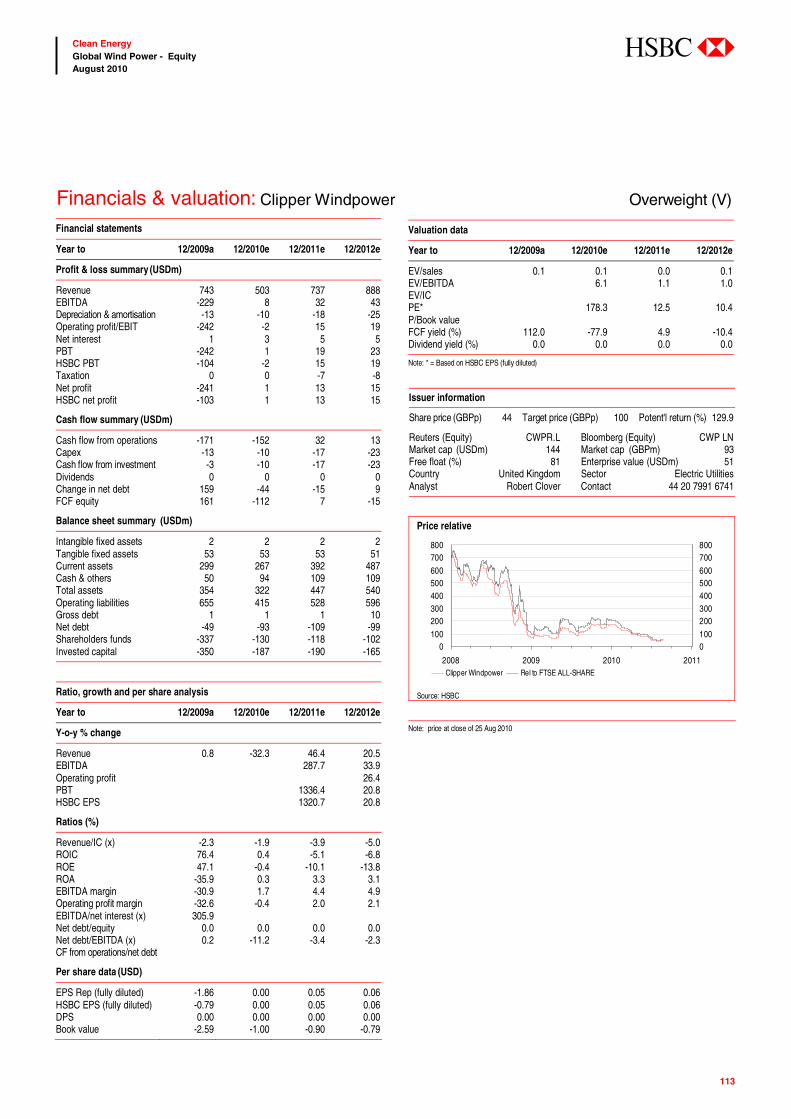
113
Clean Energy Global Wind Power - Equity August 2010
abc
Financials & valuation: Clipper Windpower Overweight (V) Financial statements
Year to 12/2009a 12/2010e 12/2011e 12/2012e
Profit & loss summary (USDm)
Revenue 743 503 737 888EBITDA -229 8 32 43Depreciation & amortisation -13 -10 -18 -25Operating profit/EBIT -242 -2 15 19Net interest 1 3 5 5PBT -242 1 19 23HSBC PBT -104 -2 15 19Taxation 0 0 -7 -8Net profit -241 1 13 15HSBC net profit -103 1 13 15
Cash flow summary (USDm)
Cash flow from operations -171 -152 32 13Capex -13 -10 -17 -23Cash flow from investment -3 -10 -17 -23Dividends 0 0 0 0Change in net debt 159 -44 -15 9FCF equity 161 -112 7 -15
Balance sheet summary (USDm)
Intangible fixed assets 2 2 2 2Tangible fixed assets 53 53 53 51Current assets 299 267 392 487Cash & others 50 94 109 109Total assets 354 322 447 540Operating liabilities 655 415 528 596Gross debt 1 1 1 10Net debt -49 -93 -109 -99Shareholders funds -337 -130 -118 -102Invested capital -350 -187 -190 -165
Ratio, growth and per share analysis
Year to 12/2009a 12/2010e 12/2011e 12/2012e
Y-o-y % change
Revenue 0.8 -32.3 46.4 20.5EBITDA 287.7 33.9Operating profit 26.4PBT 1336.4 20.8HSBC EPS 1320.7 20.8
Ratios (%)
Revenue/IC (x) -2.3 -1.9 -3.9 -5.0ROIC 76.4 0.4 -5.1 -6.8ROE 47.1 -0.4 -10.1 -13.8ROA -35.9 0.3 3.3 3.1EBITDA margin -30.9 1.7 4.4 4.9Operating profit margin -32.6 -0.4 2.0 2.1EBITDA/net interest (x) 305.9 Net debt/equity 0.0 0.0 0.0 0.0Net debt/EBITDA (x) 0.2 -11.2 -3.4 -2.3CF from operations/net debt
Per share data (USD)
EPS Rep (fully diluted) -1.86 0.00 0.05 0.06HSBC EPS (fully diluted) -0.79 0.00 0.05 0.06DPS 0.00 0.00 0.00 0.00Book value -2.59 -1.00 -0.90 -0.79
Valuation data
Year to 12/2009a 12/2010e 12/2011e 12/2012e
EV/sales 0.1 0.1 0.0 0.1EV/EBITDA 6.1 1.1 1.0EV/IC PE* 178.3 12.5 10.4P/Book value FCF yield (%) 112.0 -77.9 4.9 -10.4Dividend yield (%) 0.0 0.0 0.0 0.0
Note: * = Based on HSBC EPS (fully diluted)
Issuer information
Share price (GBPp) 44 Target price (GBPp) 100 Potent'l return (%) 129.9
Reuters (Equity) CWPR.L Bloomberg (Equity) CWP LNMarket cap (USDm) 144 Market cap (GBPm) 93Free float (%) 81 Enterprise value (USDm) 51Country United Kingdom Sector Electric UtilitiesAnalyst Robert Clover Contact 44 20 7991 6741
Price relative
0100200300400500600700800
2008 2009 2010 2011
0100200300400500600700800
Clipper Windpower Rel to FTSE ALL-SHARE
Source: HSBC Note: price at close of 25 Aug 2010

114
Clean Energy Global Wind Power - Equity August 2010
abc
Constrained for growth In 2006, Gamesa decided to focus on the high
growth markets of Spain, the US and China in
order to drive its growth. Ironically, this strategy
of Gamesa has started to unravel, partly due to
macro events, as both Spain and the US are
amongst the markets most impacted by regulatory
uncertainty. Further as our analysis shows, we
also expect these markets to have slow growth
rates in the near to mid term in future.
We forecast a five-year CAGR (2009-14e) of 0%
for the US and negative 8% for Spain. We expect
Gamesa’s other key markets in Europe, Italy and
Portugal, to also have a five year CAGR of 0%
and of minus 6% respectively.
China, the remaining major focus market for
Gamesa, remains highly competitive and is
dominated by domestic turbine manufacturers like
Sinovel, Goldwind and Dongfang.
In order to revive growth Gamesa is diversifying its
geographic footprint and has entered five new
markets since the beginning of 2010. It is also
looking to diversify its customer base to include
small and medium sized developers and independent
power producers. However, in the near to mid term,
we believe that Gamesa’s growth is inextricably
linked to the growth of the renewable markets in its
domestic market of Spain.
Q2 results in-line but outlook less rosy Gamesa’s Q2FY10 results were a bit above
consensus at the EBIT and net income line. Q2
revenue was EUR559m, 10% below Bloomberg
consensus of EUR618m. EBIT was EUR26m
versus consensus of EUR25m. Net income was
EUR14m versus consensus of EUR12m.
However, the outlook looks less rosy with
Gamesa cutting its volume sales guidance to 2.4-
2.5GW for FY10 (from 2.7-3.0GW previously).
EBIT margin guidance was cut to 4.5-5.5% (from
6-7% previously) for the wind turbine business.
Gamesa also reduced its volume sales guidance
for FY11 to 2.7-3.3GW from more than 3.6GW
previously. We are forecasting c2.4GW of sales
for FY2010e and c2.8GW of sales for FY11e. Our
EBIT margin for FY10e is 4.7%.
Gamesa (GAM SM)
Gamesa’s exposure to ex-growth markets of Spain and the US is
problematic; Chinese market remains fiercely competitive
Gamesa is trying to diversify its customer base but we believe that
its efforts are yet to yield results
We cut our target price to EUR5.50 (from EUR14.0) and rating to
N(V) from OW(V) due to lower industry growth expectations
Robert Clover * Analyst HSBC Bank plc +44 20 7991 6741 robert.clover @hsbcib.com
James Magness* Analyst HSBC Bank plc +44 20 7991 3464 [email protected]
*Employed by a non-US affiliate of HSBC Securites (USA) Inc., and is not registered/qualified pursuant to FINRA regulations
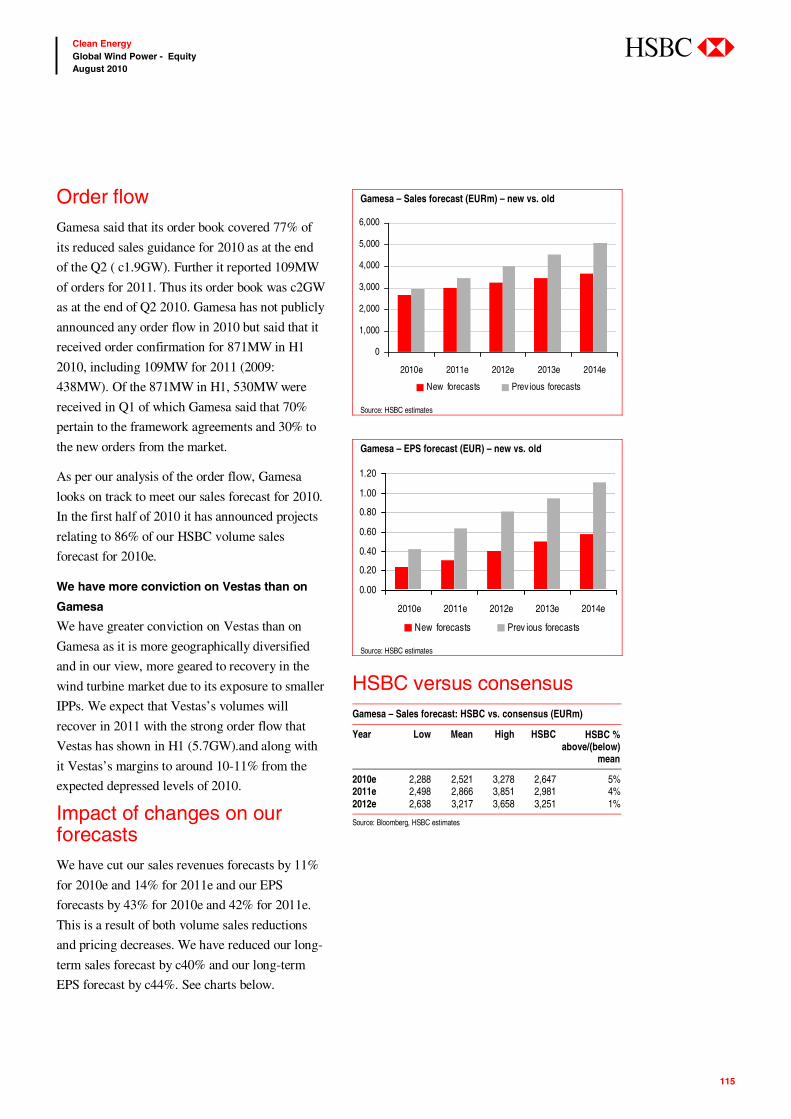
115
Clean Energy Global Wind Power - Equity August 2010
abc
Order flow Gamesa said that its order book covered 77% of
its reduced sales guidance for 2010 as at the end
of the Q2 ( c1.9GW). Further it reported 109MW
of orders for 2011. Thus its order book was c2GW
as at the end of Q2 2010. Gamesa has not publicly
announced any order flow in 2010 but said that it
received order confirmation for 871MW in H1
2010, including 109MW for 2011 (2009:
438MW). Of the 871MW in H1, 530MW were
received in Q1 of which Gamesa said that 70%
pertain to the framework agreements and 30% to
the new orders from the market.
As per our analysis of the order flow, Gamesa
looks on track to meet our sales forecast for 2010.
In the first half of 2010 it has announced projects
relating to 86% of our HSBC volume sales
forecast for 2010e.
We have more conviction on Vestas than on
Gamesa
We have greater conviction on Vestas than on
Gamesa as it is more geographically diversified
and in our view, more geared to recovery in the
wind turbine market due to its exposure to smaller
IPPs. We expect that Vestas’s volumes will
recover in 2011 with the strong order flow that
Vestas has shown in H1 (5.7GW).and along with
it Vestas’s margins to around 10-11% from the
expected depressed levels of 2010.
Impact of changes on our forecasts We have cut our sales revenues forecasts by 11%
for 2010e and 14% for 2011e and our EPS
forecasts by 43% for 2010e and 42% for 2011e.
This is a result of both volume sales reductions
and pricing decreases. We have reduced our long-
term sales forecast by c40% and our long-term
EPS forecast by c44%. See charts below.
Gamesa – Sales forecast (EURm) – new vs. old
0
1,000
2,000
3,000
4,000
5,000
6,000
2010e 2011e 2012e 2013e 2014e
New forecasts Prev ious forecasts
Source: HSBC estimates
Gamesa – EPS forecast (EUR) – new vs. old
0.00
0.20
0.40
0.60
0.80
1.00
1.20
2010e 2011e 2012e 2013e 2014e
New forecasts Prev ious forecasts
Source: HSBC estimates
HSBC versus consensus Gamesa – Sales forecast: HSBC vs. consensus (EURm)
Year Low Mean High HSBC HSBC % above/(below)
mean
2010e 2,288 2,521 3,278 2,647 5% 2011e 2,498 2,866 3,851 2,981 4% 2012e 2,638 3,217 3,658 3,251 1%
Source: Bloomberg, HSBC estimates
116
Clean Energy Global Wind Power - Equity August 2010
abc
Gamesa – EBITDA forecast: HSBC vs consensus (EURm)
Year Low Mean High HSBC HSBC % above/(below)
mean
2010e 198 294 456 319 8% 2011e 242 372 539 363 -2% 2012e 253 425 510 419 -1%
Source: Bloomberg, HSBC estimates
Valuation Using a WACC of 8.5% (beta of 1.3, EMRP of
4.5% and gross cost of debt of 6.0%) we derive
fair values of EUR5.59 and EUR5.39 per share,
using our two different DCF methodologies - the
HSBC four-stage ROIC-based DCF and a
‘classic’ FCF-based DCF (for details of our DCF
methodologies refer “Valuation” section above).
The average of the two DCFs gives us a target
price of EUR5.50 (rounded), down from EUR14
previously due to reduction in our volume sales
forecast ( we forecast c18GW of sales for 2010e-
15e from c24GW previously)and lower price
realisation. We no longer include a value for
Gamesa’s wind farm development pipeline as it
has only had limited success in selling this
pipeline over the last couple of years.
Under our research model, for European stocks
with a volatility indicator, the Neutral band is
10% above and below the hurdle rate for Europe-
ex UK stocks of 8.5%. Our 12-month target price
of EUR5.50 implies a potential return of c8% ,
which is within the -1.5% to 18.5% Neutral band;
thus, we rate the stock Neutral (V).
Risks Upside risks to our view include:
Stronger than expected order inflow
Stronger than expected pricing
Downside risks to our view include:
Macro issues, particularly in Southern
Europe, persist putting increasing focus on
governments reducing renewable incentives
New order flow fails to materialise or is
slower than expected
Gamesa could continue to lose market share
in light of fierce competition from South
Korea/China and GE expanding in Europe
Prolonged lack of financing for wind farms
could dent Gamesa's clients' ability to develop
their pipelines
Pricing risk.

117
Clean Energy Global Wind Power - Equity August 2010
abc
Financials & valuation: Gamesa Corp Neutral (V) Financial statements
Year to 12/2009a 12/2010e 12/2011e 12/2012e
Profit & loss summary (EURm)
Revenue 3,187 2,647 2,981 3,251EBITDA 276 225 258 307Depreciation & amortisation -99 -100 -113 -124Operating profit/EBIT 177 125 145 183Net interest -53 -75 -73 -83PBT 122 66 101 143HSBC PBT 122 66 101 143Taxation -7 -8 -25 -43Net profit 115 58 76 100HSBC net profit 115 58 76 100
Cash flow summary (EURm)
Cash flow from operations 65 20 246 90Capex -133 -180 -199 -212Cash flow from investment -130 -182 -200 -213Dividends -50 -15 -15 -19Change in net debt 333 162 -31 143FCF equity -53 -111 74 -107
Balance sheet summary (EURm)
Intangible fixed assets 540 550 562 574Tangible fixed assets 417 494 574 655Current assets 3,632 3,475 3,480 3,613Cash & others 801 801 801 801Total assets 4,912 4,861 4,991 5,264Operating liabilities 1,875 1,640 1,747 1,794Gross debt 1,157 1,319 1,287 1,430Net debt 355 517 486 628Shareholders funds 1,571 1,629 1,690 1,771Invested capital 1,913 2,077 2,068 2,248
Ratio, growth and per share analysis
Year to 12/2009a 12/2010e 12/2011e 12/2012e
Y-o-y % change
Revenue -12.6 -16.9 12.6 9.1EBITDA -7.8 -18.6 14.8 18.9Operating profit -14.8 -29.5 16.2 26.1PBT -23.4 -45.6 51.8 41.7HSBC EPS -25.5 -49.9 30.1 32.2
Ratios (%)
Revenue/IC (x) 2.4 1.3 1.4 1.5ROIC 12.4 5.5 5.2 5.9ROE 7.5 3.6 4.6 5.8ROA 3.5 2.8 2.9 3.3EBITDA margin 8.7 8.5 8.7 9.4Operating profit margin 5.5 4.7 4.9 5.6EBITDA/net interest (x) 5.2 3.0 3.6 3.7Net debt/equity 22.6 31.7 28.7 35.4Net debt/EBITDA (x) 1.3 2.3 1.9 2.0CF from operations/net debt 18.3 3.8 50.6 14.3
Per share data (EUR)
EPS Rep (fully diluted) 0.48 0.24 0.31 0.41HSBC EPS (fully diluted) 0.48 0.24 0.31 0.41DPS 0.00 0.06 0.08 0.10Book value 6.46 6.69 6.94 7.28
Valuation data
Year to 12/2009a 12/2010e 12/2011e 12/2012e
EV/sales 0.5 0.6 0.5 0.5EV/EBITDA 5.4 7.2 6.1 5.4EV/IC 0.8 0.8 0.8 0.7PE* 10.7 21.4 16.4 12.4P/Book value 0.8 0.8 0.7 0.7FCF yield (%) -4.7 -10.0 6.9 -10.4Dividend yield (%) 0.0 1.2 1.5 2.0
Note: * = Based on HSBC EPS (fully diluted)
Issuer information
Share price (EUR) 5.10 Target price (EUR) 5.50 Potent'l return (%) 7.8
Reuters (Equity) GAM.MC Bloomberg (Equity) GAM SMMarket cap (USDm) 1,584 Market cap (EURm) 1,254Free float (%) 68 Enterprise value (EURm) 1627Country Spain Sector ELECTRICAL EQUIPMENTAnalyst Robert Clover Contact 44 20 7991 6741
Price relative
05
1015202530354045
2008 2009 2010 2011
051015202530354045
Gamesa Corp Tecnologica S Rel to MADRID SE
Source: HSBC Note: price at close of 25 Aug 2010

118
Clean Energy Global Wind Power - Equity August 2010
abc
Leading technology… Hansen is a leader in Multi-MW (1.5-6MW) wind
turbine gearbox segment. Hansen has decided
strategically to focus on the mutli-MW segment as
it is the fastest growing segment with customers
increasingly moving towards larger turbine sizes.
It also helps Hansen to fend off the competitive
pressure as Mutli-MW gearboxes are
technologically more difficult to manufacture as
opposed to smaller gearboxes.
Hansen has been consistently able to improve its
per MW sales realisations from EUR67,000/MW
in 2005 to EUR100,000/MW in 2010 ( an increase
of c50%) by increasingly moving its sales mix
towards higher capacity gearboxes.
…winning customers A key driver for Hansen to drive market share is a
continued addition of new customer accounts. We
believe that as product deployment in China shifts
towards higher MW turbines, Hansen, with its
superior technology offering and local production
base, could penetrate further accounts in this market.
In particular, Sinovel as the Chinese number-one and
world’s fastest growing wind turbine manufacturer is
a key customer addition for Hansen. Sinovel ranked
no.3 globally in 2009. Furthermore, we believe that
as leader of the multi-MW class gearboxes, Hansen
is well placed to benefit from the expected boom in
offshore demand (offshore turbines require larger
gearboxes).
FY 2011 guidance
Hansen has guided for revenue growth of 5-10%
for FY11 with revenue being back-end loaded. It
maintains that it expects improving industry
investment from second half of CY10.It will
continue to diversify its customer base and will
consider careful deployment of capital for
capacity expansion. Hansen has currently guided
for capex of EUR30m for FY11.
We note that Hansen has further reduced its
capacity expansion plan for FY2011 and FY2012
by 1,600MW (600MW in Belgium, 600MW in
India and 400MW in China) and 400MW
(reduced by 500MW in India and increased by
100MW in China) respectively while maintaining
its FY2013 target of 14.3GW.
Hansen Transmissions (HSN LN)
Market leader in the fastest growing multi-MW wind turbine
gearbox segment
Sales agreement with Sinovel, Chinese number-one and the
world’s fastest growing wind turbine manufacturer, is a big positive
We reiterate OW(V) rating although our target price falls to 95p
from 135p due to reduced market growth forecasts
James Magness* Analyst HSBC Bank plc +44 20 7991 3464 [email protected]
Robert Clover * Analyst HSBC Bank plc +44 20 7991 6741 robert.clover @hsbcib.com
*Employed by a non-US affiliate of HSBC Securites (USA) Inc., and is not registered/qualified pursuant to FINRA regulations

119
Clean Energy Global Wind Power - Equity August 2010
abc
Impact of changes on our forecast We have cut our sales revenues forecasts by 3% for
FY2012e and 10% for FY2013e and our EPS
forecasts by 4% for FY2012e and 11% for
FY2013e. This is a result of volume sales
reductions due to reduced market share that we
assume for Hansen. We still expect Hansen to gain
market share - up from the 13% level in 2009 to
20% in 2015e - but previously we had more
aggressive assumptions (26%). We have reduced
our long-term sales forecast by c39% and our long-
term EPS forecast by c38%. Our forecasts for
FY11 remain unchanged. See charts below.
Hansen Transmissions – Sales forecast (EURm) – new vs. old
0
200
400
600
800
1,000
1,200
1,400
1,600
2010-11e 2011-12e 2012-13e 2013-14e 2014-15e
New forecasts Prev ious forecasts
Source: HSBC estimates
Hansen Transmissions – EPS forecast (EUR) – new vs. old
-0.03
0.03
0.08
0.13
0.18
2010-11e 2011-12e 2012-13e 2013-14e 2014-15e
New forecasts Prev ious forecasts
Source: HSBC estimates
HSBC versus consensus Hansen Transmissions – Sales forecast: HSBC vs. consensus (EURm)
Year Low Mean High HSBC HSBC % above/(below)
mean
2010e 486 561 588 573 2% 2011e 622 714 793 722 1% 2012e 754 852 987 842 -1%
Source: Bloomberg, HSBC estimates Hansen Transmissions – EBITDA forecast: HSBC vs consensus (EURm)
Year Low Mean High HSBC HSBC % above/(below)
mean
2010e 49 64 78 59 -8% 2011e 81 102 134 88 -14% 2012e 111 133 164 120 -10%
Source: Bloomberg, HSBC estimates
Valuation Using a WACC of 9.0% (beta 1.3, equity risk
premium of 4.5% and cost of debt 5.5%, debt/equity
of 20%), we derive fair values of 113p and 124p,
using our two different DCF methodologies - the
HSBC four-stage ROIC-based DCF and a ‘classic’
FCF-based DCF (discussed below), which gives an
average fair value of 119p. We have applied to this a
20% discount (previously 30%) as the stock
overhang risk due to the possibility of Suzlon
divesting some or all of its c26% stake in Hansen
after the expiry of its six month lock-in period in
May 2010. This gives us our target price of 95p
(rounded), down from 135p previously due to lower
industry demand forecasts and also more
conservative market share assumptions for Hansen.
We have lowered the discount from 30% to 20%
as we believe that the 10% discount applied
earlier to reflect the execution risk due to
Hansen’s aggressive factory expansion in India
and China has now dissipated with Hansen’s
management guiding for limited capacity
additions in FY11 and phasing 2011-12 capacity
additions to align with market conditions.
120
Clean Energy Global Wind Power - Equity August 2010
abc
Under our research model, for stocks with a
volatility indicator, the Neutral band is 10ppt above
and below the hurdle rate for UK stocks of 8.0%.
Our 12-month target price of 95p implies a potential
return of c76% , which is above the Neutral band;
thus, we maintain our Overweight (V) rating.
Risks Downside risks to our view include:
Overhang risk from the possibility of Suzlon
selling down its remaining 26% stake in Hansen
Hansen may experience some weakness in its
order book, if Suzlon experiences any
financial problems
A more prolonged than expected downturn in
global wind demand
Governments could stop subsidising the
wind industry
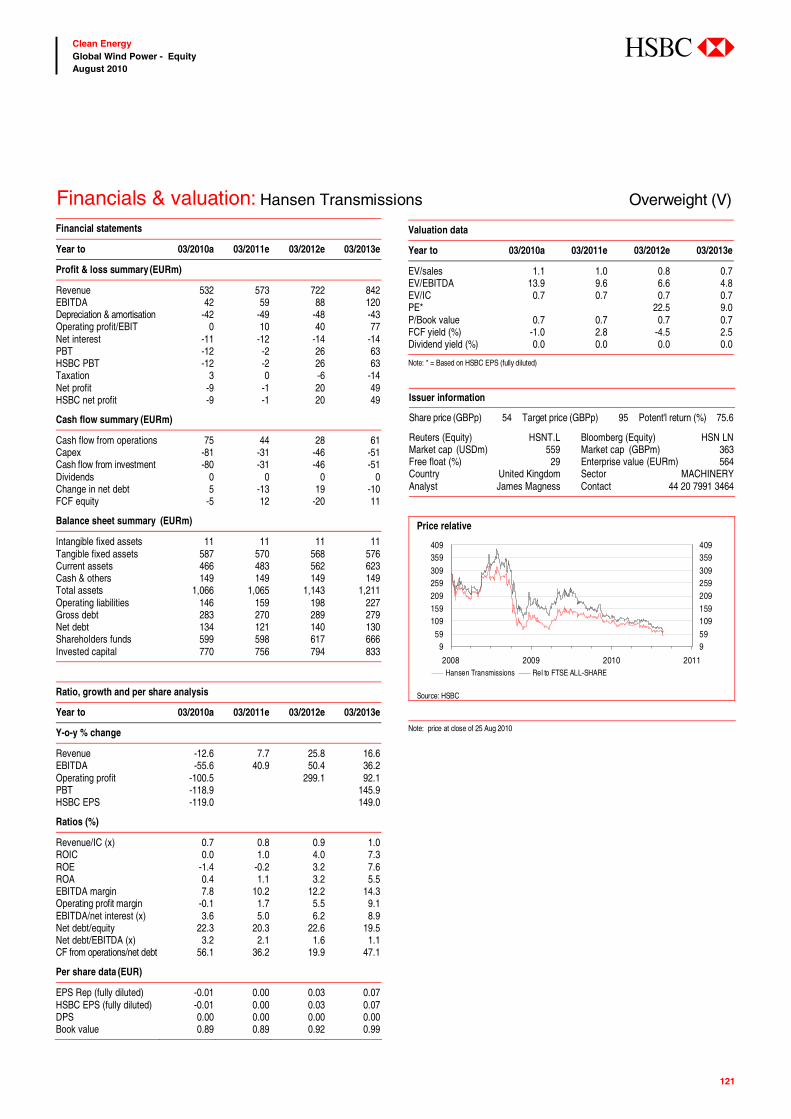
121
Clean Energy Global Wind Power - Equity August 2010
abc
Financials & valuation: Hansen Transmissions Overweight (V) Financial statements
Year to 03/2010a 03/2011e 03/2012e 03/2013e
Profit & loss summary (EURm)
Revenue 532 573 722 842EBITDA 42 59 88 120Depreciation & amortisation -42 -49 -48 -43Operating profit/EBIT 0 10 40 77Net interest -11 -12 -14 -14PBT -12 -2 26 63HSBC PBT -12 -2 26 63Taxation 3 0 -6 -14Net profit -9 -1 20 49HSBC net profit -9 -1 20 49
Cash flow summary (EURm)
Cash flow from operations 75 44 28 61Capex -81 -31 -46 -51Cash flow from investment -80 -31 -46 -51Dividends 0 0 0 0Change in net debt 5 -13 19 -10FCF equity -5 12 -20 11
Balance sheet summary (EURm)
Intangible fixed assets 11 11 11 11Tangible fixed assets 587 570 568 576Current assets 466 483 562 623Cash & others 149 149 149 149Total assets 1,066 1,065 1,143 1,211Operating liabilities 146 159 198 227Gross debt 283 270 289 279Net debt 134 121 140 130Shareholders funds 599 598 617 666Invested capital 770 756 794 833
Ratio, growth and per share analysis
Year to 03/2010a 03/2011e 03/2012e 03/2013e
Y-o-y % change
Revenue -12.6 7.7 25.8 16.6EBITDA -55.6 40.9 50.4 36.2Operating profit -100.5 299.1 92.1PBT -118.9 145.9HSBC EPS -119.0 149.0
Ratios (%)
Revenue/IC (x) 0.7 0.8 0.9 1.0ROIC 0.0 1.0 4.0 7.3ROE -1.4 -0.2 3.2 7.6ROA 0.4 1.1 3.2 5.5EBITDA margin 7.8 10.2 12.2 14.3Operating profit margin -0.1 1.7 5.5 9.1EBITDA/net interest (x) 3.6 5.0 6.2 8.9Net debt/equity 22.3 20.3 22.6 19.5Net debt/EBITDA (x) 3.2 2.1 1.6 1.1CF from operations/net debt 56.1 36.2 19.9 47.1
Per share data (EUR)
EPS Rep (fully diluted) -0.01 0.00 0.03 0.07HSBC EPS (fully diluted) -0.01 0.00 0.03 0.07DPS 0.00 0.00 0.00 0.00Book value 0.89 0.89 0.92 0.99
Valuation data
Year to 03/2010a 03/2011e 03/2012e 03/2013e
EV/sales 1.1 1.0 0.8 0.7EV/EBITDA 13.9 9.6 6.6 4.8EV/IC 0.7 0.7 0.7 0.7PE* 22.5 9.0P/Book value 0.7 0.7 0.7 0.7FCF yield (%) -1.0 2.8 -4.5 2.5Dividend yield (%) 0.0 0.0 0.0 0.0
Note: * = Based on HSBC EPS (fully diluted)
Issuer information
Share price (GBPp) 54 Target price (GBPp) 95 Potent'l return (%) 75.6
Reuters (Equity) HSNT.L Bloomberg (Equity) HSN LNMarket cap (USDm) 559 Market cap (GBPm) 363Free float (%) 29 Enterprise value (EURm) 564Country United Kingdom Sector MACHINERYAnalyst James Magness Contact 44 20 7991 3464
Price relative
959
109159209259309359409
2008 2009 2010 2011
959109159209259309359409
Hansen Transmissions Rel to FTSE ALL-SHARE
Source: HSBC Note: price at close of 25 Aug 2010

122
Clean Energy Global Wind Power - Equity August 2010
abc
Good set of Q2 results Nordex posted Q2 results on 8 August which were
mostly in-line with our expectations. While Q2
revenues of EUR199m (vs. EUR202m consensus)
were still 29% below Q2 2009, they were up 32%
sequentially (Q1: EUR151m). With a Q2 EBIT
margin of 3.4% (EUR6.7m EBIT, vs. EUR6.8m
consensus and EUR9.2m in Q2 09) in the
seasonally weaker H1, the company is on good
track to beat our full-year EBIT margin estimate
of 3.3% which we consider conservative.
Valuation not demanding
Based on our current estimates Nordex trades at
18.5x and 11.4x PE and 4.1x and 2.9x
EV/EBITDA for 2010e-11e respectively. The
good set of Q2 results further supports our view
that Nordex has passed its fundamental troughs
(please see our note ‘Recent share price weakness
brings medium-term upside potential’ from 18
May). We have an Overweight (V) rating on the
stock and a target price of EUR10.
Order flow shows good momentum…. With Q2 order intake worth EUR258m (vs. EUR71
in Q1 and EUR205m in Q2 09), Nordex achieved
the strongest intake in two years, which led to the
first positive development of the order backlog since
the beginning of the past recession. As a result, the
total backlog amounts to cEUR2.3bn, including
EUR481m worth of firmly financed contracts which
puts the company in a good position, thanks to the
recently achieved momentum.
Nordex: published order backlog
MW Q-o-q Y-o-Y
Q1 2010 2300 21% -8% Q4 2009 1900 -4% -34% Q3 2009 1970 -14% -35% Q2 2009 2300 -8% -30% Q1 2009 2500 -14% -24% Q4 2008 2900 -5% -12% Q3 2008 3044 -8% 5% Q2 2008 3300 0% 32% Q1 2008 3300 0% 94% Q4 2007 3300 14% 136% Q3 2007 2900 16% Q2 2007 2500 47% Q1 2007 1700 21%
Source: HSBC
FY2010 forecasts In terms of the full-year outlook, Nordex is guiding
for a rather uninspiring 2010 sales level of
EUR1.2bn (HSBCe EUR1.3bn, consensus
EUR1.25bn), which is however paired with a more
ambitious target EBIT margin of 4% (HSBCe
3.3%, consensus 3.5%) which leaves room for
upgrade potential in the market, in our view.
Further we find the topline target to be on the
Nordex (NDX1 GR)
Q2 margin recovery and solid order intake development, relatively
outperforming many sector competitors
Undemanding valuation with respective 2010e-11e EV/EBITDA of
4.1x and 2.9x and significant discounts to its wind peers
Reiterate our EUR10 TP and Overweight (V) rating
Burkhard Weiss * Analyst HSBC Trinkaus & Burkhardt AG, Germany +49 211 910 3722 [email protected]
*Employed by a non-US affiliate of HSBC Securites (USA) Inc., and is not registered/qualified pursuant to FINRA regulations

123
Clean Energy Global Wind Power - Equity August 2010
abc
conservative side as management states that it has
three quarters of it already secured through existing
orders and fixed service contracts. Specifically,
Nordex expects accelerated order bookings in H2
2010 based on current project negotiations. The
company expects volume of those orders to be
worth cEUR650m of which cEUR190-250m can
possibly be turned into sales in H2 2010. HSBC vs. consensus Our estimates are driven by what we consider to
be a conservative outlook, the strong international
competition as well as the expectation of wind
turbine price pressure in the coming two years.
Furthermore, two of the largest wind energy
markets, the US and China, are currently
problematic as the former is currently weak and
has legislative uncertainties to resolve and the
latter is increasingly characterised by ‘local-to-
local’ business which makes it harder for
international players to participate. While we are
slightly above consensus regarding 2010e-12e
sales expectations (between 4-7%), we are
between 0.5% and 7% below the market
expectations for 2010e-12e EBITDA due to the
aforementioned price pressure.
Nordex – Sales forecast: HSBC vs. consensus (EURm)
Year Low Mean High HSBC HSBC % above/(below)
mean
2010e 1174.0 1244.3 1567.0 1300.0 4.5% 2011e 1293.0 1502.2 2300.0 1600.0 6.5% 2012e 1417.0 1819.3 3144.0 1900.0 4.4%
Source: Bloomberg, HSBC Valuation Based on a DCF methodology (WACC of 9.85%
based on a risk-free rate of 4.0%, an equity risk
premium of 4.5% and a beta of 1.3) we derive a
target price of EUR10. Under our research model,
the Neutral band for stocks with a volatility indicator
is 10 percentage points above and below our hurdle
Nordex – EBITDA forecast: HSBC vs. consensus (EURm)
Year Low Mean High HSBC HSBC % above/(below)
mean
2010e 56.7 69.1 94.2 66.0 -4.5% 2011e 73.1 97.8 173.0 90.6 -7.4% 2012e 119.5 126.9 268.0 126.3 -0.5%
Source: Bloomberg, HSBC
rate of 8.5% for Europe ex-UK stocks, resulting in a
Neutral band of -1.5% to 18.5% around the current
share price. For Nordex, our target price of EUR10
implies a potential return of c47%, which is above
the Neutral band and hence we rate the stock
Overweight (V).
This is also broadly supported by our international
wind sector peer valuation which, for Nordex, shows
that with 2010e-11e EV/EBITDA multiples of 4.1x
and 2.9x, the company trades at discounts of 57%
and 55%, respectively. On a 2010e-11e PE basis the
multiples of 18.5x and 11.4x represent respective
discounts of 12% and 16% to its sector peers.
Notable key downside risks remain:
Potential loss of market share caused by
fierce competition in the EU as large
companies like Siemens or GE expand
operations
Slower-than-expected recovery in H2 2010 or
greater-than-expected price pressure as
industry production capacity is still
significantly above demand
The general issue of governmental support for
wind power as well as the lower cost of
substitutes (ie oil or gas) remain noteworthy
Also, should the Q3 order intake fall below
market expectations, the company will likely
have a difficult time convincing the market it
can meet its full-year guidance.

124
Clean Energy Global Wind Power - Equity August 2010
abc
Financial statements
Year to 12/2009a 12/2010e 12/2011e 12/2012e
Profit & loss summary (EURm)
Revenue 1,183 1,300 1,600 1,900EBITDA 58 66 91 126Depreciation & amortisation -18 -23 -26 -31Operating profit/EBIT 40 43 65 96Net interest -6 -6 -5 0PBT 35 37 59 96HSBC PBT 35 37 59 96Taxation -11 -12 -20 -32Net profit 24 25 40 64HSBC net profit 24 25 40 64
Cash flow summary (EURm)
Cash flow from operations 30 224 83 121Capex -29 -82 -112 -112Cash flow from investment -44 -97 -127 -127Dividends 0 0 0 0Change in net debt 36 -127 -9 -18FCF equity -32 105 -63 -34
Balance sheet summary (EURm)
Intangible fixed assets 51 61 66 69Tangible fixed assets 98 163 260 353Current assets 645 701 812 963Cash & others 160 220 220 260Total assets 840 996 1,208 1,455Operating liabilities 300 450 588 697Gross debt 101 34 26 48Net debt -59 -186 -194 -212Shareholders funds 345 370 410 474Invested capital 334 255 330 428
Ratio, growth and per share analysis
Year to 12/2009a 12/2010e 12/2011e 12/2012e
Y-o-y % change
Revenue 4.1 9.9 23.1 18.8EBITDA -26.5 13.8 37.4 39.5Operating profit -36.5 7.9 50.5 47.4PBT -45.6 5.8 61.6 60.8HSBC EPS -49.7 2.9 61.6 60.8
Ratios (%)
Revenue/IC (x) 3.9 4.4 5.5 5.0ROIC 9.2 9.8 14.9 16.9ROE 7.2 6.9 10.2 14.5ROA 3.5 3.6 4.3 5.2EBITDA margin 4.9 5.1 5.7 6.7Operating profit margin 3.4 3.3 4.1 5.0EBITDA/net interest (x) 9.2 10.5 16.8 Net debt/equity -16.9 -49.8 -47.2 -44.6Net debt/EBITDA (x) -1.0 -2.8 -2.1 -1.7CF from operations/net debt
Per share data (EUR)
EPS Rep (fully diluted) 0.36 0.37 0.60 0.96HSBC EPS (fully diluted) 0.36 0.37 0.60 0.96DPS 0.00 0.00 0.00 0.00Book value 5.17 5.53 6.13 7.09
Valuation data
Year to 12/2009a 12/2010e 12/2011e 12/2012e
EV/sales 0.3 0.2 0.2 0.1EV/EBITDA 6.8 4.0 2.8 1.9EV/IC 1.2 1.0 0.8 0.6PE* 19.0 18.5 11.4 7.1P/Book value 1.3 1.2 1.1 1.0FCF yield (%) -7.1 23.2 -13.9 -7.4Dividend yield (%) 0.0 0.0 0.0 0.0
Note: * = Based on HSBC EPS (fully diluted)
Issuer information
Share price (EUR) 6.82 Target price (EUR) 10.00 Potent'l return (%) 46.6
Reuters (Equity) NDXGk.DE Bloomberg (Equity) NDX1 GRMarket cap (USDm) 576 Market cap (EURm) 456Free float (%) 75 Enterprise value (EURm) 265Country Germany Sector ENERGY EQUIPMENTAnalyst Burkhard Weiss Contact +49 211 910 3722
Price relative
27
12172227323742
2008 2009 2010 2011
2712172227323742
Nordex Rel to DAX-100
Source: HSBC Note: price at close of 25 Aug 2010 Stated accounts as of 30 Sep 2005 are IFRS compliant
Financials & valuation: Nordex Overweight (V)

125
Clean Energy Global Wind Power - Equity August 2010
abc
Q1 2010/11 disappoints on the top- and bottom-line REpower reported weak Q1 figures with sales
down 29% y-o-y to EUR213m and a sharp drop in
EBIT to EUR1.5m (- 86% y-o-y) due to
continuous price pressure and low capacity
utilization. On the other hand, the company was
able to increase its gross margin by 4.8 ppts to
24.9% on back of supply chain shifts towards
lower-cost countries and improved efficiency. Via
further productivity improvements and supply
chain optimisation, management plans to further
increase its gross margin in the coming quarters.
With new order intake of 346 MW (Q1 09/10:
65 MW) the total order backlog now stands at
2,095 MW compared to 1230 MW a year ago.
REpower – Order backlog development
MW q-o-q y-o-y EURbn q-o-q
Q1 2010/11 2095 0% 70% 2.4 37% Q4 2009/10 2100 51% 59% 1.8 4% Q3 2009/10 1391 6% -7% 1.7 6% Q2 2009/10 1307 6% -9% 1.6 10% Q1 2009/10 1230 -7% -19% 1.5 -3% Q4 2008/09 1317 -12% -7% 1.5 -6% Q3 2008/09 1503 5% 16% 1.6 5% Q2 2008/09 1432 -6% 17% 1.5 -5% Q1 2008/09 1523 7% 48% 1.6 15% Source: HSBC, company data
Potential Suzlon deal remains share price catalyst
In our previous notes we mentioned continuous
issues with regard to Suzlon’s troubled balance
sheet and its attempt to improve this situation. In
addition there still exist financing issues for the
combined group (Suzlon/REpower), as
REpower’s EUR600m syndicated loan with a
German bank consortium required that there is no
control- or profit transfer agreement with its
majority shareholder Suzlon. This is the main
reason why – so far – no agreement of such nature
has been signed.
We previously highlighted that we believe there is
a chance that Suzlon will solve its financing
issues and therefore the company will proceed
with a ‘contract-of-domination’ due to the
strategic importance of REpower for Suzlon.
However, in mid-August the Economic Times
reported that Suzlon is in talks to sell a 25 percent
stake in Repower for USD500m. According to the
report, Suzlon is in separate talks with TPG
Capital and an US-based fund. We expect the
imminent stock overhang will likely weigh on the
share price until a final resolution has been found.
REpower (RPW GR)
Weak start into FY 2010/11 with Q1 characterised by low capacity
utilisation and sector price pressure
Potential share overhang and unclear outcome of Suzlon solution
remains a share price driver in both directions
Downgrade to Neutral (V), reduce target price to EUR115
(from EUR150) after slow Q1 and weak earnings development
Burkhard Weiss * Analyst HSBC Trinkaus & Burkhardt AG, Germany +49 211 910 3722 [email protected]
*Employed by a non-US affiliate of HSBC Securites (USA) Inc., and is not registered/qualified pursuant to FINRA regulations

126
Clean Energy Global Wind Power - Equity August 2010
abc
Outlook for 2010e-12e REpower continues to expect 10-20% top line
growth to cEUR1.5-1.6bn and an EBIT margin of
7.5%-8.5% translating into an EBIT of about
EUR108m to EUR133m. Nevertheless, given the
poor figures from competitors (e.g. Vestas, Gamesa)
as well as due to our lowered growth expectations
for the wind industry and ongoing turbine price
pressure we remain clearly more cautious. For 2010e
we lower our sales forecast by 12% to EUR1.5bn
and our EBIT forecast by 13% to EUR90m. We
continue to expect an EBIT margin of 6% which is
significantly (1.5 ppts) below the lower end of the
current management FY2010 EBIT guidance. We
have adjusted our 2011e forecasts inline with that.
REpower – Changes to our estimates
(EURm) 2010e 2011e 2012e
Sales New 1500.0 1800.0 2050.0 Old 1711.1 2053.3 n/a Change -12% -12% n/a EBIT New 90.0 99.0 117.0 Old 103.5 123.3 n/a Change -13% -20% n/a Net income New 57.2 61.3 73.2 Old 64.7 76.1 n/a Change -12% -19% n/a
Source: HSBC estimates HSBC vs. consensus Compared to consensus we are more cautious on the
margin development. However, we note that
consensus consists of only one or two other brokers
and thus the comparison might not be meaningful.
REpower – HSBCe vs. consensus
(EURm) 2010e 2011e 2012e
Sales HSBCe 1500.0 1800.0 2050.0 Consensus 1499.5 1716.8 1602.7 Difference 0% 5% 28% EBIT HSBCe 90.0 99.0 117.0 Consensus 126.1 112.1 125.0 Difference -29% -12% -6% Net income HSBCe 57.2 61.3 73.2 Consensus 68.6 72.4 82.2 Difference -17% -15% -11%
Source: HSBC estimates, Bloomberg consensus
Valuation Based on our updated estimates and unchanged
assumptions (ungeared cost of equity of 10.5%,
beta 1.5, equity risk premium of 4.5% and a risk-
free rate of 4.0%) our DCF-model yields a fair
value of EUR115 per share (previously EUR125).
We have previously incorporated a strategic
domination premium of 20% to our DCF value,
which we estimated Suzlon would have to pay to
the remaining minorities. Given the current
uncertainties surrounding the Suzlon stake, we
now refrain from applying such a premium and
thus our target price is EUR115 (previously
EUR150).
Under the HSBC research model for European
stocks with a volatility indicator the Neutral band
is ten percentage points above and below the
hurdle rate of 8.5%. Our 12-month target price of
EUR115 implies a potential return of 16.8%,
which is in the Neutral band; thus, we downgrade
REpower to Neutral (V).
Risks Upside risks to our view include:
Stronger than expected demand growth
Stronger than expected pricing
Downside risks to our rating and target price
include:
Various risk scenarios resulting from the
unclear Suzlon strategy
Stronger-than-expected competition resulting
in increasing price pressure
Regulatory challenges hindering a faster
realisation of offshore projects, particularly in
the German home market

127
Clean Energy Global Wind Power - Equity August 2010
abc
Financial statements
Year to 03/2010a 03/2011e 03/2012e 03/2013e
Profit & loss summary (EURm)
Revenue 1,304 1,500 1,800 2,050EBITDA 119 119 132 153Depreciation & amortisation -21 -29 -33 -36Operating profit/EBIT 98 90 99 117Net interest -16 -10 -13 -14PBT 84 82 88 105HSBC PBT 84 82 88 105Taxation -26 -25 -26 -31Net profit 58 57 61 73HSBC net profit 58 57 61 73
Cash flow summary (EURm)
Cash flow from operations 108 98 70 114Capex -56 -50 -55 -55Cash flow from investment -69 -37 -54 -59Dividends 0 0 0 0Change in net debt -87 -24 -19 -54FCF equity -75 100 -21 26
Balance sheet summary (EURm)
Intangible fixed assets 43 31 31 36Tangible fixed assets 147 167 188 207Current assets 827 1,030 1,152 1,334Cash & others 216 250 290 340Total assets 1,033 1,244 1,387 1,592Operating liabilities 411 522 532 610Gross debt 58 67 88 83Net debt -158 -183 -202 -257Shareholders funds 464 517 578 652Invested capital 389 455 550 627
Ratio, growth and per share analysis
Year to 03/2010a 03/2011e 03/2012e 03/2013e
Y-o-y % change
Revenue 7.8 15.1 20.0 13.9EBITDA 30.2 0.3 10.7 16.1Operating profit 27.9 -8.5 10.0 18.2PBT 9.5 -2.5 7.2 19.4HSBC EPS 9.6 -0.6 7.2 19.4
Ratios (%)
Revenue/IC (x) 3.4 3.6 3.6 3.5ROIC 17.9 14.9 13.8 13.9ROE 13.2 11.7 11.2 11.9ROA 7.3 6.0 5.7 5.9EBITDA margin 9.1 8.0 7.3 7.5Operating profit margin 7.5 6.0 5.5 5.7EBITDA/net interest (x) 7.2 11.7 10.0 10.9Net debt/equity -33.2 -34.6 -34.3 -38.7Net debt/EBITDA (x) -1.3 -1.5 -1.5 -1.7CF from operations/net debt
Per share data (EUR)
EPS Rep (fully diluted) 6.25 6.22 6.66 7.96HSBC EPS (fully diluted) 6.25 6.22 6.66 7.96DPS 0.00 0.00 0.00 0.00Book value 50.49 56.22 62.88 70.84
Valuation data
Year to 03/2010a 03/2011e 03/2012e 03/2013e
EV/sales 0.6 0.5 0.4 0.3EV/EBITDA 6.2 6.0 5.2 4.2EV/IC 1.9 1.6 1.3 1.0PE* 15.7 15.8 14.8 12.4P/Book value 2.0 1.8 1.6 1.4FCF yield (%) -8.4 11.2 -2.3 2.9Dividend yield (%) 0.0 0.0 0.0 0.0
Note: * = Based on HSBC EPS (fully diluted)
Issuer information
Share price (EUR) 98.48 Target price (EUR) 115.00 Potent'l return (%) 16.8
Reuters (Equity) RPWGn.DE Bloomberg (Equity) RPW GRMarket cap (USDm) 1,144 Market cap (EURm) 906Free float (%) 9 Enterprise value (EURm) 711Country Germany Sector ENERGY EQUIPMENTAnalyst Burkhard Weiss Contact +49 211 910 3722
Price relative
1666
116166216266316366416
2008 2009 2010 2011
1666116166216266316366416
REpower Systems Rel to DAX-100
Source: HSBC Note: price at close of 25 Aug 2010
Financials & valuation: REpower Systems Neutral (V)

128
Clean Energy Global Wind Power - Equity August 2010
abc
Too much capacity, too few orders The woes of Suzlon, India’s largest wind turbine
manufacturer and global no.6, don’t seem to be
over. The order flow which it needs to keep its
factories running profitably has failed to
materialise so far. Suzlon’s order backlog as of 11
August 2010 was 1,458 MW, an increase from
1126 MW as on 26 May 2010. During the period
Suzlon received orders of 489MW from the
Indian market and 51MW from China.
An Australian order which we had expected to
come Suzlon’s way from AGL Energy Limited
for Macarthur wind farm went to Vestas. As
announced by AGL previously on 1 March 2010,
the wind farm was to consist of 174 Suzlon S88
turbines for a total capacity of 365MW. However,
in August, AGL gave the order for 425MW of
turbines for the said wind farm to Vestas,
highlighting the competitive nature of the market
which is currently oversupplied and where wind
turbine manufacturers are competing fiercely to
fill their factory capacity.
We estimate Suzlon has manufacturing capacity
of c5.7GW and this implies that its order book is
just 0.25X its annual capacity.
Suzlon has stated in the past that it needs to sell
c2,000MW of turbines to break-even at the PBT
level. We expect that Suzlon is unlikely to reach
this level of sales in FY11e (We forecast c1.5GW
of sales for FY11e) and thus is likely to report a
loss for the FY. However, on a quarterly basis the
quantum of loss may diminish from Q1 to Q4 as
volumes pick-up due to seasonal variations. Q4 is
generally the strongest quarter in terms of sales
for Suzlon.
Going gets tough in the Indian market
Suzlon is also facing the threat of increasing
competition in its domestic market of India. Suzlon
has dominated the wind turbine market in India till
now with more than 50% market share but with the
entry of Spanish turbine manufacturer Gamesa,
Suzlon is going to have tough competition.
Gamesa started operations at its India facility in
early 2010 with an initial production capacity of
200 MW per year. Gamesa has said that it expects
to obtain a market share of c10% in India during
the first year of product sales and to double
Suzlon (SUEL IN)
Suzlon continues to grapple with very weak order flow and
significantly diminished order book
With order book currently at c0.25X annual capacity, Suzlon will
have significantly underutilised capacity in FY11, we believe
We cut our target price to INR42 (from INR50) and reiterate our
Underweight (V) rating
Robert Clover * Analyst HSBC Bank plc +44 20 7991 6741 robert.clover @hsbcib.com
Shishir Singh * Analyst The Hongkong and Shanghai Banking Corporation Limited (HK)+852 2822 4292 [email protected]
Charanjit Singh* Analyst HSBC Bank Plc +91 80 30013776 [email protected]
*Employed by a non-US affiliate of HSBC Securites (USA) Inc., and is not registered/qualified pursuant to FINRA regulations
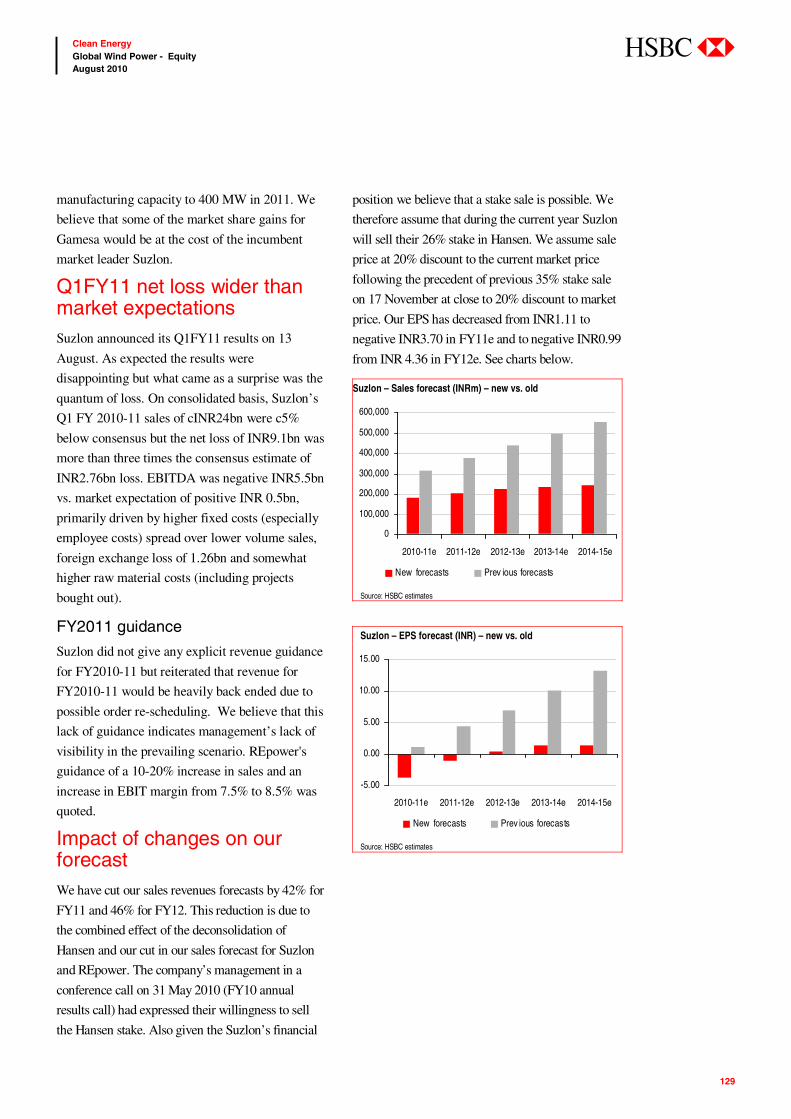
129
Clean Energy Global Wind Power - Equity August 2010
abc
manufacturing capacity to 400 MW in 2011. We
believe that some of the market share gains for
Gamesa would be at the cost of the incumbent
market leader Suzlon.
Q1FY11 net loss wider than market expectations Suzlon announced its Q1FY11 results on 13
August. As expected the results were
disappointing but what came as a surprise was the
quantum of loss. On consolidated basis, Suzlon’s
Q1 FY 2010-11 sales of cINR24bn were c5%
below consensus but the net loss of INR9.1bn was
more than three times the consensus estimate of
INR2.76bn loss. EBITDA was negative INR5.5bn
vs. market expectation of positive INR 0.5bn,
primarily driven by higher fixed costs (especially
employee costs) spread over lower volume sales,
foreign exchange loss of 1.26bn and somewhat
higher raw material costs (including projects
bought out).
FY2011 guidance
Suzlon did not give any explicit revenue guidance
for FY2010-11 but reiterated that revenue for
FY2010-11 would be heavily back ended due to
possible order re-scheduling. We believe that this
lack of guidance indicates management’s lack of
visibility in the prevailing scenario. REpower's
guidance of a 10-20% increase in sales and an
increase in EBIT margin from 7.5% to 8.5% was
quoted.
Impact of changes on our forecast We have cut our sales revenues forecasts by 42% for
FY11 and 46% for FY12. This reduction is due to
the combined effect of the deconsolidation of
Hansen and our cut in our sales forecast for Suzlon
and REpower. The company’s management in a
conference call on 31 May 2010 (FY10 annual
results call) had expressed their willingness to sell
the Hansen stake. Also given the Suzlon’s financial
position we believe that a stake sale is possible. We
therefore assume that during the current year Suzlon
will sell their 26% stake in Hansen. We assume sale
price at 20% discount to the current market price
following the precedent of previous 35% stake sale
on 17 November at close to 20% discount to market
price. Our EPS has decreased from INR1.11 to
negative INR3.70 in FY11e and to negative INR0.99
from INR 4.36 in FY12e. See charts below.
Suzlon – Sales forecast (INRm) – new vs. old
0
100,000
200,000
300,000
400,000
500,000
600,000
2010-11e 2011-12e 2012-13e 2013-14e 2014-15e
New forecasts Prev ious forecasts
Source: HSBC estimates
Suzlon – EPS forecast (INR) – new vs. old
-5.00
0.00
5.00
10.00
15.00
2010-11e 2011-12e 2012-13e 2013-14e 2014-15e
New forecasts Prev ious forecasts
Source: HSBC estimates
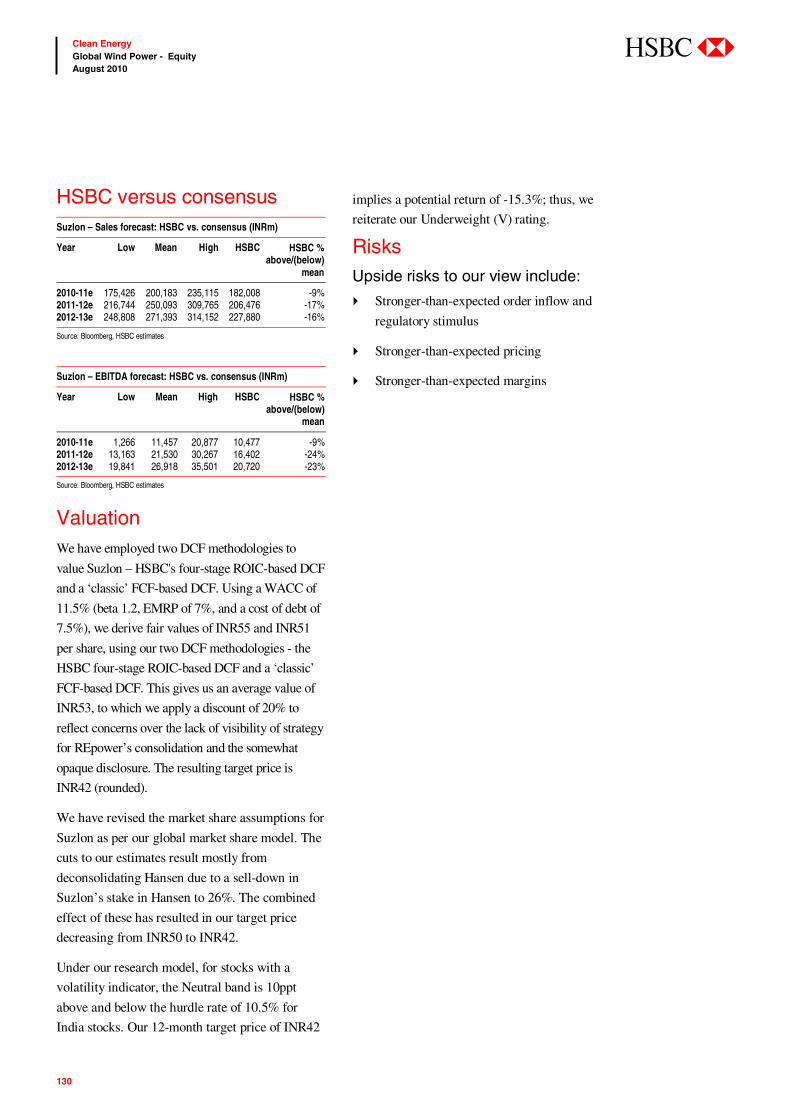
130
Clean Energy Global Wind Power - Equity August 2010
abc
HSBC versus consensus Suzlon – Sales forecast: HSBC vs. consensus (INRm)
Year Low Mean High HSBC HSBC % above/(below)
mean
2010-11e 175,426 200,183 235,115 182,008 -9% 2011-12e 216,744 250,093 309,765 206,476 -17% 2012-13e 248,808 271,393 314,152 227,880 -16%
Source: Bloomberg, HSBC estimates Suzlon – EBITDA forecast: HSBC vs. consensus (INRm)
Year Low Mean High HSBC HSBC % above/(below)
mean
2010-11e 1,266 11,457 20,877 10,477 -9% 2011-12e 13,163 21,530 30,267 16,402 -24% 2012-13e 19,841 26,918 35,501 20,720 -23%
Source: Bloomberg, HSBC estimates
Valuation We have employed two DCF methodologies to
value Suzlon – HSBC's four-stage ROIC-based DCF
and a ‘classic’ FCF-based DCF. Using a WACC of
11.5% (beta 1.2, EMRP of 7%, and a cost of debt of
7.5%), we derive fair values of INR55 and INR51
per share, using our two DCF methodologies - the
HSBC four-stage ROIC-based DCF and a ‘classic’
FCF-based DCF. This gives us an average value of
INR53, to which we apply a discount of 20% to
reflect concerns over the lack of visibility of strategy
for REpower’s consolidation and the somewhat
opaque disclosure. The resulting target price is
INR42 (rounded).
We have revised the market share assumptions for
Suzlon as per our global market share model. The
cuts to our estimates result mostly from
deconsolidating Hansen due to a sell-down in
Suzlon’s stake in Hansen to 26%. The combined
effect of these has resulted in our target price
decreasing from INR50 to INR42.
Under our research model, for stocks with a
volatility indicator, the Neutral band is 10ppt
above and below the hurdle rate of 10.5% for
India stocks. Our 12-month target price of INR42
implies a potential return of -15.3%; thus, we
reiterate our Underweight (V) rating.
Risks Upside risks to our view include:
Stronger-than-expected order inflow and
regulatory stimulus
Stronger-than-expected pricing
Stronger-than-expected margins
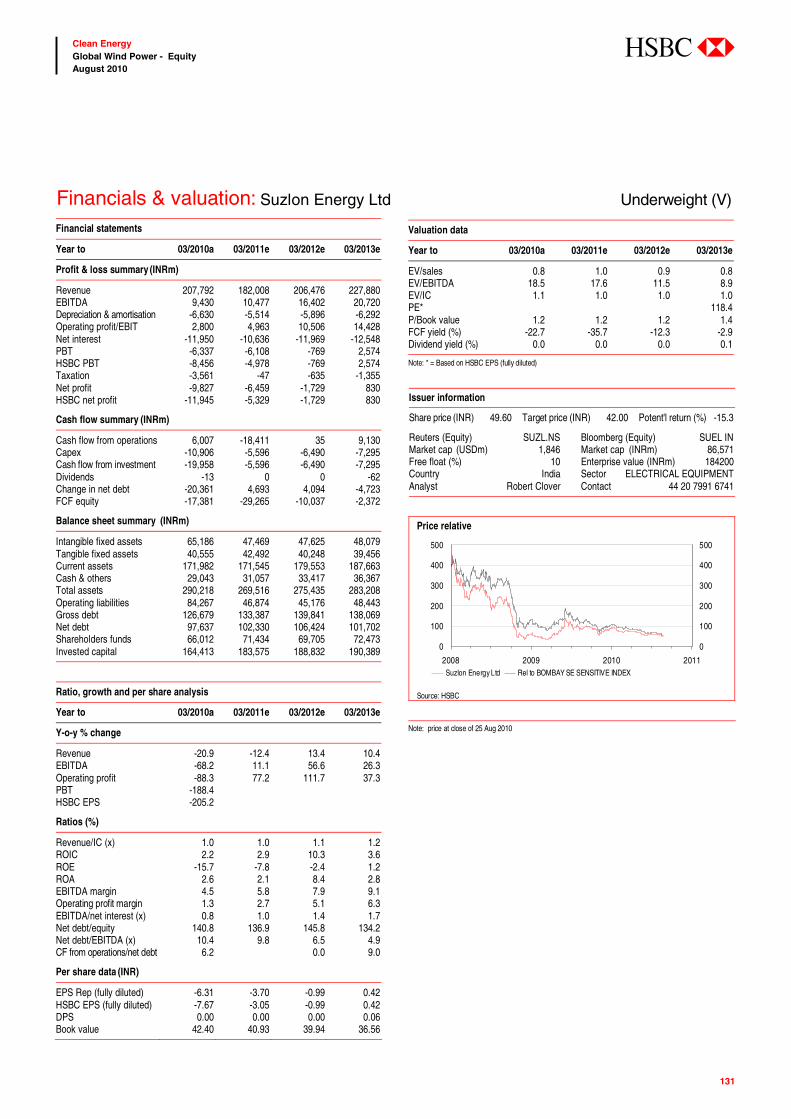
131
Clean Energy Global Wind Power - Equity August 2010
abc
Financials & valuation: Suzlon Energy Ltd Underweight (V) Financial statements
Year to 03/2010a 03/2011e 03/2012e 03/2013e
Profit & loss summary (INRm)
Revenue 207,792 182,008 206,476 227,880EBITDA 9,430 10,477 16,402 20,720Depreciation & amortisation -6,630 -5,514 -5,896 -6,292Operating profit/EBIT 2,800 4,963 10,506 14,428Net interest -11,950 -10,636 -11,969 -12,548PBT -6,337 -6,108 -769 2,574HSBC PBT -8,456 -4,978 -769 2,574Taxation -3,561 -47 -635 -1,355Net profit -9,827 -6,459 -1,729 830HSBC net profit -11,945 -5,329 -1,729 830
Cash flow summary (INRm)
Cash flow from operations 6,007 -18,411 35 9,130Capex -10,906 -5,596 -6,490 -7,295Cash flow from investment -19,958 -5,596 -6,490 -7,295Dividends -13 0 0 -62Change in net debt -20,361 4,693 4,094 -4,723FCF equity -17,381 -29,265 -10,037 -2,372
Balance sheet summary (INRm)
Intangible fixed assets 65,186 47,469 47,625 48,079Tangible fixed assets 40,555 42,492 40,248 39,456Current assets 171,982 171,545 179,553 187,663Cash & others 29,043 31,057 33,417 36,367Total assets 290,218 269,516 275,435 283,208Operating liabilities 84,267 46,874 45,176 48,443Gross debt 126,679 133,387 139,841 138,069Net debt 97,637 102,330 106,424 101,702Shareholders funds 66,012 71,434 69,705 72,473Invested capital 164,413 183,575 188,832 190,389
Ratio, growth and per share analysis
Year to 03/2010a 03/2011e 03/2012e 03/2013e
Y-o-y % change
Revenue -20.9 -12.4 13.4 10.4EBITDA -68.2 11.1 56.6 26.3Operating profit -88.3 77.2 111.7 37.3PBT -188.4 HSBC EPS -205.2
Ratios (%)
Revenue/IC (x) 1.0 1.0 1.1 1.2ROIC 2.2 2.9 10.3 3.6ROE -15.7 -7.8 -2.4 1.2ROA 2.6 2.1 8.4 2.8EBITDA margin 4.5 5.8 7.9 9.1Operating profit margin 1.3 2.7 5.1 6.3EBITDA/net interest (x) 0.8 1.0 1.4 1.7Net debt/equity 140.8 136.9 145.8 134.2Net debt/EBITDA (x) 10.4 9.8 6.5 4.9CF from operations/net debt 6.2 0.0 9.0
Per share data (INR)
EPS Rep (fully diluted) -6.31 -3.70 -0.99 0.42HSBC EPS (fully diluted) -7.67 -3.05 -0.99 0.42DPS 0.00 0.00 0.00 0.06Book value 42.40 40.93 39.94 36.56
Valuation data
Year to 03/2010a 03/2011e 03/2012e 03/2013e
EV/sales 0.8 1.0 0.9 0.8EV/EBITDA 18.5 17.6 11.5 8.9EV/IC 1.1 1.0 1.0 1.0PE* 118.4P/Book value 1.2 1.2 1.2 1.4FCF yield (%) -22.7 -35.7 -12.3 -2.9Dividend yield (%) 0.0 0.0 0.0 0.1
Note: * = Based on HSBC EPS (fully diluted)
Issuer information
Share price (INR) 49.60 Target price (INR) 42.00 Potent'l return (%) -15.3
Reuters (Equity) SUZL.NS Bloomberg (Equity) SUEL INMarket cap (USDm) 1,846 Market cap (INRm) 86,571Free float (%) 10 Enterprise value (INRm) 184200Country India Sector ELECTRICAL EQUIPMENTAnalyst Robert Clover Contact 44 20 7991 6741
Price relative
0
100
200
300
400
500
2008 2009 2010 2011
0
100
200
300
400
500
Suzlon Energy Ltd Rel to BOMBAY SE SENSITIVE INDEX
Source: HSBC Note: price at close of 25 Aug 2010
132
Clean Energy Global Wind Power - Equity August 2010
abc
Profit warning and H1 numbers Vestas’ 18th August H1 results were not a pretty
sight. They were significantly below expectations
with a large EBIT loss, attributed to very low
levels of operational gearing in H1 (20% we
estimate). To make matters worse, the company
also issued a profit warning, reducing revenue
expectations for the full year to EUR6bn from
EUR7bn and EBIT margins of 5-6% from 10-
11%. The stock fell 23% on the day.
Operational gearing is likely to recover in 2011 With this as a backdrop, investors may rightly ask
why we still have Vestas on an OW(V) rating.
Well, following the share price correction, we
believe that the stock looks undervalued, even on
our reduced estimates. In addition, Vestas has
flagged that the profit warning has resulted mostly
from lower than expected operational gearing
expectations. We do expect that with the strong
order flow that Vestas has shown in H1 (5.7GW)
that volumes will recover in 2011. With roughly
7GW of expected sales in 2011, we would expect
that margins will also recover to around 10-11%
from the expected depressed levels of 2010. One
key piece of guidance that was unchanged on the
results was the reiteration of expected 8-9GW of
orders expected to come in 2010. This underpins
our expectations for 2011e volume, operational
gearing and resultant margin recovery in 2011e.
In addition we note the following positives:
Vestas is most geared to demand recovery -
We believe that Vestas is most geared to
demand recovery due to its exposure to small
high growth markets and to smaller
Independent Power Producers (IPPs). During
the credit crisis, IPPs have found it difficult to
secure finance for their projects and we
believe that with the recent thaw in the
finance markets this segment should again
start placing orders thereby reviving growth.
Exposure to high growth offshore market
in Europe - Vestas and Siemens are the
Vestas (VWS DC)
Vestas is most geared to demand recovery and should benefit
more than other wind turbine manufacturers when demand
recovers
Vestas is our preferred stock in the challenged OEM sector.
However, we note that whilst we believe it is undervalued, in the
short term it may lack performance catalysts
We cut target price to DKK300 from DKK425 due to lower industry
growth expectations but we maintain the OW(V) rating
Robert Clover * Analyst HSBC Bank plc +44 20 7991 6741 robert.clover @hsbcib.com
James Magness* Analyst HSBC Bank plc +44 20 7991 3464 [email protected]
*Employed by a non-US affiliate of HSBC Securites (USA) Inc., and is not registered/qualified pursuant to FINRA regulations

133
Clean Energy Global Wind Power - Equity August 2010
abc
market leaders in the offshore turbine market
with c40% and c50% of the cumulative
market share (in MW) as at the end of 2009
(source: EWEA).
Market share gains expected - We believe
that Vestas should improve its market share,
particularly in China, where its market share
has fallen from c23% in 2006 to c4% in 2009
as some of the smaller Chinese players drop
out of the market. We estimate Vestas’s
global market share should increase by 1.5
percentage points from 14.5% in 2009 to
16.0% in 2014. This should see Vestas defend
its position as no. 1 player.
Undervalued - but share price performance may remain challenged short- term?
In spite of the medium term positives we see for
Vestas, we believe that the stock may remain
challenged in the short term. Management
credibility has taken a severe dent over the profit
warning, and as a result of this, the market seems
disinclined to give Vestas the benefit of the doubt
over the 2011e margin recovery. Vestas will need
to show further order flow to get the stock moving
as well as solid quarterly results and a decent
outlook statement for 2011 on 26th October 2010.
Continued strong order flow beyond 2010 will be
contingent on a good result to the US legislative
debate, which currently appears to have stalled.
Target price cut due to lower industry growth expectations
We have cut our target price for Vestas to
DKK300 from DKK425 earlier due to the lower
growth expectations for the wind industry. Our
five year demand CAGR (2009-14e) for new
installations is down from 7.5% to 7.0% and the
10-year demand CAGR (2009-14e) is down from
6.7% to 5.5%.
We have more conviction on Vestas than on
Gamesa
We have greater conviction on Vestas than on
Gamesa as it is more geographically diversified
and in our view, more geared to recovery in the
wind turbine market due to its exposure to smaller
IPPs. We expect that Vestas’s volumes will
recover in 2011 with the strong order flow that
Vestas has shown in H1 (5.7GW).and along with
it Vestas’s margins to around 10-11% from the
expected depressed levels of 2010.
Order flow improving… Vestas’s published order book at the end of June
2010 improved markedly in Q2 with 41% yoy
growth, and 93% sequential growth with the
backlog standing at 5,061MW. Vestas showed
over 3GW of new order inflow in Q2, almost as
much as the whole of 2009, and has shown
5.7GW of new orders YTD.
Vestas also announced on 26 April, a 1,500MW
order with EDPR (with an option for an additional
600MW), representing c17% of the total expected
order inflow of 8-9GW for 2010e. The wind
turbines are to be delivered in 2011 and 2012.
Vestas: published order backlog
MW Q-o-q Y-o-Y
30-Jun-10 5,061 93% 41%
31-Mar-10 2,618 54% -43% 31-Dec-09 1,700 -44% -65% 30-Sep-09 3,014 -16% -48% 30-Jun-09 3,596 -21% -45% 31-Mar-09 4,570 -5% 7% 31-Dec-08 4,806 -18% 9% 30-Sep-08 5,848 -10% 48% 30-Jun-08 6,529 52% 44% 31-Mar-08 4,283 -3% -3% 31-Dec-07 4,415 12% 10% 30-Sep-07 3,946 -13% 30-Jun-07 4,535 3% 31-Mar-07 4,400 10%
Source: HSBC

134
Clean Energy Global Wind Power - Equity August 2010
abc
FY10 forecasts We revise our forecast to take into account the
revised guidance given by Vestas for FY10. We now
forecast sales of c5.5GW for Vestas for FY10e from
c6.1GW previously. We have also reduced our EBIT
margin forecast for FY10e to 5.1% at the lower end
of the Vestas’s guidance of 5-6%. We expect
Vestas’s EBIT margin to bounce back to 10.5% in
FY11e (still lower than our previous estimate of
11.3%) and to reach 12.8% in FY2015e (previously
estimated to be 13.3%).
Impact of changes on our forecast We have cut our sales revenues forecasts by 14%
and our EPS forecasts by 61% for 2010e. For
2011e we have cut our revenue and EPS estimates
by 2% and 12% respectively.
We have cut our EPS to EUR0.97 from EUR2.52 in
FY10e and to EUR2.65 from EUR3.01 in FY11e.
We have reduced our long-term sales forecast by
c8% and our long-term EPS forecast by c12%.
See charts below.
Vestas – Sales forecast (EURm) – new vs. old
0
2,000
4,000
6,000
8,000
10,000
12,000
2010e 2011e 2012e 2013e 2014e
New forecasts Prev ious forecasts
Source: HSBC estimates
Vestas – EPS forecast (EUR) – new vs. old
0.00
1.00
2.00
3.00
4.00
5.00
2010e 2011e 2012e 2013e 2014e
New forecasts Prev ious forecasts
Source: HSBC estimates
HSBC vs. consensus Vestas – Sales forecast: HSBC vs. consensus (EURm)
Year Low Mean High HSBC HSBC % above/(below)
mean
2010e 5,831 5,999 6,125 6,024 0% 2011e 6,605 7,468 9,050 7,805 5% 2012e 6,722 8,666 10,408 8,810 2%
Source: Thomson Financial DataStream, HSBC Vestas – EBITDA forecast: HSBC vs. consensus (EURm)
Year Low Mean High HSBC HSBC % above/(below)
mean
2010e 539 594 647 604 2% 2011e 816 1,029 1,341 1,120 9% 2012e 938 1,256 1,599 1,359 8%
Source: Thomson Financial DataStream, HSBC
Valuation Using unchanged assumptions of a WACC of
9.0% (beta of 1.3, EMRP of 4.5% and gross cost
of debt of 6.0%), we derive fair values of
DKK258/share and DKK286/share using our two
different DCF methodologies (the HSBC four-
stage ROIC-based DCF and a ‘classic’ FCF-based
DCF). This gives us an average of DKK272/share.
We have applied a 10% premium (same as
previously) this due to Vestas’ market/technology
position, profitability and the fact that Vestas is
notably more liquid than all other pure-play wind
turbine manufacturer stocks. This gives a rounded
135
Clean Energy Global Wind Power - Equity August 2010
abc
target price of DKK300 (versus our prior target
price of DKK425).
Under our research model, for stocks with a
volatility indicator, the Neutral band is 10ppt
above and below the hurdle rate for Europe ex-
UK stocks of 8.5%. Our 12-month target price of
DKK300 implies a potential return of c32%,
which is above the Neutral band; thus, we rate the
stock Overweight (V).
Risks Downside risks to our view include:
Vestas could continue to lose market share in
light of fierce competition from China, GE
expanding in Europe and Siemens aiming to
become a top 3 wind player by 2012
Prolonged lack of financing could dent
Vestas’ clients’ ability to build out their
pipelines
Pricing risk due to overcapacity in the
industry
Macro issues, particularly in Southern
Europe, persist putting increasing focus on
governments reducing renewable incentive
Acquisition risk.
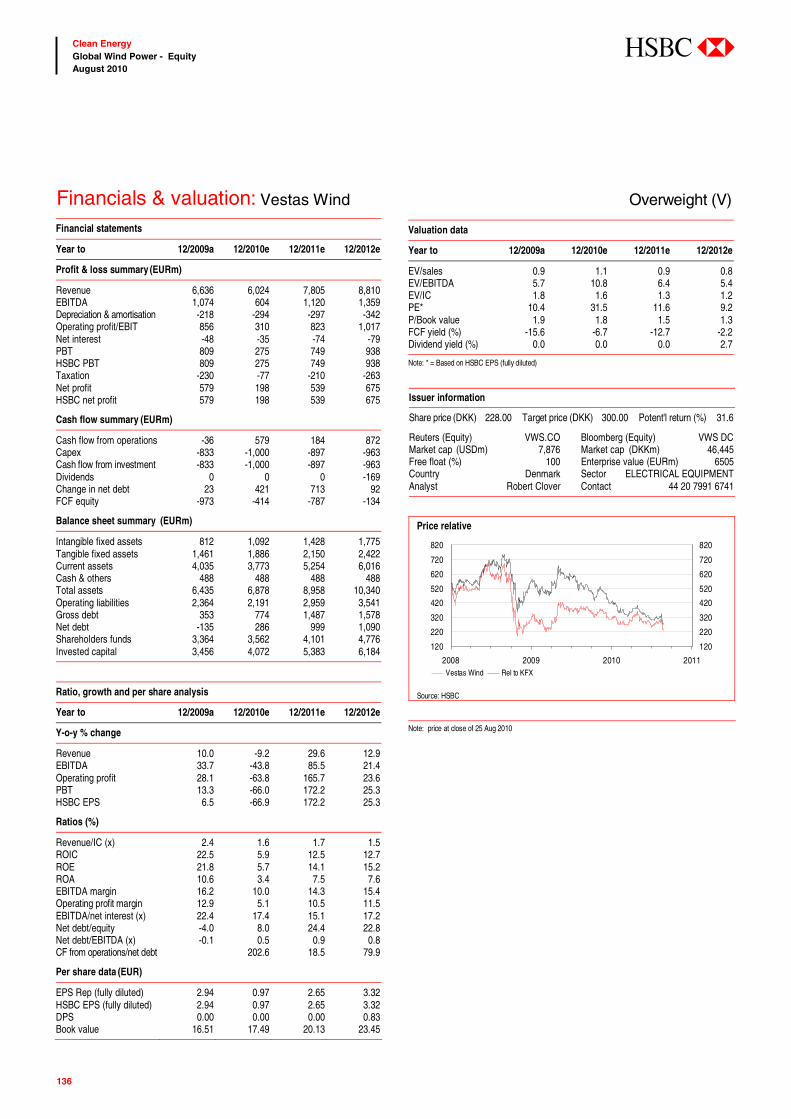
136
Clean Energy Global Wind Power - Equity August 2010
abc
Financials & valuation: Vestas Wind Overweight (V) Financial statements
Year to 12/2009a 12/2010e 12/2011e 12/2012e
Profit & loss summary (EURm)
Revenue 6,636 6,024 7,805 8,810EBITDA 1,074 604 1,120 1,359Depreciation & amortisation -218 -294 -297 -342Operating profit/EBIT 856 310 823 1,017Net interest -48 -35 -74 -79PBT 809 275 749 938HSBC PBT 809 275 749 938Taxation -230 -77 -210 -263Net profit 579 198 539 675HSBC net profit 579 198 539 675
Cash flow summary (EURm)
Cash flow from operations -36 579 184 872Capex -833 -1,000 -897 -963Cash flow from investment -833 -1,000 -897 -963Dividends 0 0 0 -169Change in net debt 23 421 713 92FCF equity -973 -414 -787 -134
Balance sheet summary (EURm)
Intangible fixed assets 812 1,092 1,428 1,775Tangible fixed assets 1,461 1,886 2,150 2,422Current assets 4,035 3,773 5,254 6,016Cash & others 488 488 488 488Total assets 6,435 6,878 8,958 10,340Operating liabilities 2,364 2,191 2,959 3,541Gross debt 353 774 1,487 1,578Net debt -135 286 999 1,090Shareholders funds 3,364 3,562 4,101 4,776Invested capital 3,456 4,072 5,383 6,184
Ratio, growth and per share analysis
Year to 12/2009a 12/2010e 12/2011e 12/2012e
Y-o-y % change
Revenue 10.0 -9.2 29.6 12.9EBITDA 33.7 -43.8 85.5 21.4Operating profit 28.1 -63.8 165.7 23.6PBT 13.3 -66.0 172.2 25.3HSBC EPS 6.5 -66.9 172.2 25.3
Ratios (%)
Revenue/IC (x) 2.4 1.6 1.7 1.5ROIC 22.5 5.9 12.5 12.7ROE 21.8 5.7 14.1 15.2ROA 10.6 3.4 7.5 7.6EBITDA margin 16.2 10.0 14.3 15.4Operating profit margin 12.9 5.1 10.5 11.5EBITDA/net interest (x) 22.4 17.4 15.1 17.2Net debt/equity -4.0 8.0 24.4 22.8Net debt/EBITDA (x) -0.1 0.5 0.9 0.8CF from operations/net debt 202.6 18.5 79.9
Per share data (EUR)
EPS Rep (fully diluted) 2.94 0.97 2.65 3.32HSBC EPS (fully diluted) 2.94 0.97 2.65 3.32DPS 0.00 0.00 0.00 0.83Book value 16.51 17.49 20.13 23.45
Valuation data
Year to 12/2009a 12/2010e 12/2011e 12/2012e
EV/sales 0.9 1.1 0.9 0.8EV/EBITDA 5.7 10.8 6.4 5.4EV/IC 1.8 1.6 1.3 1.2PE* 10.4 31.5 11.6 9.2P/Book value 1.9 1.8 1.5 1.3FCF yield (%) -15.6 -6.7 -12.7 -2.2Dividend yield (%) 0.0 0.0 0.0 2.7
Note: * = Based on HSBC EPS (fully diluted)
Issuer information
Share price (DKK) 228.00 Target price (DKK) 300.00 Potent'l return (%) 31.6
Reuters (Equity) VWS.CO Bloomberg (Equity) VWS DCMarket cap (USDm) 7,876 Market cap (DKKm) 46,445Free float (%) 100 Enterprise value (EURm) 6505Country Denmark Sector ELECTRICAL EQUIPMENTAnalyst Robert Clover Contact 44 20 7991 6741
Price relative
120
220
320
420
520
620
720
820
2008 2009 2010 2011
120
220
320
420
520
620
720
820
Vestas Wind Rel to KFX
Source: HSBC Note: price at close of 25 Aug 2010

137
Clean Energy Global Wind Power - Equity August 2010
abc
Disclosure appendix Analyst Certification Each analyst whose name appears as author of an individual chapter or individual chapters of this report certifies that the views about the subject security(ies) or issuer(s) or any other views or forecasts expressed in the chapter(s) of which (s)he is author accurately reflect his/her personal views and that no part of his/her compensation was, is or will be directly or indirectly related to the specific recommendation(s) or view(s) contained therein.
Important disclosures
Stock ratings and basis for financial analysis HSBC believes that investors utilise various disciplines and investment horizons when making investment decisions, which depend largely on individual circumstances such as the investor's existing holdings, risk tolerance and other considerations. Given these differences, HSBC has two principal aims in its equity research: 1) to identify long-term investment opportunities based on particular themes or ideas that may affect the future earnings or cash flows of companies on a 12 month time horizon; and 2) from time to time to identify short-term investment opportunities that are derived from fundamental, quantitative, technical or event-driven techniques on a 0-3 month time horizon and which may differ from our long-term investment rating. HSBC has assigned ratings for its long-term investment opportunities as described below.
This report addresses only the long-term investment opportunities of the companies referred to in the report. As and when HSBC publishes a short-term trading idea the stocks to which these relate are identified on the website at www.hsbcnet.com/research. Details of these short-term investment opportunities can be found under the Reports section of this website.
HSBC believes an investor's decision to buy or sell a stock should depend on individual circumstances such as the investor's existing holdings and other considerations. Different securities firms use a variety of ratings terms as well as different rating systems to describe their recommendations. Investors should carefully read the definitions of the ratings used in each research report. In addition, because research reports contain more complete information concerning the analysts' views, investors should carefully read the entire research report and should not infer its contents from the rating. In any case, ratings should not be used or relied on in isolation as investment advice.
Rating definitions for long-term investment opportunities
Stock ratings HSBC assigns ratings to its stocks in this sector on the following basis:
For each stock we set a required rate of return calculated from the risk free rate for that stock's domestic, or as appropriate, regional market and the relevant equity risk premium established by our strategy team. The price target for a stock represents the value the analyst expects the stock to reach over our performance horizon. The performance horizon is 12 months. For a stock to be classified as Overweight, the implied return must exceed the required return by at least 5 percentage points over the next 12 months (or 10 percentage points for a stock classified as Volatile*). For a stock to be classified as Underweight, the stock must be expected to underperform its required return by at least 5 percentage points over the next 12 months (or 10 percentage points for a stock classified as Volatile*). Stocks between these bands are classified as Neutral.
Our ratings are re-calibrated against these bands at the time of any 'material change' (initiation of coverage, change of volatility status or change in price target). Notwithstanding this, and although ratings are subject to ongoing management review, expected returns will be permitted to move outside the bands as a result of normal share price fluctuations without necessarily triggering a rating change.
*A stock will be classified as volatile if its historical volatility has exceeded 40%, if the stock has been listed for less than 12 months (unless it is in an industry or sector where volatility is low) or if the analyst expects significant volatility. However,

138
Clean Energy Global Wind Power - Equity August 2010
abc
stocks which we do not consider volatile may in fact also behave in such a way. Historical volatility is defined as the past month's average of the daily 365-day moving average volatilities. In order to avoid misleadingly frequent changes in rating, however, volatility has to move 2.5 percentage points past the 40% benchmark in either direction for a stock's status to change.
Rating distribution for long-term investment opportunities
As of 27 August 2010, the distribution of all ratings published is as follows: Overweight (Buy) 50% (21% of these provided with Investment Banking Services)
Neutral (Hold) 37% (17% of these provided with Investment Banking Services)
Underweight (Sell) 13% (19% of these provided with Investment Banking Services)
Information regarding company share price performance and history of HSBC ratings and price targets in respect of its long-term investment opportunities for the companies the subject of this report,is available from www.hsbcnet.com/research.
HSBC & Analyst disclosures Disclosure checklist
Company Ticker Recent price Price Date Disclosure
ACCIONA SA ANA.MC 62.61 27-Aug-2010 1, 2, 5, 7CLIPPER WINDPOWER CWPR.L 0.44 27-Aug-2010 2, 7, 11EDP RENOVAVEIS EDPR.LS 4.45 27-Aug-2010 6GAMESA CORP TECNOLOGICA S GAM.MC 5.22 27-Aug-2010 4IBERDROLA RENOVABLES S.A IBR.MC 2.54 27-Aug-2010 11NORDEX NDXGk.DE 6.87 27-Aug-2010 6, 11REPOWER SYSTEMS RPWGn.DE 99.45 27-Aug-2010 1, 5, 6, 11TERNA ENERGY SA TENr.AT 3.49 27-Aug-2010 2VESTAS WIND VWS.CO 234.20 27-Aug-2010 2, 7, 11
Source: HSBC
1 HSBC* has managed or co-managed a public offering of securities for this company within the past 12 months. 2 HSBC expects to receive or intends to seek compensation for investment banking services from this company in the next
3 months. 3 At the time of publication of this report, HSBC Securities (USA) Inc. is a Market Maker in securities issued by this
company. 4 As of 31 July 2010 HSBC beneficially owned 1% or more of a class of common equity securities of this company. 5 As of 31 July 2010, this company was a client of HSBC or had during the preceding 12 month period been a client of
and/or paid compensation to HSBC in respect of investment banking services. 6 As of 31 July 2010, this company was a client of HSBC or had during the preceding 12 month period been a client of
and/or paid compensation to HSBC in respect of non-investment banking-securities related services. 7 As of 31 July 2010, this company was a client of HSBC or had during the preceding 12 month period been a client of
and/or paid compensation to HSBC in respect of non-securities services. 8 A covering analyst/s has received compensation from this company in the past 12 months. 9 A covering analyst/s or a member of his/her household has a financial interest in the securities of this company, as
detailed below. 10 A covering analyst/s or a member of his/her household is an officer, director or supervisory board member of this
company, as detailed below. 11 At the time of publication of this report, HSBC is a non-US Market Maker in securities issued by this company and/or in
securities in respect of this company Analysts, economists, and strategists are paid in part by reference to the profitability of HSBC which includes investment banking revenues.
For disclosures in respect of any company mentioned in this report, please see the most recently published report on that company available at www.hsbcnet.com/research.
* HSBC Legal Entities are listed in the Disclaimer below.

139
Clean Energy Global Wind Power - Equity August 2010
abc
Additional disclosures 1 This report is dated as at 31 August 2010. 2 All market data included in this report are dated as at close 25 August 2010, unless otherwise indicated in the report. 3 HSBC has procedures in place to identify and manage any potential conflicts of interest that arise in connection with its
Research business. HSBC's analysts and its other staff who are involved in the preparation and dissemination of Research operate and have a management reporting line independent of HSBC's Investment Banking business. Information Barrier procedures are in place between the Investment Banking and Research businesses to ensure that any confidential and/or price sensitive information is handled in an appropriate manner.
4 As of 31 July 2010, HSBC and/or its affiliates (including the funds, portfolios and investment clubs in securities managed by such entities) either, directly or indirectly, own or are involved in the acquisition, sale or intermediation of, 1% or more of the total capital of the subject companies securities in the market for the following Company(ies) : GAMESA CORP TECNOLOGICA S
5 HSBC Trinkaus & Burkhardt acts as a designated sponsor to the following companies, and as such has an agreement with such companies to engage in market making activities and/or to publish research in connection with the securities of the following company(ies) : REPOWER SYSTEMS , NORDEX

140
Clean Energy Global Wind Power - Equity August 2010
abc
Disclaimer * Legal entities as at 31 January 2010 'UAE' HSBC Bank Middle East Limited, Dubai; 'HK' The Hongkong and Shanghai Banking Corporation Limited, Hong Kong; 'TW' HSBC Securities (Taiwan) Corporation Limited; 'CA' HSBC Securities (Canada) Inc, Toronto; HSBC Bank, Paris branch; HSBC France; 'DE' HSBC Trinkaus & Burkhardt AG, Dusseldorf; 000 HSBC Bank (RR), Moscow; 'IN' HSBC Securities and Capital Markets (India) Private Limited, Mumbai; 'JP' HSBC Securities (Japan) Limited, Tokyo; 'EG' HSBC Securities Egypt S.A.E., Cairo; 'CN' HSBC Investment Bank Asia Limited, Beijing Representative Office; The Hongkong and Shanghai Banking Corporation Limited, Singapore branch; The Hongkong and Shanghai Banking Corporation Limited, Seoul Securities Branch; The Hongkong and Shanghai Banking Corporation Limited, Seoul Branch; HSBC Securities (South Africa) (Pty) Ltd, Johannesburg; 'GR' HSBC Pantelakis Securities S.A., Athens; HSBC Bank plc, London, Madrid, Milan, Stockholm, Tel Aviv, 'US' HSBC Securities (USA) Inc, New York; HSBC Yatirim Menkul Degerler A.S., Istanbul; HSBC México, S.A., Institución de Banca Múltiple, Grupo Financiero HSBC, HSBC Bank Brasil S.A. - Banco Múltiplo, HSBC Bank Australia Limited, HSBC Bank Argentina S.A., HSBC Saudi Arabia Limited.
Issuer of report HSBC Bank plc
8 Canada Square
London, E14 5HQ, United Kingdom
Telephone: +44 20 7991 8888
Fax: +44 20 7992 4880
Website: www.research.hsbc.com
In the UK this document has been issued and approved by HSBC Bank plc (“HSBC”) for the information of its Clients (as defined in the Rules of FSA) and those of its affiliates only. It is not intended for Retail Clients in the UK. If this research is received by a customer of an affiliate of HSBC, its provision to the recipient is subject to the terms of business in place between the recipient and such affiliate. HSBC Securities (USA) Inc. accepts responsibility for the content of this research report prepared by its non-US foreign affiliate. All U.S. persons receiving and/or accessing this report and wishing to effect transactions in any security discussed herein should do so with HSBC Securities (USA) Inc. in the United States and not with its non-US foreign affiliate, the issuer of this report. In Singapore, this publication is distributed by The Hongkong and Shanghai Banking Corporation Limited, Singapore Branch for the general information of institutional investors or other persons specified in Sections 274 and 304 of the Securities and Futures Act (Chapter 289) (“SFA”) and accredited investors and other persons in accordance with the conditions specified in Sections 275 and 305 of the SFA. This publication is not a prospectus as defined in the SFA. It may not be further distributed in whole or in part for any purpose. The Hongkong and Shanghai Banking Corporation Limited Singapore Branch is regulated by the Monetary Authority of Singapore. Recipients in Singapore should contact a "Hongkong and Shanghai Banking Corporation Limited, Singapore Branch" representative in respect of any matters arising from, or in connection with this report. In Australia, this publication has been distributed by The Hongkong and Shanghai Banking Corporation Limited (ABN 65 117 925 970, AFSL 301737) for the general information of its “wholesale” customers (as defined in the Corporations Act 2001). Where distributed to retail customers, this research is distributed by HSBC Bank Australia Limited (AFSL No. 232595). These respective entities make no representations that the products or services mentioned in this document are available to persons in Australia or are necessarily suitable for any particular person or appropriate in accordance with local law. No consideration has been given to the particular investment objectives, financial situation or particular needs of any recipient. This publication has been distributed in Japan by HSBC Securities (Japan) Limited. It may not be further distributed, in whole or in part, for any purpose. In Hong Kong, this document has been distributed by The Hongkong and Shanghai Banking Corporation Limited in the conduct of its Hong Kong regulated business for the information of its institutional and professional customers; it is not intended for and should not be distributed to retail customers in Hong Kong. The Hongkong and Shanghai Banking Corporation Limited makes no representations that the products or services mentioned in this document are available to persons in Hong Kong or are necessarily suitable for any particular person or appropriate in accordance with local law. All inquiries by such recipients must be directed to The Hongkong and Shanghai Banking Corporation Limited. In Korea, this publication is distributed by The Hongkong and Shanghai Banking Corporation Limited, Seoul Securities Branch ("HBAP SLS") for the general information of professional investors specified in Article 9 of the Financial Investment Services and Capital Markets Act (“FSCMA”). This publication is not a prospectus as defined in the FSCMA. It may not be further distributed in whole or in part for any purpose. HBAP SLS is regulated by the Financial Services Commission and the Financial Supervisory Service of Korea. This document is not and should not be construed as an offer to sell or the solicitation of an offer to purchase or subscribe for any investment. HSBC has based this document on information obtained from sources it believes to be reliable but which it has not independently verified; HSBC makes no guarantee, representation or warranty and accepts no responsibility or liability as to its accuracy or completeness. The opinions contained within the report are based upon publicly available information at the time of publication and are subject to change without notice. Nothing herein excludes or restricts any duty or liability to a customer which HSBC has under the Financial Services and Markets Act 2000 or under the Rules of FSA. A recipient who chooses to deal with any person who is not a representative of HSBC in the UK will not enjoy the protections afforded by the UK regulatory regime. Past performance is not necessarily a guide to future performance. The value of any investment or income may go down as well as up and you may not get back the full amount invested. Where an investment is denominated in a currency other than the local currency of the recipient of the research report, changes in the exchange rates may have an adverse effect on the value, price or income of that investment. In case of investments for which there is no recognised market it may be difficult for investors to sell their investments or to obtain reliable information about its value or the extent of the risk to which it is exposed. HSBC Bank plc is registered in England No 14259, is authorised and regulated by the Financial Services Authority and is a member of the London Stock Exchange. © Copyright. HSBC Bank plc 2010, ALL RIGHTS RESERVED. No part of this publication may be reproduced, stored in a retrieval system, or transmitted, on any form or by any means, electronic, mechanical, photocopying, recording, or otherwise, without the prior written permission of HSBC Bank plc. MICA (P) 142/06/2010 and MICA (P) 193/04/2010

*Employed by a non-US affiliate of HSBC Securities (USA) Inc, and is not registered/qualified pursuant to FINRA regulations.
Au
gu
st 2
010
Becalm
ed
?
By James Magness and Robert Clover
We have cut our five year wind industry global demand CAGR estimate to
7.0% from 7.5% previously and our 10-year CAGR estimate to 5.5% from 6.7%
We remain cautious on the wind OEMs, and see few near term catalysts for share
price performance. Our favourite part of the value chain is still the wind
farm developers, and Acciona and EDP R, both rated OW(V),
are our highest conviction investment ideas
We cut target prices on Acciona, Hansen Tranmissions, Iberdrola Renovables, EDP Renovaveis,
EDF Energies Nouvelles, Vestas, Gamesa, Repower, and Suzlon, and increase our target
price on Clipper. We have downgraded Gamesa and Repower to N(V) from OW(V)
and upgraded Clipper from N(V) to OW(V)
Becalmed?Is it all over for the global wind markets?
Disclosures and Disclaimer This report must be read with the disclosures and analyst
certifications in the Disclosure appendix, and with the Disclaimer, which forms part of it
Global Clean Energy – Equity
August 2010
Glo
bal C
lean
En
erg
y –
Eq
uity
James Magness*
Analyst
HSBC Bank Plc
+44 20 7991 3464
James is an analyst in the Alternative Energy team based in London. He joined HSBC in August 2005 from a large accounting firm
where he qualified as a chartered accountant and worked in the Valuation and Strategy team. Prior to that he graduated from
Oxford University with a first class degree in Physics.
Robert Clover*
Analyst
HSBC Bank Plc
+44 20 7991 6741
Robert Clover is the Global Head of Alternative and Renewable Energy Equity Research and he joined HSBC in 2004.
Throughout his career he has been ranked in Extel, II and Greenwich. He has an MA (Hons) from Oxford in
Classics and Modern languages, is ACCA-qualified and has worked as an investment analyst since 1995.
100827_28253 Wind Industry thematic_F2:Layout 1 8/31/2010 1:02 AM Page 1


