
INCORPORATINGConstruction Update
LAST UPDATE12/05/2017
NOTINVESTMENTADVICE-FORINFORMATIONALPURPOSESONLY
Financial Research PackBERKELEY ENERGIA
SHAREINVESTORS.CO.UK

Disclaimers
Shareinvestors is not authorised by the Financial Conduct Authority to give investmentadvice. Independent financial advice from an authorised investment professional should always besought before making investment decisions. CAPITAL AT RISK.
ShareInvestors take no responsibility for the accuracy of the data presented herein. This analysis isindependent and not sponsored by the company presented. Figures may have been adjusted for ourown analysis and/or presentational purposes. The company may therefore report key metrics andfinancial basis on a different basis.

Page 3 / 44Disclaimer - Independent research with no association to Berkeley Energia (or related parties). Not financial advice. No responsibility for accuracy of figures can be accepted.
BERKELEY ENERGIATABLE OF CONTENTS
PageGeneral Information
A Company Information 4A1 Market Information 5A2 Key Company Milestones 6A3 Share Technical Analysis 7
Company ValuationB Overview of Valuation 8B1 Overview of DCF Calculation 9B2 Sensitivities to NPV 10B3 Broker Targets 11
Detailed Company ProjectionsC0 Graphical Overview of Projections 12C1 Corporate Assumptions 13C2 Projected Group P&L 14C3 Projected Group Cashflow 15
C3.1 Projected Company Funding Requirements 16C4.1 Project Salamanca Information 17
C.4.1.1 Project Salamanca Assumptions 18C4.1.2 Salamanca Project Financial Statements 19C4.2 Salamanca Satellites Project Information 20
C4.2.1 Salamanca Satellites Assumptions 21C4.2.2 Salamanca Satellites Financial Statements 22C4.3 Zona 7 Deeps Information 23
Detailed Historical Financial InformationD Key Performance Indicators 24D1 Graphical Overview of KPIs 25D2 Historical P&L 26
D2.1 Revenue and Cost Breakdown 27D2.2 Staff Costs Breakdown 28D2.3 Current and Deferred Tax 29D3 Historical Balance Sheet 30
D3.1 Capital Structure and Major Shareholders 31D3.2 Non Current Assets 32D3.3 Working Capital 33D4 Historical Cashflow Statement 34
Interim Financial InformationE2 Interim Profit & Loss 35E3 Interim Balance Sheet 36E4 Interim Cashflow Statement 37
Information on Mineral ResourcesF Mineral Reserve Statement 38
AppendixAP1 Glossary of Terms 40AP2 Management Profiles 41AP3 Overview of Equity Issues 42AP4 Overview of JORC Code Terms 43AP4 Consolidated Production 44
SHAREINVESTORS.CO.UK

Page 4 / 44Disclaimer - Independent research with no association to Berkeley Energia (or related parties). Not financial advice. No responsibility for accuracy of figures can be accepted.
BERKELEY ENERGIACompany Information
EPIC BKY Market Listing LSE/AIM Other Listing ASXAccounting Reference 30th June Market Index FTSE AIM All ShareLast Annual Report 30/06/2016 Sector General Mining, UraniumRegistered Perth, AU Rep. Currency A$ Denomination A$mCompanies House https://connectonline.asic.gov.au/Stock Exchange BKY OverviewCompany Website http://www.berkeleyenergia.com/
Description
Key Directors and Senior Management2016Chairman Non Executive Ian MiddlemasMD Executive Paul AtherleyCOO Non Board Francisco Bellón del RosalCFO Non Board Paul Thomson
Core RisksUranium Price Continuation of low uranium spot price will materially impact project NPV.CAPEX Overruns Delays or complications could impact CAPEX requirements.Regulatory Still some regulatory approvals required, delays may impact project.Core OpportunitiesExploration Upside Exploration area could significantly improve reserves.
ValuationMarket Cap (£'m) 139 Dividend Yield 0.00%Enterprise Value (£'m) 116 Current PE n/aRisked NPV (£'m) 252 Share Upside* 40% *Includes equity dillution assumption
Historic Value Highest Highest Date Lowest Lowest DateITD Share Price (p) 71.71 17/01/2017 10.913 20/03/2015Market Capitalisation ('m) 176 27/01/2017 20 04/03/2015
Share Misc.EMS 3,000 EMS Value £ 1,530Trading Service SETSqxTypical Spread 2.20% Break Even %* 2.7%Disclosable Short Interest 0.00%* On a £2,000 investment what % return required to break even. Takes account of broker fees, stamp duty and spread.
Berkeley Energia is focused on bringing its Uranium mine at Salamanca, Spain into production. This project is currently at apre construction stage and expected to be completed in 2019. The project economics are strong even in a continued lowuranium price environment.
-
20.00
40.00
60.00
80.00
100.00
120.00
140.00
160.00
180.00
200.00
0
10
20
30
40
50
60
70
80
07/2011
10/2011
01/2012
04/2012
07/2012
10/2012
01/2013
04/2013
07/2013
10/2013
01/2014
04/2014
07/2014
10/201
4
01/201
5 04/2015
07/2015
10/201
5
01/201
6 04/2016
07/2016
10/201
6
01/201
7 04/2017
MarketC
ap£'m
SharePrice(p)
BERKELEYENERGIA- SharePriceandMarketCapitalisation
SharePriceClose MKTCap Linear(SharePriceClose)
SHAREINVESTORS.CO.UK
SHAREINVESTORS.CO.UK

Page 5 / 44Disclaimer - Independent research with no association to Berkeley Energia (or related parties). Not financial advice. No responsibility for accuracy of figures can be accepted.
BERKELEY ENERGIAA1) MARKET INFORMATION
Sector General Mining, UraniumBarriers to Entry Moderate/High - Regulatory, Capital.Competition Uranium market is currently oversupplied and spot price is consequently at multi year lows.Risk of New Entrants Very low. Low profits due to oversupply situation.
Mining areas are licenced and usually adequate protection to incumbent miners.Regulatory Environment High, number of consents required to commence construction.
Growth OpportunitiesExploration Principle means of growth is further exploration, near mine or further afield. (Not considered likely for BKY)
TaxationCorporation Tax 30% Australian CT RateOverseas Corp Tax Most material component from Spain, CT rate is 25% so can expect a much lower effective rate than the Aussie Rate.Other Duties 2.5% State Royalty - paid on part of mine revenues only
0.2% Municipality Royalty, paid on all mine revenues.VAT Exempt from VAT, hence irrecoverable VAT on expenses.
Market Shares2016
Production Mlbs 2016 from Major Uranium MinersBKY Peak Production Mlbs 4 Cameco Mlbs 27 Areva Mlbs 25 Rio Tinto Mlbs 6 Paladin Energy Mlbs 5 BHP Billion Mlbs 4 Total Mlbs 72
*Source: InvestingNews.com
.
Uranium Price US$/Lb
The long term and short term price are both in a long term downtrend. There has been a short term improvement in prices in early 2017.
SHAREINVESTORS.CO.UK
BKYPeakProduction6%
Cameco38%
Areva
34%
RioTinto9%
PaladinEnergy7%
BHPBillion6%
ProductionMlbs2016fromMajorUraniumMiners
0
10
20
30
40
50
60
Jan-13
Mar-13
May-13
Jul-1
3
Sep-13
Nov-13
Jan-14
Mar-14
May-14
Jul-1
4
Sep-14
Nov-14
Jan-15
Mar-15
May-15
Jul-1
5
Sep-15
Nov-15
Jan-16
Mar-16
May-16
Jul-1
6
Sep-16
Nov-16
Jan-17
Mar-17
UraniumPriceUS$/Lb
LONGTERMUS$/LB SPOTUS$/LB
SHAREINVESTORS.CO.UK
SHAREINVESTORS.CO.UK

Page 6 / 44Disclaimer - Independent research with no association to Berkeley Energia (or related parties). Not financial advice. No responsibility for accuracy of figures can be accepted.
BERKELEY ENERGIAA2) TIMELINE AND KEY DATES
Financials and Trading (Approximate Dates)
27-Jul-17 Q4 Report June26-Sep-17 Annual Report Published26-Oct-17 Q1 Report September31-Jan-18 Q2 Report December15-Mar-18 Half Year Report Published 28-Apr-18 Q3 Report March
Other Key Dates
Q2 Expected Announcements on Financing/PartnershipsH2 Potential News of Exploration PartnershipsOngoing Construction Updates - includes consents and permits.
DividendsType Ex-Div Date Payment DateNone Applicable
SHAREINVESTORS.CO.UK

Page 7 / 44Disclaimer - Independent research with no association to Berkeley Energia (or related parties). Not financial advice. No responsibility for accuracy of figures can be accepted.
BERKELEY ENERGIAA3) SHARE PRICE TECHNICAL ANALYSIS
MOVING AVERAGES 20/50/200 - 1 YEAR CHART
Points of NoteGeneral - Fairly Bearish setup. A - Fallen below 200 Day MA in late April. First time occurred in one year.B - Recent resurgence, breaking above 20 MDA
LONG AND MEDIUM TERM TRENDS - 1 YEAR CHART
Points of NoteA - Long Term Trend still bullish, but wider travel within trend, indicating a lot of volatility rescently.B - Medium Trend is bearish and fairly steep.
SUMMARY
Potential buying opportunity, given the no news share price reaction.
The direction of travel is still up, which is consistent with further progress being made on the project. The volatility is increasing though and is consistent with a Uranium ETF taking a large position in the company, large redemptions are likely to have an indiscrimante effect on the share price.
SHAREINVESTORS.CO.UK

Page 8 / 44Disclaimer - Independent research with no association to Berkeley Energia (or related parties). Not financial advice. No responsibility for accuracy of figures can be accepted.
BERKELEY ENERGIAB - VALUATION SUMMARY
CURRENT MARKET VALUATIONSUK Shares AUS Shares
As at 12/05/2017 12/05/2017
Basic Shares in Issue #'m 254Current Share Price p 51 A$ 0.85Market Cap £'m 130 A$'m 217
Dilluted Shares (inc warrants/options) #m 273Current Share Price p 51Fully Dilluted Market Cap £'m 139 A$'m 233
Estimated Cash £'m 22.78 A$'m 38.14Estimated Debt £'m 0.00 A$'m 0.00Enterprise Value £'m 116 A$'m 195
(Discount)/Premium to NAV % 826%
Price:Earnings (PE) # n/a
Price:Cashflow Operations (PCFO) # n/a
Dividend p 0.00Current Dividend Yield % 0.00%
CALCULATED VALUATIONS
Risked Net Present Value (NPV10) £'m 252 A$'m 421NPV Per Share Valuation p 71 A$ 1.20Potential Upside % 40%
Unrisked NPV Per Share Valuation p 120.57 A$ 2.02Potential Upside % 136%
Forward PE (5yr Average) # -10
SHAREINVESTORS.CO.UK

Page 9 / 44Disclaimer - Independent research with no association to Berkeley Energia (or related parties). Not financial advice. No responsibility for accuracy of figures can be accepted.
BERKELEY ENERGIAB1 - VALUATION SUMMARY - DISCOUNTED CASHFLOW WORKINGS
DISCOUNTED CASHFLOW BASE CASE
Asset RefA$m
Unrisked£GBP
UnriskedRisk
Factor£GBP
RiskedGBP/Per
ShareCorporate Costs C3 -113.6 -63.1 1.0 -63.1 -0.18Salamanca Construction Project C4.1 647.7 359.8 0.7 251.9 0.72Salamanca Satellites C4.2 166.9 92.7 0.3 27.8 0.08Zona 7 Deeps C.4.3 20.0 11.1 1.0 11.1 0.03Cash Balance E3 43.2 24.0 1.0 24.0 0.07
764.2 424.5 251.7 0.71
i) AssumptionsDiscount Rate 10%GBP:A$ 1.8 Today 1.75Post Finance Share in Issue 352
GUIDANCE NOTESi) Discount Rate
ii) Margin of Safety (Mos)
Class Mos Risk Factor ExampleHighly Speculative 90% 10% Typically 'one trick' exploration, biotech.Speculative 60%-80% 20%-40% Companies/Assets in later stage of development.Growth 30%-50% 50%-70% Growing companies with varying earnings visibility.Steady 10%-20% 80%-90% Typically defensives, utilities.
Discount Rate for all valuations conducted by ShareInvestors is 10%. This represents the opportunity costs of forgoing an investmentdelivering a return of 10%, itself an achievable return in investing in a diversified equity portfolio.
Margin of Safety is designed to represent that the cashflows projected are risky. The margin of safety applied is the commercial chanceof success where known or an approximation based on the certainty of cashflows. Guidance I use:
SHAREINVESTORS.CO.UK

Page 10 / 44Disclaimer - Independent research with no association to Berkeley Energia (or related parties). Not financial advice. No responsibility for accuracy of figures can be accepted.
BERKELEY ENERGIAB2 - VALUATION SENSITIVITIES
Sensitivity - Uranium Price vs CAPEX Budget (Risked NPV per Share)
71.49 20.00 35.00 43.78 50.00 65.00-20.00% 9.7 44.8 80.1 93.8 146.7-5.00% 7.0 40.8 72.7 89.4 143.10.00% 6.1 39.4 71.5 87.8 141.95.00% 5.2 38.0 70.3 86.1 140.720.00% 2.4 33.8 66.5 80.6 137.1
Base Case Unrisked NPV assumes 2019 revenue drivers as follows:Uranium Price 43.78CAPEX Increase/(Decrease) 0.0%
.
ShareInvestors Base Case Valuation (Sch B1)
Sensitivity - Debt/Equity Ratio and Debt Interest Rates (Risked NPV Per Share)
u71.49 0% 25% 50% 75% 100%
5.00% 93.0 81.9 74.0 68.1 63.97.50% 89.4 79.8 72.7 67.5 63.910.00% 85.8 77.6 71.5 66.9 63.912.50% 81.9 75.3 70.2 66.3 63.915.00% 77.8 72.9 69.0 65.8 63.9
Base Case Unrisked NPV assumes 2019 revenue drivers as follows:Equity:Debt Ratio 50%Debt Interest Rate 10%
.
ShareInvestors Base Case Valuation (Sch B1)
Uranium Price
CA
PEX B
udget C
hange
This sensitivity adjusts average long term uranium contract price (before inflation)against CAPEX. It it quite clear that the valuation is highly sensitive to the uraniumprice
Equity Ratio
Debt Int R
ate
0.0
20.0
40.0
60.0
80.0
100.0
120.0
140.0
160.0
-20.00% -5.00% 0.00% 5.00% 20.00%
Risked
NPV
PerSha
re
CAPEXBudgetChange
Sensitivity- UraniumPricevsCAPEXBudget(RiskedNPVperShare)
20.00 35.00 43.78 50.00 65.00UraniumPrice
ShareInvestorsRiskedNPVpershare71.4p
SHAREINVESTORS.CO.UK
SHAREINVESTORS.CO.UK
0.0
10.0
20.0
30.0
40.0
50.0
60.0
70.0
80.0
90.0
100.0
0% 25% 50% 75% 100%
Risked
NPV
PerSha
re
Equity:DebtRatio
Sensitivity- Debt/EquityRatioandDebtInterestRates(RiskedNPVPerShare)
5.00% 7.50% 10.00% 12.50% 15.00% Debt Interest Rate
ShareInvestorsRiskedNPVpershare71p
SHAREINVESTORS.CO.UK

Page 11 / 44Disclaimer - Independent research with no association to Berkeley Energia (or related parties). Not financial advice. No responsibility for accuracy of figures can be accepted.
BERKELEY ENERGIAB3 - BROKER TARGETS
BERKELEY ENERGIA BROKER TARGETS
Broker Date RatingPrev Target (p)
New Target (p)
Upside (inc div)
Numis Securities 25/11/2017 Buy 80 57%Liberium Capital 23/02/2017 Hold 60 18%Peel Hunt (House) 27/02/2017 Buy 90 76%WH Ireland (House) 06/12/2016 Buy 128 151%ShareInvestors 12/05/2017 Buy 71 40%
Current Share Price 12/05/2017 51
80
60
90
128
71
51
0 20 40 60 80 100 120 140
NumisSecurities
LiberiumCapital
PeelHunt(House)
WHIreland(House)
ShareInvestors
CurrentSharePrice
SharePrice(pence)
BERKELEYENERGIABROKERTARGETS
SHAREINVESTORS.CO.UK
SHAREINVESTORS.CO.UK

Page 12 / 44Disclaimer - Independent research with no association to Berkeley Energia (or related parties). Not financial advice. No responsibility for accuracy of figures can be accepted.
BERKELEY ENERGIAC) GRAPHICAL SUMMARY OF PROJECTIONS
STANDARD CHARTS (NOTE - SOME MAY NOT BE APPLICABLE AT THIS STAGE)Title BERKELEY ENERGIA PROJECTED EARNINGS AND PE RATIO Title BERKELEY ENERGIA FREE CASH FLOW AND DIVIDEND YIELD
Primary Y Net Profit A$'m Primary Y Free Cash Flow A$'mSecondary Y PE Ratio Secondary Y Dividend Yield %
-40
-35
-30
-25
-20
-15
-10
-5
0
5
10
15
-40.0
-20.0
0.0
20.0
40.0
60.0
80.0
100.0
120.0
140.0
2016 2017 2018 2019 2020 2021 2022 2023 2024 2025 2026 2027 2028 2029 2030
PERatio
NetProfitA$'m
BERKELEYENERGIAPROJECTEDEARNINGSANDPERATIO
NetProfit Price:EarningsRatio(PER)
SHAREINVESTORS.CO.UK
SHAREINVESTORS.CO.UK
-5%
0%
5%
10%
15%
20%
25%
30%
35%
-100.0
-50.0
0.0
50.0
100.0
150.0
200.0
2016 2018 2020 2022 2024 2026 2028 2030 2032
Divide
ndYield%
FreeCashFlow
A$'m
BERKELEYENERGIAFREECASHFLOWANDDIVIDENDYIELD
FreeCashflow DividendYield

Page 13 / 44Disclaimer - Independent research with no association to Berkeley Energia (or related parties). Not financial advice. No responsibility for accuracy of figures can be accepted.
BERKELEY ENERGIAC1) GROUP PROJECTIONS - FORECAST ASSUMPTIONS
CONST PROJ PROJ PROJ PROJ PROJ PROJ PROJ PROJ PROJ PROJ PROJ PROJ PROJ PROJ PROJ PROJ PROJFY FY FY FY FY FY FY FY FY FY FY FY FY FY FY FY FY
Year End 30th June 2017 2018 2019 2020 2021 2022 2023 2024 2025 2026 2027 2028 2029 2030 2031 2032 2033
FORECAST ASSUMPTIONS
Currency ForecastUS$:A$ # 1.35 1.35 1.35 1.35 1.35 1.35 1.35 1.35 1.35 1.35 1.35 1.35 1.35 1.35 1.35 1.35 1.35 1.35
Salamanca Project Inputs (See Sch C4.1)Salamanca Revenue US$m - 37.04 118.63 191.16 252.48 256.26 260.11 264.01 243.61 231.05 198.46 153.61 110.91 77.16 - - - Salamanca OPEX US$m - (20.4) (40.6) (74.8) (97.2) (97.2) (97.2) (97.2) (88.4) (83.3) (72.1) (52.6) (37.3) (25.4) - - - Salamance Royalties US$m - (1.0) (1.2) (1.2) (1.7) (1.7) (1.8) (1.8) (1.7) (1.5) (1.3) (0.6) (0.2) (0.4) - - - Salamance Tax US$m - (4.5) (9.4) (20.4) (27.4) (28.4) (29.3) (30.3) (28.4) (27.2) (23.3) (19.0) (14.0) (9.9) - - - Salamance Depreciation US$m - (6.2) (19.5) (30.9) (40.3) (40.3) (40.3) (40.3) (36.6) (34.2) (29.0) (22.1) (15.7) (10.8) - - - Salamanca Royalty Finance US$m - (0.5) (1.6) (2.6) (3.5) (3.5) (3.6) (3.6) (3.4) (3.2) (2.7) (2.1) (1.5) (1.1) - - - Salamanca CAPEX/ABEX US$m (31.9) (51.6) (78.2) (46.3) (26.6) - - - - - - - - (131.5) - - -
Salamanca Satellites Inputs (See Sch C4.2)Salamanca Revenue US$m - - - - - - - - 32.61 33.10 33.60 86.28 125.79 188.24 265.40 269.38 273.42 Salamanca OPEX US$m - - - - - - - - (15.9) (15.9) (15.9) (34.6) (44.3) (78.8) (122.0) (122.0) (122.0) Salamance Royalties US$m - - - - - - - - (0.9) (0.9) (0.9) (1.0) (0.1) (0.1) (0.1) (0.1) (0.1) Salamance Tax US$m - - - - - - - - (3.0) (3.1) (3.2) (10.2) (16.8) (22.4) (29.1) (30.1) (31.1) Salamance Depreciation US$m - - - - - - - - (3.4) (3.4) (3.4) (8.6) (12.3) (18.1) (25.2) (25.2) (25.2) Salamanca Royalty Finance US$m - - - - - - - - (0.5) (0.5) (0.5) (1.2) (1.7) (1.8) (1.7) (1.7) (1.7) Salamanca CAPEX/ABEX US$m - - - - - - - - - (15.0) (15.0) (7.5) (7.5) - - - (80.0)
Zona 7 Deeps Inputs (See Sch C4.3)Exploration Expense A$m (10.00) - - - - - - - - - - - - - - - -
Corporate AssumptionsCorporate and Admin Expenses (1) A$m 1.35 2.70 3.38 3.46 3.55 3.63 3.73 3.82 3.91 4.01 4.11 4.21 4.32 4.43 4.54 4.65 4.77 4.89 Growth Rate Corporate (1) % 100.00% 25.00% 2.50% 2.50% 2.50% 2.50% 2.50% 2.50% 2.50% 2.50% 2.50% 2.50% 2.50% 2.50% 2.50% 2.50% 2.50%Business Development A$m 1.61 3.23 4.04 4.14 4.24 4.35 4.45 4.57 4.68 4.80 4.92 5.04 5.17 5.29 5.43 5.56 5.70 5.84 Growth Rate Bus Dev (2) % 100.00% 25.00% 2.50% 2.50% 2.50% 2.50% 2.50% 2.50% 2.50% 2.50% 2.50% 2.50% 2.50% 2.50% 2.50% 2.50% 2.50%
Funding Assumptions (See Sch C3.1)Finance Cost A$m - - (7.5) (7.5) (7.5) (7.5) (7.5) - - - - - - - - - - Shares in Issue # 352.1 352.1 352.1 352.1 352.1 352.1 352.1 352.1 352.1 352.1 352.1 352.1 352.1 352.1 352.1 352.1 352.1
Notes(1/2) Corporate - Big uplifts in early years to deal with costs of arranging financing and negotiating PPAs.
SHAREINVESTORS.CO.UK

Page 14 / 44Disclaimer - Independent research with no association to Berkeley Energia (or related parties). Not financial advice. No responsibility for accuracy of figures can be accepted.
BERKELEY ENERGIAC2) PROJECTED GROUP P&L
ACT PROJ PROJ PROJ PROJ PROJ PROJ PROJ PROJ PROJ PROJ PROJ PROJ PROJ PROJ PROJ PROJ PROJFY FY FY FY FY FY FY FY FY FY FY FY FY FY FY FY FY FY
Year End 30th June 2016 2017 2018 2019 2020 2021 2022 2023 2024 2025 2026 2027 2028 2029 2030 2031 2032 2033
PROJECTED P&L
Uranium Sales A$m - - 50.0 160.2 258.1 340.8 346.0 351.1 356.4 372.9 356.6 313.3 323.9 319.5 358.3 358.3 363.7 369.1 Other Revenue A$m 0.25 - - - - - - - - - - - - - - 1.0 2.0 3.0 Opex A$m - - (27.5) (54.8) (101.0) (131.3) (131.3) (131.3) (131.3) (140.8) (134.0) (118.8) (117.7) (110.2) (140.6) (164.6) (164.6) (164.6) Royalties A$m - - (1.4) (1.6) (1.6) (2.3) (2.4) (2.4) (2.4) (3.4) (3.2) (3.0) (2.1) (0.4) (0.6) (0.1) (0.1) (0.1) Gross Profit A$m 0.25 - 21.2 103.8 155.4 207.3 212.3 217.5 222.7 228.6 219.4 191.5 204.0 208.9 217.1 194.5 200.9 207.4 Corporate and Admin Expenses A$m (1.35) (2.7) (3.4) (3.5) (3.5) (3.6) (3.7) (3.8) (3.9) (4.0) (4.1) (4.2) (4.3) (4.4) (4.5) (4.7) (4.8) (4.9) Exploration and Evaluation A$m (9.21) (10.0) - - - - - - - - - - - - - - - - Business Development A$m (1.61) (3.2) (4.0) (4.1) (4.2) (4.3) (4.5) (4.6) (4.7) (4.8) (4.9) (5.0) (5.2) (5.3) (5.4) (5.6) (5.7) (5.8) Share Based Payments A$m (1.71) - - - - - - - - - - - - - - - - - EBITDA A$m (13.64) (15.9) 13.8 96.2 147.7 199.3 204.2 209.1 214.1 219.8 210.3 182.2 194.5 199.1 207.1 184.3 190.4 196.6 Depreciation A$m - - (8.3) (26.3) (41.8) (54.4) (54.4) (54.4) (54.4) (54.0) (50.8) (43.7) (41.4) (37.8) (39.0) (34.0) (34.0) (34.0) EBIT A$m (13.64) (15.9) 5.4 69.9 105.9 144.9 149.8 154.7 159.8 165.8 159.6 138.6 153.2 161.3 168.1 150.3 156.4 162.6 Finance Income A$m - - 0.4 0.5 0.2 0.3 0.7 1.2 1.8 2.7 3.6 4.4 5.1 5.7 6.5 6.8 7.1 7.9 Finance Costs A$m - - (8.2) (9.7) (11.1) (12.2) (12.3) (4.8) (4.9) (5.7) (5.5) (4.9) (4.1) (2.2) (1.5) (0.1) (0.1) (0.1) Profit/(loss) before Tax A$m (13.64) (15.9) (2.4) 60.6 95.0 133.0 138.2 151.1 156.7 162.8 157.6 138.0 154.1 164.9 173.0 157.0 163.5 170.4 Tax (charge)/ credit A$m - - (6.1) (12.7) (27.5) (37.0) (38.3) (39.6) (40.9) (42.4) (40.9) (35.9) (39.5) (41.7) (43.6) (39.3) (40.6) (42.0) Profit/(loss) after Tax A$m (13.64) (15.9) (8.5) 48.0 67.5 95.9 99.9 111.5 115.8 120.4 116.7 102.1 114.5 123.2 129.5 117.7 122.8 128.4
Segmental AnalysisCorporate A$m (4.43) (5.9) (14.9) (15.1) (15.3) (15.5) (15.7) (8.4) (8.6) (8.8) (9.0) (9.3) (9.5) (9.7) (10.0) (10.2) (10.5) (10.7) Salamanca A$m - - 6.1 62.6 82.6 111.1 114.9 118.7 122.6 115.0 110.2 94.5 77.1 56.8 40.1 - - - Salamanca Sats A$m - - - - - - - - - 11.5 12.0 12.5 41.8 70.4 92.9 120.1 124.2 128.2 Zona 7 Deeps A$m (9.21) (10.0) - - - - - - - - - - - - - - - -
A$m (13.64) (15.9) (8.8) 47.5 67.3 95.7 99.2 110.3 114.0 117.7 113.2 97.8 109.5 117.5 123.0 109.9 113.7 117.5
P&L ValuationsEarnings Per Share (EPS) A$ (5.00) (0.05) (0.02) 0.14 0.19 0.27 0.28 0.32 0.33 0.34 0.33 0.29 0.33 0.35 0.37 0.33 0.35 0.36 EPS Growth % n/a -99% -47% -665% 41% 42% 4% 12% 4% 4% -3% -12% 12% 8% 5% -9% 4% 5%Price:Earnings Ratio (PER) # (7) -18.87 -35.42 6.27 4.45 3.13 3.01 2.70 2.60 2.50 2.58 2.94 2.62 2.44 2.32 2.55 2.45 2.34Price:Earnings Growth (PEG) # (0.89) n/a n/a 1.41 1.42 1.04 1.12 1.04 1.04 0.97 0.88 1.12 1.08 n/a n/a n/a n/a n/a
SHAREINVESTORS.CO.UK
Page 15 / 44Disclaimer - Independent research with no association to Berkeley Energia (or related parties). Not financial advice. No responsibility for accuracy of figures can be accepted.
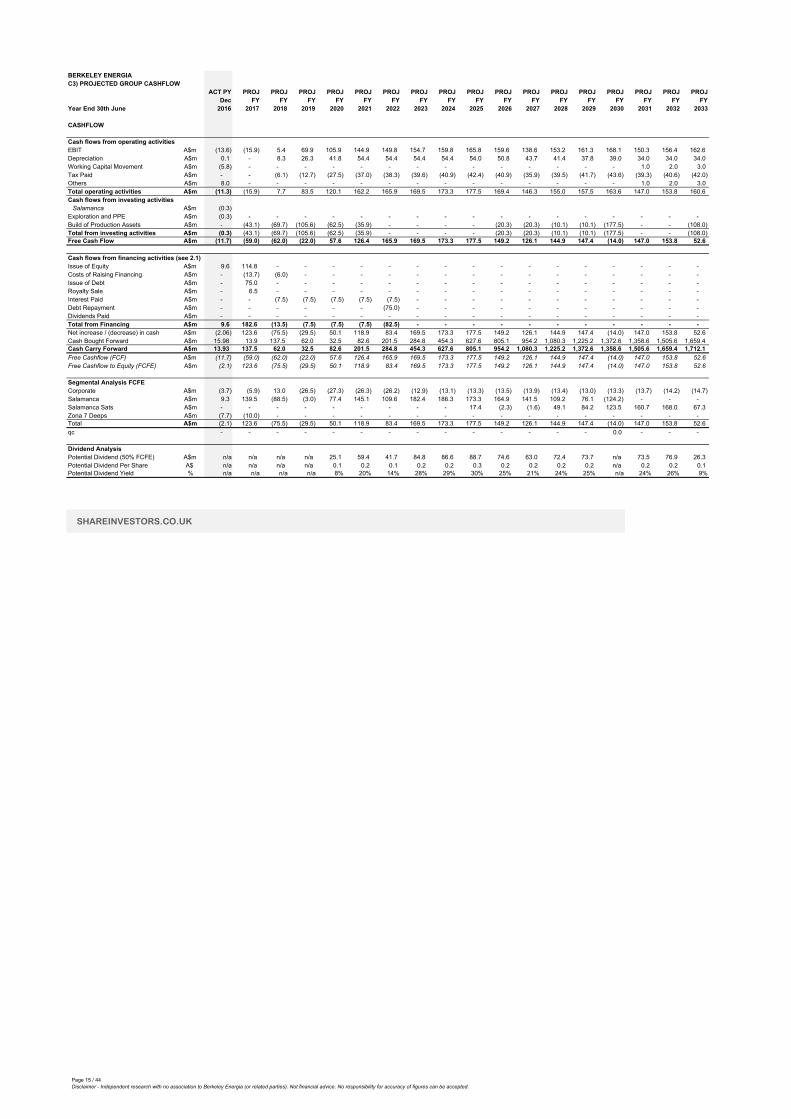
BERKELEY ENERGIAC3) PROJECTED GROUP CASHFLOW
ACT PY PROJ PROJ PROJ PROJ PROJ PROJ PROJ PROJ PROJ PROJ PROJ PROJ PROJ PROJ PROJ PROJ PROJDec FY FY FY FY FY FY FY FY FY FY FY FY FY FY FY FY FY
Year End 30th June 2016 2017 2018 2019 2020 2021 2022 2023 2024 2025 2026 2027 2028 2029 2030 2031 2032 2033
CASHFLOW
Cash flows from operating activitiesEBIT A$m (13.6) (15.9) 5.4 69.9 105.9 144.9 149.8 154.7 159.8 165.8 159.6 138.6 153.2 161.3 168.1 150.3 156.4 162.6 Depreciation A$m 0.1 - 8.3 26.3 41.8 54.4 54.4 54.4 54.4 54.0 50.8 43.7 41.4 37.8 39.0 34.0 34.0 34.0 Working Capital Movement A$m (5.8) - - - - - - - - - - - - - - 1.0 2.0 3.0 Tax Paid A$m - - (6.1) (12.7) (27.5) (37.0) (38.3) (39.6) (40.9) (42.4) (40.9) (35.9) (39.5) (41.7) (43.6) (39.3) (40.6) (42.0) Others A$m 8.0 - - - - - - - - - - - - - - 1.0 2.0 3.0 Total operating activities A$m (11.3) (15.9) 7.7 83.5 120.1 162.2 165.9 169.5 173.3 177.5 169.4 146.3 155.0 157.5 163.6 147.0 153.8 160.6 Cash flows from investing activities
Salamanca A$m (0.3) Exploration and PPE A$m (0.3) - - - - - - - - - - - - - - - - - Build of Production Assets A$m - (43.1) (69.7) (105.6) (62.5) (35.9) - - - - (20.3) (20.3) (10.1) (10.1) (177.5) - - (108.0) Total from investing activities A$m (0.3) (43.1) (69.7) (105.6) (62.5) (35.9) - - - - (20.3) (20.3) (10.1) (10.1) (177.5) - - (108.0) Free Cash Flow A$m (11.7) (59.0) (62.0) (22.0) 57.6 126.4 165.9 169.5 173.3 177.5 149.2 126.1 144.9 147.4 (14.0) 147.0 153.8 52.6
Cash flows from financing activities (see 2.1)Issue of Equity A$m 9.6 114.8 - - - - - - - - - - - - - - - - Costs of Raising Financing A$m - (13.7) (6.0) - - - - - - - - - - - - - - - Issue of Debt A$m - 75.0 - - - - - - - - - - - - - - - - Royalty Sale A$m - 6.5 - - - - - - - - - - - - - - - - Interest Paid A$m - - (7.5) (7.5) (7.5) (7.5) (7.5) - - - - - - - - - - - Debt Repayment A$m - - - - - - (75.0) - - - - - - - - - - - Dividends Paid A$m - - - - - - - - - - - - - - - - - - Total from Financing A$m 9.6 182.6 (13.5) (7.5) (7.5) (7.5) (82.5) - - - - - - - - - - - Net increase / (decrease) in cash A$m (2.06) 123.6 (75.5) (29.5) 50.1 118.9 83.4 169.5 173.3 177.5 149.2 126.1 144.9 147.4 (14.0) 147.0 153.8 52.6 Cash Bought Forward A$m 15.98 13.9 137.5 62.0 32.5 82.6 201.5 284.8 454.3 627.6 805.1 954.2 1,080.3 1,225.2 1,372.6 1,358.6 1,505.6 1,659.4 Cash Carry Forward A$m 13.93 137.5 62.0 32.5 82.6 201.5 284.8 454.3 627.6 805.1 954.2 1,080.3 1,225.2 1,372.6 1,358.6 1,505.6 1,659.4 1,712.1 Free Cashflow (FCF) A$m (11.7) (59.0) (62.0) (22.0) 57.6 126.4 165.9 169.5 173.3 177.5 149.2 126.1 144.9 147.4 (14.0) 147.0 153.8 52.6 Free Cashflow to Equity (FCFE) A$m (2.1) 123.6 (75.5) (29.5) 50.1 118.9 83.4 169.5 173.3 177.5 149.2 126.1 144.9 147.4 (14.0) 147.0 153.8 52.6
Segmental Analysis FCFECorporate A$m (3.7) (5.9) 13.0 (26.5) (27.3) (26.3) (26.2) (12.9) (13.1) (13.3) (13.5) (13.9) (13.4) (13.0) (13.3) (13.7) (14.2) (14.7) Salamanca A$m 9.3 139.5 (88.5) (3.0) 77.4 145.1 109.6 182.4 186.3 173.3 164.9 141.5 109.2 76.1 (124.2) - - - Salamanca Sats A$m - - - - - - - - - 17.4 (2.3) (1.6) 49.1 84.2 123.5 160.7 168.0 67.3 Zona 7 Deeps A$m (7.7) (10.0) - - - - - - - - - - - - - - - - Total A$m (2.1) 123.6 (75.5) (29.5) 50.1 118.9 83.4 169.5 173.3 177.5 149.2 126.1 144.9 147.4 (14.0) 147.0 153.8 52.6 qc - - - - - - - - - - - - - - 0.0 - - -
Dividend AnalysisPotential Dividend (50% FCFE) A$m n/a n/a n/a n/a 25.1 59.4 41.7 84.8 86.6 88.7 74.6 63.0 72.4 73.7 n/a 73.5 76.9 26.3 Potential Dividend Per Share A$ n/a n/a n/a n/a 0.1 0.2 0.1 0.2 0.2 0.3 0.2 0.2 0.2 0.2 n/a 0.2 0.2 0.1 Potential Dividend Yield % n/a n/a n/a n/a 8% 20% 14% 28% 29% 30% 25% 21% 24% 25% n/a 24% 26% 9%
SHAREINVESTORS.CO.UK

Page 16 / 44Disclaimer - Independent research with no association to Berkeley Energia (or related parties). Not financial advice. No responsibility for accuracy of figures can be accepted.
BERKELEY ENERGIAC3.1) PROJECTED FUNDING NEEDS
ACT PY PROJ PROJ PROJ PROJ PROJ PROJ PROJ PROJ PROJ PROJ PROJ PROJ PROJ PROJ PROJ PROJ PROJDec FY FY FY FY FY FY FY FY FY FY FY FY FY FY FY FY FY
Year End 30th June 2016 2017 2018 2019 2020 2021 2022 2023 2024 2025 2026 2027 2028 2029 2030 2031 2032 2033
Surplus/(Defecit) Prior to Financing A$m (11.7) (59.0) (62.0) (22.0) 57.6 126.4 165.9 169.5 173.3 177.5 149.2 126.1 144.9 147.4 (14.0) 147.0 153.8 52.6
Funding InstrumentsExisiting Equity Raises A$m 9.6 39.8 Costs of Raising Financing A$m (2.4) Royalty Sold A$m 6.5 New Equity Raised (1) A$m 75.0 Debt Tranche 1 (2) A$m 75.0 Debt Tranche 2 (3) A$mCosts of New Financing A$m (11.3) (6.0) Repayment Debt A$m (75.0) Interest Paid A$m - - (7.5) (7.5) (7.5) (7.5) (7.5) Total from Financing A$m 9.6 182.6 (13.5) (7.5) (7.5) (7.5) (82.5) - - - - - - - - - - - Net increase / (decrease) in cash A$m 9.60 123.61 (75.52) (29.54) 50.13 118.86 83.35 169.53 173.27 177.46 149.17 126.09 144.88 147.36 (13.97) 147.02 153.80 52.64 Cash Bought Forward A$m - 9.60 133.21 57.69 28.14 78.27 197.13 280.49 450.02 623.28 800.75 949.91 1,076.01 1,220.88 1,368.24 1,354.27 1,501.29 1,655.09 Cash Carry Forward A$m 9.60 133.21 57.69 28.14 78.27 197.13 280.49 450.02 623.28 800.75 949.91 1,076.01 1,220.88 1,368.24 1,354.27 1,501.29 1,655.09 1,707.74
Share Capital Share Capital B/F #'m 180.4 198.3 352.1 352.1 352.1 352.1 352.1 352.1 352.1 352.1 352.1 352.1 352.1 352.1 352.1 352.1 352.1 352.1 Existing Equity Raises #'m 18.0 56.2 New Equity Raise #'m 97.6 Share Capital C/F #'m 198.3 352.1 352.1 352.1 352.1 352.1 352.1 352.1 352.1 352.1 352.1 352.1 352.1 352.1 352.1 352.1 352.1 352.1
DEBT PACKAGE ASSUMPTIONSTotal Finance Package A$m 150.0
(1) Equity Component A$m 75.0 75.0 Current Share Price A$ p/s 0.85Assumed Equity Discount % -10%Assumed Issue Price A$ p/s 0.77Total New Shares Issued #'m 97.6Assumed Transaction Cost % 10%Assumed Transaction Cost A$m 7.5Proportion of Total Package % 50%
(2) Debt Tranche 1 A$m 75.0 75.0 Features Secured, non convertibleTerms yrs 6Coupon Rate % 10.0%Assumed Transaction Cost % 5%Assumed Transaction Cost A$m 3.75Annual Interest A$m 7.5Proportion of Total Package % 50%
(3) Debt Tranche 2 A$m - - Features Secured, non convertibleTerms yrs 5Coupon Rate % 7.5%Assumed Transaction Cost % 2.5%Assumed Transaction Cost A$m 6Annual Interest A$m 0Proportion of Total Package % 0%
FINANCE INCOMEInterest on Cash % 0.5% 0.5% 0.5% 0.5% 0.5% 0.5% 0.5% 0.5% 0.5% 0.5% 0.5% 0.5% 0.5% 0.5% 0.5% 0.5% 0.5% 0.5%
CASH B/F A$m - 9.60 133.21 57.69 28.14 78.27 197.13 280.49 450.02 623.28 800.75 949.91 1,076.01 1,220.88 1,368.24 1,354.27 1,501.29 1,655.09 CASH C/F 9.60 133.21 57.69 28.14 78.27 197.13 280.49 450.02 623.28 800.75 949.91 1,076.01 1,220.88 1,368.24 1,354.27 1,501.29 1,655.09 1,707.74 Average Balance A$m - 71.40 95.45 42.91 53.21 137.70 238.81 365.25 536.65 712.01 875.33 1,012.96 1,148.45 1,294.56 1,361.25 1,427.78 1,578.19 1,681.41
Expected Finance Income A$m 0.36 0.48 0.21 0.27 0.69 1.19 1.83 2.68 3.56 4.38 5.06 5.74 6.47 6.81 7.14 7.89 8.41
SHAREINVESTORS.CO.UK

Page 17 / 44Disclaimer - Independent research with no association to Berkeley Energia (or related parties). Not financial advice. No responsibility for accuracy of figures can be accepted.
BERKELEY ENERGIAC4.1) SALAMANCA PROJECT
OVERVIEW ReservesMlbs
Project Location: Salamanca, Spain (See Figure 1) Individual Deposits*: Alameda 19.03 Stage: Late Stage Appraisal (See Figure 2) Zona 7 24.14 CAPEX: 234.60 US$m Retortillo 12.13 OPEX: $15.05 cash cost 55.30 First Production: 2018Concept: Open Pit Other Comments: NoneEquity Ownership: 100%
SHAREINVESTOR VALUATION** PRODUCTION PROFILE**
Project LevelIRR % 56%NPV10 (ignoring finance) US$m 365.5
To Equity HoldersNPV10 A$m 647.7
GEO OVERVIEWS
Figure 1 Figure 2
NOTES*Includes Proved and Probable only and adjusted for grade cutoffs (differed from figure 2)** Likely differs from company issued valuations, due to differing assumptions.
SHAREINVESTORS.CO.UK
0.00
1.00
2.00
3.00
4.00
5.00
6.00
2017 2018 2019 2020 2021 2022 2023 2024 2025 2026 2027 2028 2029 2030
BKYSALAMANCA- PRODUCTIONPROFILE
RetortilloNetProduction Zona7NetProduction AlamedaNetProduction
SHAREINVESTORS.CO.UK

Page 18 / 44Disclaimer - Independent research with no association to Berkeley Energia (or related parties). Not financial advice. No responsibility for accuracy of figures can be accepted.
BERKELEY ENERGIAC4.1.1) SALAMANCA PROJECT ASSUMPTIONS
CONST PROJ PROJ PROJ PROJ PROJ PROJ PROJ PROJ PROJ PROJ PROJ PROJ PROJ PROJ PROJFY FY FY FY FY FY FY FY FY FY FY FY FY FY TOTAL
Year End 30th June 2017 2018 2019 2020 2021 2022 2023 2024 2025 2026 2027 2028 2029 2030
FORECAST ASSUMPTIONS
Inflation AssumptionsGeneral % 1.5% 1.5% 1.5% 1.5% 1.5% 1.5% 1.5% 1.5% 1.5% 1.5% 1.5% 1.5% 1.5% 1.5% 1.5%
CAPEX AssumptionsBase Case Capex (+/-) % 0.0%Retortillo CAPEX US$m 95.70Zona 7 CAPEX US$m 59.20Alameda CAPEX US$m 79.70Retortillo CAPEX Profile US$m 33.3% 33.3% 33.3% 100.0%Zona 7 CAPEX Profile US$m 33.3% 33.3% 33.3% 100.0%Alameda CAPEX Profile US$m 33.3% 33.3% 33.3% 100.0%
Project Life and ReservesRetortillo Life Yr 1.00 1.00 1.00 1.00 1.00 1.00 1.00 1.00 1.00 1.00 1.00 1.00 1.00 13.00Zona 7 Life Yr 1.00 1.00 1.00 1.00 1.00 1.00 1.00 1.00 1.00 1.00 1.00 1.00 12.00Alameda Life Yr 1.00 1.00 1.00 1.00 1.00 1.00 1.00 1.00 1.00 1.00 1.00 11.00Retortillo Ore Reserves Mlbs 12.13 Zona 7 Reserves Mlbs 24.14 Alameda Reserves Mlbs 19.03
Currency and CommodityProject Functional Currency US$mUranium Price US$/lb 43.78 44.44 45.10 45.78 46.47 47.16 47.87 48.59 49.32 50.06 50.81 51.57 52.34 53.13 53.93
OPEX AssumptionsRetortillo OPEX US$/lb 21.5 21.82 22.15 22.48 22.82 23.16 23.51 23.86 24.22 24.58 24.95 25.33 25.71 26.09 26.48Zona 7 OPEX US$/lb 9.9 10.05 10.20 10.35 10.51 10.67 10.83 10.99 11.15 11.32 11.49 11.66 11.84 12.01 12.19Alameda OPEX US$/lb 19.5 19.79 20.09 20.39 20.70 21.01 21.32 21.64 21.97 22.30 22.63 22.97 23.31 23.66 24.02
ABEX AssumptionsRehandling US$m 83.5 83.5Rehab and Closure US$m 48 48
Production Metallurgical Recovery % 88%Retortillo Production Profile % 0.0% 7.7% 7.7% 7.7% 11.0% 11.0% 11.0% 11.0% 10.0% 9.0% 8.0% 3.0% 1.0% 1.9% 100.0%Zona 7 Production Profile % 0.0% 0.0% 8.3% 8.3% 11.0% 11.0% 11.0% 11.0% 10.0% 9.0% 7.0% 6.0% 4.2% 3.1% 100.0%Alameda Production Profile % 0.0% 0.0% 0.0% 9.1% 11.0% 11.0% 11.0% 11.0% 10.0% 10.0% 9.0% 8.0% 6.5% 3.4% 100.0%Total Net Production Possible Mlbs 48.67Retortillo Net Production Mlbs 0.00 0.82 0.82 0.82 1.17 1.17 1.17 1.17 1.07 0.96 0.85 0.32 0.11 0.20Zona 7 Net Production Mlbs 0.00 0.00 1.77 1.77 2.34 2.34 2.34 2.34 2.12 1.91 1.49 1.27 0.89 0.66Alameda Net Production Mlbs 0.00 0.00 0.00 1.52 1.84 1.84 1.84 1.84 1.67 1.67 1.51 1.34 1.09 0.57
Royalty/Tax AssumptionsTax Losses Bought Forward (2) US$m (9.24) Spanish Tax Rate % 25% 25% 25% 25% 25% 25% 25% 25% 25% 25% 25% 25% 25% 25% 25%State Reserves Royalty (1) % 2.5% 2.5% 2.5% 2.5% 2.5% 2.5% 2.5% 2.5% 2.5% 2.5% 2.5% 2.5% 2.5% 2.5% 2.5%Municipilty Royalty % 0.20% 0.2% 0.2% 0.2% 0.2% 0.2% 0.2% 0.2% 0.2% 0.2% 0.2% 0.2% 0.2% 0.2% 0.2%RCF/Anglo Royalty % 1.38% 1.38% 1.38% 1.38% 1.38% 1.38% 1.38% 1.38% 1.38% 1.38% 1.38% 1.38% 1.38% 1.38% 1.38%
Depreciation Profile% 0.0% 1.7% 5.3% 8.5% 11.0% 11.0% 11.0% 11.0% 10.0% 9.3% 7.9% 6.0% 4.3% 2.9%
Notes(1) Applies only to Alameda Production(2) Assumes 75% of losses relate to spanish company.
SHAREINVESTORS.CO.UK

Page 19 / 44Disclaimer - Independent research with no association to Berkeley Energia (or related parties). Not financial advice. No responsibility for accuracy of figures can be accepted.
BERKELEY ENERGIA4.1.2 ) SALAMANCA PROJECT - PROJECTED CASHFLOW AND P&L
PROJ PROJ PROJ PROJ PROJ PROJ PROJ PROJ PROJ PROJ PROJ PROJ PROJ PROJ PROJFY FY FY FY FY FY FY FY FY FY FY FY FY FY TOTAL
Year End 30th June 2017 2018 2019 2020 2021 2022 2023 2024 2025 2026 2027 2028 2029 2030
PROJECT CASHFLOW
Cash flows from operating activitiesRetortillo Revenues US$m - 37.0 37.6 38.2 55.4 56.2 57.1 57.9 53.4 48.8 44.0 16.8 5.7 10.9 519.1 Zona 7 Revenues US$m - - 81.0 82.2 110.2 111.9 113.5 115.2 106.3 97.1 76.7 66.7 47.4 35.5 1,043.8 Alameda Revenues US$m - - - 70.7 86.9 88.2 89.5 90.9 83.8 85.1 77.7 70.1 57.8 30.7 831.6 Retortillo OPEX US$m - (20.4) (20.4) (20.4) (29.1) (29.1) (29.1) (29.1) (26.5) (23.8) (21.2) (7.9) (2.6) (5.0) (264.7) Zona 7 Opex US$m - - (20.2) (20.2) (26.7) (26.7) (26.7) (26.7) (24.3) (21.8) (17.0) (14.6) (10.2) (7.5) (242.5) Alamesa Opex US$m - - - (34.2) (41.4) (41.4) (41.4) (41.4) (37.7) (37.7) (33.9) (30.1) (24.5) (12.8) (376.7) Alameda State Royalty US$m - (0.9) (0.9) (1.0) (1.4) (1.4) (1.4) (1.4) (1.3) (1.2) (1.1) (0.4) (0.1) (0.3) (13.0) Municipilty Royalty US$m - (0.1) (0.2) (0.2) (0.3) (0.3) (0.3) (0.3) (0.3) (0.3) (0.2) (0.2) (0.1) (0.1) (3.1) Tax Paid US$m - (4.5) (9.4) (20.4) (27.4) (28.4) (29.3) (30.3) (28.4) (27.2) (23.3) (19.0) (14.0) (9.9) (271.6) Cash flow from operating activities US$m - 11.2 67.5 94.8 126.1 128.9 131.8 134.7 125.2 119.0 101.7 81.3 59.3 41.5 1,223.0 Cash flows from investing activitiesRetortillo CAPEX US$m (31.9) (31.9) (31.9) - - - - - - - - - - - (95.7) Zona 7 CAPEX US$m - (19.7) (19.7) (19.7) - - - - - - - - - - (59.2) Alameda CAPEX US$m - - (26.6) (26.6) (26.6) - - - - - - - - - (79.7) ABEX US$m - - - - - - - - - - - - - (131.5) (131.5) Cash flow from investing activities US$m (31.9) (51.6) (78.2) (46.3) (26.6) - - - - - - - - (131.5) (366.1) Cash flows from financing activitiesRCF Royalty US$m - (0.5) (1.6) (2.6) (3.5) (3.5) (3.6) (3.6) (3.4) (3.2) (2.7) (2.1) (1.5) (1.1) (33.0) Other US$m - - - - - - - - - - - - - - Cash flows from financing activities US$m - (0.5) (1.6) (2.6) (3.5) (3.5) (3.6) (3.6) (3.4) (3.2) (2.7) (2.1) (1.5) (1.1) (33.0) Net increase / (decrease) in cash US$m (31.9) (41.0) (12.3) 45.8 96.0 125.4 128.2 131.1 121.8 115.8 99.0 79.2 57.8 (91.0) 823.8
Notesn.a
PROJECT P&L
Revenue US$m - 37.0 118.6 191.2 252.5 256.3 260.1 264.0 243.6 231.0 198.5 153.6 110.9 77.2 2,394.5 OPEX US$m - (20.4) (40.6) (74.8) (97.2) (97.2) (97.2) (97.2) (88.4) (83.3) (72.1) (52.6) (37.3) (25.4) (883.8) Royalties US$m - (1.0) (1.2) (1.2) (1.7) (1.7) (1.8) (1.8) (1.7) (1.5) (1.3) (0.6) (0.2) (0.4) (16.1) EBITDA US$m - 15.7 76.9 115.1 153.5 157.3 161.1 165.0 153.6 146.2 125.1 100.4 73.3 51.4 1,494.6 Depreciation US$m - (6.2) (19.5) (30.9) (40.3) (40.3) (40.3) (40.3) (36.6) (34.2) (29.0) (22.1) (15.7) (10.8) (366.0) Interest US$m - (0.5) (1.6) (2.6) (3.5) (3.5) (3.6) (3.6) (3.4) (3.2) (2.7) (2.1) (1.5) (1.1) (33.0) Profit Before Tax US$m - 9.0 55.7 81.6 109.8 113.5 117.2 121.1 113.6 108.8 93.4 76.2 56.1 39.6 1,095.5 Tax US$m - (4.5) (9.4) (20.4) (27.4) (28.4) (29.3) (30.3) (28.4) (27.2) (23.3) (19.0) (14.0) (9.9) (271.6) Net Profit US$m - 4.5 46.4 61.2 82.3 85.1 87.9 90.8 85.2 81.6 70.0 57.1 42.1 29.7 823.9
TAX CHARGE
Tax LossesLosses B/F US$m 9.2 9.2 18.2 - - - - - - - - - - - - Tax Relief US$m - 9.0 (18.2) - - - - - - - - - - - - Losses C/F US$m 9.2 18.2 - - - - - - - - - - - - -
Tax Losses US$m - 18.0 37.5 81.6 109.8 113.5 117.2 121.1 113.6 108.8 93.4 76.2 56.1 39.6 Tax Charge US$m - (4.5) (9.4) (20.4) (27.4) (28.4) (29.3) (30.3) (28.4) (27.2) (23.3) (19.0) (14.0) (9.9)
PROJECT NPVDiscount Rate % 10%Pre Finance NPV US$m 365.50IRR % 56%
SHAREINVESTORS.CO.UK
Page 20 / 44Disclaimer - Independent research with no association to Berkeley Energia (or related parties). Not financial advice. No responsibility for accuracy of figures can be accepted.
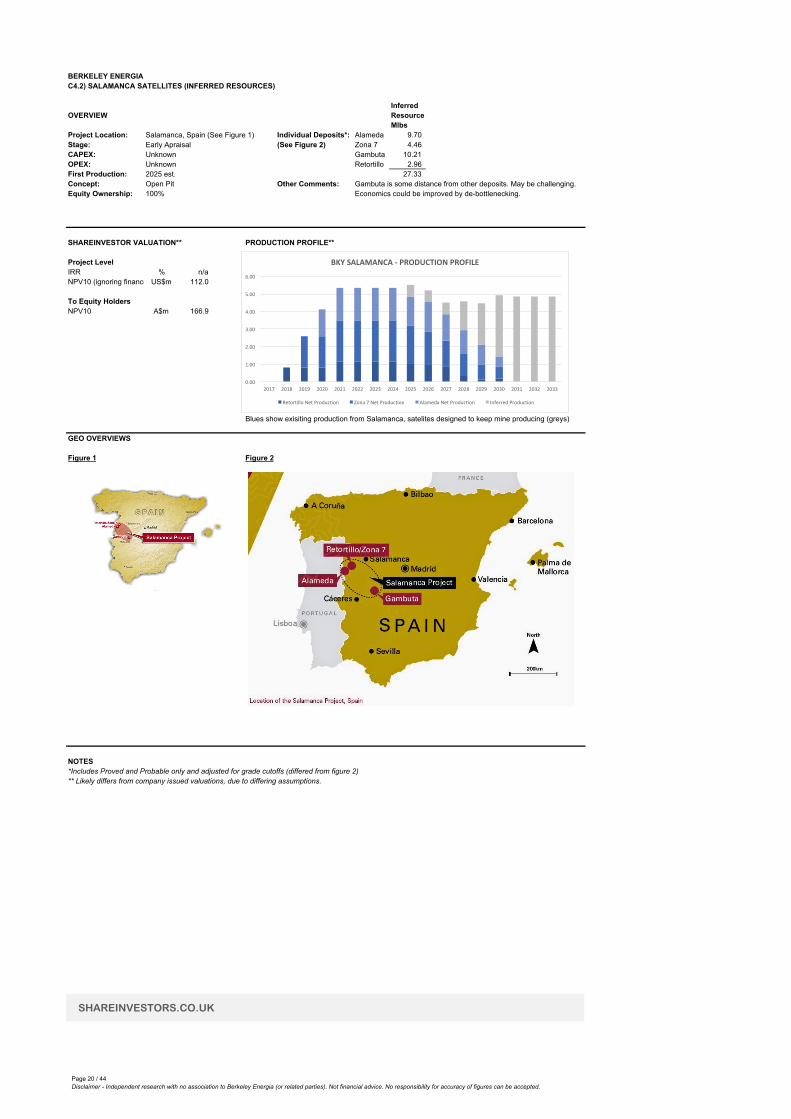
BERKELEY ENERGIAC4.2) SALAMANCA SATELLITES (INFERRED RESOURCES)
OVERVIEWMlbs
Project Location: Salamanca, Spain (See Figure 1) Individual Deposits*: Alameda 9.70 Stage: Early Apraisal (See Figure 2) Zona 7 4.46 CAPEX: Unknown Gambuta 10.21 OPEX: Unknown Retortillo 2.96 First Production: 2025 est. 27.33 Concept: Open Pit Other Comments: Gambuta is some distance from other deposits. May be challenging.Equity Ownership: 100% Economics could be improved by de-bottlenecking.
SHAREINVESTOR VALUATION** PRODUCTION PROFILE**
Project LevelIRR % n/aNPV10 (ignoring finance) US$m 112.0
To Equity HoldersNPV10 A$m 166.9
Blues show exisiting production from Salamanca, satelites designed to keep mine producing (greys)
GEO OVERVIEWS
Figure 1 Figure 2
NOTES*Includes Proved and Probable only and adjusted for grade cutoffs (differed from figure 2)** Likely differs from company issued valuations, due to differing assumptions.
Inferred Resource
SHAREINVESTORS.CO.UK
0.00
1.00
2.00
3.00
4.00
5.00
6.00
2017 2018 2019 2020 2021 2022 2023 2024 2025 2026 2027 2028 2029 2030 2031 2032 2033
BKYSALAMANCA- PRODUCTIONPROFILE
RetortilloNetProduction Zona7NetProduction AlamedaNetProduction InferredProduction

Page 21 / 44Disclaimer - Independent research with no association to Berkeley Energia (or related parties). Not financial advice. No responsibility for accuracy of figures can be accepted.
BERKELEY ENERGIAC4.2.1) SALAMANCA SATS PROJECT ASSUMPTIONS
CONST PROJ PROJ PROJ PROJ PROJ PROJ PROJ PROJ PROJ PROJ PROJ PROJ PROJ PROJ PROJ PROJ PROJ PROJFY FY FY FY FY FY FY FY FY FY FY FY FY FY FY FY FY TOTAL
Year End 30th June 2017 2018 2019 2020 2021 2022 2023 2024 2025 2026 2027 2028 2029 2030 2031 2032 2033
FORECAST ASSUMPTIONS
Inflation AssumptionsGeneral % 1.5% 1.5% 1.5% 1.5% 1.5% 1.5% 1.5% 1.5% 1.5% 1.5% 1.5% 1.5% 1.5% 1.5% 1.5% 1.5% 1.5% 1.5%
CAPEX AssumptionsBase Case Capex (+/-) % 0.0%Retortillo Sat/Inf CAPEX US$m 15.00Zona 7 Sat/Inf CAPEX US$m 15.00Alameda Sat/Inf CAPEX US$m 15.00Gambuta US$m 30.00Retortillo CAPEX Profile US$m 100.0% 100.0%Zona 7 CAPEX Profile US$m 100.0% 100.0%Alameda CAPEX Profile US$m 50.0% 50.0% 100.0%Gambuta Profile US$m 50.0% 50.0% 100.0%
Project Life and ReservesRetortillo Life Yr 1.00 1.00 1.00 1.00 4.00Zona 7 Life Yr 1.00 1.00 1.00 1.00 1.00 1.00 6.00Alameda Life Yr 1.00 1.00 1.00 1.00 1.00 5.00Gambuta Life Yr 1.00 1.00 1.00 1.00 4.00Retortillo Reserves Mlbs 2.96 Zona 7 Reserves Mlbs 4.46 Alameda Reserves Mlbs 9.70 Gambuta Reserves Mlbs 10.21
Currency and CommodityProject Functional Currency US$mUranium Price US$/lb 43.78 44.44 45.10 45.78 46.47 47.16 47.87 48.59 49.32 50.06 50.81 51.57 52.34 53.13 53.93 54.74 55.56 56.39
OPEX AssumptionsRetortillo OPEX US$/lb 21.5 21.82 22.15 22.48 22.82 23.16 23.51 23.86 24.22 24.58 24.95 25.33 25.71 26.09 26.48 26.88 27.28 27.69Zona 7 OPEX US$/lb 9.9 10.05 10.20 10.35 10.51 10.67 10.83 10.99 11.15 11.32 11.49 11.66 11.84 12.01 12.19 12.38 12.56 12.75Alameda OPEX US$/lb 19.5 19.79 20.09 20.39 20.70 21.01 21.32 21.64 21.97 22.30 22.63 22.97 23.31 23.66 24.02 24.38 24.75 25.12Gambuta OPEX US$/lb 27 27.41 27.82 28.23 28.66 29.09 29.52 29.97 30.42 30.87 31.33 31.80 32.28 32.77 33.26 33.76 34.26 34.78
ABEX AssumptionsRehandling US$m 50 50.00Rehab and Closure US$m 30 30.00
Production Metallurgical Recovery % 88%Retortillo Production Profile % 0.0% 0.0% 0.0% 0.0% 0.0% 0.0% 0.0% 0.0% 25.0% 25.0% 25.0% 25.0% 0.0% 0.0% 0.0% 0.0% 0.0% 100%Zona 7 Production Profile % 0.0% 0.0% 0.0% 0.0% 0.0% 0.0% 0.0% 0.0% 0.0% 0.0% 0.0% 8.0% 19.0% 19.0% 18.0% 18.0% 18.0% 100%Alameda Production Profile % 0.0% 0.0% 0.0% 0.0% 0.0% 0.0% 0.0% 0.0% 0.0% 0.0% 0.0% 0.0% 10.0% 20.0% 22.0% 24.0% 24.0% 100%Gambuta Production Profile % 0.0% 0.0% 0.0% 0.0% 0.0% 0.0% 0.0% 0.0% 0.0% 0.0% 0.0% 0.0% 0.0% 12.5% 29.0% 29.0% 29.0% 100%Total Net Production Possible Mlbs 24.05Retortillo Net Production Mlbs 0.00 0.00 0.00 0.00 0.00 0.00 0.00 0.00 0.65 0.65 0.65 0.65 0.00 0.00 0.00 0.00 0.00 2.61Zona 7 Net Production Mlbs 0.00 0.00 0.00 0.00 0.00 0.00 0.00 0.00 0.00 0.00 0.00 0.31 0.75 0.75 0.71 0.71 0.71 3.92Alameda Net Production Mlbs 0.00 0.00 0.00 0.00 0.00 0.00 0.00 0.00 0.00 0.00 0.00 0.68 1.62 1.62 1.54 1.54 1.54 8.54Gambuta Net Production Mlbs 0.00 0.00 0.00 0.00 0.00 0.00 0.00 0.00 0.00 0.00 0.00 0.00 0.00 1.12 2.61 2.61 2.61 8.94
Royalty/Tax AssumptionsTax Losses Bought Forward (2) US$m - Spanish Tax Rate % 25% 25% 25% 25% 25% 25% 25% 25% 25% 25% 25% 25% 25% 25% 25% 25% 25% 25%State Reserves Royalty (1) % 2.5% 2.5% 2.5% 2.5% 2.5% 2.5% 2.5% 2.5% 2.5% 2.5% 2.5% 2.5% 2.5% 2.5% 2.5% 2.5% 2.5% 2.5%Municipilty Royalty % 0.20% 0.2% 0.2% 0.2% 0.2% 0.2% 0.2% 0.2% 0.2% 0.2% 0.2% 0.2% 0.2% 0.2% 0.2% 0.2% 0.2% 0.2%RCF/Anglo Royalty % 1.38% 1.38% 1.38% 1.38% 1.38% 1.38% 1.38% 1.38% 1.38% 1.38% 1.38% 1.38% 1.38% 1.38% 1.38% 1.38% 1.38% 1.38%
Depreciation Profile% 0.0% 0.0% 0.0% 0.0% 0.0% 0.0% 0.0% 0.0% 2.7% 2.7% 2.7% 6.9% 9.8% 14.5% 20.2% 20.2% 20.2% 100%
Notes(1) Applies only to Alameda Production(2) Assumes 75% of losses relate to spanish company.
SHAREINVESTORS.CO.UK
Page 22 / 44Disclaimer - Independent research with no association to Berkeley Energia (or related parties). Not financial advice. No responsibility for accuracy of figures can be accepted.
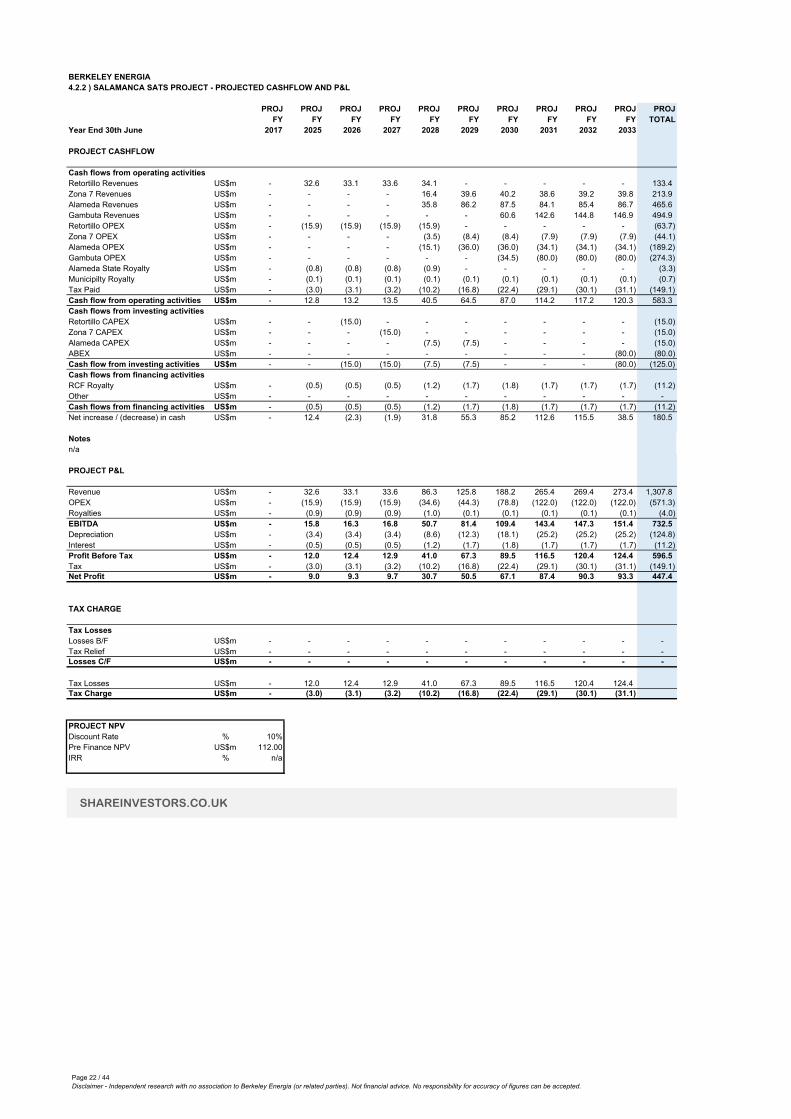
BERKELEY ENERGIA4.2.2 ) SALAMANCA SATS PROJECT - PROJECTED CASHFLOW AND P&L
PROJ PROJ PROJ PROJ PROJ PROJ PROJ PROJ PROJ PROJ PROJFY FY FY FY FY FY FY FY FY FY TOTAL
Year End 30th June 2017 2025 2026 2027 2028 2029 2030 2031 2032 2033
PROJECT CASHFLOW
Cash flows from operating activitiesRetortillo Revenues US$m - 32.6 33.1 33.6 34.1 - - - - - 133.4 Zona 7 Revenues US$m - - - - 16.4 39.6 40.2 38.6 39.2 39.8 213.9 Alameda Revenues US$m - - - - 35.8 86.2 87.5 84.1 85.4 86.7 465.6 Gambuta Revenues US$m - - - - - - 60.6 142.6 144.8 146.9 494.9 Retortillo OPEX US$m - (15.9) (15.9) (15.9) (15.9) - - - - - (63.7) Zona 7 OPEX US$m - - - - (3.5) (8.4) (8.4) (7.9) (7.9) (7.9) (44.1) Alameda OPEX US$m - - - - (15.1) (36.0) (36.0) (34.1) (34.1) (34.1) (189.2) Gambuta OPEX US$m - - - - - - (34.5) (80.0) (80.0) (80.0) (274.3) Alameda State Royalty US$m - (0.8) (0.8) (0.8) (0.9) - - - - - (3.3) Municipilty Royalty US$m - (0.1) (0.1) (0.1) (0.1) (0.1) (0.1) (0.1) (0.1) (0.1) (0.7) Tax Paid US$m - (3.0) (3.1) (3.2) (10.2) (16.8) (22.4) (29.1) (30.1) (31.1) (149.1) Cash flow from operating activities US$m - 12.8 13.2 13.5 40.5 64.5 87.0 114.2 117.2 120.3 583.3 Cash flows from investing activitiesRetortillo CAPEX US$m - - (15.0) - - - - - - - (15.0) Zona 7 CAPEX US$m - - - (15.0) - - - - - - (15.0) Alameda CAPEX US$m - - - - (7.5) (7.5) - - - - (15.0) ABEX US$m - - - - - - - - - (80.0) (80.0) Cash flow from investing activities US$m - - (15.0) (15.0) (7.5) (7.5) - - - (80.0) (125.0) Cash flows from financing activitiesRCF Royalty US$m - (0.5) (0.5) (0.5) (1.2) (1.7) (1.8) (1.7) (1.7) (1.7) (11.2) Other US$m - - - - - - - - - - - Cash flows from financing activities US$m - (0.5) (0.5) (0.5) (1.2) (1.7) (1.8) (1.7) (1.7) (1.7) (11.2) Net increase / (decrease) in cash US$m - 12.4 (2.3) (1.9) 31.8 55.3 85.2 112.6 115.5 38.5 180.5
Notesn/a
PROJECT P&L
Revenue US$m - 32.6 33.1 33.6 86.3 125.8 188.2 265.4 269.4 273.4 1,307.8 OPEX US$m - (15.9) (15.9) (15.9) (34.6) (44.3) (78.8) (122.0) (122.0) (122.0) (571.3) Royalties US$m - (0.9) (0.9) (0.9) (1.0) (0.1) (0.1) (0.1) (0.1) (0.1) (4.0) EBITDA US$m - 15.8 16.3 16.8 50.7 81.4 109.4 143.4 147.3 151.4 732.5 Depreciation US$m - (3.4) (3.4) (3.4) (8.6) (12.3) (18.1) (25.2) (25.2) (25.2) (124.8) Interest US$m - (0.5) (0.5) (0.5) (1.2) (1.7) (1.8) (1.7) (1.7) (1.7) (11.2) Profit Before Tax US$m - 12.0 12.4 12.9 41.0 67.3 89.5 116.5 120.4 124.4 596.5 Tax US$m - (3.0) (3.1) (3.2) (10.2) (16.8) (22.4) (29.1) (30.1) (31.1) (149.1) Net Profit US$m - 9.0 9.3 9.7 30.7 50.5 67.1 87.4 90.3 93.3 447.4
TAX CHARGE
Tax LossesLosses B/F US$m - - - - - - - - - - - Tax Relief US$m - - - - - - - - - - - Losses C/F US$m - - - - - - - - - - -
Tax Losses US$m - 12.0 12.4 12.9 41.0 67.3 89.5 116.5 120.4 124.4 Tax Charge US$m - (3.0) (3.1) (3.2) (10.2) (16.8) (22.4) (29.1) (30.1) (31.1)
PROJECT NPVDiscount Rate % 10%Pre Finance NPV US$m 112.00IRR % n/a
SHAREINVESTORS.CO.UK
Page 23 / 44Disclaimer - Independent research with no association to Berkeley Energia (or related parties). Not financial advice. No responsibility for accuracy of figures can be accepted.
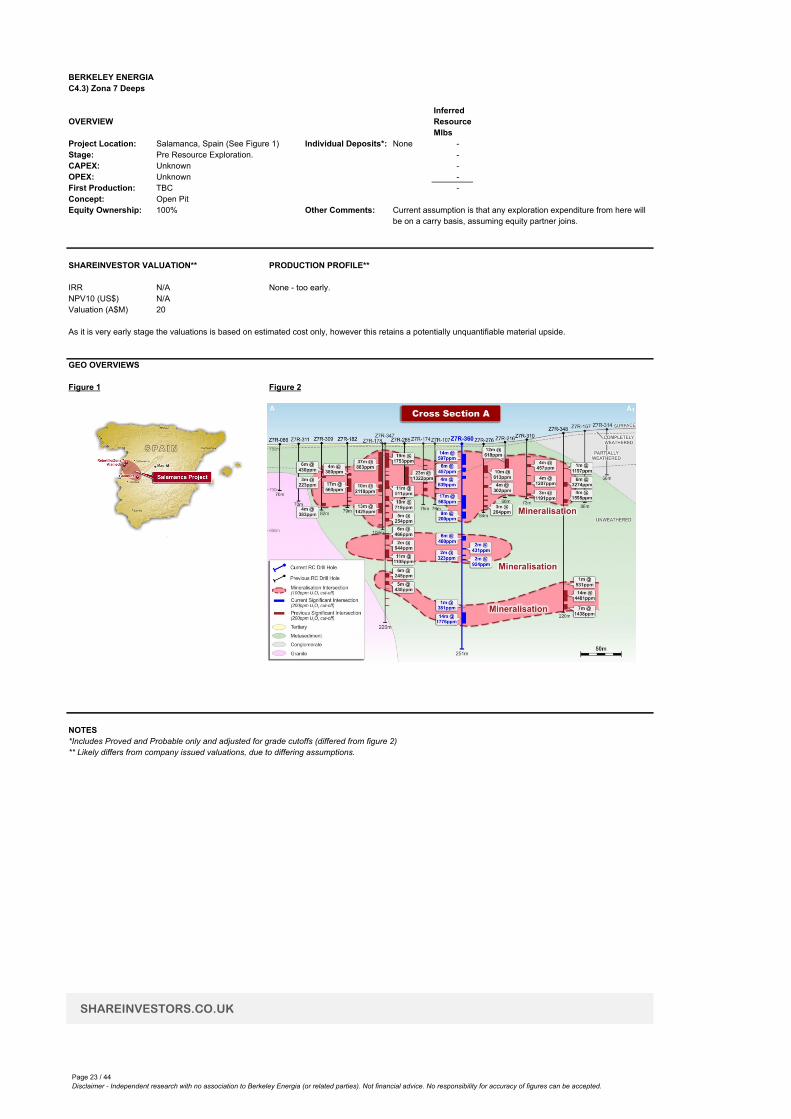
BERKELEY ENERGIAC4.3) Zona 7 Deeps
OVERVIEWMlbs
Project Location: Salamanca, Spain (See Figure 1) Individual Deposits*: None - Stage: Pre Resource Exploration. - CAPEX: Unknown - OPEX: Unknown - First Production: TBC - Concept: Open PitEquity Ownership: 100% Other Comments:
SHAREINVESTOR VALUATION** PRODUCTION PROFILE**
IRR N/A None - too early.NPV10 (US$) N/AValuation (A$M) 20
As it is very early stage the valuations is based on estimated cost only, however this retains a potentially unquantifiable material upside.
GEO OVERVIEWS
Figure 1 Figure 2
NOTES*Includes Proved and Probable only and adjusted for grade cutoffs (differed from figure 2)** Likely differs from company issued valuations, due to differing assumptions.
Inferred Resource
Current assumption is that any exploration expenditure from here will be on a carry basis, assuming equity partner joins.
SHAREINVESTORS.CO.UK

Page 24 / 44Disclaimer - Independent research with no association to Berkeley Energia (or related parties). Not financial advice. No responsibility for accuracy of figures can be accepted.
BERKELEY ENERGIAD) HISTORICAL FINANCIALS - KEY PERFORMANCE INDICATORS
MayYear End 30th June 2012 2013 2014 2015 2016 2017
Functional Currency to GBPGBP£:A$ # 1.54 1.53 1.77 1.89 2.04 1.67
Key Financial HeadlinesRevenue A$m 2.61 2.25 1.16 0.59 0.25 Operating Profit/(Loss) A$m (13.50) (11.10) (7.58) (7.87) (13.64) Net Profit A$m (13.50) (11.10) (7.58) (7.87) (13.64) Dilluted Earnings Per Share A¢ (7.53) (6.19) (4.20) (4.36) (6.88)
Cashflow MetricsCashflow from Operations (CFO) A$m (13.20) (9.28) (7.31) (6.82) (11.29) Cashflow from Investing (CFI) A$m (1.11) (0.84) (0.18) (0.06) (0.33) Free Cash Flow (FCF) A$m (14.31) (10.12) (7.49) (6.88) (11.62) FCF Per Share A¢ (7.98) (5.64) (4.15) (3.81) (5.86)
Profitability MetricsOperating Margin % -517% -493% -653% -1334% -5500%ROCE % -26% -26% -21% -28% -52%
Dividend MetricsDividend Per Share p - - - - - Dividend Yield % 0.0% 0.0% 0.0% 0.0% 0.0%Dividend Growth Rate % n/a n/a n/a n/a n/aDividend Cover # n/a n/a n/a n/a n/a
Valuation MetricsShare Price p 24.25 13.75 14.50 15.25 35.25 51.00 Shares in Issue # 179.30 179.40 180.40 180.40 198.32 254.49 Market Capitalisation £'m 43.48 24.67 26.16 27.51 69.91 129.79 Net Assets/Book Value A$m 51.60 42.10 35.60 28.54 26.30 26.30 Premium/(Discount) to NAV % 129% 90% 130% 182% 542% 826%Price Cashflow Ops Ratio # n/a n/a n/a n/a n/aPrice Earnings Ratio # n/a n/a n/a n/a n/a
Distress MetricsNet Cash/(Debt) A$m 37.60 27.50 20.00 13.40 11.35 38.14 Working Capital A$m 37.30 26.00 19.40 12.55 16.54 Fixed Assets A$m 14.20 16.10 16.10 15.98 9.75 Interest Payments A$m - - - - - Interest Cover # - - - - - Gross Gearing % 0% 0% 0% 0% 0%
Director Gold StarsDirector Remuneration A$m n/a n/a n/a n/a 3.46 Director Rem/Net Profit % n/a n/a n/a n/a -25%Directors Equity Holding % n/a n/a n/a n/a 6.67%
Management KPIsUranium Spot Price US$ n/a 41.45 33.42 35.86 32.67
ShareInvestors Additional MetricsNone Applicable
Notesn/a - data not available or not relevant
SHAREINVESTORS.CO.UK

Page 25 / 44Disclaimer - Independent research with no association to Berkeley Energia (or related parties). Not financial advice. No responsibility for accuracy of figures can be accepted.
BERKELEY ENERGIAD) GRAPHICAL SUMMARY OF HISTORICAL DATA
STANDARD CHARTS (NOTE - SOME MAY NOT BE APPLICABLE AT THIS STAGE)Title BERKELEY ENERGIA REVENUE VS OPERATING MARGIN Title BERKELEY ENERGIA CFI vs. ROCE
Primary Y Revenue A$m Primary Y CFI £'mSecondary Y Operating Margin Secondary Y Return on Capital Employed %
Title BERKELEY ENERGIA CFO vs. FCF Title BERKELEY ENERGIA WORKING CAPITAL AND NET CASH
Primary Y A$'m Primary Y A$'m
-6000%
-5000%
-4000%
-3000%
-2000%
-1000%
0%
0.0
0.5
1.0
1.5
2.0
2.5
3.0
2012 2013 2014 2015 2016
Ope
ratin
gMargin
Revenu
eA$
m
BERKELEYENERGIAREVENUEVSOPERATINGMARGIN
RevenueA$m OperatingMargin
SHAREINVESTORS.CO.UK
-16.0
-14.0
-12.0
-10.0
-8.0
-6.0
-4.0
-2.0
0.02012 2013 2014 2015 2016
A$'m
BERKELEYENERGIACFOvs.FCF
CashflowfromOperations(CFO) FreeCashFlow(FCF)
SHAREINVESTORS.CO.UK
-1
-1
0
0
0
0
0
(1.2)
(1.0)
(0.8)
(0.6)
(0.4)
(0.2)
- 2012 2013 2014 2015 2016
ReturnonCa
pitalEmployed
%
CFI£'m
BERKELEYENERGIACFIvs.ROCE
CashflowfromInvesting(CFI) ROCE
SHAREINVESTORS.CO.UK
0
5
10
15
20
25
30
35
40
2012 2013 2014 2015 2016
A$'m
BERKELEYENERGIAWORKINGCAPITALANDNETCASH
WorkingCapital NetCash/(Debt)
SHAREINVESTORS.CO.UK
SHAREINVESTORS.CO.UK

Page 26 / 44Disclaimer - Independent research with no association to Berkeley Energia (or related parties). Not financial advice. No responsibility for accuracy of figures can be accepted.
BERKELEY ENERGIAD2) PROFIT AND LOSS
STATUTORY P&L
Year End 30th June Note 2016 2017
Revenue D.2.1 A$m 0.25 Corporate and Admin Expenses A$m (1.35) Exploration and Evaluation A$m (9.21) Business Development A$m (1.61) Share Based Payments A$m (1.71) Operating profit/(loss) D.2.1 A$m (13.64) Finance Income A$m - Finance Costs A$m - Profit/(loss) before Tax A$m (13.64) Tax (charge)/ credit D.2.3 A$m - Profit/(loss) after Tax A$m (13.64)
Earnings/Dividend per ShareDiluted Earnings p (5.00) Dividend p - - Dividend SpecifiedInterim p - - Final p -
MANAGEMENT P&L
Year End 30th June 2016
Revenue D.2.1 A$m 0.25 Corporate and Admin Expenses A$m (1.35) Exploration and Evaluation A$m (9.21) Business Development A$m (1.61) Share Based Payments A$m (1.71) Operating profit/(loss) D.2.1 A$m (13.89) Finance Income A$m - Finance Costs A$m - Profit/(loss) before Tax A$m (13.89) Tax (charge)/ credit A$m - Profit/(loss) after Tax A$m (13.89)
.TaxEffective Tax Rate % 0%
SHAREINVESTORS.CO.UK

Page 27 / 44Disclaimer - Independent research with no association to Berkeley Energia (or related parties). Not financial advice. No responsibility for accuracy of figures can be accepted.
BERKELEY ENERGIAD2.1) PROFIT AND LOSS - REVENUE AND COSTS
REVENUE ANALYSIS 2016
RevenueInterest Income (1) A$m 0.24 R&D Rebate A$m 0.01 Management Revenue A$m 0.25
Note(1) Slightly curious why this is shown as revenue but not material to debate.
OPERATING COST ANALYSIS
Operating CostsDepreciation A$m 0.14 Staff Wages A$m 5.42 Corporate and Admin A$m 1.35 Exploration and Evaluation A$m 9.21 Business Development A$m 1.61 Other (1) A$m (3.85) Total Operating Costs A$m 13.89
Note(1) Accounts lack granuality but expectation is this is the transfer of staff costs to PPE and other expense categories.
SHAREINVESTORS.CO.UK

Page 28 / 44Disclaimer - Independent research with no association to Berkeley Energia (or related parties). Not financial advice. No responsibility for accuracy of figures can be accepted.
BERKELEY ENERGIAD2.2) PROFIT & LOSS - STAFF COSTS
DIRECTOR REMUNERATION
Year End 30th June 2016
Total RemunerationIan Middlemas A$m 0.05 Paul Atherley A$m 1.12 James Ross A$m 0.02 Robert Behets A$m 0.10 Other Key Management A$m 2.17 Total A$m 3.46 % of Earnings/(Losses) % -25%
Remuneration WeightingEquity Awards A$m 1.35 Cash Based A$m 2.10 Total A$m 3.46
STAFF COSTS
EmployeesOperational # n/aAdmin # n/aTotal (1) # - SpecifiedOperational % n/aAdmin % n/aTotal % 0.00%
Total RemunerationWages, Social Security and Pension A$m 3.76 Share Based Payments A$m 1.66 Total A$m 5.42 Average Cost of Employee £'000 n/aAverage Bonus £'000 n/a
Note(1) Data does not appear to be required to be disclosed under Australian reporting rules.
KEY INFO ON SHARE OPTION SCHEME
LTIPEligible All Key StaffConsideration for Option A$ 0Payments for Exercise A$ Principly 0Expiry Dates from Grant 1-3 yearsConditions of Vesting Construction, Production Milestones
Option Breakdown - Scheme 1 (Options on Issue)Options BOP #'m 10.45 Options Granted in Period #'m 0.50 Options Exercised in Period #'m (3.25) Expiry of Options #'m - Total Options Outstanding EOP #'m 7.70 Weighted Average Price Outstanding A$ 0.38 Weighted Average Years Remaining yrs 2.00
Option Breakdown - Scheme 1 (Perfomance Scheme)Options BOP #'m 2.78 Options Granted in Period #'m 8.61 Options Exercised in Period #'m (0.83) Expiry of Options #'m - Total Options Outstanding EOP #'m 10.56 Weighted Average Price Outstanding A$ - Weighted Average Years Remaining yrs 2.61
Value of Options at Current Share Price £'m 5.38 Fair Value of Options $'m 2.77
SHAREINVESTORS.CO.UK

Page 29 / 44Disclaimer - Independent research with no association to Berkeley Energia (or related parties). Not financial advice. No responsibility for accuracy of figures can be accepted.
BERKELEY ENERGIAD2.3) PROFIT & LOSS - TAXATION
INCOME STATEMENT
Year End 30th June 2016
Current Tax Adjustments in respect of prior years A$m (0.17) Deffered Tax Origination and Reversal of Temp Differences A$m (3.40) Tax Assets not Recognised A$m 3.57 Total A$m -
ReconcilliationAccounting Loss A$m (13.64) At Domestic Tax Rate @30% A$m (4.09) Disallowable Expenditure A$m 0.69 Adjustments in respect prior years A$m (0.17) Tax Assets not Recognised A$m 3.57 Total Recognised in P&L A$m 0.00
BALANCE SHEET
Deffered Tax LiabilitiesN/A A$m - Deffered Tax AssetsAccrued Expenditure A$m 0.10 Exploration and Evalution Assets A$m 7.48 Tax Losses to offset against future Income A$m 9.06 Tax Assets not Recognised A$m (16.64) Total A$m 0.00
SHAREINVESTORS.CO.UK

Page 30 / 44Disclaimer - Independent research with no association to Berkeley Energia (or related parties). Not financial advice. No responsibility for accuracy of figures can be accepted.
BERKELEY ENERGIAD3) BALANCE SHEET
Year End 30th June Note 2015 2016
Non Current AssetsProperty, Plant and Equipment D.3.1 A$m 1.66 1.85 Intangible Assets D.3.1 A$m 14.26 7.78 Financial Investments A$m 0.07 0.12 Deffered Tax D.2.3 A$m - - Trade and Other Receivables A$m - - Total Non Current Assets A$m 15.98 9.75 Current Assets A$mInventories A$m - - Trade and Other Receivables D.3.2 A$m 0.48 7.30 Financial Investments A$m - - Cash and Cash Equivalents D.3.2 A$m 13.40 11.35 Total Current Assets A$m 13.88 18.65 Total Assets A$m 29.86 28.40 Current LiabilitiesTrade and Other Payables D.3.2 A$m 1.03 2.08 Other Financial Liabilities D.3.2 A$m 0.29 0.03 Income Tax Payable A$m - - Total Current Liabilities A$m 1.32 2.11 Non Current LiabilitiesBorrowings D.3.1 A$m - - Provisions A$m - - Deffered Tax D.2.3 A$m - - Total Non Current Liabilities A$m - - Total Liabilities A$m 1.32 2.11 Net Assets A$m 28.54 26.30
Capital and ReservesIssued Capital D.3.1 A$m 119.36 129.51 Own Shares Held A$m - - Other Reserves A$m (0.36) 0.43 Share Premium D.3.1 A$m - - Retained Surplus/(Deficit) A$m (90.46) (103.64) Total Equity Shareholder Funds A$m 28.54 26.30
SHAREINVESTORS.CO.UK

Page 31 / 44Disclaimer - Independent research with no association to Berkeley Energia (or related parties). Not financial advice. No responsibility for accuracy of figures can be accepted.
BERKELEY ENERGIAD3.1) BALANCE SHEET - CAPITAL STRUCTURE
SHARE CAPITAL
Year End 30th June 2016 2017
Share CapitalOrdinary Shares Start of Period #'m 180.36 198.32 Ordinary Shares Issued #'m 17.96 56.17 Ordinary Shares Issued End of Period #'m 198.32 254.49 Share Options Outstanding #'m 18.26 18.26 Dilluted Share Capital #'m 216.58 272.75
Major Shareholders with Disclosable Positions (Excl PDMRs)Anglo Pacific #'m 30.21 25.61 Fidelity #'m 18.25 18.25 Global X Uranium Fund #'m - 16.57 River and Mercantile Asset Management #'m 12.25 12.25 BlackRock Group #'m 14.75 - Majedie Asset Management #'m 14.47 14.47 Total #'m 89.93 87.15 Total % 45% 34%
Director HoldingsIan Middlemas #'m 9.30 9.30 Paul Atherley #'m 1.50 1.50 James Ross #'m 0.04 0.04 Robert Behets #'m 2.39 2.39 Total #'m 13.24 13.24 Total % 6.67% 5.20%
BORROWINGS
Company has no current borrowings.
WACC
Discount Rate n/d
.
SHAREINVESTORS.CO.UK

Page 32 / 44Disclaimer - Independent research with no association to Berkeley Energia (or related parties). Not financial advice. No responsibility for accuracy of figures can be accepted.
BERKELEY ENERGIAD3.2) BALANCE SHEET - NON CURRENT ASSETS
PROPERTY, PLANT AND EQUIPMENT
Year End 30th June 2016
CostBought Forward A$m 2.33 Additions A$m 0.30 FX Adjustment A$m 0.05 Unknown Adjustment (1) A$m 0.24 Disposals A$m (0.02) Total A$m 2.90 Specified
Plant and Equipment A$m 1.12 Property A$m 1.78 Other A$m -
Total A$m 2.90
Accumulated DepreciationBought Forward A$m 0.67 Charge A$m 0.14 Unknown Adjustment (1) A$m 0.24 Disposals A$m - Total A$m 1.05 Net Book Value A$m 1.85
Effective Depreciation Rate CAPEX % 4.9%Effective Depreciation Rate Revenue % 57.7%
Notes(1) Unkown adjustment which nets off to zero.
INTANGIBLES
Year End 30th June 2016
CostBought Forward A$m 14.26 Additions A$m 0.01 FX Adjustment A$m 0.26 Disposals (1) A$m (6.74) Total A$m 7.79 Specified
Exploration Assets (2) A$m 7.79 Other A$m -
Total A$m 7.79
Accumulated AmmortisationBought Forward A$m - Charge A$m - Disposals A$m - Total A$m - Net Book Value A$m 7.79
Effective Depreciation Rate CAPEX % 0.0%Effective Depreciation Rate Revenue % 0.0%
Notes
.
(1) Disposal relates to royalty agreement, where RCF receive a 0.375% royalty for US$5m. I don't fully understand thisaccounting treatment but I assume it is as a result of the security held by RCF.
SHAREINVESTORS.CO.UK

Page 33 / 44Disclaimer - Independent research with no association to Berkeley Energia (or related parties). Not financial advice. No responsibility for accuracy of figures can be accepted.
BERKELEY ENERGIAD3.3) BALANCE SHEET - WORKING CAPITAL
WORKING CAPITAL
Year End 30th June 2016
Inventories A$m - Other Receivables A$m 0.13 Royalty Sale Receivable (1) A$m 6.74 Interest Receivable A$m 0.02 VAT and Tax Receivable A$m 0.42 Prepayments and Accrued Income A$m - Trade and Other Receivables A$m 7.30 Trade Payables A$m 1.75 Social Security and Other Taxes A$m - Accruals A$m 0.33 Deferred Income A$m - Trade and Other Payables A$m 2.08 Income Tax Payable A$m - Net Working Capital (Excl Cash) A$m 5.22 Financial Investments A$m - Financial Liabilities A$m (0.03) Cash (4) A$m 11.35 Net Working Capital A$m 16.54
Notes(1) Amounts due from RCF regarding Royalty agreement, received post year end.
.
SHAREINVESTORS.CO.UK

Page 34 / 44Disclaimer - Independent research with no association to Berkeley Energia (or related parties). Not financial advice. No responsibility for accuracy of figures can be accepted.
BERKELEY ENERGIAD4) CASHFLOW STATEMENT
Year End 30th June 2016
Cash flows from operating activitiesOperating profit/(loss) A$m (13.64) Exceptional items A$m - Depreciation and Amortisation A$m 0.14 Share Based Payments A$m 1.66 Increase/(Decrease) in Trade Payables A$m 1.05 (Increase)/Decrease in Trade Receivables A$m (6.82) (Increase)/Decrease in Financial Assets A$m (0.06) Other Movements (1) A$m 6.86 Unknown Movements (2) A$m (0.48) Cash flow from operating activities A$m (11.29) Cash flows from investing activitiesExpansionary CAPEX A$m (0.30) Purchase of Intangibles A$m (0.01) Other Movements A$m (0.01) Interest Received A$m - Cash flows from investing activities A$m (0.33) Cash flows from financing activitiesNet Issue of Equity A$m 9.57 Cash flows from investing activities A$m 9.57 Net increase / (decrease) in cash A$m (2.05) FX Gain/(Loss) A$m 0.00 Cash Bought Forward A$m 13.40 Cash Carry Forward A$m 11.35
Operating Cash Conversion - Operating Profit % 83%Operating Cash/Earnings Ratio # -6.19Free Cashflow A$m (11.62) Interest Cover from Free Cashflow # n/aDividend Cover from Free Cashflow # n/a
Notes(1) Adding back Royalty payment due as non cash item.(2) Relates to change in Trade Payables that I cannot reconcile.
.
SHAREINVESTORS.CO.UK

Page 35 / 44Disclaimer - Independent research with no association to Berkeley Energia (or related parties). Not financial advice. No responsibility for accuracy of figures can be accepted.
BERKELEY ENERGIAE2) INTERIM PROFIT AND LOSS
STATUTORY P&L H1Dec
Year End 30th June 2016
Revenue A$m 0.18 Corporate and Admin Expenses A$m (0.61) Exploration and Evaluation A$m (4.44) Business Development A$m (1.12) Share Based Payments A$m (0.51) Operating profit/(loss) A$m (6.50) Finance Income A$m - Finance Costs A$m - Profit/(loss) before Tax A$m (6.50) Tax (charge)/ credit A$m - Profit/(loss) after Tax A$m (6.50)
Earnings/Dividend per ShareDiluted Earnings p (2.38) Dividend p - Dividend SpecifiedInterim p - Final p -
SHAREINVESTORS.CO.UK

Page 36 / 44Disclaimer - Independent research with no association to Berkeley Energia (or related parties). Not financial advice. No responsibility for accuracy of figures can be accepted.
BERKELEY ENERGIAE3) INTERIM BALANCE SHEET H1
DecYear End 30th June 2016
Non Current AssetsProperty, Plant and Equipment A$m 6.86 Intangible Assets A$m 7.82 Financial Investments A$m 0.14 Deffered Tax A$m - Trade and Other Receivables A$m - Total Non Current Assets A$m 14.81 Current Assets A$mInventories A$m - Trade and Other Receivables A$m 1.12 Financial Investments A$m - Cash and Cash Equivalents A$m 43.18 Total Current Assets A$m 44.30 Total Assets A$m 59.11 Current LiabilitiesTrade and Other Payables A$m 1.16 Other Financial Liabilities A$m - Income Tax Payable A$m - Total Current Liabilities A$m 1.16 Non Current LiabilitiesBorrowings A$m - Provisions A$m - Deffered Tax A$m - Total Non Current Liabilities A$m - Total Liabilities A$m 1.16 Net Assets A$m 57.95
Capital and ReservesIssued Capital A$m 168.05 Own Shares Held A$m - Other Reserves A$m 0.05 Share Premium A$m - Retained Surplus/(Deficit) A$m (110.15) Total Equity Shareholder Funds A$m 57.95
SHAREINVESTORS.CO.UK

Page 37 / 44Disclaimer - Independent research with no association to Berkeley Energia (or related parties). Not financial advice. No responsibility for accuracy of figures can be accepted.
BERKELEY ENERGIAE4) INTERIM CASHFLOW STATEMENT
Q3Mar
Year End 30th June 2017
Cash flows from operating activitiesExploration and Evaluation A$m (6.64) Staff Costs A$m (2.80) Admin and Corporate Costs A$m (1.81) Interest Received A$m 0.25 Cash flow from operating activities A$m (11.00) Cash flows from investing activitiesPurchase of PPE A$m (5.47) Cash flows from investing activities A$m (5.47) Cash flows from financing activitiesIssue of Equity A$m 39.76 Transaction Costs of Fund Raise A$m (2.18) Proceeds from Sale of Royalty A$m 6.53 Transaction Costs of Royalty Raise A$m (0.26) Interest Costs A$m - Dividends Paid A$m - Cash flows from investing activities A$m 43.85 Net increase / (decrease) in cash A$m 27.38 FX Gain/(Loss) A$m (0.59) Cash Bought Forward A$m 11.35 Cash Carry Forward A$m 38.14
.
SHAREINVESTORS.CO.UK

Page 38 / 44Disclaimer - Independent research with no association to Berkeley Energia (or related parties). Not financial advice. No responsibility for accuracy of figures can be accepted.
BERKELEY ENERGIAF) RESERVES
MINERAL RESOURCE ESTIMATE, As at July 2016
Deposit Name CategoryTonnes
(Mt)U3O8
(ppm)*U3O8
Grade %U3O8
(Mlbs)*Retortillo Measured 4.10 498 0.05% 4.50
Indicated 11.30 395 0.04% 9.84 Inferred 0.20 368 0.04% 0.16
Total Retortillo 15.60 14.50 Zona 7 Measured 5.20 674 0.07% 7.73
Indicated 10.50 761 0.08% 17.62 Inferred 6.00 364 0.04% 4.81
Total Retortillo 21.70 30.16 Alameda Indicated 20.00 455 0.05% 20.06
Inferred 0.70 657 0.07% 1.01 Total Alameda 20.70 21.08 Retortillo Satellites Inferred 2.80 492 0.05% 3.04 Total Retortillo Satellites 2.80 3.04 Alameda Satellites Inferred 9.10 472 0.05% 9.47 Total Alameda Satellites 9.10 9.47 Gambuta Inferred 12.70 394 0.04% 11.03 Gambuta 12.70 11.03
Project TotalsMeasured 9.30 12.23 Indicated 41.80 47.52 Inferred 31.50 29.53
82.60 89.28
PROJECT ORE ESTIMATE, As at July 2016
Deposit Name CategoryTonnes
(Mt)U3O8
(ppm)*U3O8
Grade %U3O8
(Mlbs)*Retortillo Proved 4.00 397 0.04% 3.50
Probable 11.90 329 0.03% 8.63 Total Retortillo 15.90 12.13 Zona 7 Proved 6.50 542 0.05% 7.77
Probable 11.90 624 0.06% 16.37 Total Retortillo 18.40 24.14 Alameda Proved - - 0.00% -
Probable 26.40 327 0.03% 19.03 Total Alameda 26.40 19.03
Project TotalsProved 10.50 11.27 Probable 50.20 44.03
60.70 55.30
Measured and Indicated to Reserves 93%
.
SHAREINVESTORS.CO.UK
Page 39 / 44Disclaimer - Independent research with no association to Berkeley Energia (or related parties). Not financial advice. No responsibility for accuracy of figures can be accepted.
APPENDIX
NOTINVESTMENTADVICE-FORINFORMATIONALPURPOSESONLY
BERKELEY ENERGIAFinancial Research Pack
SHAREINVESTORS.CO.UK

Page 40 / 44Disclaimer - Independent research with no association to Berkeley Energia (or related parties). Not financial advice. No responsibility for accuracy of figures can be accepted.
BERKELEY ENERGIAAPPENDIX 1 - GLOSSARY OF TERMS
FINANCIAL GLOSSARYTerm Abreviated DefinitionFreeCashFlow FCF
NetDebt ND
WorkingCapital WC
EarningsPerShare EPS
NetAssetValue NAV
DicountedCashflow DCF
DividendPerShare DPS
NetProfitorEarnings PAT Profit(orloss)afterallitemsdeductedincludingtax.Thisisthefiguretobeusedinearningspersharecalculation.DilliutedEarningsPerShare DEPS
DividendCover DC/DCFCF
InterestCover IC/ICCFO
CashflowfromOperations CFO Cashflowgeneratedfromtheoperatingbusiness,thatisbeforeCAPEXandotherinvestments
CapitalExpenditure CAPEX
ReturnonCapitalEmployed ROCE
NetGearing GG NetDebt/BookValueEquity
TECHNICAL GLOSSARYTerm Abreviated DefinitionPartsPerMillion PPM TheconcentrationofmineralinsoilMineralGrade AnotherwayofexpressingPPMabove,PPM/1,000,000=X%MillionTonnes Mt
MillionPounds Mlbs
Commonwayofexpressinggrossminingreserves.Usuallytotalmineableresource,theactualmineralisationwillbea%ofthis,i.e.PPMasabove.Awayofexpressingminingresource.Mtx2204.62.TheMineralgradewillusuallybeappliedtogivetotalmineralscontained,i.e.Mtx2204.62xMineralGrade.
PATdividedbynumberofshares.Thisbalanceisaddedtoretainedearningswheredividendscanbeusedtobepaidoutof.WhereDPSissignificantlylower(<30%)thanEPSthismaybeanindicatorofagrowingbusiness.
CashflowGeneratedbeforefinancing,i.e.CashflowfromOperations-CashflowfromInvesting .Goodviewofunderlyinghealthofbusiness.HighlevelsofNetDebtmaybeanindicatoroffinancialdistressifnotwellcoveredbyFreeCashFlow.MeasuredasCash+LiquidInvestments-Borrowings.Itistheliquidityavailabletothebusiness,CurrentAssets-CurrentLiabilities .Thenumbershouldalwaysbelookedatincontextofthebusiness.Forexample,anegativeworkingcapitalfiguremaynotbeanissueifyouhavenegotiatedgoodtermswithyoursuppliersandyourcustomerspayquickly.Asupermarketbeingtheobviousexample.
Inotherwordsshareholderfunds,TotalAssets-TotalLiabilities .ItcanbeusefultocomparetheNAVtothemarketcapitalisationofthecompany.Asalwaysthisisonlyausefulmeasureforassetintensivebusinesses,particularlytheExtractiveIndustriesandInvestmentcompanies.
EPS/DPSandEPS/FCF.HowwelldividendiscoveredbyEarningsandFreeCashflow.Thelaterisabetterindicatorinmostinstances.Interest/OperatingProfitandInterest/CashflowfromOperations.Howmuchdoestheoperatingbusinesscoverinterestpayments.
ExpenditureonAssetstohaveuseoveratleastoneaccountingperiod,puttypicallylonger.Examplesarebuildings,oilandgasassets.Theassetsaredepreciatedoverarelevantnumberofyearsandchargedtotheprofitandlossstatementonthisbasis.
Takestheprojectedfuturecashflowsofthebusinessanddiscountsbacktogiveyouthepresentfairvalue(PV)oftheequity(inthiscontext)ofthebusiness.ComparingthePVtothemarketcapitalisationistheprimarytoolusedbyexperiencedequityanalystswhenappraisinginvestmentopportunities.Themoneyreturnedtoshareholdersthroughdividendpayment.TakingtheDPS/SharePricegivesthedividendyield,i.e.thecurrentreturnonyourinvestment.
Earningspersharewhichtakesintoaccountoptions,warrantsandotherconvertibleinstruments.AlargedifferencetoEPSwarrantsfurtherresearchasitislikelyasignthatshareholderscouldbedillutedinthefuture.
Showshowefficientlyacompanyisutilisingitsassetbase.Onlyrelevantincapitalintensivebusiness.Defined-EBIT/FixedAssets+WorkingCapital
SHAREINVESTORS.CO.UK
Page 41 / 44Disclaimer - Independent research with no association to Berkeley Energia (or related parties). Not financial advice. No responsibility for accuracy of figures can be accepted.
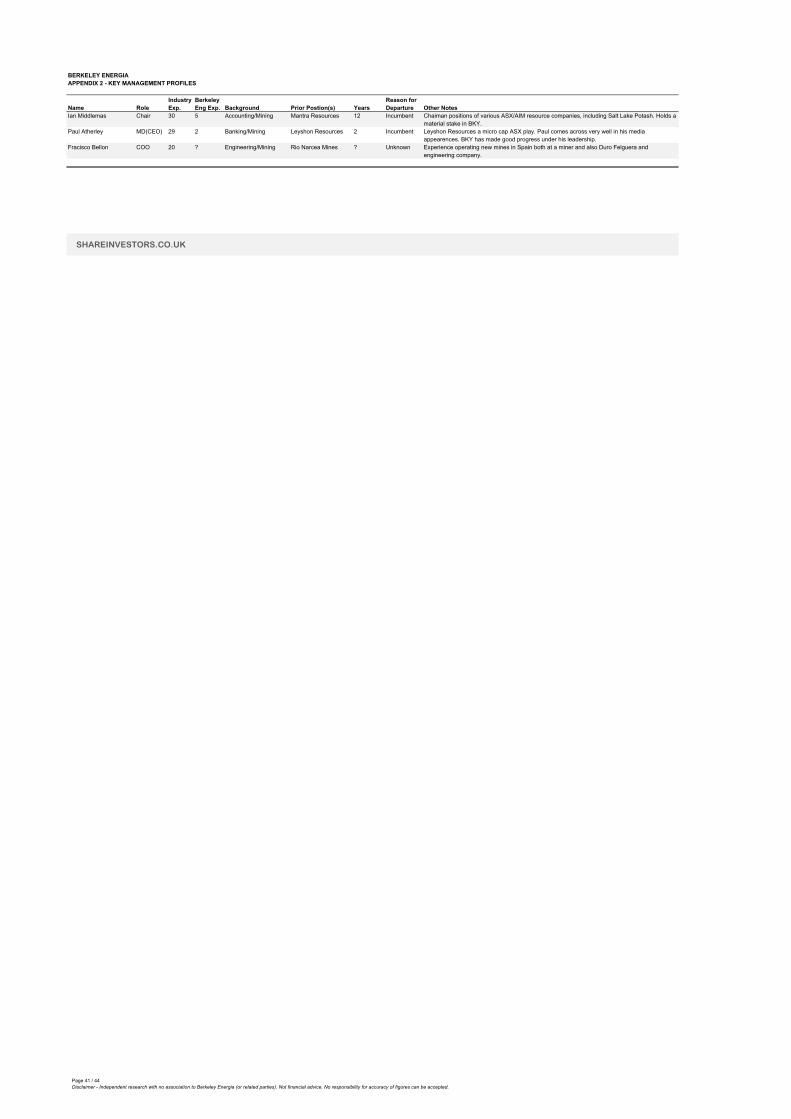
BERKELEY ENERGIAAPPENDIX 2 - KEY MANAGEMENT PROFILES
Name RoleIndustry Exp.
Berkeley Eng Exp. Background Prior Postion(s) Years
Reason for Departure
Ian Middlemas Chair 30 5 Accounting/Mining Mantra Resources 12 Incumbent
Paul Atherley MD(CEO) 29 2 Banking/Mining Leyshon Resources 2 Incumbent
Fracisco Bellon COO 20 ? Engineering/Mining Rio Narcea Mines ? Unknown
.
Other Notes
Experience operating new mines in Spain both at a miner and also Duro Felguera and engineering company.
Chaiman positions of various ASX/AIM resource companies, including Salt Lake Potash. Holds a material stake in BKY.Leyshon Resources a micro cap ASX play. Paul comes across very well in his media appearences. BKY has made good progress under his leadership.
SHAREINVESTORS.CO.UK

Page 42 / 44Disclaimer - Independent research with no association to Berkeley Energia (or related parties). Not financial advice. No responsibility for accuracy of figures can be accepted.
BERKELEY ENERGIAAPPENDIX 3 - RECONCILLIATION OF EQUITY ISSUES
Date TypeShares Issued
Total Shares
Issue Price A$
Amount Raised
Gross A$ % of
Existing01/07/2011 n/a 174.3001/04/2012 Placing 5.00 179.30 0.30 1.50 2.9%Total End 2012 5.00 179.30 1.5031/06/2013 Share Options 0.10 179.40 0.75 0.07 0.1%Total End 2013 0.10 179.40 0.0731/06/2014 Share Options 0.968 180.36 0.31 0.30 0.5%Total End 2014 0.97 180.36 0.30No IssuesTotal End 2015 0.00 180.36 0.0023/12/2015 Share Options 1.45 181.81 0.20 0.29 0.8% .19/05/2016 Placing 11.011 192.82 0.63 6.88 6.1%19/05/2016 Share Options 0.5 193.32 0.45 0.23 0.3%17/06/2016 Share Options 5 198.32 0.45 2.25 2.6%Total End 2016 17.96 198.32 9.6529/07/2016 Share Options 2.345 200.67 0.00 0.00 1.2%28/09/2016 Payment in Lieu 0.04 200.71 0.00 0.00 0.0%04/11/2016 Placing (1) 35.7 236.42 17.8%04/11/2016 Placing (1) 17.9 254.29 7.6%23/12/2016 Share Options (1) 0.2 254.49 0.1%Total End 2017 56.17 254.49 0.00TOTAL 80.19 254.49 11.52
Notes(1) Amounts to be calculated.
SHAREINVESTORS.CO.UK

Page 43 / 44Disclaimer - Independent research with no association to Berkeley Energia (or related parties). Not financial advice. No responsibility for accuracy of figures can be accepted.
BERKELEY ENERGIAAPPENDIX 4 - JORC CODE
OVERVIEWOFRESOURCECLASSIFICATIONS(ASINCLUDEDIND4RESERVES)
EXPLANATORYNOTES
FULLDOCUMENThttp://www.jorc.org/docs/JORC_code_2012.pdf
A‘MeasuredMineralResource’isthatpartofaMineralResourceforwhichquantity,grade(orquality),densities,shape,andphysicalcharacteristicsareestimatedwithconfidencesuficienttoallowtheapplicationofModifyingFactorstosupportdetailedmineplanningandfinalevaluationoftheeconomicviabilityofthedeposit.
ThechoiceoftheappropriatecategoryofMineralResourcedependsuponthequantity,distributionandqualityofdataavailableandthelevelofcondencethatattachestothosedata.TheappropriateMineralResourcecategorymustbedeterminedbyaCompetentPerson.
An‘OreReserve’istheeconomicallymineablepartofaMeasuredand/orIndicatedMineralResource.Itincludesdilutingmaterialsandallowancesforlosses,whichmayoccurwhenthematerialisminedorextractedandisdenedbystudiesatPre-FeasibilityorFeasibilitylevelasappropriatethatincludeapplicationofModifyingFactors.
AllreportsofMineralResourcesmustsatisfytherequirementthattherearereasonableprospectsforeventualeconomicextraction(iemorelikelythannot),regardlessoftheclassificationoftheresource.
An‘InferredMineralResource’isthatpartofaMineralResourceforwhichquantityandgrade(orquality)areestimatedonthebasisoflimitedgeologicalevidenceandsampling.Geologicalevidenceissufcienttoimplybutnotverifygeologicalandgrade(orquality)continuity.Itisbasedonexploration,samplingandtestinginformationgatheredthroughappropriatetechniquesfromlocationssuchasoutcrops,trenches,pits,workingsanddrillholes.
An‘IndicatedMineralResource’isthatpartofaMineralResourceforwhichquantity,grade(orquality),densities,shapeandphysicalcharacteristicsareestimatedwithsuficientconfidencetoallowtheapplicationofModifyingFactorsinsuficientdetailtosupportmineplanningandevaluationoftheeconomicviabilityofthedeposit.
SHAREINVESTORS.CO.UK

BERKELEY ENERGIAAPPENDIX 6 - PRODUCTION
PRODUCTION AND OFFTAKE
Year End 30th June 2017 2018 2019 2020 2021 2022 2023 2024 2025 2026 2027 2028 2029 2030 2031 2032 2033
ProductionRetortillo Net Production Mlbs - 0.82 0.82 0.82 1.17 1.17 1.17 1.17 1.07 0.96 0.85 0.32 0.11 0.20 - - - Zona 7 Net Production Mlbs - - 1.77 1.77 2.34 2.34 2.34 2.34 2.12 1.91 1.49 1.27 0.89 0.66 - - - Alameda Net Production Mlbs - - - 1.52 1.84 1.84 1.84 1.84 1.67 1.67 1.51 1.34 1.09 0.57 - - - Total Initial Production Mlbs - 0.82 2.59 4.11 5.35 5.35 5.35 5.35 4.87 4.55 3.85 2.93 2.09 1.43 - - - Retortillo Satellites/Inferred Mlbs - - - - - - - - 0.65 0.65 0.65 0.65 - - - - - Zona 7 Satellites/Inferred Mlbs - - - - - - - - - - - 0.31 0.75 0.75 0.71 0.71 0.71 Alameda Satellites/Inferred Mlbs - - - - - - - - - - - 0.68 1.62 1.62 1.54 1.54 1.54 Gambuta Mlbs - - - - - - - - - - - - - 1.12 2.61 2.61 2.61 Inferred Production Mlbs - - - - - - - - 0.65 0.65 0.65 1.65 2.37 3.49 4.85 4.85 4.85 Total Production Mlbs - 0.82 2.59 4.11 5.35 5.35 5.35 5.35 5.52 5.20 4.50 4.58 4.46 4.92 4.85 4.85 4.85
Offtakes SignedInteralloys Trading Mlbs 0 0.4 0.4 0.4 0.4 0.4 0 0 0 0 0 0 0 0 0 0 0Total Offtakes Signed Mlbs 0 0.4 0.4 0.4 0.4 0.4 0 0 0 0 0 0 0 0 0 0 0Offtakes of Production % 0 49% 15% 10% 7% 7% 0% 0% 0% 0% 0% 0% 0% 0% #DIV/0! #DIV/0! #DIV/0!
BKY SALAMANCA - PRODUCTION PROFILE BKY SALAMANCA - PRODUCTION VS. OFFTAKE AGREEMENTS SIGNED
0.00
1.00
2.00
3.00
4.00
5.00
6.00
2017 2018 2019 2020 2021 2022 2023 2024 2025 2026 2027 2028 2029 2030 2031 2032 2033
BKYSALAMANCA- PRODUCTIONPROFILE
RetortilloNetProduction Zona7NetProduction AlamedaNetProduction InferredProduction
-
1.00
2.00
3.00
4.00
5.00
6.00
2017 2018 2019 2020 2021 2022 2023 2024 2025 2026 2027 2028 2029 2030
BKYSALAMANCA- PRODUCTIONVS.OFFTAKEAGREEMENTSSIGNED
TotalInitialProduction TotalOfftakesSigned
SHAREINVESTORS.CO.UK SHAREINVESTORS.CO.UK
SHAREINVESTORS.CO.UK


