VIRGINIA CENTER FOR TRANSPORTATION INNOVATION AND RESEARCH
530 Edgemont Road, Charlottesville, VA 22903-2454
www. VTRC.net
Best Practices and Performance Assessment for Preventive Maintenance Treatments for Virginia Pavements
http://www.virginiadot.org/vtrc/main/online_reports/pdf/16-r3.pdf EDGAR DE LEÓN IZEPPI, Ph.D. Senior Research Associate Center for Sustainable Transportation Infrastructure Virginia Tech Transportation Institute AKYIAA MORRISON Pavement Engineer Virginia Department of Transportation GERARDO W. FLINTSCH, Ph.D., P.E. Professor of Civil and Environmental Engineering Director of the Center for Sustainable Transportation Infrastructure Virginia Tech Transportation Institute KEVIN K. MCGHEE, P.E. Associate Principal Research Scientist Virginia Center for Transportation Innovation and Research
Final Report VCTIR 16-R3

Standard Title Page - Report on Federally Funded Project
1. Report No.: 2. Government Accession No.: 3. Recipient’s Catalog No.:
FHWA/VCTIR 16-R3
4. Title and Subtitle: 5. Report Date:
Best Practices and Performance Assessment for Preventive Maintenance Treatments
for Virginia Pavements
August 2015
6. Performing Organization Code:
7. Author(s):
Edgar de León Izeppi, Akyiaa Morrison, Gerardo W. Flintsch, and Kevin K. McGhee
8. Performing Organization Report No.:
VCTIR 16-R3
9. Performing Organization and Address:
Virginia Tech Transportation Institute
3500 Transportation Research Plaza (0536)
Blacksburg, VA 24061
10. Work Unit No. (TRAIS):
11. Contract or Grant No.:
97315
12. Sponsoring Agencies’ Name and Address: 13. Type of Report and Period Covered:
Virginia Department of Transportation
1401 E. Broad Street
Richmond, VA 23219
Federal Highway Administration
400 North 8th Street, Room 750
Richmond, VA 23219-4825
Final Contract
14. Sponsoring Agency Code:
15. Supplementary Notes:
16. Abstract:
Preventive maintenance has the potential to improve network condition by retarding future pavement deterioration. This
report outlines guidelines for implementing a preventive maintenance policy for bituminous pavements.
Preventive maintenance treatments currently being used in Virginia include chip seal, slurry seal, microsurfacing, and thin
hot mix asphalt overlays. Historical pavement condition data were obtained from the Virginia Department of Transportation’s
Pavement Management System for these treatments, and treatment performance models were developed. A district-level
treatment selection tool was developed to facilitate the district-level decision-making process. A prioritized list of pavement
sections was generated, maximizing the cost-effectiveness of the selected treatments subject to budgetary constraints set by the
Central Office. As a pilot implementation, the treatment selection tool was then run for each pavement classification in each
district. The results of this pilot suggest that this selection tool has the potential to be a practical decision support tool.
17 Key Words: 18. Distribution Statement:
pavement, preventive maintenance, performance models,
treatment selection, marginal cost effectiveness (MCE)
No restrictions. This document is available to the public
through NTIS, Springfield, VA 22161.
19. Security Classif. (of this report): 20. Security Classif. (of this page): 21. No. of Pages:
58
22. Price:
Unclassified Unclassified
Form DOT F 1700.7 (8-72) Reproduction of completed page authorized
FINAL REPORT
BEST PRACTICES AND PERFORMANCE ASSESSMENT FOR PREVENTIVE
MAINTENANCE TREATMENTS FOR VIRGINIA PAVEMENTS
Edgar de León Izeppi, Ph.D.
Senior Research Associate
Center for Sustainable Transportation Infrastructure
Virginia Tech Transportation Institute
Akyiaa Morrison
Pavement Engineer
Virginia Department of Transportation
Gerardo W. Flintsch, Ph.D., P.E.
Professor of Civil and Environmental Engineering
Director of the Center for Sustainable Transportation Infrastructure
Virginia Tech Transportation Institute
Kevin K. McGhee, P.E.
Associate Principal Research Scientist
Virginia Center for Transportation Innovation and Research
Project Manager
Michael M. Sprinkel, P.E.
Virginia Center for Transportation Innovation and Research
In Cooperation with the U.S. Department of Transportation
Federal Highway Administration
Virginia Center for Transportation Innovation and Research
(A partnership of the Virginia Department of Transportation and
the University of Virginia since 1948)
Charlottesville, Virginia
August 2015
VCTIR 16-R3
ii
DISCLAIMER
The project that is the subject of this report was done under contract for the Virginia
Department of Transportation, Virginia Center for Transportation Innovation and Research. The
contents of this report reflect the views of the author(s), who is responsible for the facts and the
accuracy of the data presented herein. The contents do not necessarily reflect the official views
or policies of the Virginia Department of Transportation, the Commonwealth Transportation
Board, or the Federal Highway Administration. This report does not constitute a standard,
specification, or regulation. Any inclusion of manufacturer names, trade names, or trademarks is
for identification purposes only and is not to be considered an endorsement.
Each contract report is peer reviewed and accepted for publication by staff of Virginia
Center for Transportation Innovation and Research with expertise in related technical areas.
Final editing and proofreading of the report are performed by the contractor.
Copyright 2015 by the Commonwealth of Virginia.
All rights reserved.
iii
ABSTRACT
Preventive maintenance has the potential to improve network condition by retarding future
pavement deterioration. This report outlines guidelines for implementing a preventive
maintenance policy for bituminous pavements.
Preventive maintenance treatments currently being used in Virginia include chip seal,
slurry seal, microsurfacing, and thin hot mix asphalt overlays. Historical pavement condition
data were obtained from the Virginia Department of Transportation’s Pavement Management
System for these treatments, and treatment performance models were developed. A district-level
treatment selection tool was developed to facilitate the district-level decision-making process. A
prioritized list of pavement sections was generated, maximizing the cost-effectiveness of the
selected treatments subject to budgetary constraints set by the Central Office. As a pilot
implementation, the treatment selection tool was then run for each pavement classification in
each district. The results of this pilot suggest that this selection tool has the potential to be a
practical decision support tool.
1
FINAL REPORT
BEST PRACTICES AND PERFORMANCE ASSESSMENT FOR PREVENTIVE
MAINTENANCE TREATMENTS FOR VIRGINIA PAVEMENTS
Edgar de León Izeppi, Ph.D.
Senior Research Associate
Center for Sustainable Transportation Infrastructure
Virginia Tech Transportation Institute
Akyiaa Morrison
Pavement Engineer
Virginia Department of Transportation
Gerardo W. Flintsch, Ph.D., P.E.
Professor of Civil and Environmental Engineering
Director of the Center for Sustainable Transportation Infrastructure
Virginia Tech Transportation Institute
Kevin K. McGhee, P.E.
Associate Principal Research Scientist
Virginia Center for Transportation Innovation and Research
INTRODUCTION
The majority of the highways in Virginia were built as a response to the increased use of
automobiles in the rapidly growing urban areas, especially from the 1960s to the 1970s during
the expansion of the interstate system. By the 1980s, most of these roads had been heavily used
and had started showing signs of distress, and the state was forced to shift attention to their
rehabilitation. A similar trend has been observed at the national level.
This shift caught agencies “allocating the limited available funds on a worst-first basis,
reducing the number of miles they could treat each year which resulted in a decrease in the
overall condition of the pavement network” (Peshkin et al., 2003). Since then, pavement
managers have learned that it is actually more cost-effective not to allow pavements to freely
deteriorate to the point of rehabilitation but instead to prolong the good condition through a
series of intermediate, smaller maintenance actions known as preventive maintenance.
The problem with the preventive maintenance approach, however, is which treatments to
use and when to use them, for any particular pavement situation. The literature indicates that
properly designed and implemented preventive maintenance strategies save money in the long
term and enhance the sustainability of our road infrastructure. Engineers now know that timely
application of preventive maintenance practices will in fact produce a more “cost-effective
means of obtaining the desired life and performance of a pavement” (Peshkin et al., 2003).

2
Unfortunately, there are still questions pertaining to the functional performance of the
various preventive maintenance treatments (e.g., friction) over time and their effect on extending
pavement service life. Traffic demand, climatic conditions, and treatment costs are among the
many important factors that may make some alternatives more effective than others in different
situations. Some of these questions can be answered by taking advantage of the agency’s
Pavement Management System (PMS).
In Virginia, the Virginia Department of Transportation (VDOT) Central Office
Maintenance Division provides recommendations to each district regarding treatment categories,
budget, and total lane-miles to be maintained within each road category (interstate, primary, and
secondary). Within each district, the pavement managers select which pavements receive
maintenance as well as their specific treatments. Most districts have different criteria that can
qualify a pavement for consideration for preventive maintenance, and treatment selection is
based on engineering experience. Over time, each district has developed its own preventive
maintenance policy, and preventive maintenance treatment selection varies across the state.
Furthermore, budget reductions have affected the amount of maintenance and
rehabilitation work that can be done every year. In 2011 the state “pumped $4 billion into the
state transportation system to jump-start about 900 projects around Virginia over the next 3
years, with about $2.9 billion in debt to be retired with anticipated federal funds” (Walker,
2011). Now, more than ever, it is imperative that the state use a life-cycle cost process to
identify the most correct and timely pavement preservation alternatives in order to optimize
usage of the available resources.
PURPOSE AND SCOPE
The purpose of this study was to critically review VDOT’s pavement preservation
program and provide recommended policy and practice changes that would make the program
more effective at every level. The study started with a thorough review of related research and is
coupled with an overview of current VDOT practice from both the central office and district
perspectives. The research team then used data from VDOT’s PMS to model the performance of
the most common preservation treatments used in Virginia. An important deliverable is a user
friendly selection tool for use at the district level, which is effective in identifying all feasible
treatments for pavement sections identified by the PMS as suitable candidates for preventive
maintenance, as well as identifying the treatment providing the greatest benefit at the lowest cost
for each of these sections. The selection tool was constructed around models of performance for
four preventive maintenance treatments: microsurfacing, slurry seal, chip seal, and thin hot mix
concrete overlay (THMACO), as well as the reference “do-nothing” deterioration curves.

3
METHODS
The objectives of the project were met by performing three tasks: state of the practice
review, VDOT preventive maintenance performance assessment, and development of preventive
maintenance treatment selection tool.
State of the Practice Review
The project started with a compilation of the main findings from various ongoing
research projects and current practices in pavement preservation. The complete literature review
is included in the Appendix. In addition to summarizing the available preventive maintenance
treatments, this review discusses methods used to develop treatment selection tools. The
relevant concepts included in the review are performance prediction and modeling, decision trees
and matrices, scoring systems, and operations research tools. The literature review also presents
case studies of previous approaches used for optimizing pavement preservation treatments.
The first task of the research also included a current practice review of VDOT-specific
preventive maintenance. It starts with an overview of VDOT’s PMS and follows that system to
the point at which it makes recommendations to the districts. A district-level review is then
conducted through interviews with staff. The activities of Task 1 concluded with a list of various
alternative treatments, their attributes, and characteristics to help decision makers select the most
promising treatments for Virginia’s roads.
VDOT Preventive Maintenance Performance Assessment
Task 2 reviewed the current pavement treatment practices in Virginia and developed
some recommendations for implementation of a preventive maintenance policy. Pavement
condition data were obtained from VDOT’s PMS. These data were analyzed to develop
condition deterioration models for each of the four preventive maintenance treatments
recommended in this study for general implementation: microsurfacing, slurry seal, chip seal,
and thin hot mix asphalt concrete overlay (THMACO), as well as for those roads that did not
receive any preservation treatment, indicated as the “do-nothing” option.
Development of Preventive Maintenance Treatment Selection Tool
Task 3 brought together findings related to treatment feasibility and costs with
performance models to produce a district-level treatment selection tool. The user-friendly tool
was developed using a Microsoft Excel workbook enhanced with Visual Basic. It applies
centrally developed recommendations and allocations for preventive maintenance (PM) with
local preferences (e.g., treatment performance & costs) to produce a district-wide preventive
maintenance programming aid.

4
RESULTS
State of the Practice Review
General Concepts
Preventive Maintenance
Maintaining road conditions to acceptable standards with traditional pavement
maintenance approaches can be quite costly (Zaniewski and Mamlouk, 1999). Pavement
preservation can be defined as “a program employing a network level, long-term strategy that
enhances functional pavement performance by using an integrated, cost-effective set of practices
that extend pavement life, improve safety, and meet motorist expectations” (Geiger, 2005).
Pavement preservation is a general category of road maintenance that consists of three
components: minor rehabilitation, routine maintenance, and preventive maintenance (Geiger,
2005).
Although the terms “pavement preservation” and “preventive maintenance” are often
used interchangeably, preventive maintenance is in fact a subset of pavement preservation.
Preventive maintenance maintains the functional condition of roadway systems, without
improving their structural capacity, by strategically applying cost-effective treatments (Peshkin
and Hoerner, 2005). Preventive maintenance seals the pavement surface and prevents water
from infiltrating into the pavement structure. These treatments are often applied to pavements in
relatively good condition and prolong pavement life by maintaining the pavement in an
acceptable state for a longer period of time. Preventive maintenance allows pavements to be
maintained during times of reduced funding (Hicks et al., 1999). Highway agencies with limited
funding can use preventive maintenance so that “pavements can be maintained in a cost-effective
manner leading to a better pavement quality at lower total costs” (Zaniewski and Mamlouk,
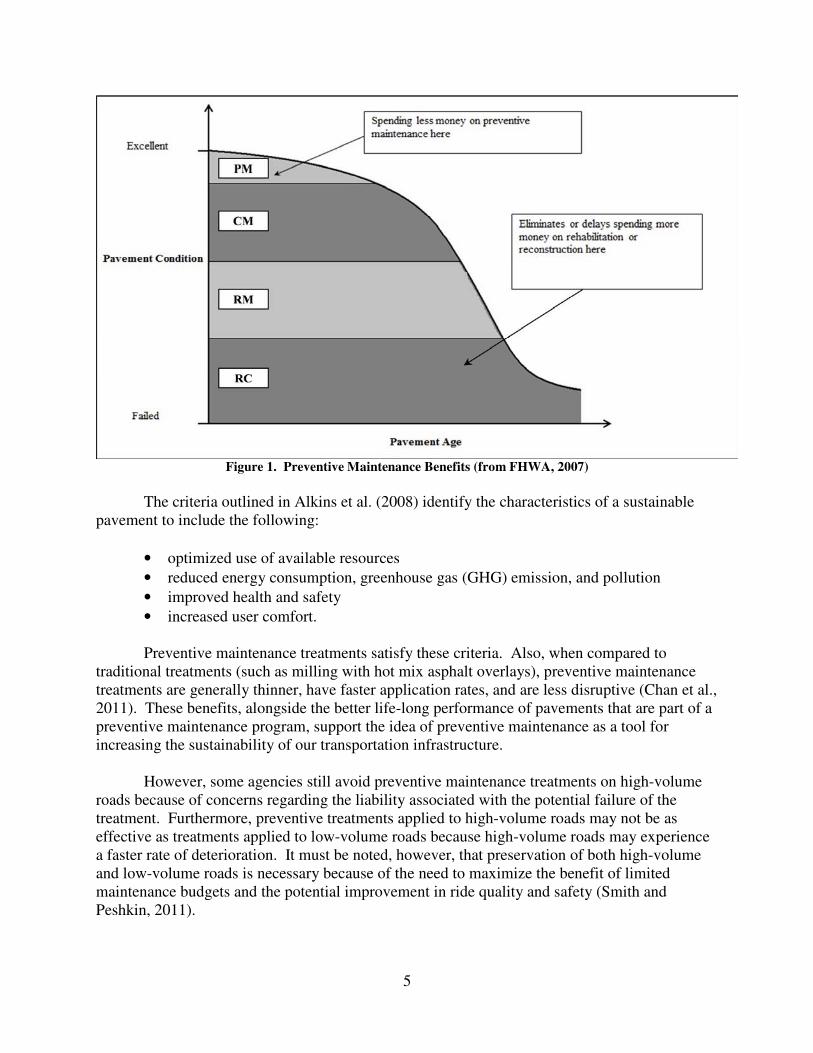
1999). This concept is illustrated in Figure 1.
With growing concerns about the environmental impact of our built infrastructure,
sustainability is becoming a common theme among road agencies. The principle of
sustainability requires consideration of economic, social, and environmental progress while
meeting human needs for the present and the future (Zietsman, 2011).
5
Figure 1. Preventive Maintenance Benefits (from FHWA, 2007)
The criteria outlined in Alkins et al. (2008) identify the characteristics of a sustainable
pavement to include the following:
• optimized use of available resources
• reduced energy consumption, greenhouse gas (GHG) emission, and pollution
• improved health and safety
• increased user comfort.
Preventive maintenance treatments satisfy these criteria. Also, when compared to
traditional treatments (such as milling with hot mix asphalt overlays), preventive maintenance
treatments are generally thinner, have faster application rates, and are less disruptive (Chan et al.,
2011). These benefits, alongside the better life-long performance of pavements that are part of a
preventive maintenance program, support the idea of preventive maintenance as a tool for
increasing the sustainability of our transportation infrastructure.
However, some agencies still avoid preventive maintenance treatments on high-volume
roads because of concerns regarding the liability associated with the potential failure of the
treatment. Furthermore, preventive treatments applied to high-volume roads may not be as
effective as treatments applied to low-volume roads because high-volume roads may experience
a faster rate of deterioration. It must be noted, however, that preservation of both high-volume
and low-volume roads is necessary because of the need to maximize the benefit of limited
maintenance budgets and the potential improvement in ride quality and safety (Smith and
Peshkin, 2011).
6
Popular preventive maintenance treatments include the following (described in more
detail in the Appendix):
• crack seal
• slurry seal
• chip seal
• microsurfacing
• cape seal
• ultra-thin friction course
• thin and ultra-thin hot mix asphalt overlay.
Pavement Management Systems and Preventive Maintenance
In 2001, the American Association of State Highway and Transportation Officials
(AASHTO) published a guide for pavement management that outlined the technologies available
and relevant processes pertaining to pavement management. This guide defines pavement
management as “a management approach used by personnel in an agency to make decisions” and
defines a PMS as “a set of tools used to assist decision-makers at all levels in making better and
more informed decisions” (AASHTO, 2001).
A PMS is an important tool in the development of preventive maintenance policies. It
can demonstrate the key benefit to preventive maintenance: preventing potentially costly
rehabilitation by maintaining good pavement condition. One possible benefit of integrating PMS
with preventive maintenance is the possibility of optimizing the treatment selection within the
pavement management process. Preventive maintenance operations can be run in tandem with
major rehabilitation so that poor pavements are improved while good pavements maintain their
good condition. It should be noted, however, that performance of preventive maintenance
treatments should be monitored so that prediction models can be refined and their expected
benefit specific to the desired road network can be estimated (Zimmerman and Peshkin, 2003).
Current Practice—VDOT Central Pavement Management
Pavement Management
VDOT currently uses a pavement management software system developed by Agile
Assets (Agile Assets, 2012). This system performs network-level, multi-constraint optimization,
which develops a work plan using single objectives and multiple constraints. The objective can
be either to minimize cost while achieving specified performance targets or to maximize
performance while satisfying budgetary concerns. The output of this optimization analysis is the
recommended treatment category for each pavement section: Do Nothing (DN), Preventive
Maintenance (PM), Corrective Maintenance (CM), Restorative Maintenance (RM), or
Rehabilitation and/or Reconstruction (RC).
The PMS performs two analyses for maintenance needs: unconstrained needs analysis
and constrained needs analysis. The unconstrained needs analysis, or total needs, provides the
7
cost of all work performed based on recommended treatment selections for each pavement. The
constrained needs analysis can be used to determine the following:
• the cost required to maintain the network in its current condition
• the cost required to achieve and maintain a desired condition for the network
• the effect of a given budget on network condition.
VDOT’s Central Office Maintenance Division generates reports from VDOT’s PMS that
provide maintenance targets for each district. Recommended budget and number of lane-miles
are provided for each maintenance category (DN, PM, CM, RM, and RC). The district
maintenance engineer uses these recommendations, along with the unconstrained analysis, to
select pavements for maintenance and treatments to be applied.
Maintenance Categories
The total roadway system under the responsibility of the VDOT is 126,186 lane-miles:
5,400 lane-miles of interstate roads, 21,666 lane-miles of primary roads, 98,463 lane-miles of
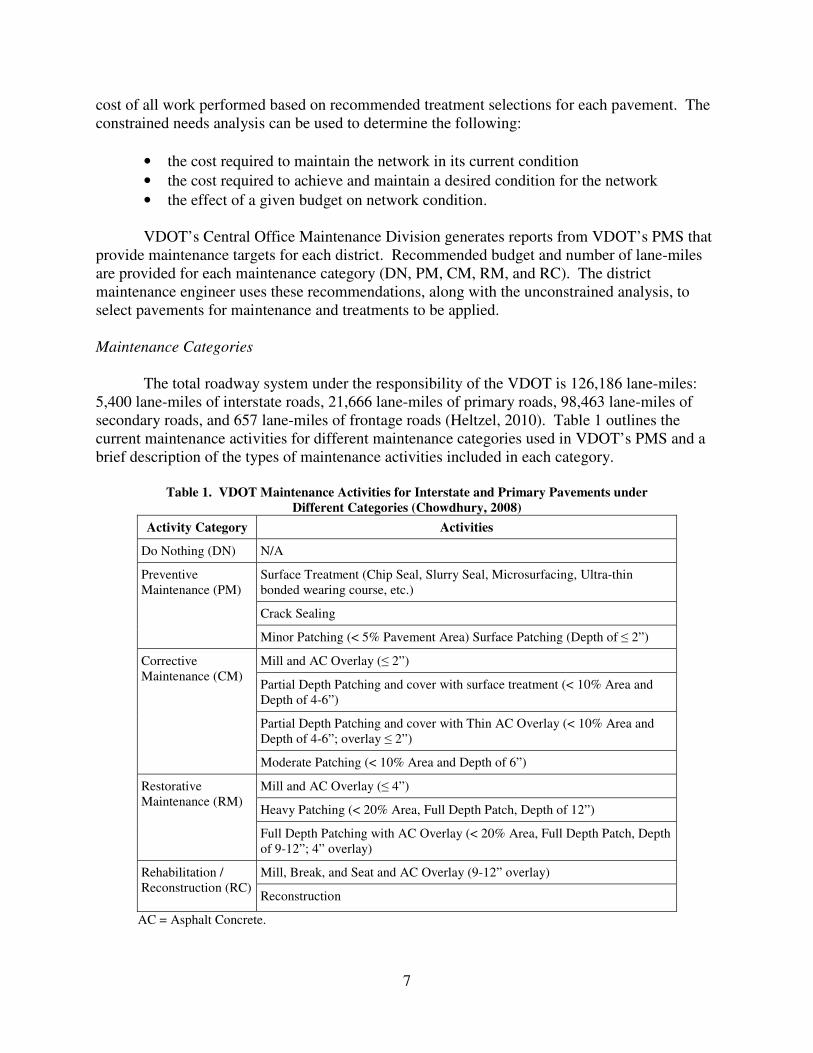
secondary roads, and 657 lane-miles of frontage roads (Heltzel, 2010). Table 1 outlines the
current maintenance activities for different maintenance categories used in VDOT’s PMS and a
brief description of the types of maintenance activities included in each category.
Table 1. VDOT Maintenance Activities for Interstate and Primary Pavements under
Different Categories (Chowdhury, 2008)
Activity Category Activities
Do Nothing (DN) N/A
Preventive
Maintenance (PM)
Surface Treatment (Chip Seal, Slurry Seal, Microsurfacing, Ultra-thin
bonded wearing course, etc.)
Crack Sealing
Minor Patching (< 5% Pavement Area) Surface Patching (Depth of ≤ 2”)
Corrective
Maintenance (CM)
Mill and AC Overlay (≤ 2”)
Partial Depth Patching and cover with surface treatment (< 10% Area and
Depth of 4-6”)
Partial Depth Patching and cover with Thin AC Overlay (< 10% Area and
Depth of 4-6”; overlay ≤ 2”)
Moderate Patching (< 10% Area and Depth of 6”)
Restorative
Maintenance (RM)
Mill and AC Overlay (≤ 4”)
Heavy Patching (< 20% Area, Full Depth Patch, Depth of 12”)
Full Depth Patching with AC Overlay (< 20% Area, Full Depth Patch, Depth
of 9-12”; 4” overlay)
Rehabilitation /
Reconstruction (RC)
Mill, Break, and Seat and AC Overlay (9-12” overlay)
Reconstruction
AC = Asphalt Concrete.

8
Each year, pavement condition data are collected by multi-function data collection
vehicles with cameras that take pictures of the pavement to capture cracking and laser sensors to
capture roughness and rutting. Pavement condition is obtained annually for interstate and
primary routes, and the PMS is updated with the most recent condition data. The asphalt
pavement distresses that are catalogued include transverse cracking, longitudinal cracking,
reflective transverse cracking, reflective longitudinal cracking, alligator cracking, longitudinal
joint cracking, patching, potholes, delamination, bleeding, and rutting.
VDOT uses three condition indices to rate pavement distresses. The first index is the
Load-Related Distress Rating (LDR), which measures pavement distresses caused by traffic
loading. The second index is the Non-Load-Related Distress Rating (NDR), which measures
pavement distresses that are not load-related, such as those caused by environmental or climatic
conditions. These two condition indices are rated on a scale of 0 to 100, where 100 is a
pavement having no distresses present. The third index is the Critical Condition Index (CCI),
which is the lower of the LDR and NDR (McGhee, 2002). In addition to storing the individual
distress data, the PMS calculates and stores the LDR, NDR, CCI, and the International
Roughness Index (IRI) for all sections.
The pavements are classified into the following general types: Bituminous over Jointed
Concrete Pavement (BOJ), Bituminous over Continuously Reinforced Concrete Pavement
(BOC), full-depth Bituminous Pavement (BIT), Continuously Reinforced Concrete Pavement
(CRC), and Jointed Reinforced Concrete Pavement (JCP). VDOT rates pavement deficiency
using the CCI and IRI values. In both cases, “deficient” pavements are those in the poor and
very poor categories. The pavement condition categories for interstate and primary pavements
based on CCI and IRI values are shown in Table 2. The statewide performance targets for
interstate and primary roads are ≤ 18% deficient for CCI and < 15% deficient for IRI.
Table 2. Interstate and Primary Pavement Condition Categories Based
on CCI and IRI Values (Heltzel, 2010)
Pavement Condition CCI IRI
Excellent 90–100 0–59
Good 70–89 60–99
Fair 60–69 100–139
Poor 50–59 140–199
Very Poor 0–49 ≥ 200
Unconstrained Maintenance Needs
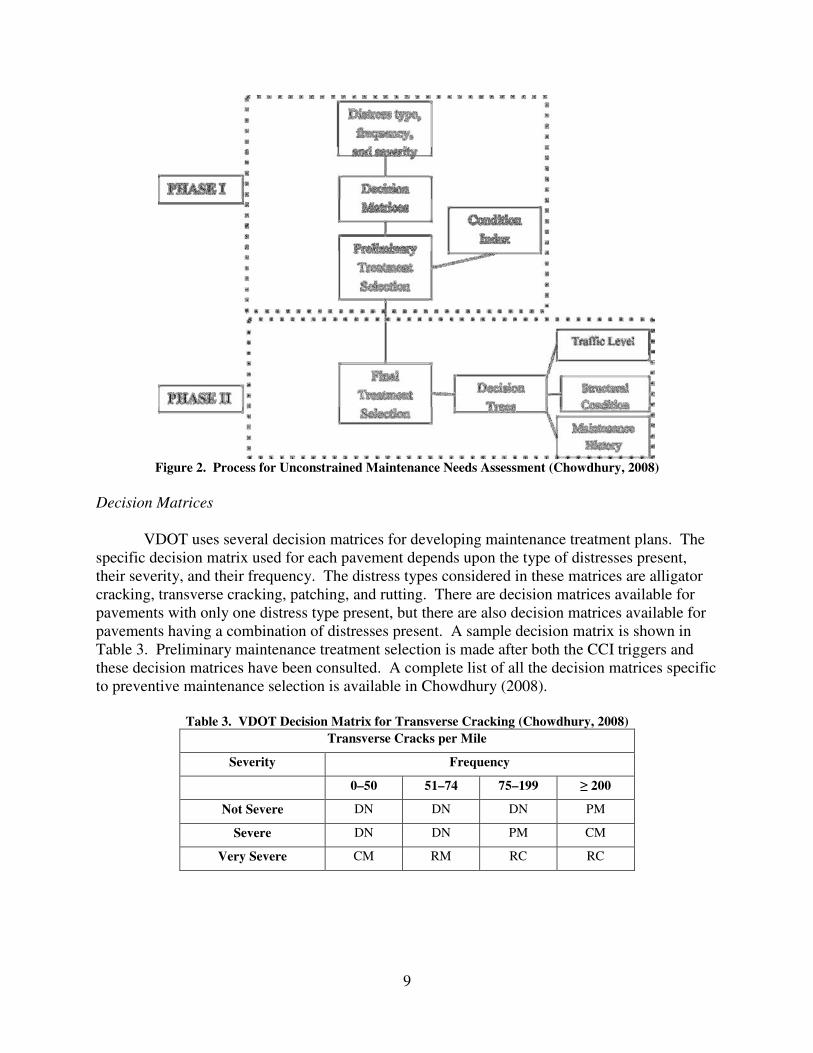
VDOT follows a two-phase process, illustrated in Figure 2, to determine pavement
maintenance needs for interstate and primary roads. The first phase uses distress data and the
pavement’s CCI to determine preliminary needs and expected cost. The first phase is then
enhanced by a second phase, which incorporates traffic data, pavement structure, and
maintenance history information to provide final needs and expected cost (Chowdhury, 2008).
9
Figure 2. Process for Unconstrained Maintenance Needs Assessment (Chowdhury, 2008)
Decision Matrices
VDOT uses several decision matrices for developing maintenance treatment plans. The
specific decision matrix used for each pavement depends upon the type of distresses present,
their severity, and their frequency. The distress types considered in these matrices are alligator
cracking, transverse cracking, patching, and rutting. There are decision matrices available for
pavements with only one distress type present, but there are also decision matrices available for
pavements having a combination of distresses present. A sample decision matrix is shown in
Table 3. Preliminary maintenance treatment selection is made after both the CCI triggers and
these decision matrices have been consulted. A complete list of all the decision matrices specific
to preventive maintenance selection is available in Chowdhury (2008).
Table 3. VDOT Decision Matrix for Transverse Cracking (Chowdhury, 2008)
Transverse Cracks per Mile
Severity Frequency
0–50 51–74 75–199 ≥ 200
Not Severe DN DN DN PM
Severe DN DN PM CM
Very Severe CM RM RC RC

10
CCI Triggers for Preventive Maintenance
In addition to the decision matrices, preliminary treatment selection is based on CCI
values. For interstate roads, pavements with a CCI value between 85 and 90 are eligible for
consideration for preventive maintenance. For primary roads, pavements with a CCI between 80
and 90 are eligible for consideration for preventive maintenance (Chowdhury, 2008). In the
secondary system, pavements that have an asphalt concrete (AC) surface are considered plant
mix, but those having only an asphalt surface treatment (single, double, etc.) are considered non-
plant mix. Preventive maintenance treatments are mostly used for pavements with a CCI of 60
or higher, where it has been determined that a do-nothing alternative is not enough but also
where a corrective maintenance alternative is not warranted. Figure 3 summarizes the typical
ranges of application of the different maintenance categories for each road classification. It
should be noted that the application of preventive maintenance treatments outside of the
recommended ratings generally results in sub-optimal treatment performance.
Figure 3. Maintenance Activities for Each Road System
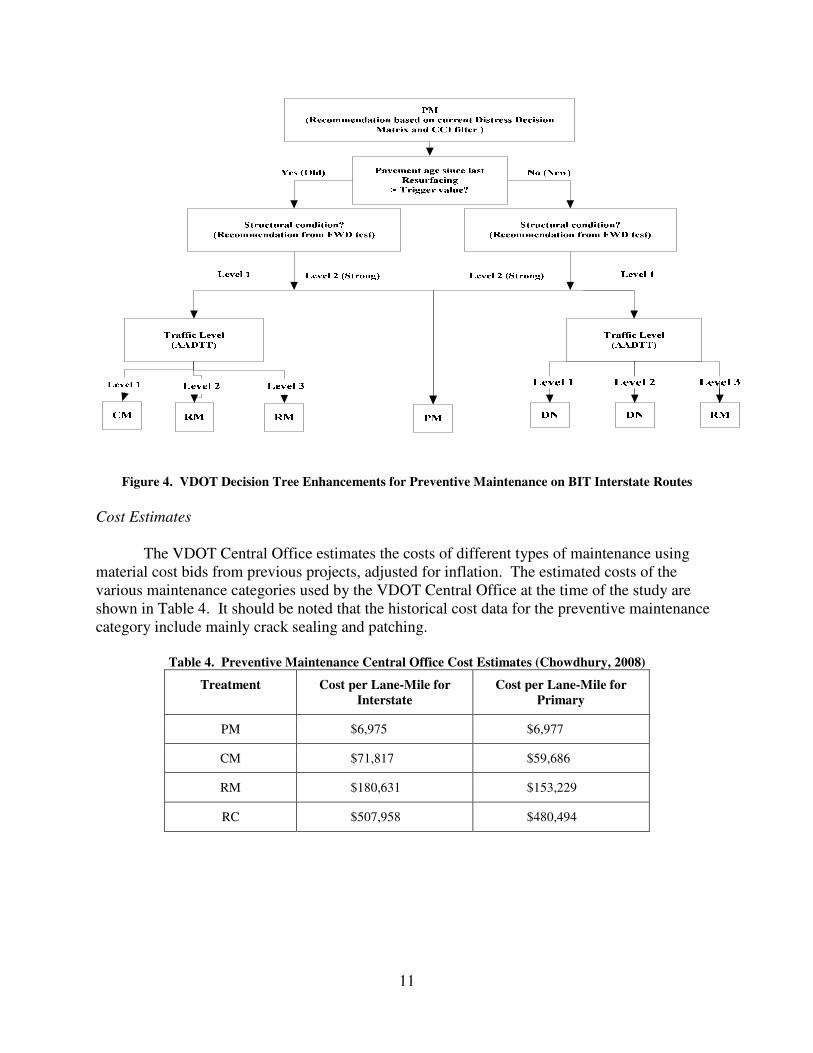
Decision Enhancements
As outlined in Figure 2, the preliminary treatment selection is enhanced using decision
trees that incorporate traffic, structural condition, and maintenance history. The decision tree for
preventive maintenance on interstate BIT routes is shown in Figure 4.
11
Figure 4. VDOT Decision Tree Enhancements for Preventive Maintenance on BIT Interstate Routes
Cost Estimates
The VDOT Central Office estimates the costs of different types of maintenance using
material cost bids from previous projects, adjusted for inflation. The estimated costs of the
various maintenance categories used by the VDOT Central Office at the time of the study are
shown in Table 4. It should be noted that the historical cost data for the preventive maintenance
category include mainly crack sealing and patching.
Table 4. Preventive Maintenance Central Office Cost Estimates (Chowdhury, 2008)
Treatment Cost per Lane-Mile for
Interstate
Cost per Lane-Mile for
Primary
PM $6,975 $6,977
CM $71,817 $59,686
RM $180,631 $153,229
RC $507,958 $480,494

12
Current Practice—District Pavement Management
VDOT defines a deficient pavement as one with a CCI value below 60. The statewide
target for interstate and primary route condition is to have less than 18% of the pavements rated
as deficient (Heltzel, 2010). The deficiency percentages for each district are shown in Figure 5.
Figure 5. Deficiency Percentages by District for Interstate and Primary Routes (Heltzel, 2010)
The figure shows that each district has different levels of pavement deficiency. There are
many factors that can contribute to different overall pavement performance from district to
district. While many of these factors are uncontrollable (e.g., climate, traffic), some differences
may result from dissimilar approaches to pavement maintenance, as there is currently no
statewide preventive maintenance policy.
To explore how preventive maintenance policy varied around the state, three districts
were selected for closer evaluation: Salem, Richmond, and Northern Virginia. Maintenance and
materials engineers for these regions were interviewed to identify and document the current
practices at the district level. These interviews allowed a comparison between in-state practices
and the methods found in the literature and also allowed identification of preventive maintenance
and pavement management policies that would be beneficial to Virginia.
Salem District
The Salem District is located in southwest Virginia. Its office serves more than 650,000
citizens and 14 cities and towns within its boundaries. The district comprises 12 counties and
has 4 residency offices. The total number of lane-miles in this district is 17,966, including 490
lane-miles of interstate roadways, 2,668 lane-miles of primary roads, and 14,701 lane-miles of
13
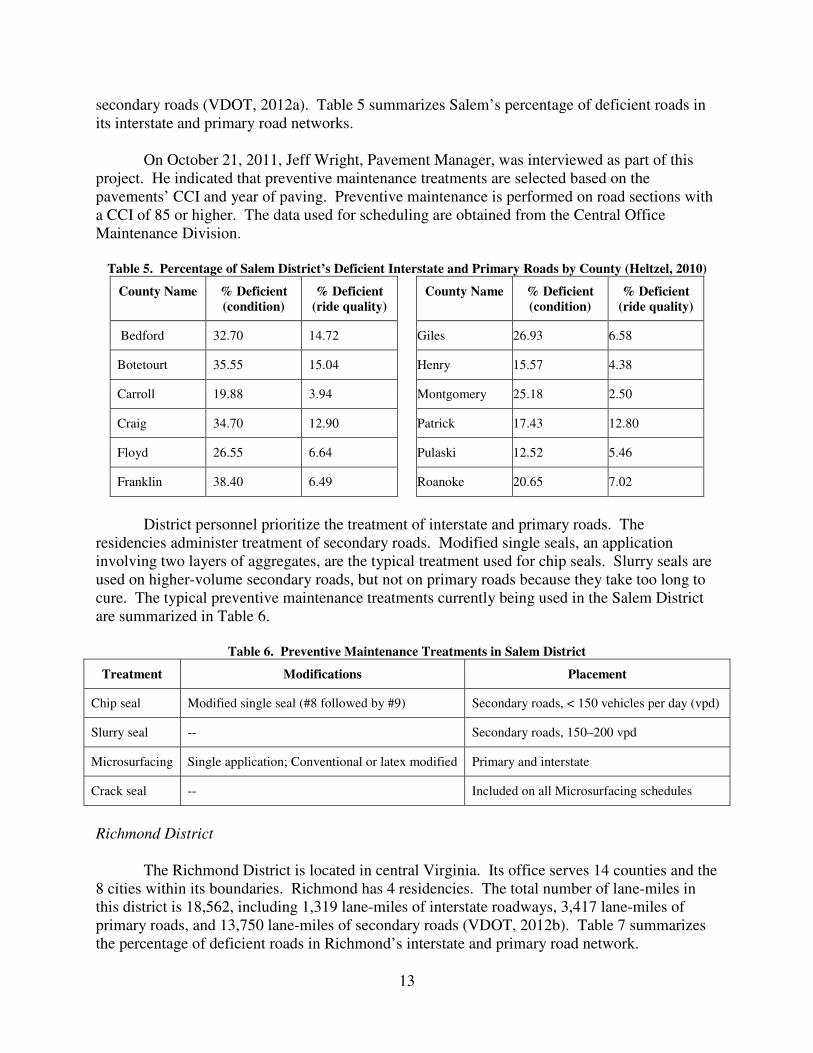
secondary roads (VDOT, 2012a). Table 5 summarizes Salem’s percentage of deficient roads in
its interstate and primary road networks.
On October 21, 2011, Jeff Wright, Pavement Manager, was interviewed as part of this
project. He indicated that preventive maintenance treatments are selected based on the
pavements’ CCI and year of paving. Preventive maintenance is performed on road sections with
a CCI of 85 or higher. The data used for scheduling are obtained from the Central Office
Maintenance Division.
Table 5. Percentage of Salem District’s Deficient Interstate and Primary Roads by County (Heltzel, 2010)
County Name % Deficient
(condition)
% Deficient
(ride quality)
County Name % Deficient
(condition)
% Deficient
(ride quality)
Bedford 32.70 14.72 Giles 26.93 6.58
Botetourt 35.55 15.04 Henry 15.57 4.38
Carroll 19.88 3.94 Montgomery 25.18 2.50
Craig 34.70 12.90 Patrick 17.43 12.80
Floyd 26.55 6.64 Pulaski 12.52 5.46
Franklin 38.40 6.49 Roanoke 20.65 7.02
District personnel prioritize the treatment of interstate and primary roads. The
residencies administer treatment of secondary roads. Modified single seals, an application
involving two layers of aggregates, are the typical treatment used for chip seals. Slurry seals are
used on higher-volume secondary roads, but not on primary roads because they take too long to
cure. The typical preventive maintenance treatments currently being used in the Salem District
are summarized in Table 6.
Table 6. Preventive Maintenance Treatments in Salem District
Treatment Modifications Placement
Chip seal Modified single seal (#8 followed by #9) Secondary roads, < 150 vehicles per day (vpd)
Slurry seal -- Secondary roads, 150–200 vpd
Microsurfacing Single application; Conventional or latex modified Primary and interstate
Crack seal -- Included on all Microsurfacing schedules
Richmond District
The Richmond District is located in central Virginia. Its office serves 14 counties and the
8 cities within its boundaries. Richmond has 4 residencies. The total number of lane-miles in
this district is 18,562, including 1,319 lane-miles of interstate roadways, 3,417 lane-miles of
primary roads, and 13,750 lane-miles of secondary roads (VDOT, 2012b). Table 7 summarizes
the percentage of deficient roads in Richmond’s interstate and primary road network.

14
On November 30, 2011, William Hughes, Pavement Management Engineer for the
Richmond District, granted an interview for the project. He stated that preventive maintenance is
applied to roads with a CCI of 75–85. Preventive maintenance treatments other than crack
sealing are not currently used on interstate roads because most of them are structurally deficient.
Table 7. Percentage of Richmond District’s Deficient Interstate and Primary Roads by County (Heltzel,
2010)
County Name % Deficient
(condition)
% Deficient
(ride quality)
County Name % Deficient
(condition)
% Deficient
(ride quality)
Amelia 17.29 13.30 Henrico 30.99 26.26
Brunswick 32.74 17.10 Lunenburg 12.07 12.44
Charles City 33.28 10.07 Mecklenburg 29.99 4.58
Chesterfield 26.27 4.44 New Kent 39.49 3.78
Dinwiddie 23.85 14.67 Nottoway 35.32 3.84
Goochland 22.04 22.32 Powhatan 44.50 3.45
Hanover 32.19 9.44 Prince George 36.22 10.08
As in the Salem District, the interstate and primary roads are managed by district
personnel, but secondary roads and subdivisions are maintained through the residencies. The
typical preventive maintenance treatments currently being used in the Richmond District are
summarized in Table 8.
Table 8. Preventive Maintenance Treatments in Richmond District
Treatment Modifications Placement
Chip seal Modified single seal; double seal Secondary roads
Slurry seal Type B or C Primary and secondary roads
Microsurfacing Latex modified, “flexible micro” Primary roads
Crack seal -- Interstate
Cape seal -- Secondary roads
Northern Virginia (NOVA) District
The Northern Virginia District is located in the Washington, D.C., metropolitan area. Its
office supports 4 counties and 9 cities and towns located within its boundaries. The total number
of lane-miles in this district is 12,655, including 684 lane-miles of interstate roadways, 1,549
lane-miles of primary roads, and 10,343 lane-miles of secondary roads (VDOT, 2012c). Table 9
summarizes the percentage of deficient roads in NOVA’s interstate and primary road network.

15
Table 9. Percentage of NOVA District’s Deficient Interstate
and Primary Roads by County (Heltzel, 2010)
County Name % Deficient
(condition)
% Deficient
(ride quality)
Arlington 45.41 49.88
Fairfax 38.22 26.82
Loudon 50.30 13.71
Prince William 24.46 9.14
On November 22, 2011, Rob Wilson, the NOVA District Pavement Engineer, was
interviewed for this project. He indicated that preventive maintenance treatments may be applied
to roads with a CCI of 80–89. Preventive maintenance and corrective maintenance (e.g., crack
sealing and minor patching) are an option for roads with a CCI of 70–79. The typical pavement
age for application of preventive maintenance treatments is 3 to 5 years for high-volume roads
and 5 to 10 years for low-volume roads. Interstate, primary, and secondary roads are all handled
by the district personnel. The one exception is Arlington County, which maintains its secondary
roads.
Some challenges identified were funding and traffic level. Budgetary constraints limit
the range of treatments that can be applied to these pavements. Furthermore, the district’s heavy
traffic volumes place extra strain on maintenance applications: conditions can deteriorate very
rapidly, making scheduling more difficult. The typical preventive maintenance treatments
currently being used in the Northern Virginia District are summarized in Table 10.
Table 10. Preventive Maintenance Treatments in NOVA District
Treatment Modifications Placement
Slurry seal Type A, B, C, double seal modified, latex Primary and secondary roads
Crack seal -- Included on all latex schedules
Cape seal -- Application to start in 2013
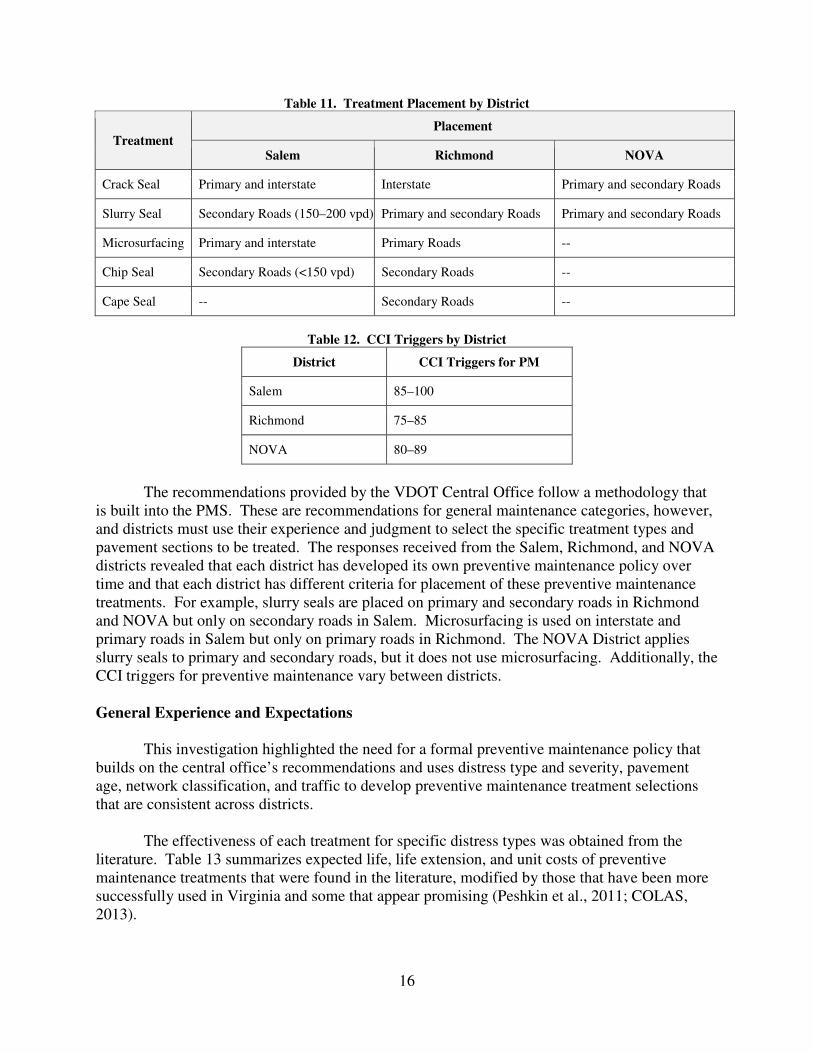
General Observations
A comparison of treatment placement on the various road classes across districts is
shown in Table 11. The CCI triggers for preventive maintenance used by the three districts are
compared in Table 12.
16
Table 11. Treatment Placement by District
Treatment Placement
Salem Richmond NOVA
Crack Seal Primary and interstate Interstate Primary and secondary Roads
Slurry Seal Secondary Roads (150–200 vpd) Primary and secondary Roads Primary and secondary Roads
Microsurfacing Primary and interstate Primary Roads --
Chip Seal Secondary Roads (<150 vpd) Secondary Roads --
Cape Seal -- Secondary Roads --
Table 12. CCI Triggers by District
District CCI Triggers for PM
Salem 85–100
Richmond 75–85
NOVA 80–89
The recommendations provided by the VDOT Central Office follow a methodology that
is built into the PMS. These are recommendations for general maintenance categories, however,
and districts must use their experience and judgment to select the specific treatment types and
pavement sections to be treated. The responses received from the Salem, Richmond, and NOVA
districts revealed that each district has developed its own preventive maintenance policy over
time and that each district has different criteria for placement of these preventive maintenance
treatments. For example, slurry seals are placed on primary and secondary roads in Richmond
and NOVA but only on secondary roads in Salem. Microsurfacing is used on interstate and
primary roads in Salem but only on primary roads in Richmond. The NOVA District applies
slurry seals to primary and secondary roads, but it does not use microsurfacing. Additionally, the
CCI triggers for preventive maintenance vary between districts.
General Experience and Expectations
This investigation highlighted the need for a formal preventive maintenance policy that
builds on the central office’s recommendations and uses distress type and severity, pavement
age, network classification, and traffic to develop preventive maintenance treatment selections
that are consistent across districts.
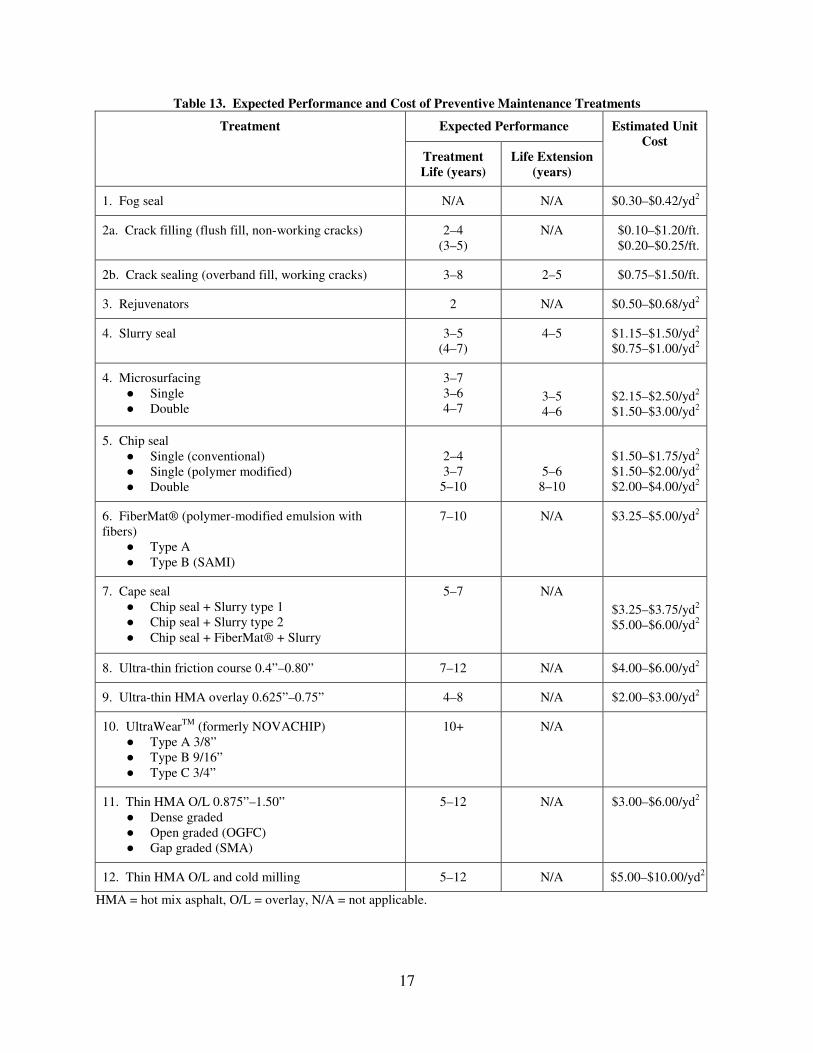
The effectiveness of each treatment for specific distress types was obtained from the
literature. Table 13 summarizes expected life, life extension, and unit costs of preventive
maintenance treatments that were found in the literature, modified by those that have been more
successfully used in Virginia and some that appear promising (Peshkin et al., 2011; COLAS,
2013).
17
Table 13. Expected Performance and Cost of Preventive Maintenance Treatments
Treatment Expected Performance Estimated Unit
Cost
Treatment
Life (years)
Life Extension
(years)
1. Fog seal N/A N/A $0.30–$0.42/yd2
2a. Crack filling (flush fill, non-working cracks) 2–4 (3–5)
N/A $0.10–$1.20/ft. $0.20–$0.25/ft.
2b. Crack sealing (overband fill, working cracks) 3–8 2–5 $0.75–$1.50/ft.
3. Rejuvenators 2 N/A $0.50–$0.68/yd2
4. Slurry seal 3–5 (4–7)
4–5 $1.15–$1.50/yd2
$0.75–$1.00/yd2
4. Microsurfacing ● Single
● Double
3–7 3–6 4–7
3–5 4–6
$2.15–$2.50/yd
2 $1.50–$3.00/yd
2
5. Chip seal ● Single (conventional)
● Single (polymer modified)
● Double
2–4
3–7
5–10
5–6
8–10
$1.50–$1.75/yd2
$1.50–$2.00/yd2
$2.00–$4.00/yd2
6. FiberMat® (polymer-modified emulsion with
fibers) ● Type A
● Type B (SAMI)
7–10 N/A $3.25–$5.00/yd2
7. Cape seal ● Chip seal + Slurry type 1
● Chip seal + Slurry type 2
● Chip seal + FiberMat® + Slurry
5–7 N/A $3.25–$3.75/yd
2 $5.00–$6.00/yd
2
8. Ultra-thin friction course 0.4”–0.80” 7–12 N/A $4.00–$6.00/yd2
9. Ultra-thin HMA overlay 0.625”–0.75” 4–8 N/A $2.00–$3.00/yd2
10. UltraWearTM
(formerly NOVACHIP) ● Type A 3/8”
● Type B 9/16”
● Type C 3/4”
10+ N/A
11. Thin HMA O/L 0.875”–1.50” ● Dense graded
● Open graded (OGFC)
● Gap graded (SMA)
5–12 N/A $3.00–$6.00/yd2
12. Thin HMA O/L and cold milling 5–12 N/A $5.00–$10.00/yd2
HMA = hot mix asphalt, O/L = overlay, N/A = not applicable.

18
Performance of Preventive maintenance treatments Used in Virginia
Preventive Maintenance Treatments
VDOT’s PMS contains historical performance data on preventive maintenance treatments
that are commonly used in Virginia. These data were used to develop Virginia-specific
treatment performance models for preventive maintenance on BIT, the most common pavement
type. The performance of four preventive maintenance treatments were considered using data
from the interstate and primary systems for chip seals, slurry seals, microsurfacing, and
THMACO.
Linear regression models were used to develop the performance curves. The linear
model allows for easier use in follow-up application (see later discussion on benefit calculations)
with minimal reduction in the accuracy that might be provided by more complex models. As an
example, Figure 6 presents a quick comparison between the model form as incorporated in
VDOT’s PMS and a simple linear model. This comparison shows that the linear model is an
adequate representation of expected pavement performance.
Figure 6. Comparison between VDOT Model and Linear Model
Of the historical information from the PMS, microsurfacing had the largest dataset, with
1,363 records available. There were 362 records available for slurry seal, 63 records available
for chip seal, and only 22 records available for THMACO. Because the microsurfacing dataset
was so large, these data were divided according to type of network: interstate or primary.
Some sections had CCI values of -1, suggesting that the data for these sections were not
collected. These null sections were removed. After the data were inspected, it was seen that
pavement condition seemed to improve after 10 years. This was attributed to the possible
unrecorded application of treatments to pavements. Records suggesting that the existing
treatment was older than 10 years were also deleted from the analysis.
Based on recommendations from VDOT Central Office personnel, an outlier analysis was
performed to remove any outliers in the data. Data were grouped according to pavement age,
and the standard deviation and average condition were computed for each group. A standard
normal distribution was assumed and the z score was computed. Any pavement section having z
19
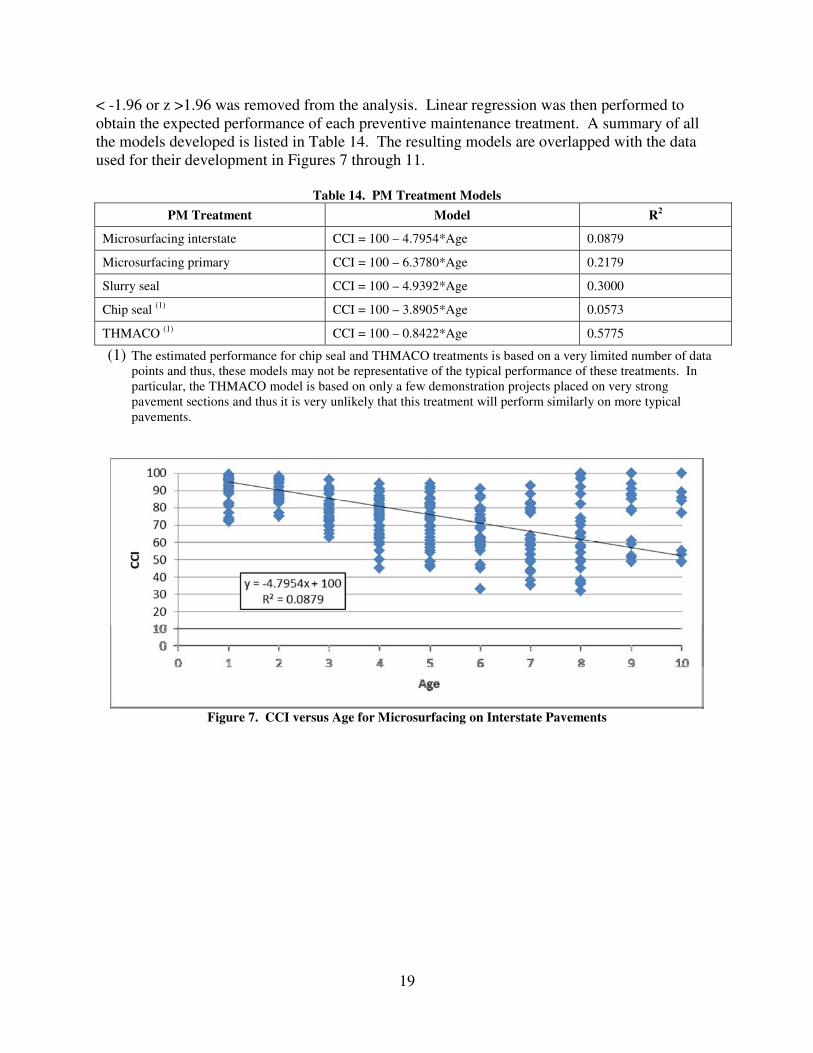
< -1.96 or z >1.96 was removed from the analysis. Linear regression was then performed to
obtain the expected performance of each preventive maintenance treatment. A summary of all
the models developed is listed in Table 14. The resulting models are overlapped with the data
used for their development in Figures 7 through 11.
Table 14. PM Treatment Models
PM Treatment Model R2
Microsurfacing interstate CCI = 100 – 4.7954*Age 0.0879
Microsurfacing primary CCI = 100 – 6.3780*Age 0.2179
Slurry seal CCI = 100 – 4.9392*Age 0.3000
Chip seal (1)
CCI = 100 – 3.8905*Age 0.0573
THMACO (1)
CCI = 100 – 0.8422*Age 0.5775
(1) The estimated performance for chip seal and THMACO treatments is based on a very limited number of data
points and thus, these models may not be representative of the typical performance of these treatments. In
particular, the THMACO model is based on only a few demonstration projects placed on very strong
pavement sections and thus it is very unlikely that this treatment will perform similarly on more typical
pavements.
Figure 7. CCI versus Age for Microsurfacing on Interstate Pavements
20
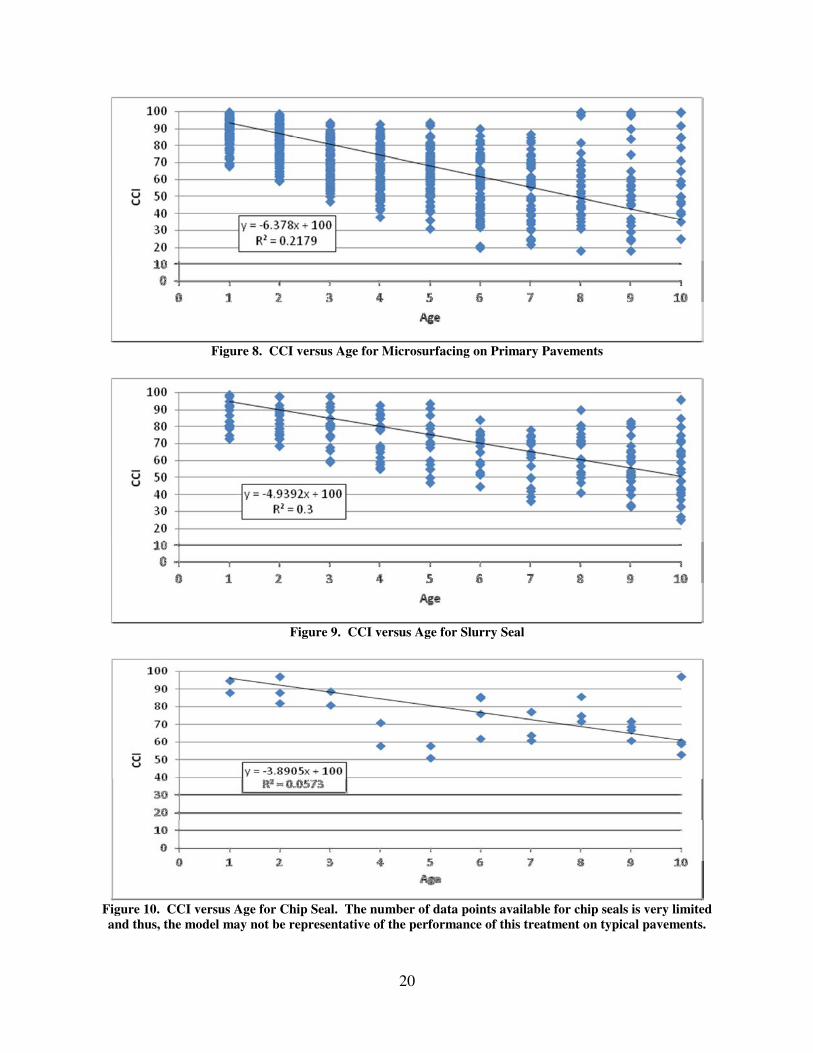
Figure 8. CCI versus Age for Microsurfacing on Primary Pavements
Figure 9. CCI versus Age for Slurry Seal
Figure 10. CCI versus Age for Chip Seal. The number of data points available for chip seals is very limited
and thus, the model may not be representative of the performance of this treatment on typical pavements.
21
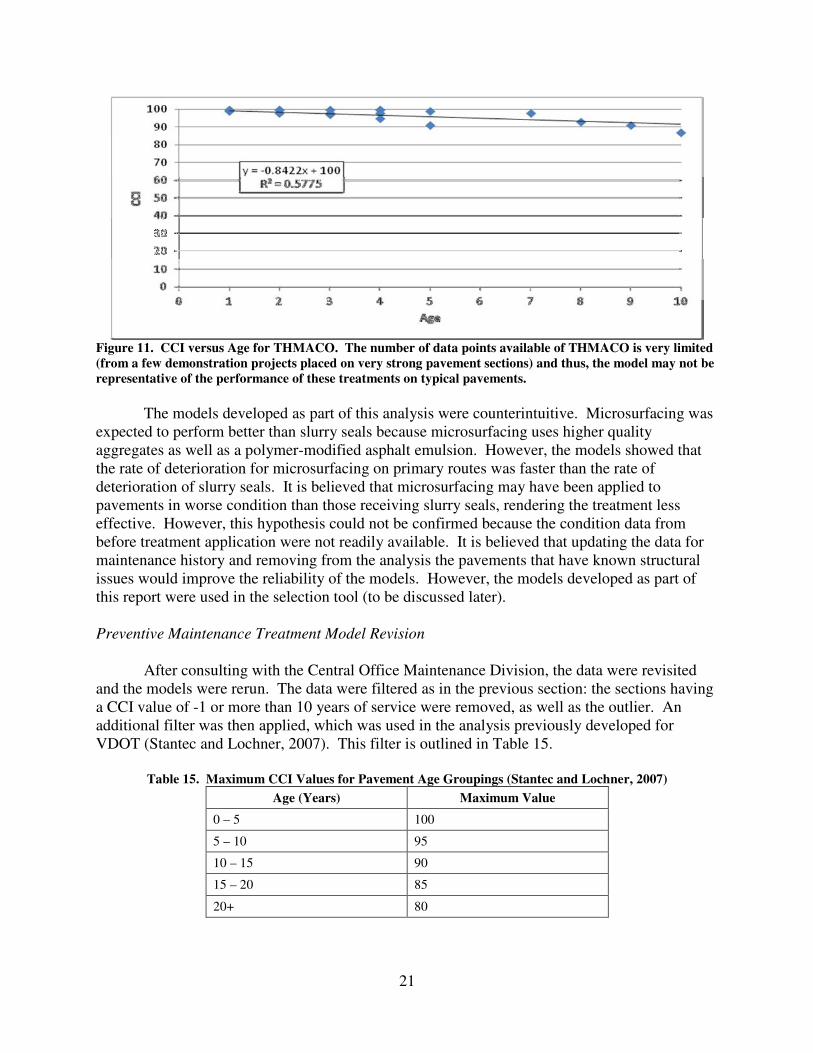
Figure 11. CCI versus Age for THMACO. The number of data points available of THMACO is very limited
(from a few demonstration projects placed on very strong pavement sections) and thus, the model may not be
representative of the performance of these treatments on typical pavements.
The models developed as part of this analysis were counterintuitive. Microsurfacing was
expected to perform better than slurry seals because microsurfacing uses higher quality
aggregates as well as a polymer-modified asphalt emulsion. However, the models showed that
the rate of deterioration for microsurfacing on primary routes was faster than the rate of
deterioration of slurry seals. It is believed that microsurfacing may have been applied to
pavements in worse condition than those receiving slurry seals, rendering the treatment less
effective. However, this hypothesis could not be confirmed because the condition data from
before treatment application were not readily available. It is believed that updating the data for
maintenance history and removing from the analysis the pavements that have known structural
issues would improve the reliability of the models. However, the models developed as part of
this report were used in the selection tool (to be discussed later).
Preventive Maintenance Treatment Model Revision
After consulting with the Central Office Maintenance Division, the data were revisited
and the models were rerun. The data were filtered as in the previous section: the sections having
a CCI value of -1 or more than 10 years of service were removed, as well as the outlier. An
additional filter was then applied, which was used in the analysis previously developed for
VDOT (Stantec and Lochner, 2007). This filter is outlined in Table 15.
Table 15. Maximum CCI Values for Pavement Age Groupings (Stantec and Lochner, 2007)
Age (Years) Maximum Value
0 – 5 100
5 – 10 95
10 – 15 90
15 – 20 85
20+ 80
22
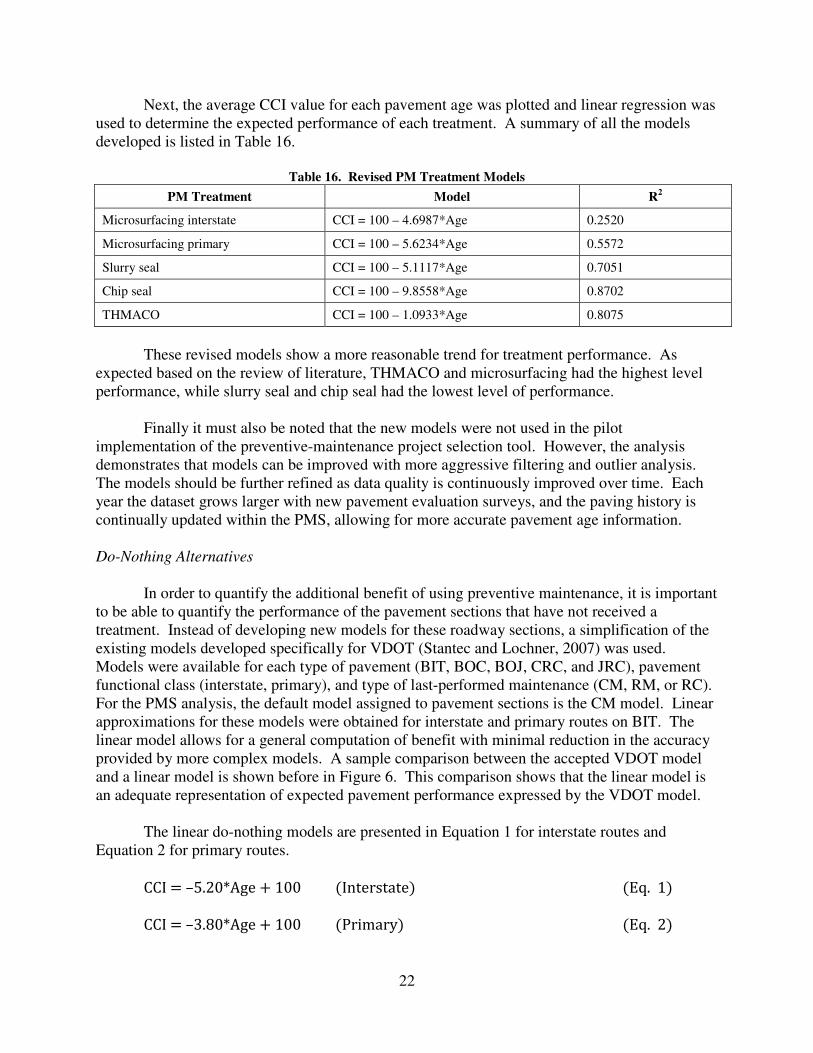
Next, the average CCI value for each pavement age was plotted and linear regression was
used to determine the expected performance of each treatment. A summary of all the models
developed is listed in Table 16.
Table 16. Revised PM Treatment Models
PM Treatment Model R2
Microsurfacing interstate CCI = 100 – 4.6987*Age 0.2520
Microsurfacing primary CCI = 100 – 5.6234*Age 0.5572
Slurry seal CCI = 100 – 5.1117*Age 0.7051
Chip seal CCI = 100 – 9.8558*Age 0.8702
THMACO CCI = 100 – 1.0933*Age 0.8075
These revised models show a more reasonable trend for treatment performance. As
expected based on the review of literature, THMACO and microsurfacing had the highest level
performance, while slurry seal and chip seal had the lowest level of performance.
Finally it must also be noted that the new models were not used in the pilot
implementation of the preventive-maintenance project selection tool. However, the analysis
demonstrates that models can be improved with more aggressive filtering and outlier analysis.
The models should be further refined as data quality is continuously improved over time. Each
year the dataset grows larger with new pavement evaluation surveys, and the paving history is
continually updated within the PMS, allowing for more accurate pavement age information.
Do-Nothing Alternatives
In order to quantify the additional benefit of using preventive maintenance, it is important
to be able to quantify the performance of the pavement sections that have not received a
treatment. Instead of developing new models for these roadway sections, a simplification of the
existing models developed specifically for VDOT (Stantec and Lochner, 2007) was used.
Models were available for each type of pavement (BIT, BOC, BOJ, CRC, and JRC), pavement
functional class (interstate, primary), and type of last-performed maintenance (CM, RM, or RC).
For the PMS analysis, the default model assigned to pavement sections is the CM model. Linear
approximations for these models were obtained for interstate and primary routes on BIT. The
linear model allows for a general computation of benefit with minimal reduction in the accuracy
provided by more complex models. A sample comparison between the accepted VDOT model
and a linear model is shown before in Figure 6. This comparison shows that the linear model is
an adequate representation of expected pavement performance expressed by the VDOT model.
The linear do-nothing models are presented in Equation 1 for interstate routes and
Equation 2 for primary routes.
CCI = –5.20*Age + 100 (Interstate) (Eq. 1)
CCI = –3.80*Age + 100 (Primary) (Eq. 2)

23
Preventive Maintenance Treatment Selection Methodology
Framework for the Treatment Selection Tool
Based on the review of existing practices, an approach combining expected performance,
decision matrix analysis, cost-effectiveness, and heuristics was deemed to be the most beneficial
for implementation of a preventive maintenance policy in Virginia. Multiple levels of analysis
led to the development of a robust decision-making tool. The treatment selection tool was
developed in two parts: (1) feasible treatment identification, and (2) the district-wide selection.
The framework of the treatment selection tool is presented in Figure 12.
Figure 12. Overview of Treatment Selection Tool
Treatment Feasibility
Treatment feasibility is established based on the pavement section’s age, traffic level,
type of network, and distresses used in the VDOT decision matrices: alligator cracking,
transverse cracking, rutting, and patching. The treatment properties, listed in Table 17, were
based on those found in the literature review. The expected treatment life and cost of each
treatment from the most recent SHRP 2 study (Peshkin et al., 2011) are presented in Table 18
along with current unit costs obtained from VDOT.

24
Table 17. Treatment Feasibility Matrix
Treatment Type of
Network
Age Traffic
Level
Alligator
Cracking
Severity
Transverse
Cracking
Severity
Rutting
Severity
Patching
Severity Min Max
Chip Seala Primary 5 8 All 1 1 1 1
Slurry Seala Primary 5 8
Low &
Medium 1 1 -- --
Microsurfacing Primary,
interstate 5 8 All 1 1 1 1
THMACO Primary,
interstate 6 12 All 1, 2 1, 2 1 1
a It was determined that chip seals and slurry seals in general were not appropriate for use on interstate pavements.
Chip seals have an aggregate cover that may become dislodged under high speed traffic (Wade et al., 2001). Slurry
seals are characterized by unpredictable break and cure times (Peshkin et al., 2011), which could translate into
unacceptable extended lane closures.
Table 18. Treatment Life and Estimated Cost (Peshkin et al., 2011)
Treatment Treatment Life
(years)
SHRP 2 Estimated Unit Cost
(per lane-mile)
VDOT Unit Cost
(per lane-mile)
Chip seal 3–7 $10,771.20–$13,939.20 $8,839.00
Slurry seal 3–5 $5,068.80–$6,969.60 $13,376.00
Microsurfacing 3–6 $10,771.20–$20,908.80 $16,620.00
THMACO 5–12 $20,908.80–$42,451.20 $33,077.00
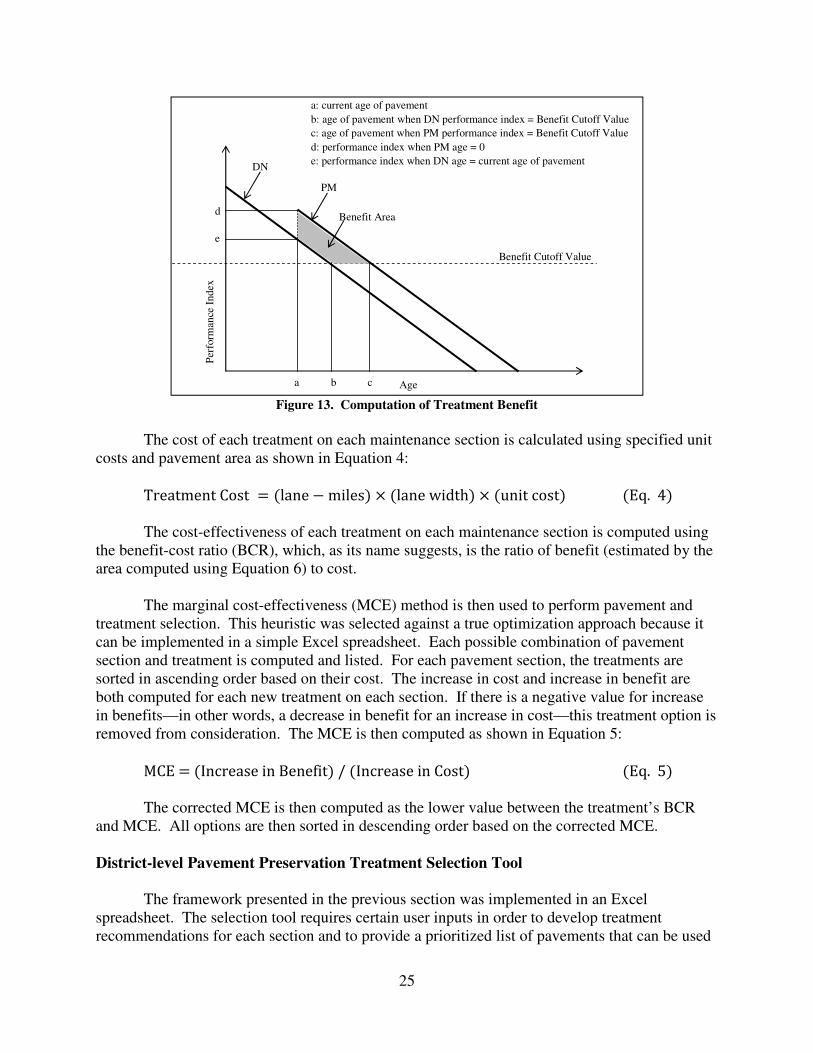
Benefit and Cost Calculations
The benefit of each treatment on each section is calculated as the product of lane-miles
and the area between the DN and PM curves above a specified benefit cutoff value, shown in
Figure 13. This benefit cutoff value was assumed to be 60 based on the VDOT deficient
pavement criterion, which considers pavements with a CCI below 60 to be deficient. The benefit
computation is shown in Equation 3:
�� �!"# = ($% � − '"(�)) × +(,-./)(0-1)2 − (3-./)(4-1)
2 5 (Eq. 3)
25
Figure 13. Computation of Treatment Benefit
The cost of each treatment on each maintenance section is calculated using specified unit
costs and pavement area as shown in Equation 4:
Treatment Cost = (lane − miles) × (lane width) × (unit cost) (Eq. 4)
The cost-effectiveness of each treatment on each maintenance section is computed using
the benefit-cost ratio (BCR), which, as its name suggests, is the ratio of benefit (estimated by the
area computed using Equation 6) to cost.
The marginal cost-effectiveness (MCE) method is then used to perform pavement and
treatment selection. This heuristic was selected against a true optimization approach because it
can be implemented in a simple Excel spreadsheet. Each possible combination of pavement
section and treatment is computed and listed. For each pavement section, the treatments are
sorted in ascending order based on their cost. The increase in cost and increase in benefit are
both computed for each new treatment on each section. If there is a negative value for increase
in benefits—in other words, a decrease in benefit for an increase in cost—this treatment option is
removed from consideration. The MCE is then computed as shown in Equation 5:
MCE = (Increase in Benefit) / (Increase in Cost) (Eq. 5)
The corrected MCE is then computed as the lower value between the treatment’s BCR
and MCE. All options are then sorted in descending order based on the corrected MCE.
District-level Pavement Preservation Treatment Selection Tool
The framework presented in the previous section was implemented in an Excel
spreadsheet. The selection tool requires certain user inputs in order to develop treatment
recommendations for each section and to provide a prioritized list of pavements that can be used
Age
Per
form
ance
Index
Benefit Cutoff Value
DN
PM
a b c
d
e
Benefit Area
a: current age of pavement
b: age of pavement when DN performance index = Benefit Cutoff Value
c: age of pavement when PM performance index = Benefit Cutoff Value
d: performance index when PM age = 0
e: performance index when DN age = current age of pavement

26
by the districts to aid in their maintenance programming. The inputs required for the tool include
the following:
• Estimated performance
Preventive maintenance treatment
Do-nothing
• Current-year condition data
• Cost data
• Central Office recommendations - total preventive maintenance lane-miles and
district budget as derived from PM lane-miles.
The first decision window in the selection tool lets the user address expected
performance. It provides the choice to use default do-nothing models and the developed
treatment performance models (see earlier discussion), or to input new models. As an example,
the model selection window for primary routes is shown in Figure 14.
The current year’s pavement condition is obtained from the PMS for each district.
Eligible candidates for preliminary consideration for preventive maintenance include all
pavements that satisfied the PMS requirements for PM. The results from the PMS decision
matrix analysis are obtained for all sections recommended for PM on BIT pavements. After
exporting these data from the PMS and saving them in a spreadsheet, they are then imported into
the treatment selection tool.
Figure 14. Model Selection Window
The current (default) unit costs for the treatments were presented in Table 15. The
selection tool gives the user the option to input new cost data based on local market prices. This
flexibility is particularly useful because treatment costs vary among districts and over time. The
unit cost input window is shown in Figure 15. This window is automatically populated with
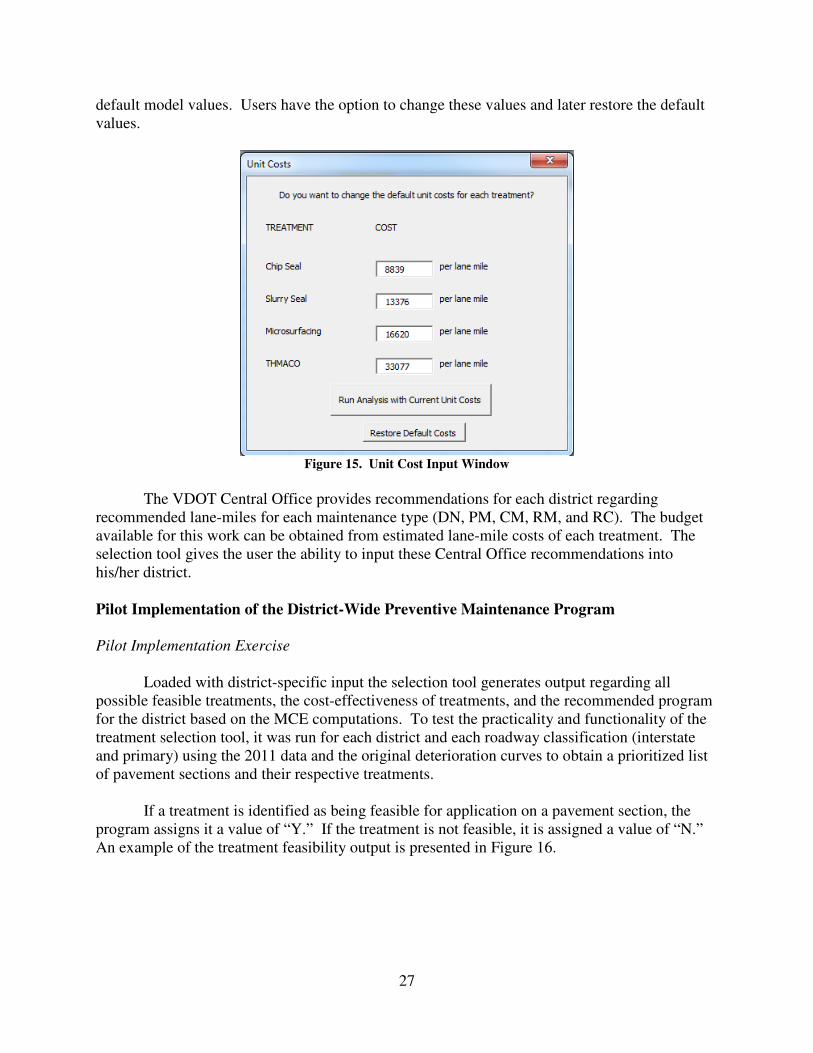
27
default model values. Users have the option to change these values and later restore the default
values.
Figure 15. Unit Cost Input Window
The VDOT Central Office provides recommendations for each district regarding
recommended lane-miles for each maintenance type (DN, PM, CM, RM, and RC). The budget
available for this work can be obtained from estimated lane-mile costs of each treatment. The
selection tool gives the user the ability to input these Central Office recommendations into
his/her district.
Pilot Implementation of the District-Wide Preventive Maintenance Program
Pilot Implementation Exercise
Loaded with district-specific input the selection tool generates output regarding all
possible feasible treatments, the cost-effectiveness of treatments, and the recommended program
for the district based on the MCE computations. To test the practicality and functionality of the
treatment selection tool, it was run for each district and each roadway classification (interstate
and primary) using the 2011 data and the original deterioration curves to obtain a prioritized list
of pavement sections and their respective treatments.
If a treatment is identified as being feasible for application on a pavement section, the
program assigns it a value of “Y.” If the treatment is not feasible, it is assigned a value of “N.”
An example of the treatment feasibility output is presented in Figure 16.

28
Figure 16. Treatment Feasibility
As part of the MCE process, the program then computes the benefit and cost for each
feasible treatment on each pavement section. Each combination of pavement section and
feasible treatment is listed and the treatments sorted in ascending order of cost. The benefit-cost
ratios are computed for each combination, as well as the incremental cost and benefit for each
alternative treatment on each section. Any treatments that result in a higher cost but lower
benefit are removed from consideration for that section. An example of this output is presented
in Figure 17.
The program then computes the MCE as the change in benefit divided by the change in
cost. The corrected MCE is calculated as stated in Equation 6.
MCEcorrected = min (BCR, MCE) (Eq. 6)
The software then sorts the list of pavement and treatment combinations in descending
order of corrected MCE values and selects sections until the allocated budget is exhausted. If an
alternate treatment for a section that is already on the list is triggered as marginally cost-
effective, the treatment previously selected for that section is removed and it is then replaced by
the alternate treatment. An example of this process is presented in Figure 18. The duplicate
column is used to check whether or not the section had a prior treatment recommendation.

29
Figure 17. Benefit-Cost Ratio, Incremental Cost, and Incremental Benefit
Figure 18. Corrected MCE and Cumulative Cost
The pilot implementation of the preventive maintenance treatment selection tool
recommended mainly two treatments: chip seal and THMACO. A review of the developed
models showed that these two treatments have the slowest expected rate of pavement
deterioration when compared to slurry seal and microsurfacing. However, there were also
considerably fewer data points for chip seal and THMACO than for slurry seal and
microsurfacing. The limited sample of pavements that received chip seal and THMACO
treatments responded relatively well to them. The slurry seal and microsurfacing treatments had
a much larger dataset, and there was a high level of variability within the data. Therefore, a
comprehensive data review is recommended to be carried out at the district level before final
implementation of the proposed methodology.
Figures 19 and 20 compare the results of the developed decision-support tool to the
results of the network-level unconstrained analysis as developed in the PMS. Figure 19 shows

30
fewer miles were recommended by the district decision tool than were recommended by
VDOT’s PMS even though Figure 20 suggests similar levels of spending.
Figure 19. Target Lane-Miles and Recommended Lane-Miles by District and Pavement Classification
Figure 20. Target Budget and Recommended Budget by District and Pavement Classification
The difference observed is thought to be due to a difference in the treatment cost used.
The costs used in the treatment-selection tool are the costs of the specific treatments selected,
which may be chip seal, slurry seal, microsurfacing, or THMACO. The expected cost per lane-
mile of the preventive maintenance category is computed at the Central Office as a weighted
average of the lowest bid prices from the previous year, adjusted for inflation. The preventive

31
maintenance treatments most frequently used in Virginia are crack sealing and patching, which
heavily influence unit costs developed by the Central Office. As a result, the weighted estimate
of preventive maintenance cost developed by the Central Office does not reflect the cost of
surface applications as defined in the developed tool.
A comparison of the calculated treatment costs for each pavement section in the analysis
to the expected cost for each treatment based on the PMS computations showed that the cost for
the preventive maintenance category used in the PMS is approximately equal to the cost of chip
seal. For pavements that were assigned THMACO, the calculated treatment costs were
approximately four times higher than the default cost for the preventive maintenance category.
Based on the performance predicted based on the very limited data available, in most cases,
THMACO yielded the highest benefit, so THMACO was assigned to most sections. Since the
cost of a THMACO is almost four times the expected cost of the preventive maintenance
treatment category, only about one quarter of the analysis lane-miles could be selected for
maintenance.
Verification
The results obtained using the MCE method for Bristol interstate routes were compared
to a true optimization method using an integer program outlined in Equations 7 through 10.
Max z = ∑ xibi/ci (Eq. 7) Subject to
∑ xici ≤ p (Eq. 8) ∑ xili ≤ q (Eq. 9) xi = 1 if section i is selected; 0 otherwise (Eq. 10)
where
bi = benefit of section i ci = cost of section i p = recommended budget for PM q = recommended lane-miles for PM.
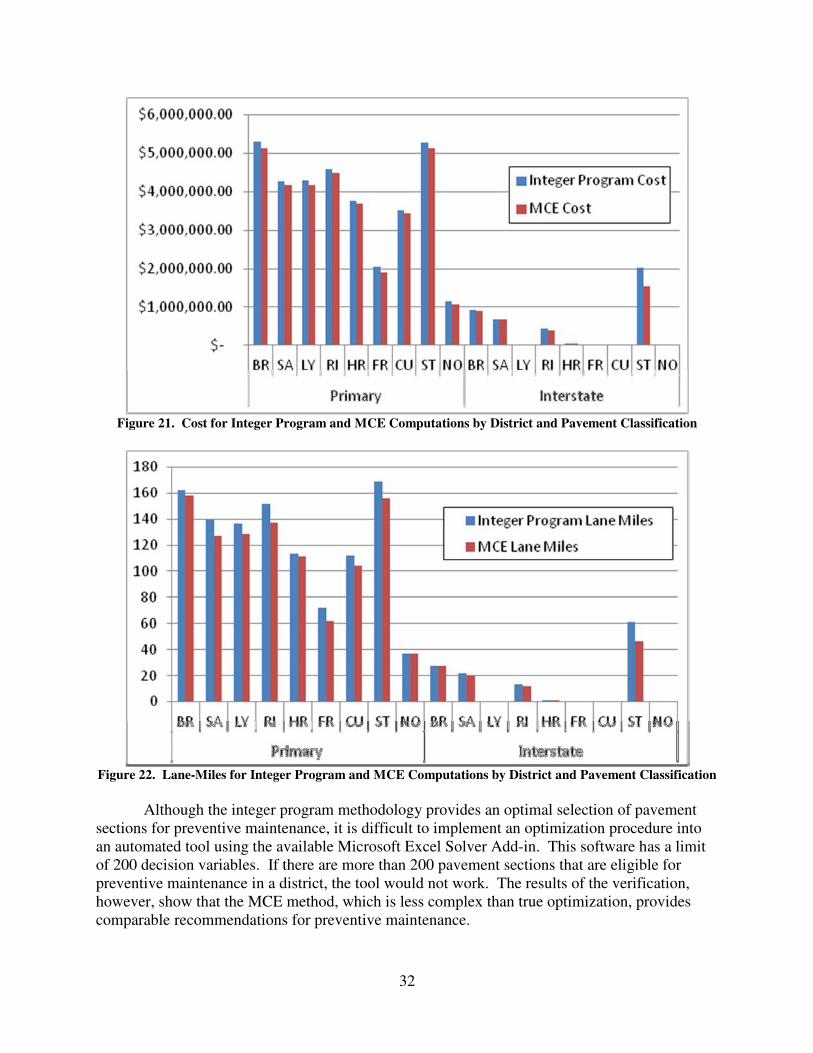
The integer program was set up in Microsoft Excel, and the Solver Add-in was used to
determine an optimal solution. A comparison of the results of the MCE method and the integer
program solution are shown in Figures 21 and 22. The figures show that the total cost of PM
treatments and the respective lane-mile recommendations developed using the simpler heuristic
(MCE method) were marginally lower than the results obtained from the true optimization. In
many cases, instead of selecting one section with a high effectiveness/cost ratio, the optimization
method selects multiple sections, each having a slightly lower effectiveness/cost ratio. The sum
of the effectiveness/cost for the multiple-section-selection exceeds the cost-effectiveness/cost
ratio of the single section. The true optimization method can, therefore, exhaust more of the
budget by selecting sections that may have a lower priority because of their effectiveness/cost
ratio.
32
Figure 21. Cost for Integer Program and MCE Computations by District and Pavement Classification
Figure 22. Lane-Miles for Integer Program and MCE Computations by District and Pavement Classification
Although the integer program methodology provides an optimal selection of pavement
sections for preventive maintenance, it is difficult to implement an optimization procedure into
an automated tool using the available Microsoft Excel Solver Add-in. This software has a limit
of 200 decision variables. If there are more than 200 pavement sections that are eligible for
preventive maintenance in a district, the tool would not work. The results of the verification,
however, show that the MCE method, which is less complex than true optimization, provides
comparable recommendations for preventive maintenance.

33
The treatment selection tool outlined in this section is a useful decision support tool that
can be immediately implemented in the Virginia maintenance districts. As part of this project, a
quick reference guide was prepared for use at the district level to facilitate the execution of the
list of pavements that satisfy VDOT requirements for application of preventive maintenance
from the PMS. District personnel can use the tool to identify feasible preventive maintenance
treatments for each section included in the PMS list that satisfy VDOT requirements for
application of preventive maintenance. The treatment feasibility capability of the tool is
particularly important because it would provide consistent recommendations across the state for
inputs such as pavement age, traffic level, and distress type and severity. As preventive
maintenance treatment performance is monitored over time, the models can be updated. The
final pavement section selections made by the developed tool can then be improved by updating
the expected treatment performance specific to each district.
SUMMARY AND DISCUSSION
Preventive maintenance retards future deterioration of the pavement by sealing the
pavement’s surface and preventing the infiltration of water into the pavement structure.
Preventive maintenance keeps good pavements in good condition, and since these treatments are
relatively cheap when compared to traditional rehabilitation methods, they can lower the total
cost of maintenance while maintaining or even improving pavement condition or a road network.
This project reviewed current and recommended practices for selecting pavement
preservation projects and developed a district-level treatment selection tool designed to facilitate
the district-level decision-making process. The tool (1) identifies treatment feasibility for each
pavement section; (2) assigns the most cost-effective feasible treatment to each pavement
section; (3) generates a prioritized list of pavement sections; and (4) selects the projects that
maximizes the effectiveness/cost of the selected treatments subject to budgetary and lane-mile
constraints set by the Central Office.
The review of current practice and available data showed the following:
• VDOT uses its PMS to perform network analysis to determine maintenance targets
for each district, including maintenance type, lane-miles to be maintained, and budget
for each maintenance type. The districts then use these recommendations to select the
pavements that will receive maintenance and the types of treatments that will be
applied to each pavement section.
• VDOT has implemented a maintenance category selection methodology involving
decision trees and decision matrices. Though helpful, this methodology provides
only general maintenance categories such as DN, PM, CM, RM, and RC, but it does
not suggest specific treatments to be applied to pavement sections.

34
• A comparison of the practices in three districts showed that they used different
criteria to decide which pavements received preventive maintenance and which
preventive maintenance treatments were applied.
• Preventive maintenance treatments currently being used within Virginia include chip
seal, slurry seal, microsurfacing, and THMACO. Historical pavement condition data
were obtained from VDOT’s PMS for these treatments, and treatment performance
models were developed. An outlier analysis was performed to remove anomalies
within the data, such as CCI values that were too low or too high.
• In the initial and revised development of the treatment performance models, it was
found that THMACO had the highest expected performance of the four treatments.
This treatment had an exceptionally high level of performance; however, this
unusually high performance may be at least partially attributed to the small sample
size of this dataset. It is believed that this model, when revisited over time, would
become more reasonable and show a faster deterioration rate.
A pilot application of the district-level preventive maintenance project selection tool
suggested the following:
• The treatments recommended for application were mainly THMACO and chip seal.
It is believed that the high expected performance of THMACO and chip seal as well
as the low expected performance of slurry seal and microsurfacing as developed
created a bias in favor of selection of THMACO and chip seal.
• The heuristic used for selection of the project produced similar results to a “true-
optimization” during the limited verification trials.
CONCLUSIONS
• This project presents recommendations for implementation of a preventive maintenance
policy based on best-practice guidelines that can be used by VDOT maintenance districts.
Data from VDOT’s PMS were used to develop treatment performance curves for each of the
four treatments (microsurfacing, slurry seal, chip seal, and THMACO).
• The recommended preventive maintenance policy was used to develop a district-level
pavement preventive maintenance treatment selection tool, which can be used by the district
maintenance personnel for optimizing treatment selection. This tool determines the near-
optimal treatment selection for each pavement maintenance section and provides a prioritized
list of pavements to receive these treatments.
35
RECOMMENDATIONS
Implementation Recommendations
1. VDOT’s Maintenance Division should continue to avoid a “worst first” approach. When
feasible, preventive maintenance should be used to complement major rehabilitation and
establish a balance: fix the roads that are in dire need of repair while preventing good roads
from deteriorating to that point.
2. VDOT’s maintenance districts, with support from VDOT’s Maintenance Division, should
start using the district-level pavement preservation treatment selection tool to support the
preventive maintenance resource allocation process. A pilot implementation in two or three
districts could help fine tune the tools and develop additional implementation guidance. The
use of a common tool will also help develop more consistent criteria for determining
treatment feasibility across Virginia. The most recent district-specific cost and performance
data should be used to enhance the cost and effectiveness estimations.
3. VDOT Materials Division should work with VDOT’s Maintenance District and the Virginia
Center for Transportation Innovation and Research (VCTIR) to develop a “pocket guide”
that is modeled after the treatment selection tool for use at the district level. Although a
paper pocket guide is an appropriate first step, developers should consider the functional
advantages of a Smartphone app that would supply the same service. The app tool would
also facilitate the distribution of guide updates.
Recommendations for Future Research
Although the model was proven practical by the pilot implementation, there are several
possible improvements. These include (1) implementing an optimization procedure independent
of the Microsoft Excel Solver Add-in using Visual Basic to avoid limits on the number of
decision variables within the tool; and (2) incorporating continuity constraints (grouping of
projects) in project-level selection for construction considerations.
BENEFITS AND IMPLEMENTATION
Benefits
The review of the literature showed that there are significant tangible benefits of
integrating an effective preventive maintenance program into the pavement / asset management
toolkit. The benefits of keeping the good roads in good condition by applying “low-cost”
preventive treatments frequently to extend the life of the pavements can be significant.
However, not all VDOT districts are taking full advantage of a pavement preventive maintenance
strategy. The implementation of the approaches and tools developed as part of this study can
help accelerate the adoption of consistent statewide pavement preservations policies. This will
36
help provide a better service to the traveling public by helping the pavement managers make the
best use of the available pavement maintenance resources.
Implementation
The development of the district-level pavement preservation treatment selection tool as a
simple Excel spreadsheet should facilitate its adoption, as spreadsheets are routinely used by the
district personnel. A pilot implementation effort in two or three districts is anticipated for fall
2015, followed by focused and effective statewide training and full deployment in spring 2016.
Training and any ongoing support will be administered through the Pavement Management
Office of the Central Office Maintenance Division.
Development of the pocket guide, which will involve engineers from VDOT’s
Maintenance Division, VDOT’s Materials Division, and VCTIR will commence immediately. A
draft paper guide is anticipated by late summer 2015. Further development (i.e., Smartphone app
development) is anticipated should adoption and use of the paper guide suggest. VDOT’s
Central Office Maintenance Division will make that determination and work with other divisions
(e.g., Materials, VCTIR, IT Applications) as/if required.
ACKNOWLEDGMENTS
The project team acknowledges the significant contribution of the members of the
technical research panel throughout the development of the project. Their guidance and
feedback was instrumental in the completion of the project.
REFERENCES
Agile Assets. Tutorial: PMS Users- Tutorial on Using the Agile Pavement Manager. Virginia
Department of Transportation, Richmond, 2012.
Alkins, A., Lane, B., and Kazmierowski, T. Sustainable Pavements: Environmental, Economic,
and Social Benefits of In Situ Pavement Recycling. In Transportation Research Record:
Journal of the Transportation Research Board, No. 2084. Transportation Research
Board of the National Academies, Washington, DC, 2008, pp. 100-103.
Chan, S., Lane, B., Kazmierowski, T., and Lee, W. Pavement Preservation: A Solution for
Sustainability. In Transportation Research Record: Journal of the Transportation
Research Board, No. 2235. Transportation Research Board of the National Academies,
Washington, DC, 2011, pp. 36-42.
37
Chowdhury, T. Supporting Document for the Development and Enhancement of the Pavement
Maintenance Decision Matrices Used in the Needs-Based Analysis. Virginia Department
of Transportation, Richmond, 2008.
COLAS Preservation Solutions. Pavement Preservation, 2013.
http://www.colassolutions.com/preservation.html. Accessed November 5, 2013.
Geiger, D.R. Pavement Preservation Definitions, 2005.
http://www.fhwa.dot.gov/pavement/preservation/091205.cfm. Accessed July 17, 2012.
Heltzel, E. State of the Pavement 2010. Virginia Department of Transportation, Richmond.
Hicks, R., Moulthrop, J., and Daleiden, J. Selecting a Preventive Maintenance Treatment for
Flexible Pavements. In Transportation Research Record: Journal of the Transportation
Research Board, No. 1680. Transportation Research Board of the National Academies,
Washington, DC, 1999, pp. 1-12.
McGhee, K.H. Development and Implementation of Pavement Condition Indices for the
Virginia Department of Transportation: Phase I: Flexible Pavement. Virginia
Department of Transportation, Richmond, 2002.
Peshkin, D.G., Hoerner, T.E., and Zimmerman, K.A. Optimal Timing of Pavement Preventive
Maintenance Treatment Applications. NCHRP Report 523. Transportation Research
Board, Washington, DC, 2003.
Peshkin, D.G., Hoerner, T.E., and Zimmerman, K.A. Optimal Timing of Pavement Preventive
Maintenance Treatment Applications. Transportation Research Board, Washington, DC,
2004.
Peshkin, D.G., and Hoerner, T.E. Pavement Preservation: Practices, Research Plans, and
Initiatives. NCHRP Project No. 20-07, Task 184. Transportation Research Board,
Washington, DC, 2005.
Peshkin, D., Smith, K.L., Wolters, A., Krstulovich, J., Moulthrop, J., and Alvarado, C.
Guidelines for the Preservation of High-Traffic-Volume Roadways. SHRP 2 Report S2-
R26-RR-2. Transportation Research Board, Washington, DC, 2011.
Smith, K.L., and Peshkin, D.G. Pavement Preservation on High-Traffic-Volume Roadways. In
Transportation Research Record: Journal of the Transportation Research Board, No.
2235. Transportation Research Board of the National Academies, Washington, DC,
2011, pp. 54-65.
Stantec Consulting Services Inc. and H.W. Lochner Inc. Development of Performance
Prediction Models for Virginia Department of Transportation. Virginia Department of
Transportation, Richmond, 2007.

38
Virginia Department of Transportation. Salem District, 2012a.
http://www.virginiadot.org/about/salem_quick.asp. Accessed November 5, 2013.
Virginia Department of Transportation. Richmond District, 2012b.
http://www.virginiadot.org/about/richmond_quick.asp. Accessed November 5, 2013.
Virginia Department of Transportation. Northern Virginia District, 2012c.
http://www.virginiadot.org/about/nova_quick.asp. Accessed November 5, 2013.
Wade, M., DeSombre, R., and Peshkin, D., High Volume/ High Speed Asphalt Roadway
Preventive Maintenance Treatments. South Dakota Department of Transportation,
Pierre, 2001.
Walker, J. Senate Panel Approves Roads Bill. The Roanoke Times, February 2, 2011.
www.roanoke.com/politics/wb/275692. Accessed February 14, 2011.
Zaniewski, J., and Mamlouk, M. Pavement Preventive Maintenance: Key to Quality Highways.
In Transportation Research Record: Journal of the Transportation Research Board, No.
1680. Transportation Research Board of the National Academies, Washington, DC,
1999, pp. 26-29.
Zietsman, J. Guidebook for Sustainability Performance Measurement for Transportation
Agencies. Transportation Research Board of the National Academies, Washington, DC,
2011.
Zimmerman, K., and Peshkin, D. Pavement Management Perspective on Integrating Preventive
Maintenance Into a Pavement Management System. In Transportation Research Record:
Journal of the Transportation Research Board, No. 1827. Transportation Research
Board of the National Academies, Washington, DC, 2003, pp. 3-9.
39
APPENDIX
LITERATURE REVIEW
Background
Preventive maintenance, which is the focus of this report, can be defined as “a planned
strategy of cost-effective treatments applied to an existing roadway system and its appurtenances
that preserves the system, retards future deterioration, and maintains or improves the functional
condition of the system (without increasing its structural capacity)” (Peshkin and Hoerner, 2005).
Benefits of Preventive Maintenance
Preventive maintenance is generally applied to address environmentally related
distresses. Renewal of the pavement surface provides waterproofing as well as replacement of
volatile components lost due environmental conditions. Furthermore, if pavement distresses are
related to structural deficiencies within the pavement, preventive maintenance should not be
applied (Johnson, 2000).
When compared to conventional pavement maintenance methods, preventive
maintenance treatments are typically thinner, easier to construct with less traffic disruption, and
are more cost-effective (Wade et al., 2001).
Although preventive maintenance applied to structurally deficient pavements can delay
necessary rehabilitation for a short period of time, these treatments are not cost-effective in the
long term. When there is a backlog of pavements that need major rehabilitation, agencies must
work to find a balance between improving these poor-condition pavements while preventing
pavements in good condition from deteriorating to the point where preventive maintenance
treatments are no longer effective (AASHTO, 2001).
Preventive maintenance has numerous potential benefits, including improved user
satisfaction, significant savings in cost, extension of life, and increased safety. The Michigan
Department of Transportation has been able to show that implementation of preventive
maintenance strategies optimizes network condition, resulting in greater stability in funding
needs (Johnson, 2000).
Description of Common Preventive Maintenance Activities
Crack Seals
Crack seals are defined as the placement of an adhesive material into or over working
cracks for the main purpose of preventing the infiltration of moisture into the pavement (Peshkin,

40
et al., 2011). An illustration of the two types of crack seal application, flush and overband, is
shown in Figure A-1.
Crack seals can be applied to structural cracks. Although it provides no structural
benefit, it keeps moisture out of the pavement, slowing the progression of load-related distresses.
If crack seals are improperly installed, the sealant material may fail. Overband applications of
the crack seal are susceptible to snow plow damage (Peshkin et al., 2011).
Flush fill
Overband fill
Figure A-1. Crack Seal
Crack seals should be placed when the pavement’s condition index falls within the range
of 80 to 95 and the pavement is between 2 to 5 years old. It is highly recommended to be used
on urban and rural roads, regardless of traffic level. It is highly recommended for overnight or
single-shift work zone durations (Peshkin et al., 2011).
Chip Seals
Chip seals are commonly referred to as surface treatments and are used to improve
friction and seal pavements that have non-load-related cracking (Wade et al., 2001). A chip seal
may be defined as a sprayed application of asphalt followed by the application of aggregate chips
that are immediately rolled to achieve 50% to 70% embedment. A chip seal may be applied in a
single layer or a double layer, where a layer of large aggregate is placed first, followed by a layer
of smaller aggregate (Peshkin et al., 2011). An illustration of a chip seal is shown in Figure A-2.
Figure A-2. Chip Seal
Pavement condition is an important consideration when placing the chip seal. Single- or
double-course chip seals should typically be placed when the pavement’s condition index falls
within the range of 70 to 85 and the pavement is between 5 to 8 years old. It is generally
recommended to be used on high-traffic ADT rural roads (>5,000 vpd) or urban roads
S
Pave
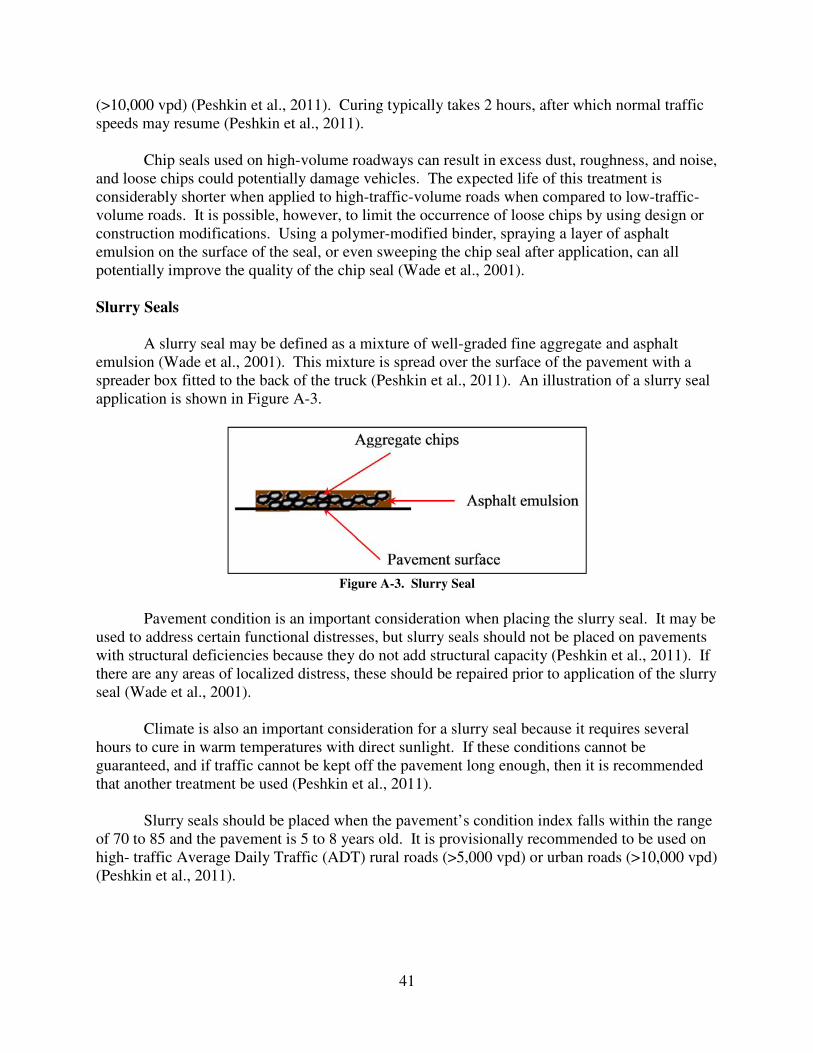
41
(>10,000 vpd) (Peshkin et al., 2011). Curing typically takes 2 hours, after which normal traffic
speeds may resume (Peshkin et al., 2011).
Chip seals used on high-volume roadways can result in excess dust, roughness, and noise,
and loose chips could potentially damage vehicles. The expected life of this treatment is
considerably shorter when applied to high-traffic-volume roads when compared to low-traffic-
volume roads. It is possible, however, to limit the occurrence of loose chips by using design or
construction modifications. Using a polymer-modified binder, spraying a layer of asphalt
emulsion on the surface of the seal, or even sweeping the chip seal after application, can all
potentially improve the quality of the chip seal (Wade et al., 2001).
Slurry Seals
A slurry seal may be defined as a mixture of well-graded fine aggregate and asphalt
emulsion (Wade et al., 2001). This mixture is spread over the surface of the pavement with a
spreader box fitted to the back of the truck (Peshkin et al., 2011). An illustration of a slurry seal
application is shown in Figure A-3.
Figure A-3. Slurry Seal
Pavement condition is an important consideration when placing the slurry seal. It may be
used to address certain functional distresses, but slurry seals should not be placed on pavements
with structural deficiencies because they do not add structural capacity (Peshkin et al., 2011). If
there are any areas of localized distress, these should be repaired prior to application of the slurry
seal (Wade et al., 2001).
Climate is also an important consideration for a slurry seal because it requires several
hours to cure in warm temperatures with direct sunlight. If these conditions cannot be
guaranteed, and if traffic cannot be kept off the pavement long enough, then it is recommended
that another treatment be used (Peshkin et al., 2011).
Slurry seals should be placed when the pavement’s condition index falls within the range
of 70 to 85 and the pavement is 5 to 8 years old. It is provisionally recommended to be used on
high- traffic Average Daily Traffic (ADT) rural roads (>5,000 vpd) or urban roads (>10,000 vpd)
(Peshkin et al., 2011).

42
Microsurfacing
Microsurfacing is a mixture of crushed, well-graded aggregate, mineral filler, and latex-
modified asphalt that is placed on the pavement surface with a squeegee or spreader box
(Peshkin et al., 2011). Microsurfacing is similar to a slurry seal; however, the binder is polymer-
modified and there are higher quality aggregates (Wade et al., 2001). Microsurfacing can be
placed in a single or double application. The double application involves a rut-filling application
followed by a full-surface application (Peshkin, et al., 2011).
Single- or double-course microsurfacing should be placed when the pavement’s condition
index falls within the range of 70 to 85 and the pavement is 5 to 8 years old. It is generally
recommended to be used on high-traffic ADT rural roads (>5,000 vpd) or urban roads
(>10,000 vpd) (Peshkin et al., 2011).
Microsurfacing is widely accepted for use on high-traffic-volume roadways (Wade et al.,
2001). There is minimal disruption to traffic because curing typically takes 1 hour, after which
traffic may resume (Peshkin et al., 2011).
Cape Seal
A cape seal is a combination of a chip seal and a slurry seal. The slurry seal is placed
above the chip seal approximately 4 to 10 days after the initial chip seal application. The cape
seal is used for the same purpose as a chip seal; however, the slurry seal extends the life of the
chip seal because it forms a protective layer over it that improves the binding of the aggregate
chips (Peshkin et al., 2011).
Ultra-Thin Friction Course
This treatment is also known as an ultra-thin bonded wearing course. It consists of a gap-
graded, polymer-modified HMA layer (approximately 0.4” to 0.8” thick) placed on a tack coat
(Peshkin et al., 2011). A gap-graded aggregate consists of coarse grades and fine grades of
aggregate without any medium grades, hence the “gap” in the grading (Wade et al., 2001). An
illustration, adapted from Wade et al. (2001), of a gap-graded aggregate is shown in Figure A-4a.
An ultra-thin friction course should be placed when the pavement’s condition index falls
within the range of 65 to 85 and the pavement is 5 to 10 years old. It is generally recommended
to be used on high-traffic ADT rural roads (>5,000 vpd) or urban roads (>10,000 vpd). It is
highly recommended for overnight or single-shift work zone durations (Peshkin et al., 2011).
Thin Hot Mix Asphalt Concrete Overlays (THMACO) and Ultra-Thin HMACO
These overlays are composed of asphalt binder and aggregate combined in a paving
machine and laid on an existing pavement (milled or unmilled). These overlays can be gap
graded, dense graded, or open graded (Wade et al., 2001). Open-graded aggregates
predominantly consist of aggregates of the same size, as shown in Figure A-4b. Dense-graded
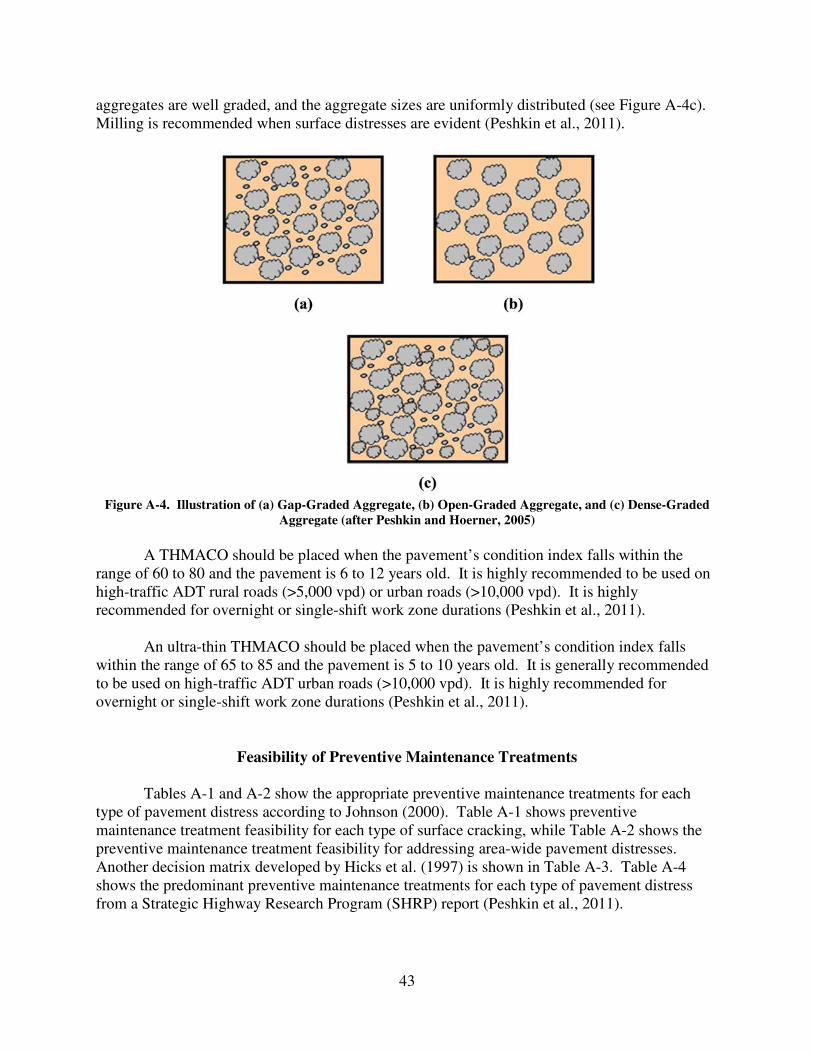
43
aggregates are well graded, and the aggregate sizes are uniformly distributed (see Figure A-4c).
Milling is recommended when surface distresses are evident (Peshkin et al., 2011).
Figure A-4. Illustration of (a) Gap-Graded Aggregate, (b) Open-Graded Aggregate, and (c) Dense-Graded
Aggregate (after Peshkin and Hoerner, 2005)
A THMACO should be placed when the pavement’s condition index falls within the
range of 60 to 80 and the pavement is 6 to 12 years old. It is highly recommended to be used on
high-traffic ADT rural roads (>5,000 vpd) or urban roads (>10,000 vpd). It is highly
recommended for overnight or single-shift work zone durations (Peshkin et al., 2011).
An ultra-thin THMACO should be placed when the pavement’s condition index falls
within the range of 65 to 85 and the pavement is 5 to 10 years old. It is generally recommended
to be used on high-traffic ADT urban roads (>10,000 vpd). It is highly recommended for
overnight or single-shift work zone durations (Peshkin et al., 2011).
Feasibility of Preventive Maintenance Treatments
Tables A-1 and A-2 show the appropriate preventive maintenance treatments for each
type of pavement distress according to Johnson (2000). Table A-1 shows preventive
maintenance treatment feasibility for each type of surface cracking, while Table A-2 shows the
preventive maintenance treatment feasibility for addressing area-wide pavement distresses.
Another decision matrix developed by Hicks et al. (1997) is shown in Table A-3. Table A-4
shows the predominant preventive maintenance treatments for each type of pavement distress
from a Strategic Highway Research Program (SHRP) report (Peshkin et al., 2011).

44
Table A-1. Feasible Treatments for Cracks (Johnson, 2000)
Crack Type Severity Treatment
Crack Filling Patching Chip Seal Thin Overlay
Alligator
Low �
Medium �
High �
Transverse
Low �
Medium � �
High � � �
Longitudinal
Low �
Medium �
High � �
Block
Low �
Medium � �
High � � �
Reflective
Low
Medium �
High � � �
Table A-2. Feasible Treatments for Surface Distresses (Johnson, 2000)
Distress Type Severity Treatment
Double Chip Seal Slurry Seal Microsurfacing Thin Overlay
Rutting
Low � �
Medium � � �
High � �
Bleeding
Low � � �
Medium � � �
High � � � �
Polishing
Low � � �
Medium � � � �
High � � � �
Raveling
Low
Medium
High � � � �
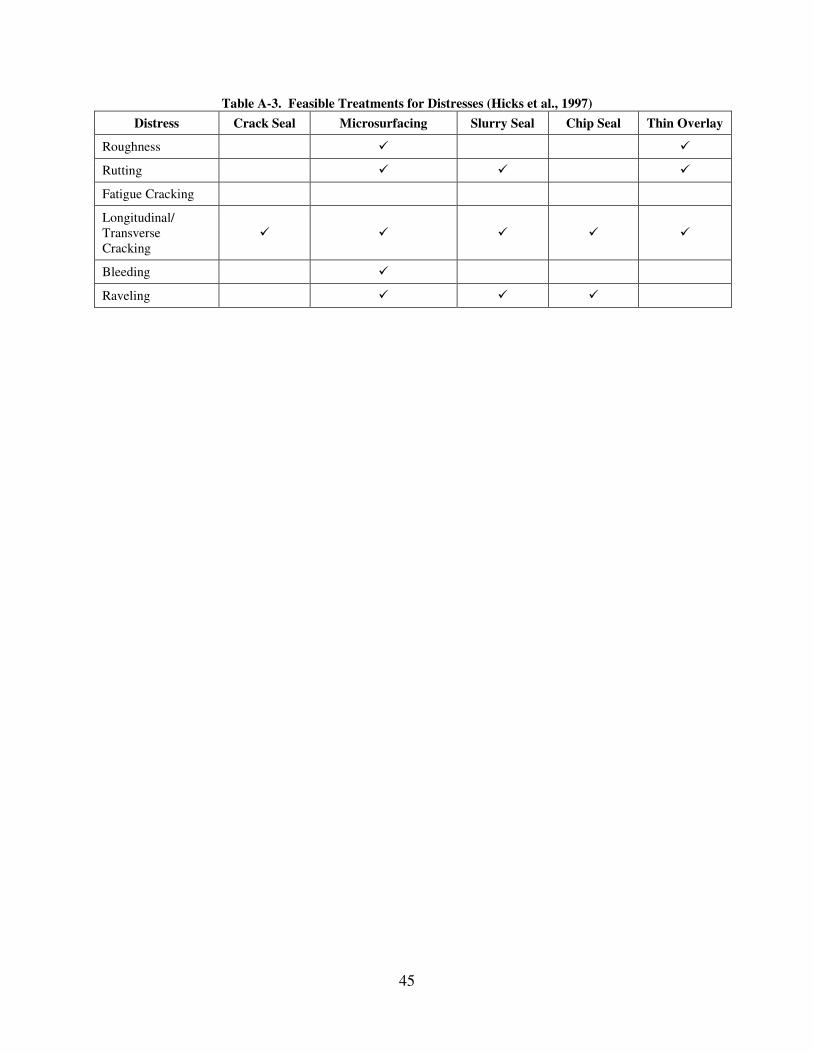
45
Table A-3. Feasible Treatments for Distresses (Hicks et al., 1997)
Distress Crack Seal Microsurfacing Slurry Seal Chip Seal Thin Overlay
Roughness � �
Rutting � � �
Fatigue Cracking
Longitudinal/
Transverse
Cracking
� � � � �
Bleeding �
Raveling � � �

46
Table A-4. Treatment Feasibility Matrix for Cracking Distresses (after Peshkin et al., 2011)
Distress
Fa
tig
ue/
Lo
ng
Wh
eel
Pa
th/
Sli
pp
age
Blo
ck
Tra
nsv
erse
Th
erm
al
Join
t R
efle
ctiv
e
Lo
ng/
Ed
ge
Ra
vel
ing/
Wea
ther
ing
Ble
edin
g/
Flu
shin
g
Po
lish
ing
Seg
reg
ati
on
Wa
ter
Ble
edin
g/
Pu
mp
ing
Wea
r/ S
tab
le
Ru
ttin
g
Pa
tch
ing
Rid
e Q
ua
lity
Fri
ctio
n
No
ise
L M H L M H L M H L M H L M H L M H L M H L M H L M H
Crack Fill � � � � � � � � � � �
Crack Seal � � � � � � � � � � �
Slurry Seal � � � � � � � � � � � � � � � � � � � � � � � � �
Microsurfacing:
Single � � � � � � � � � � � � � � � � � � � � � � � �
Microsurfacing:
Double � � � � � � � � � � � � � � � � � � � � � � � �
Chip Seal:
Single
Conventional � � � � � � � � � � � � � � � � � � � � � � �
Chip Seal:
Single Polymer
Modified � � � � � � � � � � � � � � � � � � � � � � � � �
Chip Seal: Double
Conventional � � � � � � � � � � � � � � � � � � � � � � � � � � � �
Chip Seal:
Double Polymer
Modified � � � � � � � � � � � � � � � � � � � � � � � � �
Ultra-thin
Friction Course � � � � � � � � � � � � � � � � � � � � � � � �
Ultra-thin HMA
Overlay � � � � � � � � � � � � � � � � � � � � � � � � � � �
Thin HMA
Overlay � � � � � � � � � � � � � � � � � � � � � � � � � � � �
Thin HMA O/L & cold milling
� � � � � � � � � � � � � � � � � � � � � � � � �
Notes: HMA = hot-mix asphalt, O/L = overlay

47
According to Peshkin et al. (2011), the expected treatment life, life extension, and unit
costs of preventive maintenance treatments are summarized in Table 5A. The treatment life
estimates how long the treatment would last on the pavement. The life extension estimates the
time it takes for the pavement to return to its current condition after application of the treatment.
Table 5A .Expected Performance and Cost of Preventive Maintenance Treatments (Peshkin et al., 2011)
Treatment Expected Performance
Estimated
Unit
Cost Treatment
Life
(years)
Life
Extension
(years)
1. Crack filling (non-working cracks) 2-4 N/A $0.10-$1.20/ft.
2. Crack sealing (working cracks) 3-8 2-5 $0.75-$1.50/ft.
3. Slurry Seal 3-5 4-5 $0.75-$1.00/yd2
4. Microsurfacing Single Double
3-6 4-7
3-5 4-6
$1.50-$3.00/yd
2
5. Chip seal Single (conventional, polymer modified) Double
3-7 5-10
5-6 8-10
$1.50-$2.00/yd
2 $2.00-$4.00/yd
2
6. Ultra-thin friction course 0.4” – 0.80” 7-12 N/A $4.00-$6.00/yd2
7. Ultra-thin HMA overlay 0.625” – 0.75” 4-8 N/A $2.00-$3.00/yd2
8. Thin HMA O/L 0.875” – 1.50” Dense Graded Open Graded (OGFC) Gap Graded (SMA)
5-12 N/A $3.00-$6.00/yd2
9. Thin HMA O/L & cold milling 5-12 N/A $5.00-$10.00/yd2
HMA = Hot-mix Asphalt, O/L = Overlay, N/A = Not Applicable.
Factors Affecting Treatment Selection
There are many factors that affect preventive maintenance treatment selection specific to
high traffic volume roadways outlined in the Strategic Highway Research Program (SHRP) 2
report: Guidelines for the Preservation of High-Traffic-Volume Roadways. These factors
include: traffic, pavement condition, climate, work zone restrictions, expected performance, and
cost (Peshkin et al., 2011).
Traffic level affects treatment selection in two ways. First, traffic levels measure the load
carried by a roadway, which affect present pavement condition and expected treatment
performance. Second, traffic levels can limit the accessibility of a roadway for treatment

48
applications: the higher the traffic volume, the less accessible that roadway is to maintenance
activities. Traffic may also have indirect considerations based upon risk: agencies are less likely
to try new treatments that may not have a long treatment life or those whose failure may have
adverse consequences (Peshkin et al., 2011).
Pavement condition is important to consider for treatment selection. Overall pavement
condition as well as individual distress types can affect treatment selection. Preventive
maintenance should be applied when pavements are in good condition. Additionally, there are
certain distress types that can be addressed by preventive maintenance; however, there are some
distress types for which preventive maintenance provides minimal benefit (Peshkin et al., 2011).
Climate affects treatment selection in two ways. First, climate can affect the expected
performance of a treatment. Second, climate can affect treatment timing. Climate can affect the
curing time of certain preventive maintenance treatments. Treatments such as slurry seals
require warmer temperatures to cure effectively, so this treatment should not be applied in cold
weather because roadways would have to be closed to traffic for a relatively long time (Peshkin
et al., 2011).
Work zone restrictions include factors such as the time available for treatment
application. Most preventive maintenance treatment applications were possible during overnight
or single-shift applications, minimizing the negative effects of lane closures (Peshkin et al.,
2011).
Application Timing of Preventive Maintenance Treatments
National Co-Operative Highway Research Program (NCHRP) report number 523
highlights the trend of highway agencies adopting preventive maintenance policies instead of a
typical worst-first approach. This document outlines a procedure for determining the optimal
timing of preventive maintenance (Peshkin et al., 2004).
If a maintenance treatment is applied too early or too late in a pavement’s life, that
treatment provides little benefit. Benefit, in this case, is defined as the difference in condition
between a pavement that receives a treatment and that same pavement if no treatment was
applied. Furthermore, the optimal timing of a maintenance treatment occurs not only when the
greatest benefit is achieved, but when the greatest benefit is achieved at the lowest cost. As such,
cost-effectiveness was incorporated into the methodology as a benefit-cost ratio in the NCHRP
study (Peshkin et al., 2004).
The first input identified in the methodology was condition indicators. These measure
pavement performance and can be monitored over time, and their value typically changes after a
maintenance treatment is applied. Do-nothing relationships were also identified as a major input
because the benefit of a treatment is computed as the improvement in condition over time. The
Do-nothing relationships provide a baseline from which benefit may be calculated. Post-
treatment relationships also needed to be developed so that the increase in pavement
performance due to treatment application could be estimated. Cost inputs are also an integral
part of the methodology because they allow the treatment’s cost-effectiveness to be evaluated.

49
Different types of costs were identified in the methodology, such as preventive maintenance
treatment costs, rehabilitation costs, and user delay costs.
The optimal timing of treatment application was determined using the application timing
with the largest benefit-cost ratio. To provide a more meaningful scale of cost-effectiveness, the
Effectiveness Index (EI) was developed. The EI normalizes the benefit-cost ratios to a scale
from 0 to 100 by comparing all benefit-cost ratios to the highest individual benefit-cost ratio.
The application timing with the highest EI is selected as the optimal timing of that treatment.
Expected service lives of the do-nothing case and the post-treatment case are both computed to
determine the expected extension in pavement life. The service life would be the pavement age
that corresponds to the point where the pavement reaches the benefit cutoff value. These benefit
cutoff values can vary between agencies and are typically identified based on agency policies
(Peshkin et al., 2004). The methodology outlined in this study was integrated into a macro-
enhanced Microsoft Excel spreadsheet called “OPTime,” which is available through the NCHRP
website (NCHRP, 2013).
The methodology developed in the NCHRP study was validated using four different case
studies: Arizona, Kansas, Michigan, and North Carolina. In the Arizona case study, it was found
that the optimal age for application of a seal coat on an HMA pavement was 13 years. In the
Kansas case study, it was found that the optimal age for application of routing and crack sealing
on an HMA pavement was 11 years.
In the Michigan case study, it was found that the optimal age for application of a chip
seal on an HMA pavement was 11 years, while the optimal age for application of crack sealing
on an HMA pavement was 5 years. In the North Carolina case study, it was found that the
optimal age for application of an asphalt seal coat was 9 years (Peshkin et al., 2004).
Treatment selection was identified as a key step in a preventive maintenance program.
Each available treatment should be outlined and compared with agency needs. Each treatment is
unique and has its own benefits and their applications are limited by different constraints. As
such, local or regional guidelines should be outlined for their use (Peshkin et al., 2004).
Performance Prediction and Modeling
Maintenance, rehabilitation, and reconstruction can impact the development of
performance models. In some instances, maintenance is not recorded when applied. This would
result in the development of a model that has a slower deterioration rate than would be expected
if no maintenance treatments were applied. If these sections are used in the development of the
performance model, there would be an overestimation of future performance. Maintenance
should always be recorded so that performance models can be adjusted by either increasing
condition, shifting the curve, changing the slope of the curve, or some combination of the three
(Agile Assets, 2012). Many other factors limit the reliability of pavement performance models.
These factors include uncertainties in pavement response to traffic and environment,
quantification of factors affecting performance, and the error associated with obtaining condition
data for a wide pavement area using only discrete testing points (Agile Assets, 2012).

50
It is possible for Pavement Management Systems to contain a large number of pavement
performance models based on pavement type, traffic level, region, treatment, and condition. It is
sometimes useful to develop more general pavement performance models by grouping
pavements that have similar characteristics (Arambula et al., 2011). Effective performance
models can allow realistic predictions of future network condition and also evaluate the
effectiveness of maintenance treatments (Chan et al., 1997).
As an example, the Michigan Department of Transportation (MDOT) developed a
procedure to outline suitable thresholds to trigger preventive maintenance applications. MDOT
uses two different indices to evaluate pavements. The first index is the distress index (DI),
which measures structural deficiencies on the pavement by evaluating surface distresses. The
second index is the ride quality index (RQI), which measures the functional performance of the
roadway by evaluating roughness. MDOT currently makes decisions regarding maintenance and
rehabilitation based on the DI. The RQI is used only after the DI trigger is reached. It is thought
that roughness is directly related to acceleration of pavement deterioration because trucks
travelling on significantly rough pavements can be excited, increasing dynamic loading on the
pavement.
MDOT modeled the relationship between dynamic loading (caused by RQI) and distress
and thereby developed new thresholds based on the functional index, RQI. These thresholds
used a more proactive approach to pavement maintenance and promoted the application of
preventive maintenance to minimize cost and extend pavement life. Light preventive
maintenance was believed to have a smoothing effect on pavements, reducing the RQI and, by
extension, dynamic axle loading. A reliability-based model was proposed for selecting the
optimal timing of preventive maintenance using the new RQI thresholds and RQI growth rates
using current pavement data (Chatti and Lee, 2001).
Preventive Maintenance Treatment Selection Methodologies
Many methods can be used when developing a treatment selection tool. The starting
point for a treatment selection tool, however, is anticipating how pavements are expected to
perform over time. Pavement performance prediction and modeling is a key component in a
treatment selection tool. Decision tools such as decision trees or matrices, scoring systems, or
optimization analysis can then aid treatment selection based on expected treatment performance.
Some agencies have developed their own approaches to development of treatment
selection and general preventive maintenance strategies. The following sections provide the
findings from these studies as they pertain to preventive maintenance and decision making.
Decision Trees and Matrices
For decisions being made at the project level, specific condition data must be made
available (Flintsch and McGhee, 2009). As previously mentioned, factors influencing the
selection of preventive maintenance treatments include type and severity of distresses, cost-
effectiveness of treatment, climate, and so on (Peshkin et al., 2011).
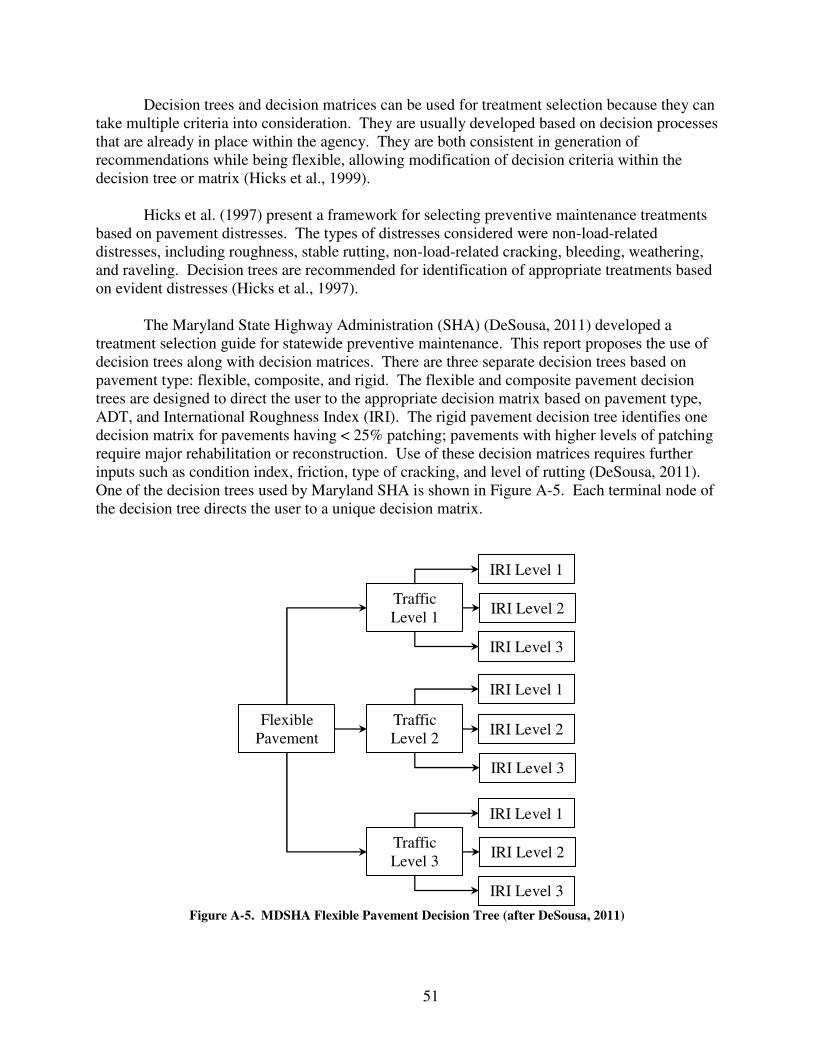
51
Decision trees and decision matrices can be used for treatment selection because they can
take multiple criteria into consideration. They are usually developed based on decision processes
that are already in place within the agency. They are both consistent in generation of
recommendations while being flexible, allowing modification of decision criteria within the
decision tree or matrix (Hicks et al., 1999).
Hicks et al. (1997) present a framework for selecting preventive maintenance treatments
based on pavement distresses. The types of distresses considered were non-load-related
distresses, including roughness, stable rutting, non-load-related cracking, bleeding, weathering,
and raveling. Decision trees are recommended for identification of appropriate treatments based
on evident distresses (Hicks et al., 1997).
The Maryland State Highway Administration (SHA) (DeSousa, 2011) developed a
treatment selection guide for statewide preventive maintenance. This report proposes the use of
decision trees along with decision matrices. There are three separate decision trees based on
pavement type: flexible, composite, and rigid. The flexible and composite pavement decision
trees are designed to direct the user to the appropriate decision matrix based on pavement type,
ADT, and International Roughness Index (IRI). The rigid pavement decision tree identifies one
decision matrix for pavements having < 25% patching; pavements with higher levels of patching
require major rehabilitation or reconstruction. Use of these decision matrices requires further
inputs such as condition index, friction, type of cracking, and level of rutting (DeSousa, 2011).
One of the decision trees used by Maryland SHA is shown in Figure A-5. Each terminal node of
the decision tree directs the user to a unique decision matrix.
Figure A-5. MDSHA Flexible Pavement Decision Tree (after DeSousa, 2011)
Flexible
Pavement
Traffic
Level 1
Traffic
Level 3
Traffic
Level 2
IRI Level 1
IRI Level 2
IRI Level 3
IRI Level 1
IRI Level 2
IRI Level 3
IRI Level 1
IRI Level 2
IRI Level 3

52
Scoring Systems
In the methodology outlined by Hicks et al. (1999), the effect of each of the influential
factors can be taken into account, and each factor may be assigned a weight. The treatments can
then be given a score for each factor, based on its impact on the treatment. The combined
weighting and scoring system can be used as a treatment selection tool (Hicks et al., 1999).
A new approach to maintenance selection was developed in Egypt using the maintenance
unit (MU). Instead of choosing maintenance and rehabilitation activities based on density of
distresses, the MU method makes selections based on the density of localized maintenance or
distress repair methods. MUs are assigned based on recommended repair type. Typically,
pavements with higher values of MUs have more drastic rehabilitation needs (e.g.,
reconstruction). It was found that this method is useful when developing a 5-year maintenance
plan because it is quite accurate in developing maintenance needs (Abo-Hashema and Sharaf,
2009).
Optimization
Optimization methods perform budget allocation to obtain the combination of selected
pavement sections based on their benefit. Limitations on using optimization analysis for
pavement selection are the difficulty in quantifying user costs and benefits of maintenance. User
costs can include travel time cost, accident cost, and vehicle operating cost. Incorporating these
costs can result in allocation of funds to pavements that are used the most, leading to
deterioration of low-use pavements (AASHTO, 2001). Optimization selects the most optimal
solution based on maximization objectives such as pavement condition subject to budgetary
constraints, or based on minimization objectives such as cost subject to condition constraints.
Most optimization is implemented to maximize cost-effectiveness at the network-selection level
(Dessouky et al., 2011).
According to Hicks et al. (1997), decision trees consider distresses and traffic; however,
other factors need to be taken into account when selecting the optimal treatment. Considerations
should be made regarding factors such as cost, expected performance, availability of contractors,
environmental impact, availability of materials, and climate. In the cost analysis for treatment
selection, the cost-effectiveness technique is recommended over the life-cycle-cost-analysis
(LCCA) approach. The LCCA will identify the treatment with the lowest cost over the analysis
period; however, it does not take pavement performance into account. The cost-effectiveness
analysis chooses the treatment that provides the highest performance with the lowest cost. A
linear programming model was proposed that considers all factors including treatment timing,
expected life, and even user delay costs.
According to Wu et al. (2008), it is necessary for state departments of transportation
(DOTs) to progress from historical budget allocations to needs-based allocations, and ultimately
to performance-based allocations. The major shortcomings of the needs-based budgeting
approach for short-term preservation allocation are that districts are likely to exaggerate needs in
order to secure funding, and statewide budgetary requests may not necessarily be optimal for the
benefit of the entire network. The authors presented a decision-support model that optimizes

53
short-term preservation budgeting using two operations research techniques: goal programming
and analytic hierarchy process (AHP). The goal programming aspect allows for the
simultaneous consideration of multiple objectives, while the AHP allows for priorities to be set
for multiple criteria. The objective of the model is to maximize benefit, in terms of service life,
while minimizing preservation cost. This case study shows that the proposed model is a viable
option for supporting decision making (Wu et al., 2008).
An alternative to optimization methods would be the use of heuristics, which can provide
“near optimal” solutions (AASHTO, 2001). The heuristic approach calculates the marginal cost-
effectiveness (MCE) or the incremental benefit-cost (IBC) and is used by numerous highway
agencies (Dessouky et al., 2011).
The MCE approach computes the MCE for each project and uses a series of iterations to
calculate the MCE. The project with the highest MCE is selected in each iteration and replaces
the project selected in the previous iteration. The MCE is calculated as shown in Equation A-1
(Dessouky et al., 2011):
MCEK = LM-LNOM-ON
(Eq. A-1)
where Ei and Ci are the effectiveness and cost of project i, and Es and Cs are the
effectiveness and cost of the selected project (Dessouky et al., 2011).
The IBC approach computes IBC for each project and the previous project. The IBC is
calculated as shown in Equation A-2 (Dessouky et al., 2011):
IBCK = PM-PMQROM-OMQR
(Eq. A-2)
where Bi and Ci are the benefit and cost of project i. The highest IBC is selected as the
current project, and subsequent projects are compared to the selected IBC (Dessouky et al.,
2011).
An example of state implementation of a decision support model is the prioritization
methodology, which is used in Texas. The previously available needs assessment tool in the
TXDOT Pavement Management and Information System (PMIS) used a decision tree to develop
a list of projects that are candidates for preventive maintenance or rehabilitation. A prioritization
tool was developed to help select preventive maintenance and rehabilitation projects for each
Texas highway maintenance district. The tool was developed using Microsoft Excel and
provides a user interface where the district personnel can enter the required data for each project.
Default weighting factors are assigned for condition score, distress score, ride score, skid
number, maintenance expenditures, number of failures, age, and annual daily traffic. These
default weights can be modified by the user. The tool offers four separate outputs: a
rehabilitation priority list, a preventive maintenance priority list, a combined priority list, and a
project scoring detail list (Dessouky et al., 2011).

54
References
AASHTO. Pavement Management Guide. American Association of State Highway &
Transportation Officials, 2001.
Abo-Hashema, M., and Sharaf, E.A. Development of Maintenance Decision Model for Flexible
Pavements. International Journal of Pavement Engineering, Vol. 10, No. 3, 2009, pp.
173-187.
Agile Assets. Tutorial: PMS Users - Tutorial on Using the Agile Pavement Manager. Virginia
Department of Transportation, Richmond, 2012.
Arambula, E., Renju, G., Xiong, W., and Hall, G. Development and Validation of Pavement
Performance Models for the State of Maryland. In Transportation Research Record:
Journal of the Transportation Research Board, No. 2225. Transportation Research
Board of the National Academies, Washington, DC, 2011, pp. 25-31.
Chan, P., Oppermann, M., and Wu, S. North Carolina's Experience in Development of
Pavement Performance Prediction and Modeling. In Transportation Research Record:
Journal of the Transportation Research Board, No. 1592. Transportation Research
Board of the National Academies, Washington, DC, 1997, pp. 80-88.
Chatti, K., and Lee, D. Development of a Preventive Maintenance Strategy for Minimizing
Roughness-Related Pavement Damage. In Transportation Research Record: Journal of
the Transportation Research Board, No. 1769. Transportation Research Board of the
National Academies, Washington, DC, 2001, pp. 39-45.
DeSousa, P. MDSHA Guide to Pavement Preservation. Hanover, MD, 2011, p. 56.
Dessouky, S., Krugler, P., Papagiannakis, A.T., and Freeman, T. Review of Best Practices for
the Selection of Rehab and Preventive Maintenance Projects: Technical Report.
FHWA/TX-11/0-6586-1. Federal Highway Administration, Washington, DC, 2011, p.
138.
Flintsch, G.W., and McGhee, K.K. Quality Management of Pavement Condition Data
Collection. Transportation Research Board, Washington, DC, 2009.
Hicks, R., Dunn, K., and Moulthrop, J. Framework for Selecting Effective Preventive
Maintenance Treatments for Flexible Pavements. In Transportation Research Record:
Journal of the Transportation Research Board, No. 1597. Transportation Research
Board of the National Academies, Washington, DC, 1997, pp. 1-10.
Hicks, R., Moulthrop, J., and Daleiden, J. Selecting a Preventive Maintenance Treatment for
Flexible Pavements. In Transportation Research Record: Journal of the Transportation
Research Board, No. 1680. Transportation Research Board of the National Academies,
Washington, DC, 1999, pp. 1-12.

55
Johnson, A.M. Best Practices Handbook on Asphalt Pavement Maintenance. University of
Minnesota Center for Transportation Studies, Minnesota T2/LTAP Program, 2000, p. 50.
NCHRP. Optimal Timing of Pavement Preventive Maintenance Treatment Applications, 2004.
http://www.trb.org/Main/Blurbs/155142.aspx. Accessed November 5, 2013.
Peshkin, D.G., Hoerner, T.E., and Zimmerman, K.A. Optimal Timing of Pavement Preventive
Maintenance Treatment Applications. Transportation Research Board, National Research
Council: Washington, DC, 2004.
Peshkin, D.G., Hoerner, T.E. Pavement Preservation: Practices, Research Plans, and
Initiatives. American Association of State Highway and Transportation Officials, 2005.
Peshkin, D., Smith, K.L., Wolters, A., Krstulovich, J., Moulthrop, J., and Alvarado, C.
Guidelines for the Preservation of High-Traffic-Volume Roadways. In Strategic
Highway Research Program, Transportation Research Board, Washington, DC, 2011.
Wade, M., DeSombre, R., and Peshkin, D. High Volume/ High Speed Asphalt Roadway
Preventive Maintenance Treatments. South Dakota Department of Transportation, 2001.
Wu, Z., Flintsch, G.W., and Chowdhury, T. Hybrid Multiobjective Optimization Model for
Regional Pavement-Preservation Resource Allocation. In Transportation Research
Record: Journal of the Transportation Research Board, No. 2084. Transportation
Research Board of the National Academies, Washington, DC, 2008 pp. 28-37.


