Big Data, Data Science, Statistics
Nancy Reid
21 July 2017
WSC July 2017
WSC July 2017 2

3WSC July 2017
4WSC July 2017
Canadian Institute for Statistical Sciences
Pacific Institute
for
Mathematical
Sciences
Centre de Recherches Mathématiques
Fields Institute
for Resesarch
in the
Mathematical
Sciences
5WSC July 2017
6WSC July 2017
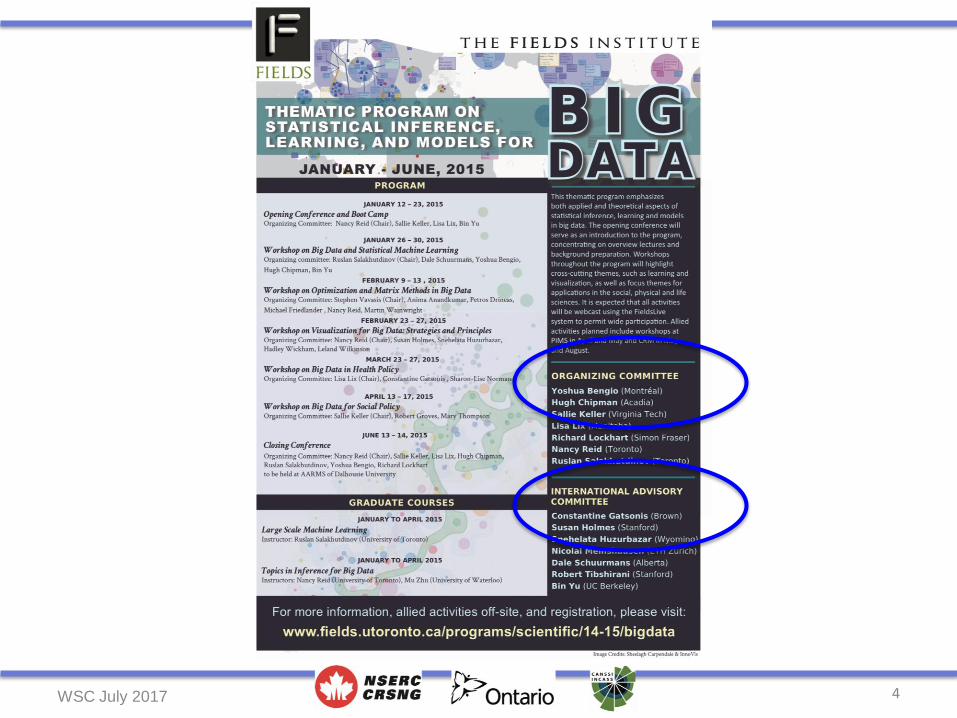
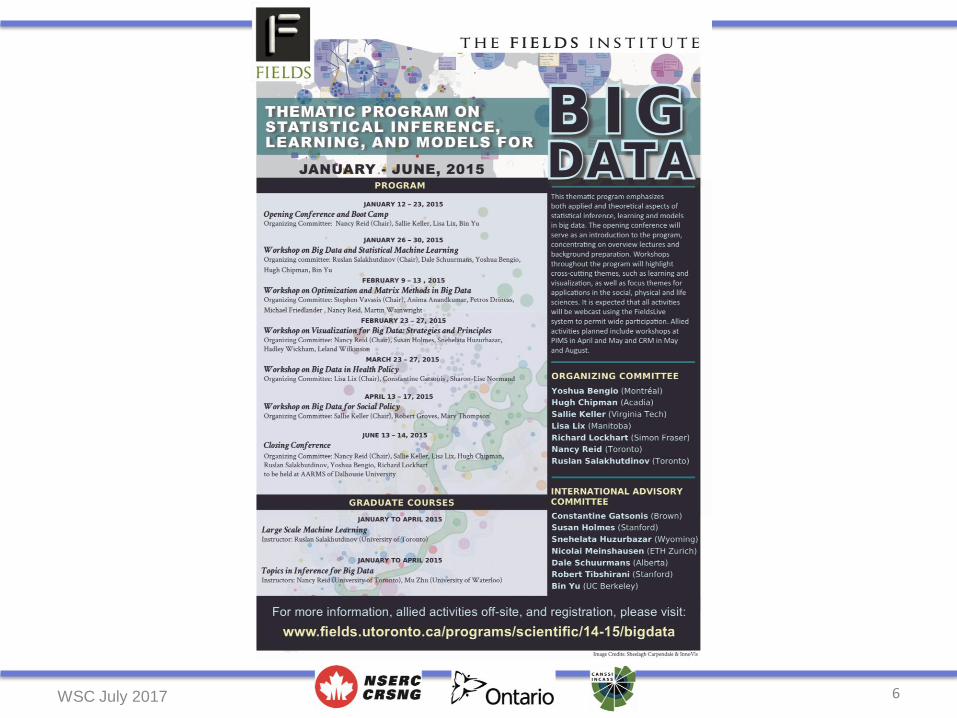
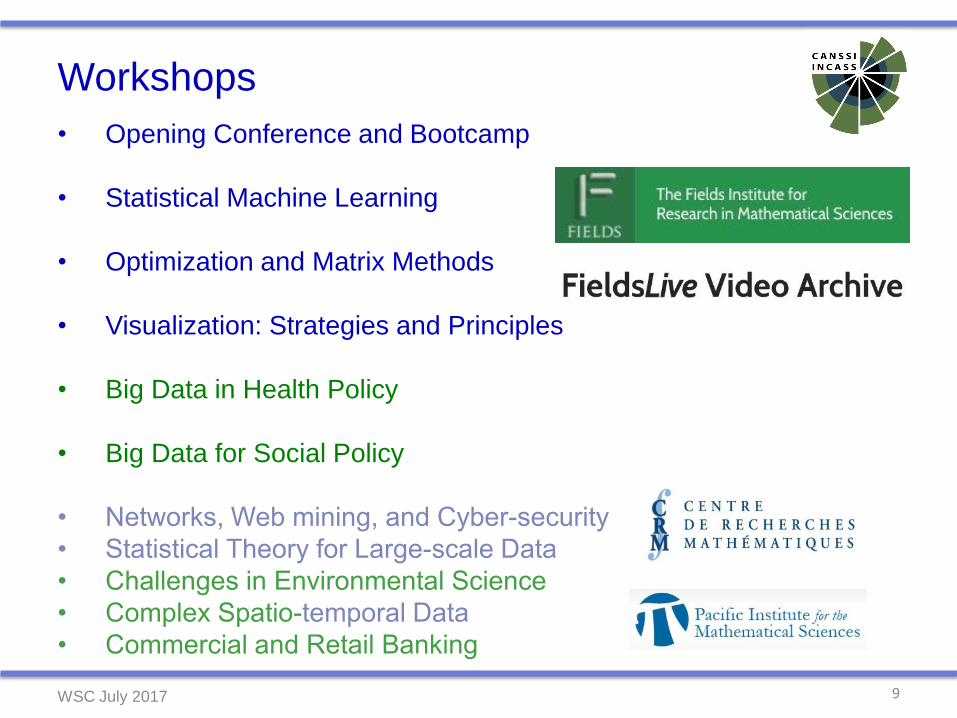
Workshops
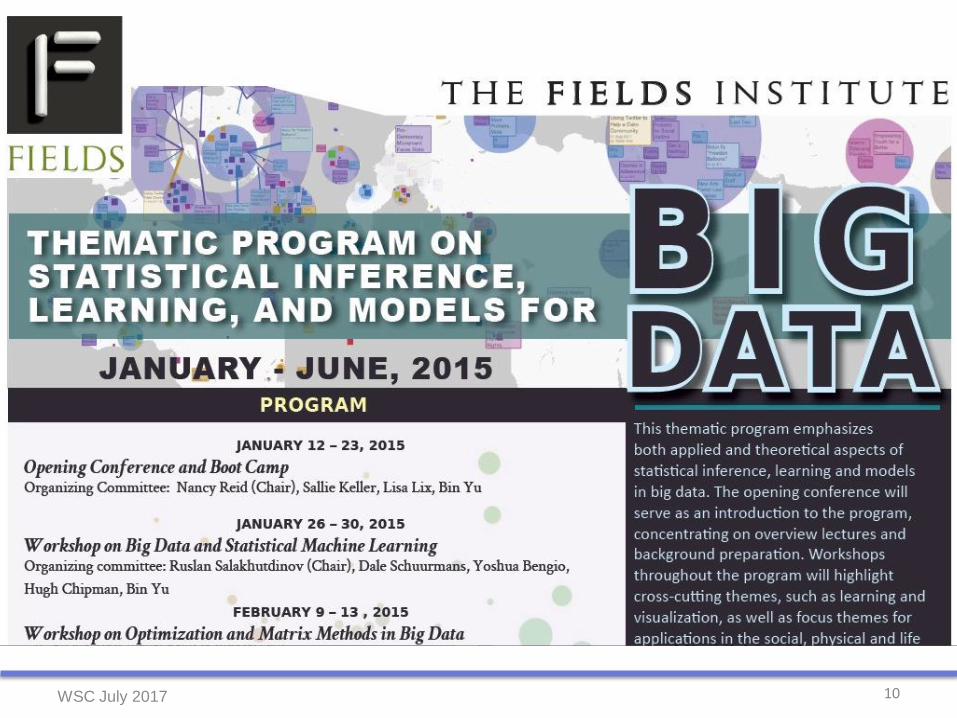
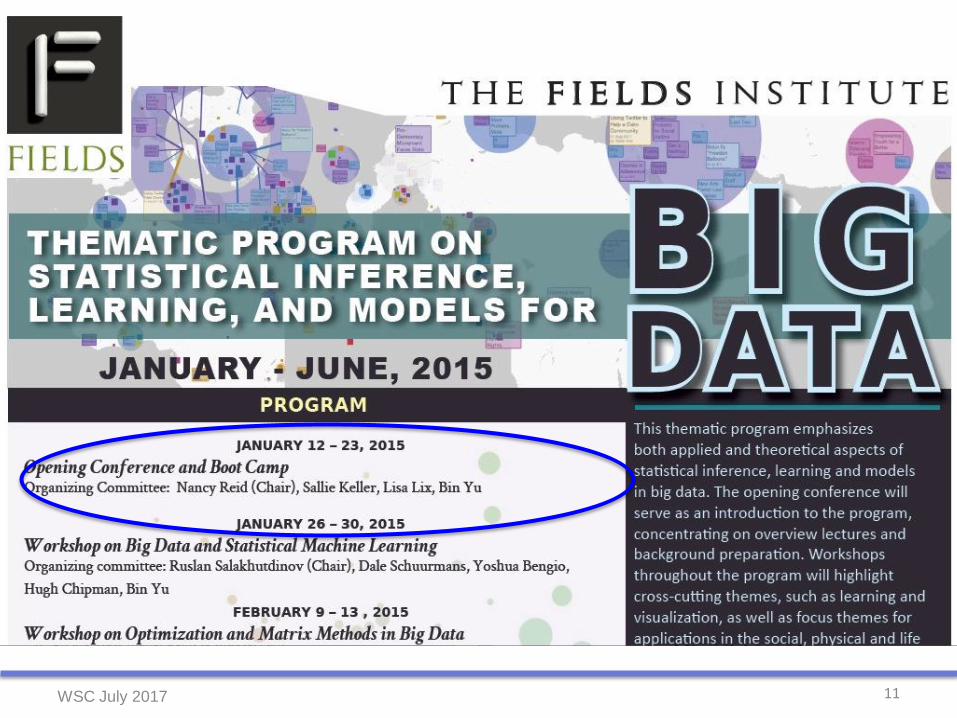
• Opening Conference and Bootcamp
• Statistical Machine Learning
• Optimization and Matrix Methods
• Visualization: Strategies and Principles
• Big Data in Health Policy
• Big Data for Social Policy
7WSC July 2017
Workshops
• Opening Conference and Bootcamp
• Statistical Machine Learning
• Optimization and Matrix Methods
• Visualization: Strategies and Principles
• Big Data in Health Policy
• Big Data for Social Policy
8WSC July 2017
Workshops
• Opening Conference and Bootcamp
• Statistical Machine Learning
• Optimization and Matrix Methods
• Visualization: Strategies and Principles
• Big Data in Health Policy
• Big Data for Social Policy
9WSC July 2017
10WSC July 2017
11WSC July 2017
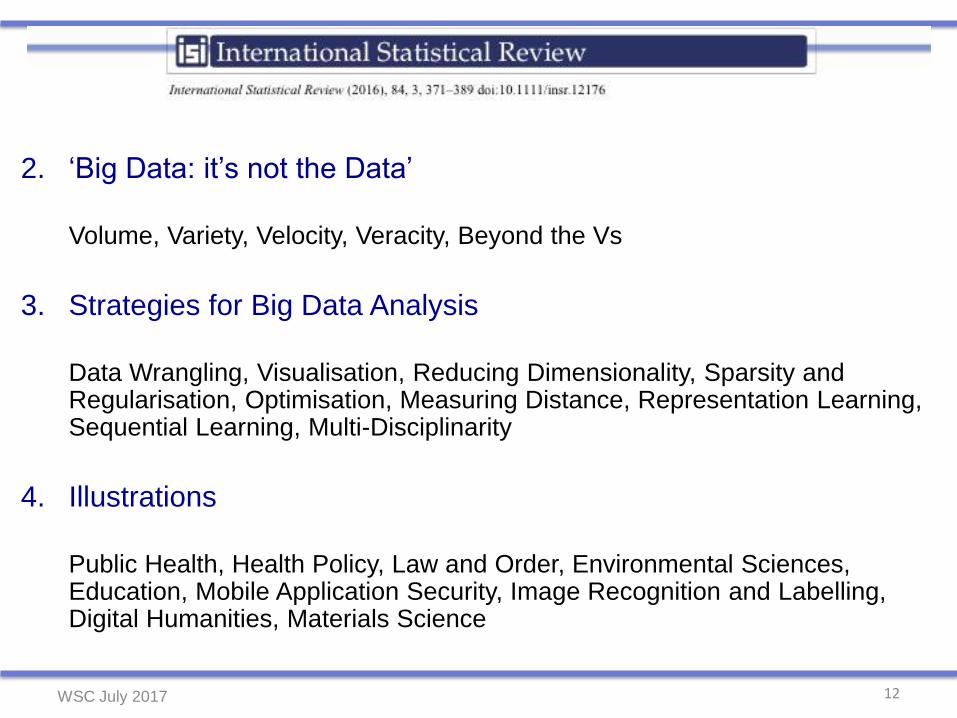
2. ‘Big Data: it’s not the Data’
Volume, Variety, Velocity, Veracity, Beyond the Vs
3. Strategies for Big Data Analysis
Data Wrangling, Visualisation, Reducing Dimensionality, Sparsity and Regularisation, Optimisation, Measuring Distance, Representation Learning, Sequential Learning, Multi-Disciplinarity
4. Illustrations
Public Health, Health Policy, Law and Order, Environmental Sciences, Education, Mobile Application Security, Image Recognition and Labelling, Digital Humanities, Materials Science
WSC July 2017 12
Some highlights
13WSC July 2017
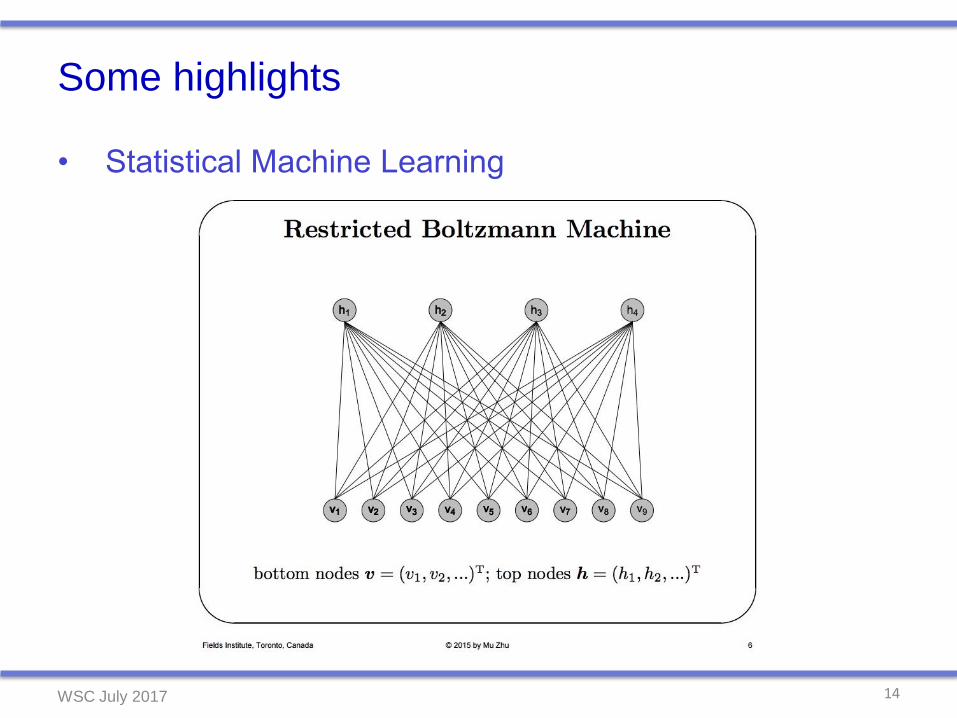
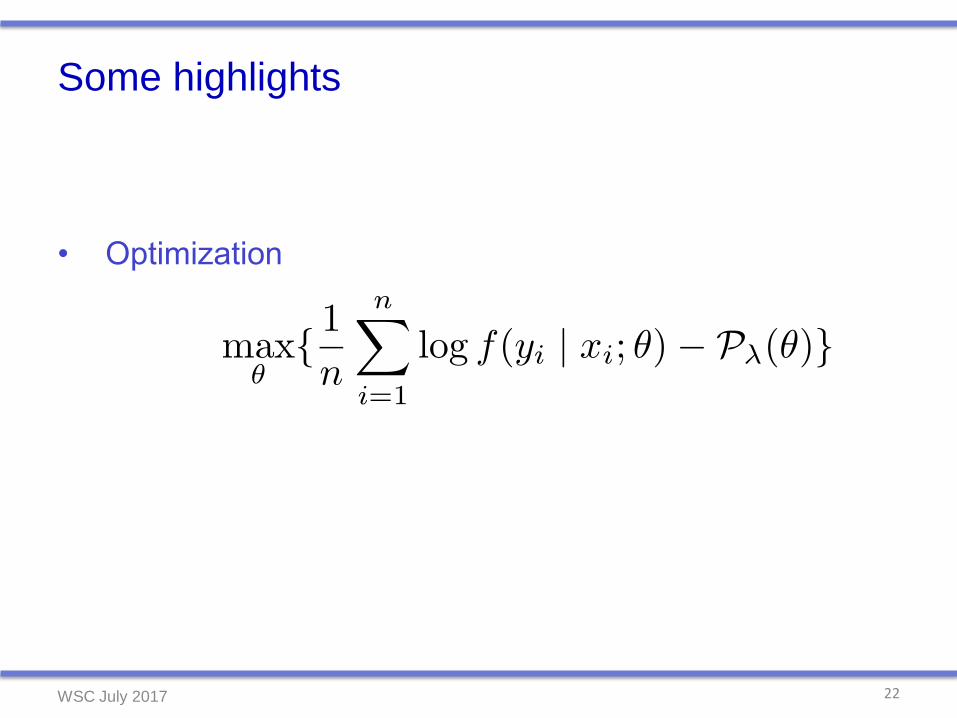
Some highlights
14WSC July 2017
15WSC July 2017
16
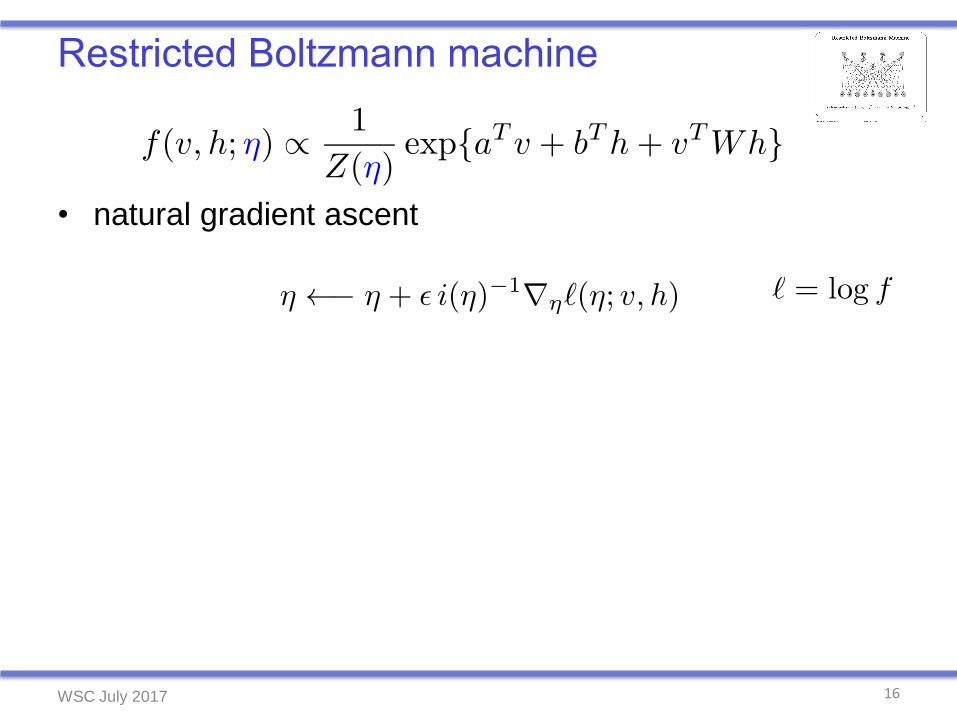
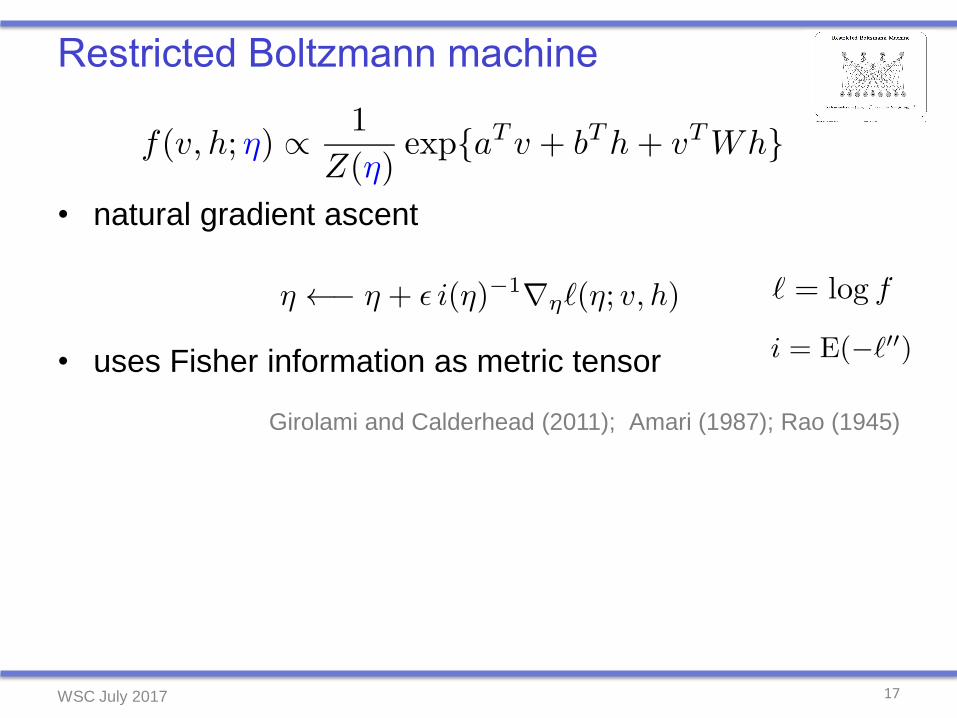
• natural gradient ascent
• uses Fisher information as metric tensor
Girolami and Calderhead (2011); Amari (1987); Rao (1945)
• Gaussian graphical model approximation to force
sparse inverse
Grosse and Salakhutdinov (2016) 32nd Internat. Conf. on Machine Learning
WSC July 2017
17
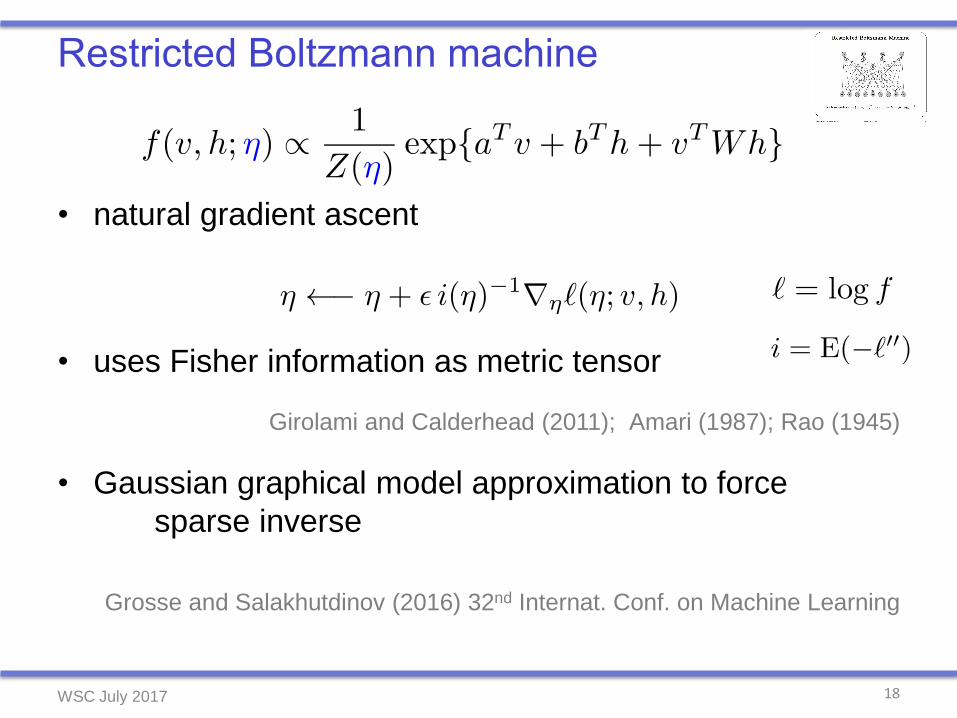
• natural gradient ascent
• uses Fisher information as metric tensor
Girolami and Calderhead (2011); Amari (1987); Rao (1945)
• Gaussian graphical model approximation to force
sparse inverse
Grosse and Salakhutdinov (2016) 32nd Internat. Conf. on Machine Learning
WSC July 2017
18
• natural gradient ascent
• uses Fisher information as metric tensor
Girolami and Calderhead (2011); Amari (1987); Rao (1945)
• Gaussian graphical model approximation to force
sparse inverse
Grosse and Salakhutdinov (2016) 32nd Internat. Conf. on Machine Learning
WSC July 2017
WSC July 2017 19
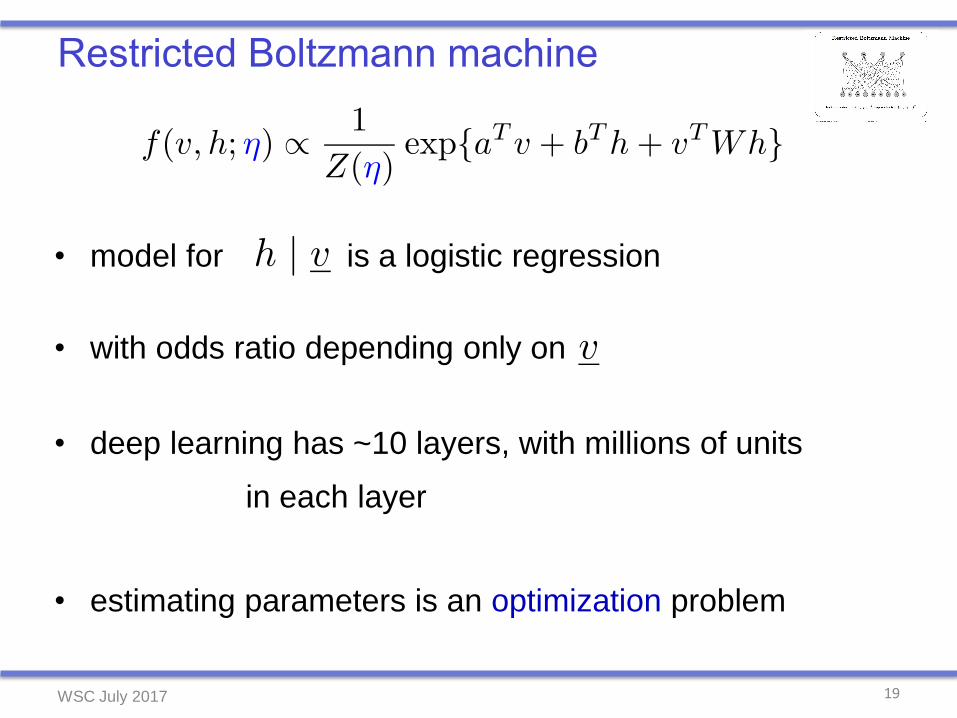
• model for is a logistic regression
• with odds ratio depending only on
• deep learning has ~10 layers, with millions of units
in each layer
• estimating parameters is an optimization problem
WSC July 2017 20
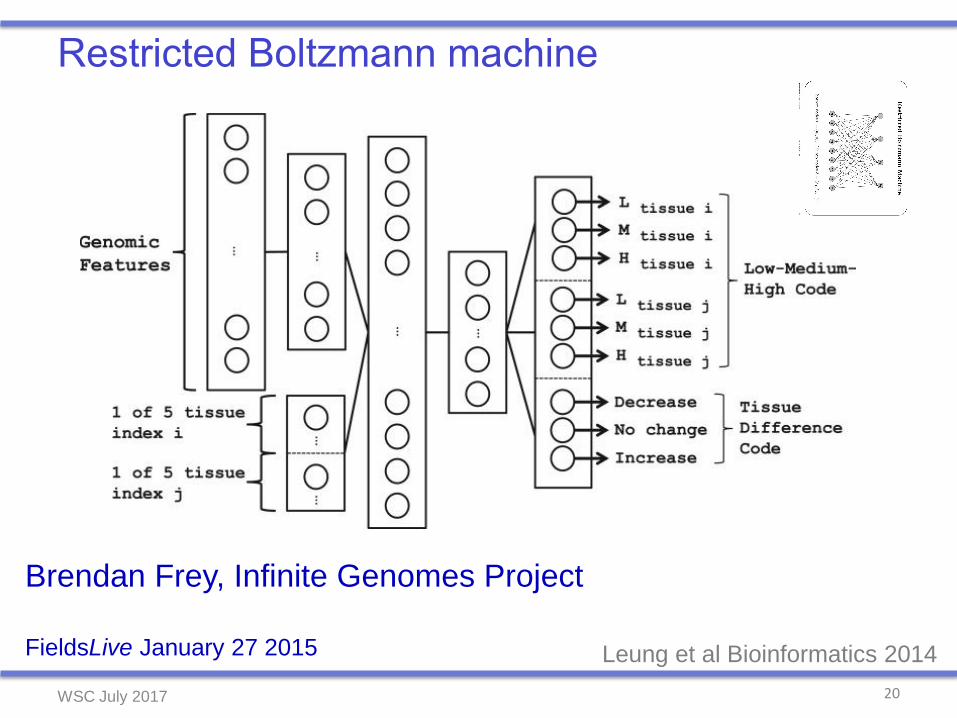
Leung et al Bioinformatics 2014
Brendan Frey, Infinite Genomes Project
FieldsLive January 27 2015
Some highlights
21WSC July 2017
Some highlights
22WSC July 2017
23
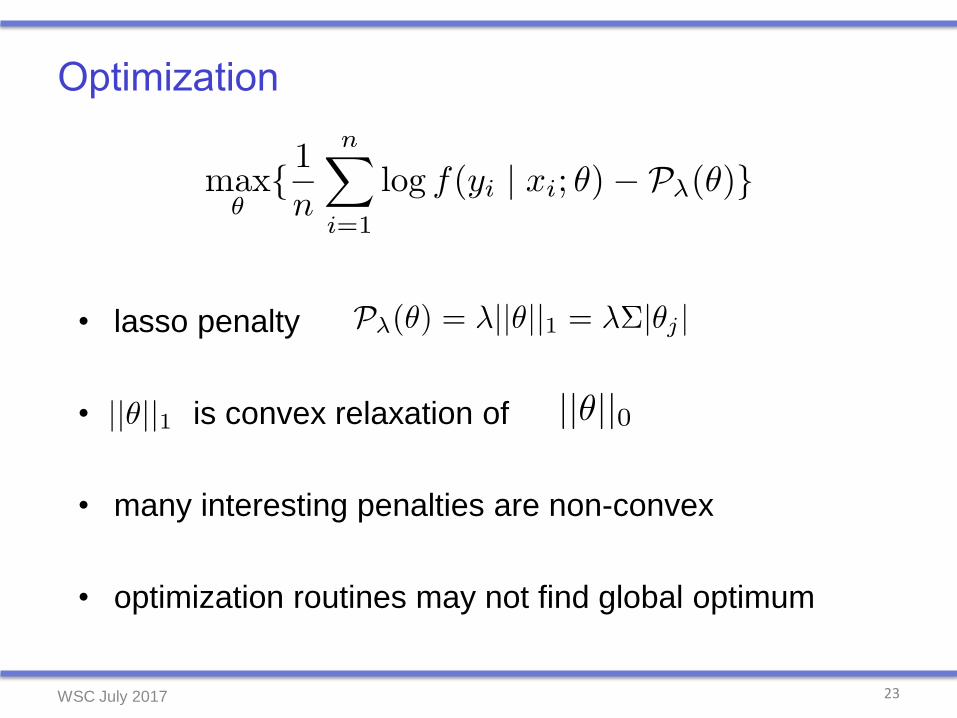
• lasso penalty
• is convex relaxation of
• many interesting penalties are non-convex
• optimization routines may not find global optimum
WSC July 2017
24
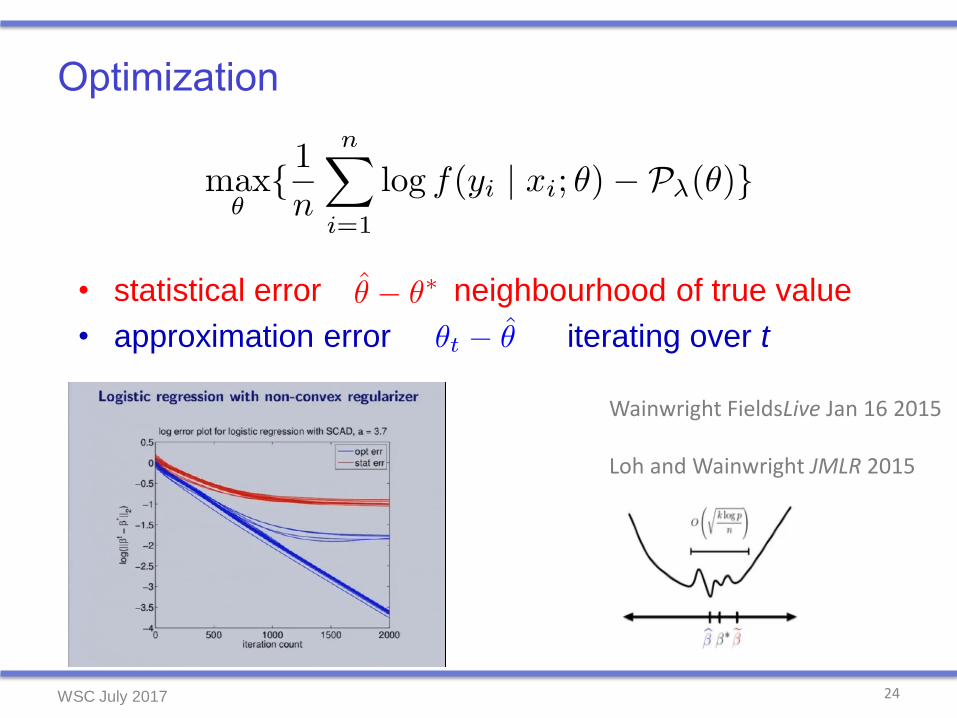
• statistical error neighbourhood of true value
• approximation error iterating over t
Wainwright FieldsLive Jan 16 2015
Loh and Wainwright JMLR 2015
WSC July 2017
Some highlights
25WSC July 2017
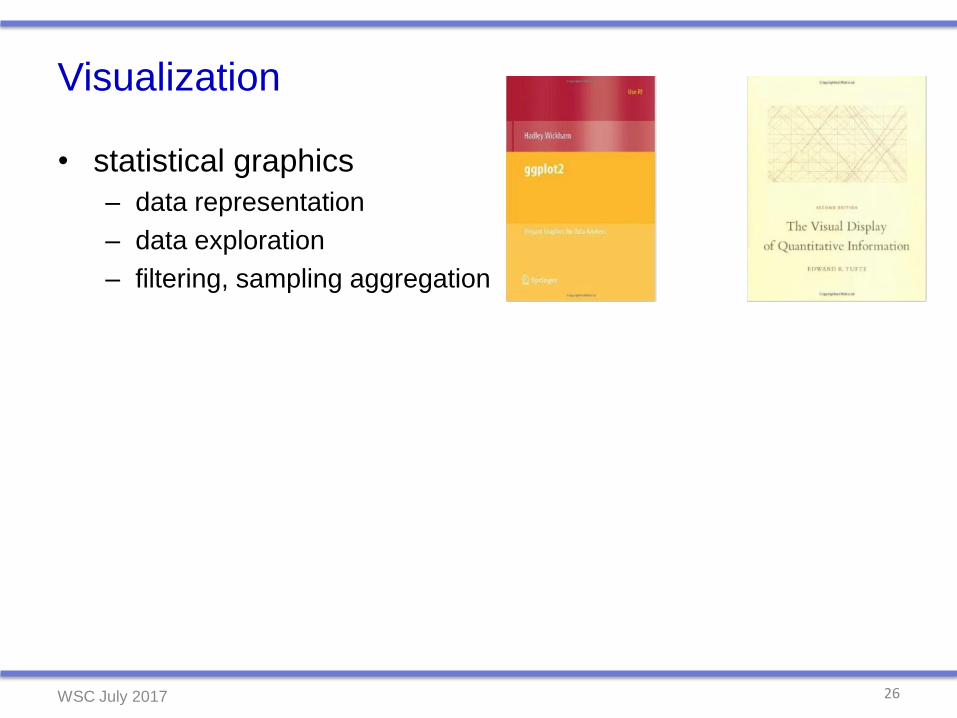
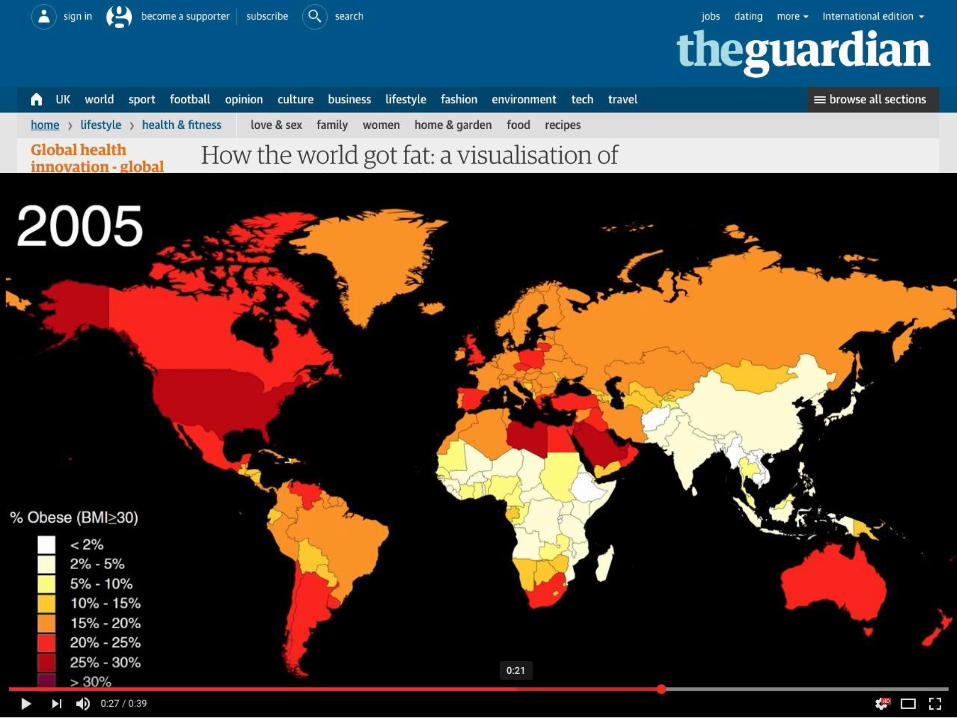
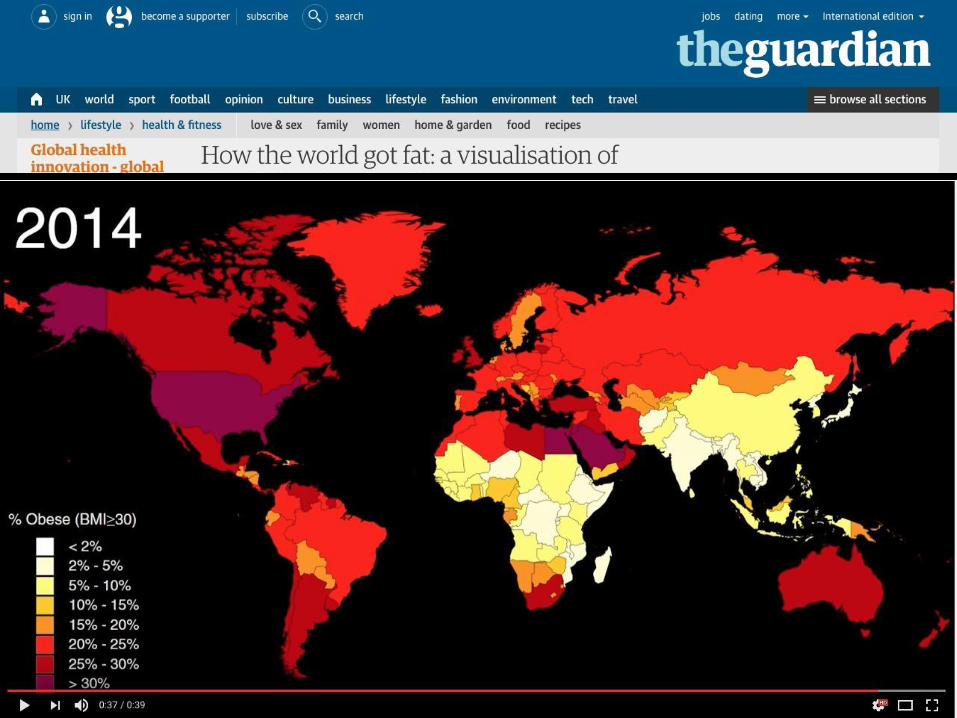
Visualization
• statistical graphics
– data representation
– data exploration
– filtering, sampling aggregation
• information visualization
• scientific visualization
• cognitive science and design
26WSC July 2017
Visualization
• statistical graphics
– data representation
– data exploration
– filtering, sampling aggregation
• information visualization
• scientific visualization
• cognitive science and design
27WSC July 2017
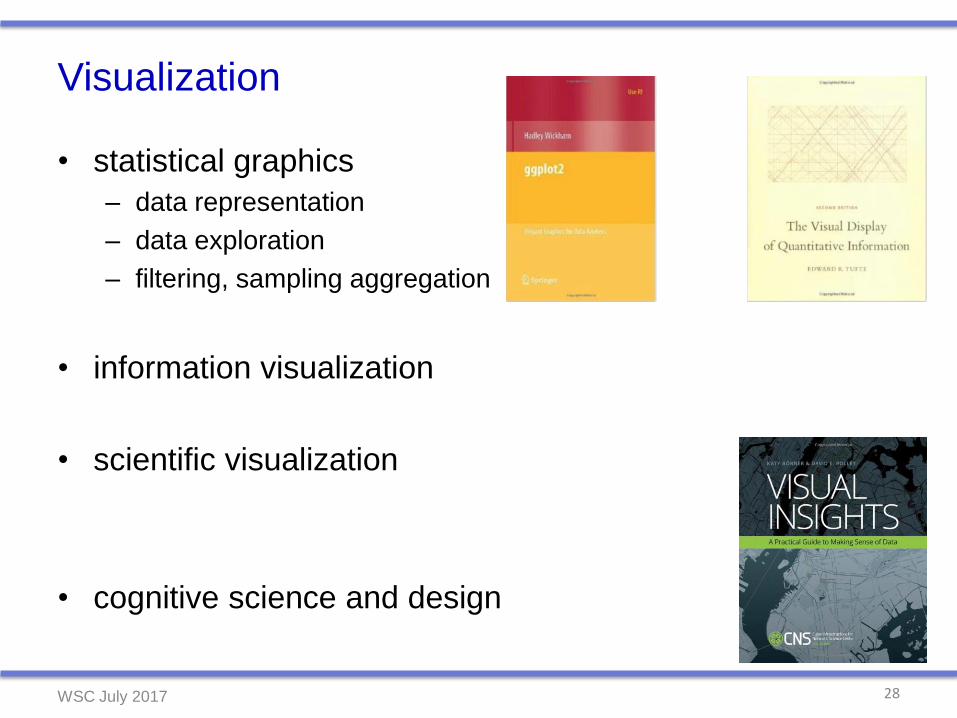
Visualization
• statistical graphics
– data representation
– data exploration
– filtering, sampling aggregation
• information visualization
• scientific visualization
• cognitive science and design
28WSC July 2017
WSC July 2017 29
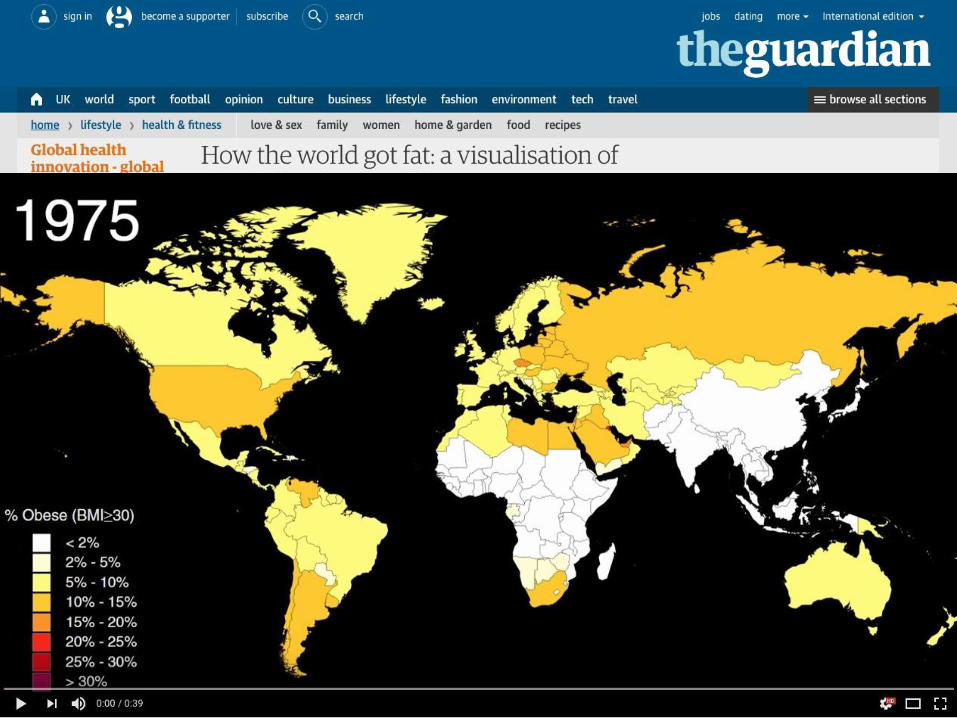
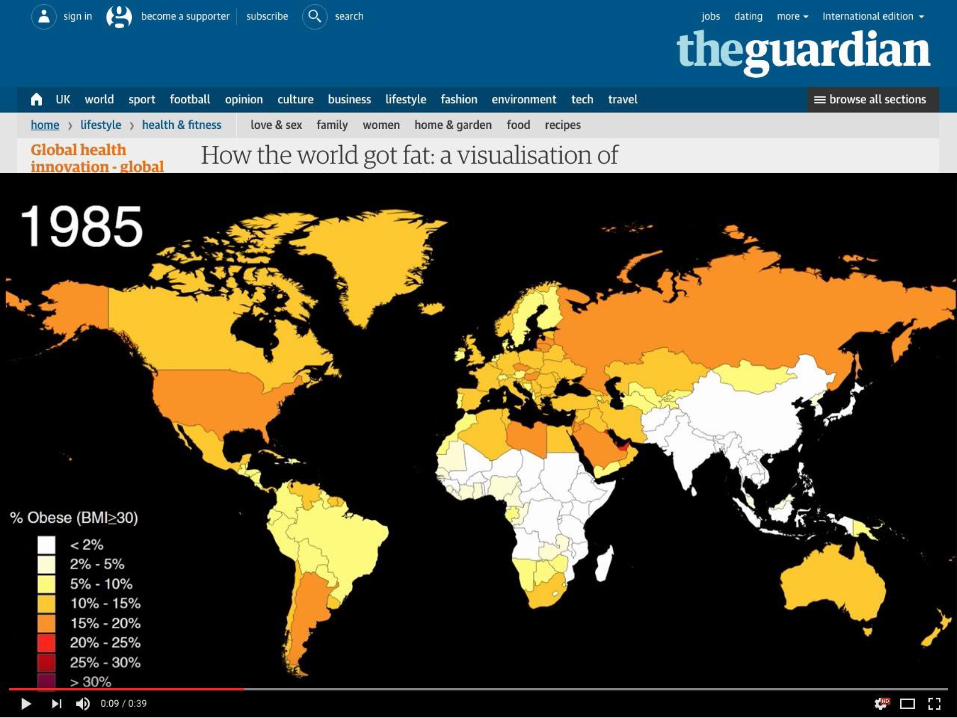
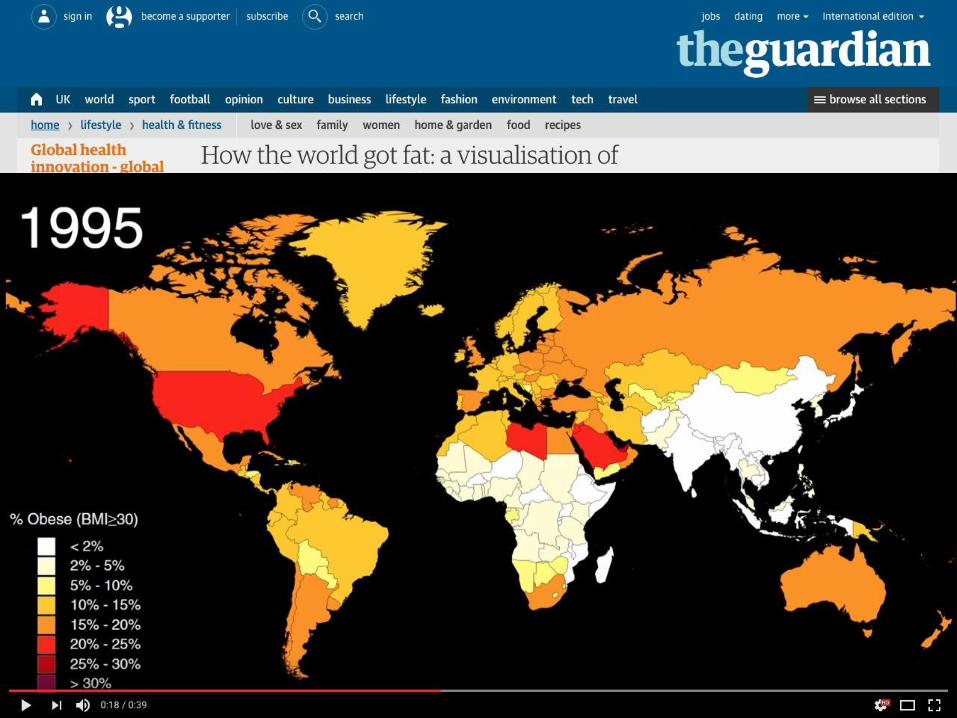
January 3 2017
WSC July 2017 30
WSC July 2017 31
WSC July 2017 32
WSC July 2017 33
WSC July 2017 34

WSC July 2017 35
WSC July 2017 36
WSC July 2017 37
WSC July 2017 38
Some highlights
39WSC July 2017

“Even ‘Safe’ Pollution Levels Can Be Deadly”
WSC July 2017 40
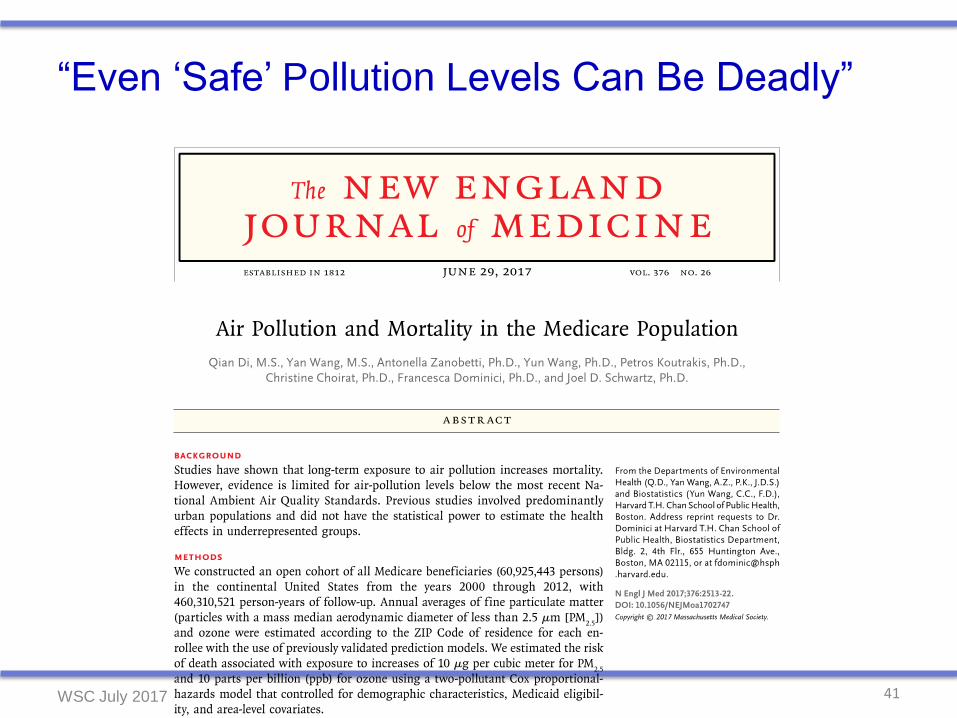
“Even ‘Safe’ Pollution Levels Can Be Deadly”
WSC July 2017 41
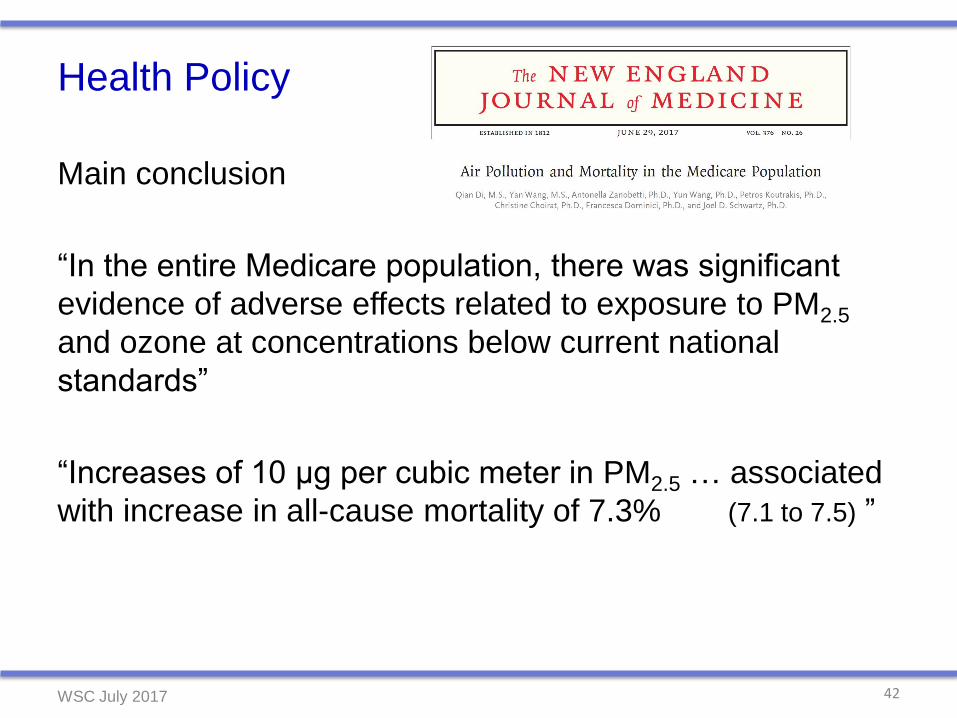
Health Policy
Main conclusion
“In the entire Medicare population, there was significant
evidence of adverse effects related to exposure to PM2.5
and ozone at concentrations below current national
standards”
“Increases of 10 μg per cubic meter in PM2.5 … associated
with increase in all-cause mortality of 7.3% (7.1 to 7.5) ”
WSC July 2017 42
Health Policy
• Mortality
– beneficiaries of Medicare 2000 - 2012 (65+, US) – 61m persons
– age, sex, race, ZIP code, Medicaid status, date of death (censored)
• Exposure
– predicted annual average PM2.5 for each ZIP code, using a neural
network incorporating satellite, land-use, meteorological, simulation
from chemical transport model
• Analysis
– Cox-type regression analysis, with adjustment for spatial covariance
Lee et al 1992
– Cox mixed-effect analysis random intercept location
WSC July 2017 43
Health Policy
• Mortality
– beneficiaries of Medicare 2000 - 2012 (65+, US) – 61m persons
– age, sex, race, ZIP code, Medicaid status, date of death (censored)
• Exposure
– predicted annual average PM2.5 for each ZIP code, using a neural
network incorporating satellite, land-use, meteorological, simulation
from chemical transport model
• Analysis
– Cox-type regression analysis, with adjustment for spatial covariance
Lee et al 1992
– Cox mixed-effect analysis random intercept location
WSC July 2017 44
Health Policy
• Mortality
– beneficiaries of Medicare 2000 - 2012 (65+, US) – 61m persons
– age, sex, race, ZIP code, Medicaid status, date of death (censored)
• Exposure
– predicted annual average PM2.5 for each ZIP code, using a neural
network incorporating satellite, land-use, meteorological, simulation
from chemical transport model
• Analysis
– Cox-type regression analysis, with adjustment for spatial covariance
Lee et al 1992
– Cox mixed-effect analysis random intercept location
WSC July 2017 45
Health Policy
• Data Sources
– Behavioural Risk Factor Surveillance System -- confounders
– US Census – zip code level
– American Community Survey – zip code level
– Dartmouth Atlas of Health Care – hospital level
– Medicare Current Beneficiary Survey -- confounders
– EPA Air Quality System – pollution
– North American Regional Reanalysis -- temperature, humidity
• 22m deaths, 65m persons, 460m person-years
• “these data provided excellent power to estimate the risk of death at levels below the current [standards]” 12μg
WSC July 2017 46

Risk of Death Associated with an Increase of 10 μg per Cubic Meter in PM2.5 Concentrations and an Increase of 10 ppb in Ozone Exposure, According to Study Subgroups.
Di Q et al. N Engl J Med 2017;376:2513-2522
Some highlights
48WSC July 2017
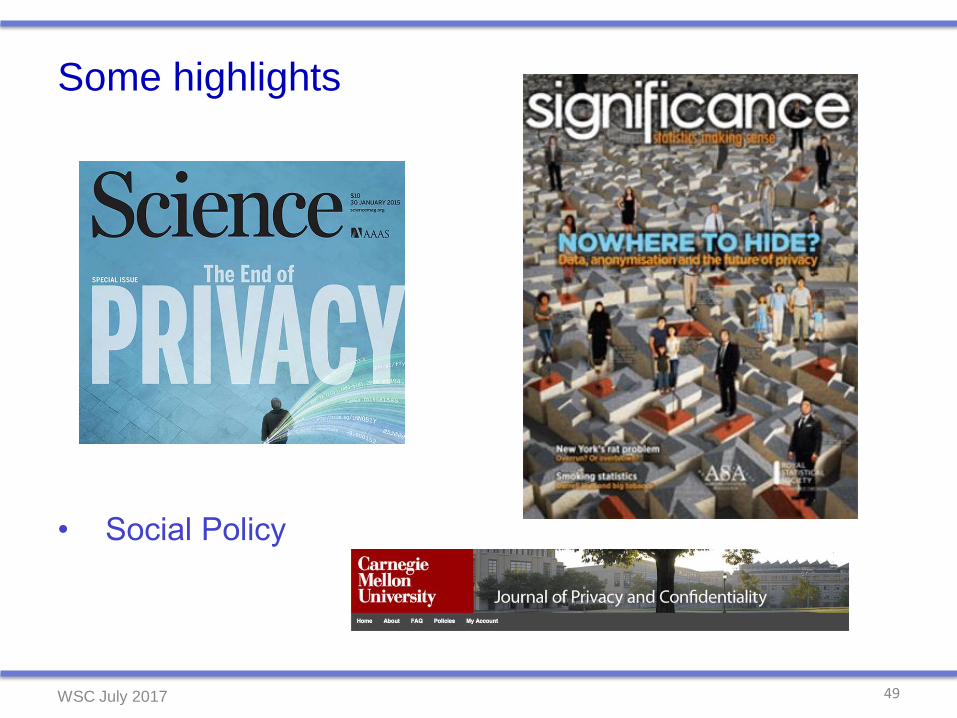
Some highlights
49WSC July 2017
Privacy
• “Big Data and Innovation, Setting the Record Straight:
De-identification Does Work”Privacy Commissioner of Ontario, July 2014
• “No silver bullet: De-identification still doesn’t work”Narayan & Felten, July 2014
• Statistical Disclosure Limitation
• Differential Privacy
• Multi-party Communication
50WSC July 2017
Privacy
• “Big Data and Innovation, Setting the Record Straight:
De-identification Does Work”Privacy Commissioner of Ontario, July 2014
• “No silver bullet: De-identification still doesn’t work”Narayan & Felten, July 2014
• Statistical Disclosure Limitation
• Differential Privacy
• Multi-party Communication
51WSC July 2017
Privacy
• “Big Data and Innovation, Setting the Record Straight:
De-identification Does Work”Privacy Commissioner of Ontario, July 2014
• “No silver bullet: De-identification still doesn’t work”Narayan & Felten, July 2014
• Statistical Disclosure Limitation
• Differential Privacy
• Multi-party Communication
52WSC July 2017
Some highlights
53WSC July 2017
What did we learn?
• Statistical models for big data are complex,
high-dimensional– inference is well-studied, but difficult
• Computational challenges include size and speed– ideas of statistical inference get lost in the machine
• Data owners understand 2., but not 1.
• Data modellers understand 1., but not 2.
• Data science may be the best way to combine these
54WSC July 2017
What did we learn?
• Statistical models for big data are complex,
high-dimensional– inference is well-studied, but difficult
• Computational challenges include size and speed– ideas of statistical inference get lost in the machine
• Data owners understand 2., but not 1.
• Data modellers understand 1., but not 2.
• Data science may be the best way to combine these
55WSC July 2017
What did we learn?
• Statistical models for big data are complex,
high-dimensional– inference is well-studied, but difficult
• Computational challenges include size and speed– ideas of statistical inference get lost in the machine
• Data owners understand 2., but not 1.
• Data modellers understand 1., but not 2.
• Data science may be the best way to combine these
56WSC July 2017

That was yesterday
57WSC July 2017
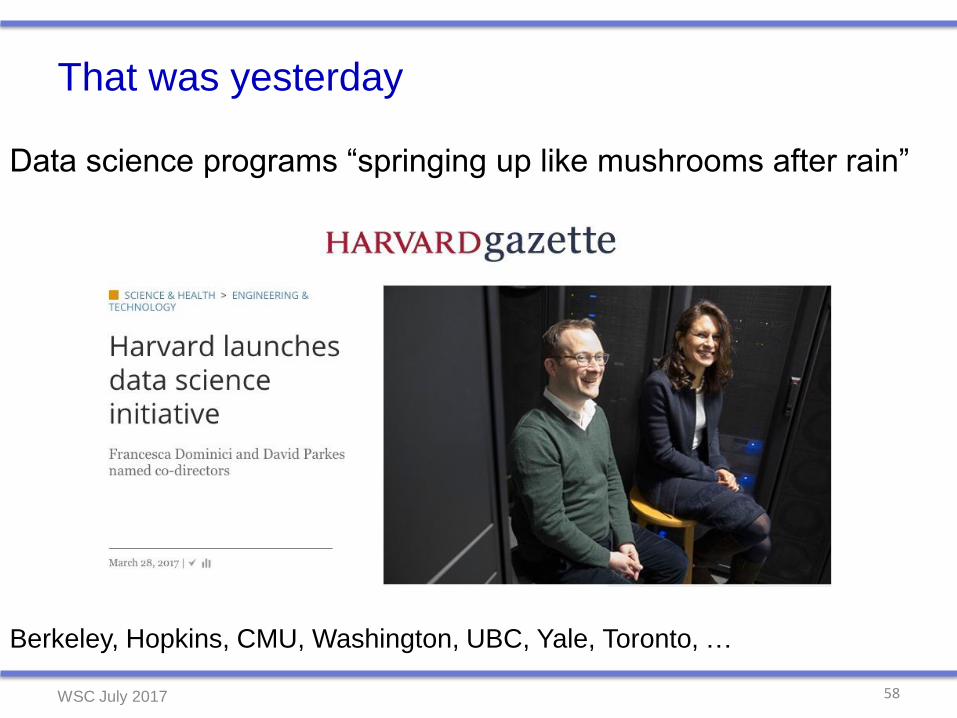
That was yesterday
Data science programs “springing up like mushrooms after rain”
Berkeley, Hopkins, CMU, Washington, UBC, Yale, Toronto, …
58WSC July 2017
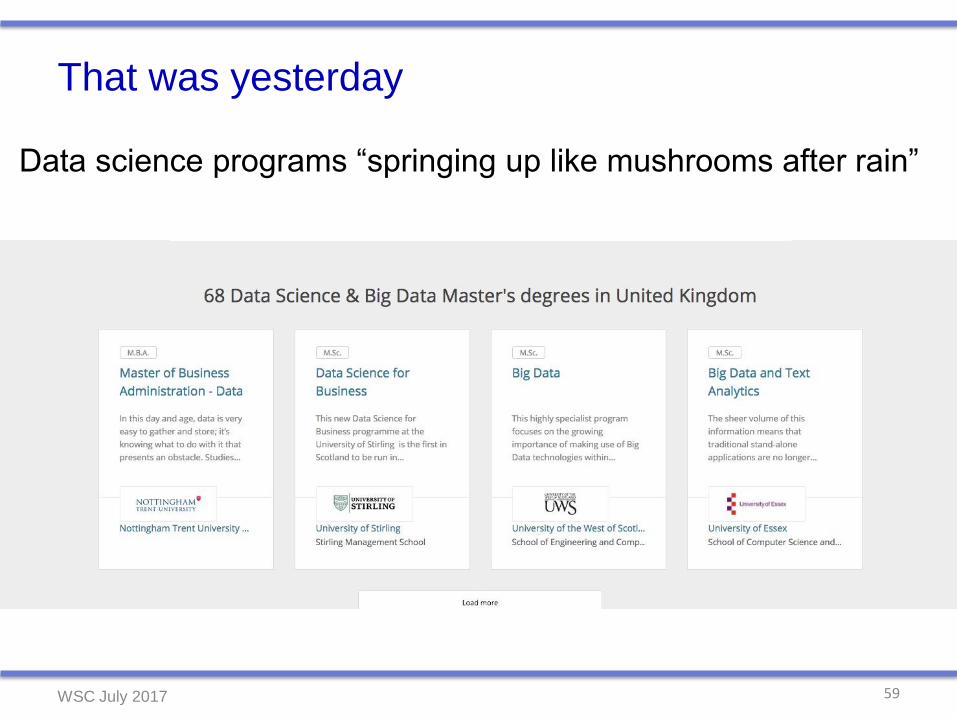
That was yesterday
Data science programs “springing up like mushrooms after rain”
59WSC July 2017

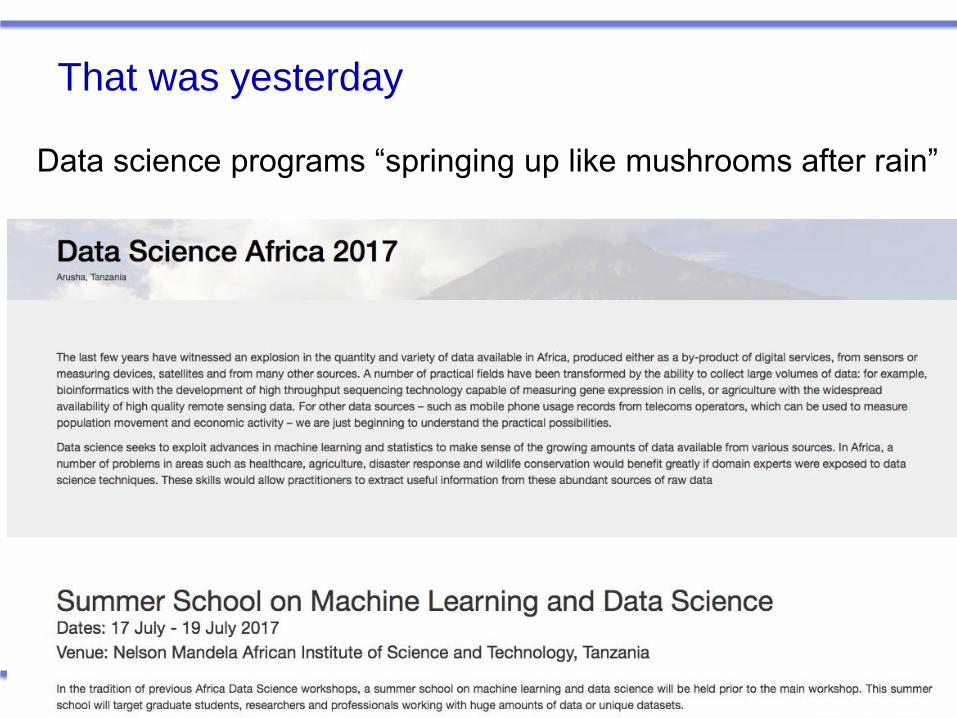
That was yesterday
Data science programs “springing up like mushrooms after rain”
Berkeley, Hopkins, CMU, Washington, UBC, Yale, Toronto, …
60WSC July 2017
That was yesterday
Data science programs “springing up like mushrooms after rain”
Berkeley, Hopkins, CMU, Washington, UBC, Yale, Toronto, …
61WSC July 2017
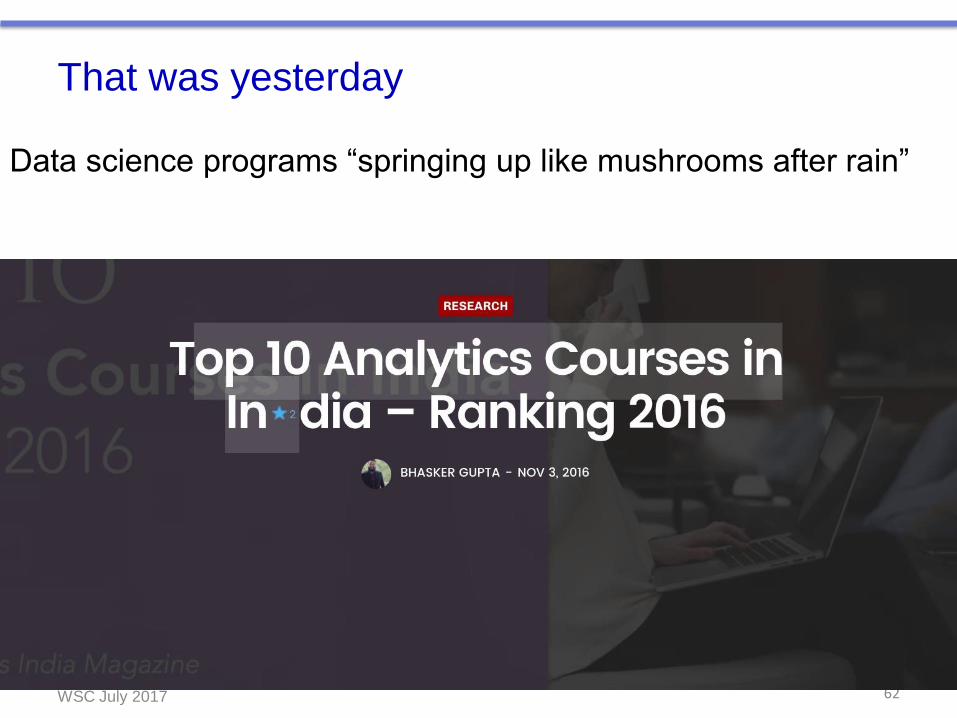
That was yesterday
Data science programs “springing up like mushrooms after rain”
62WSC July 2017
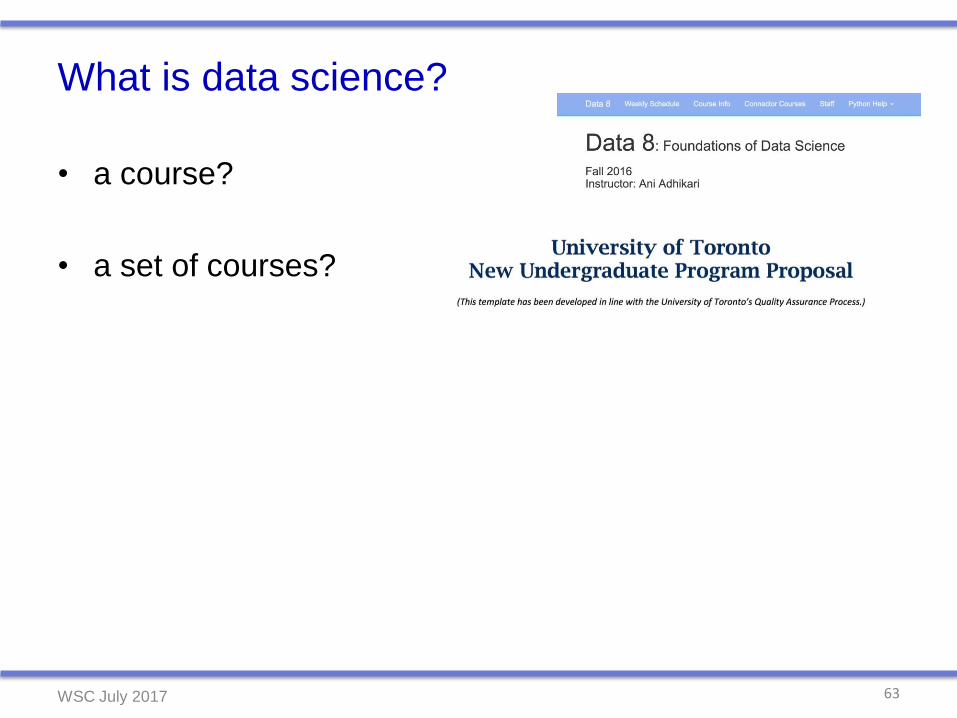
What is data science?
• a course?
• a set of courses?
• a job?
• a technology?
• a new field of research?
• a collaboration?
63WSC July 2017
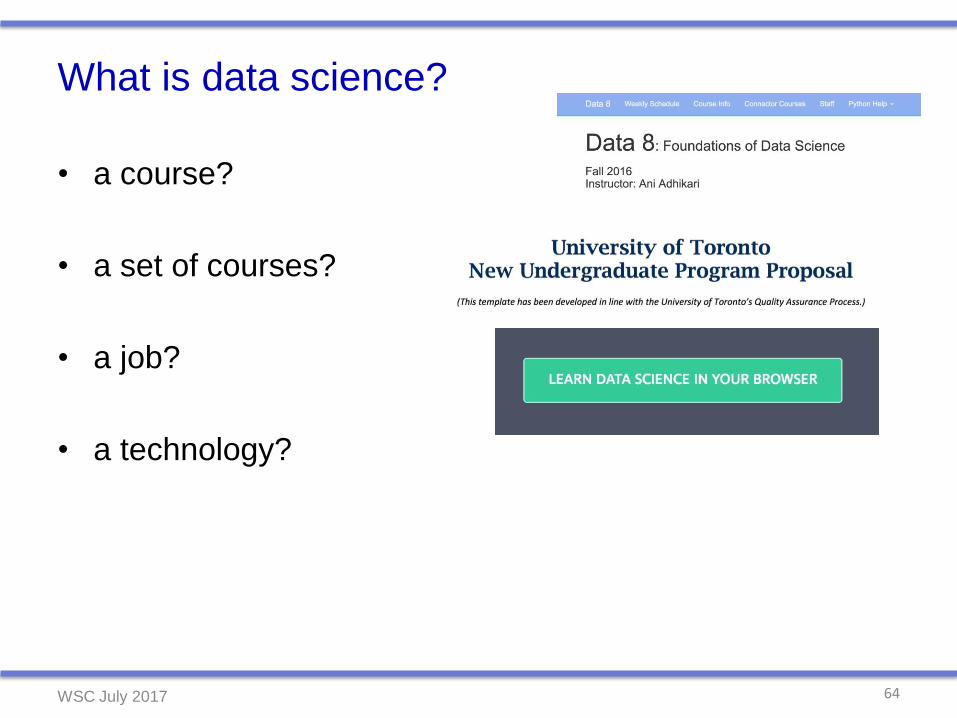
What is data science?
• a course?
• a set of courses?
• a job?
• a technology?
• a new field of research?
• a collaboration?
64WSC July 2017
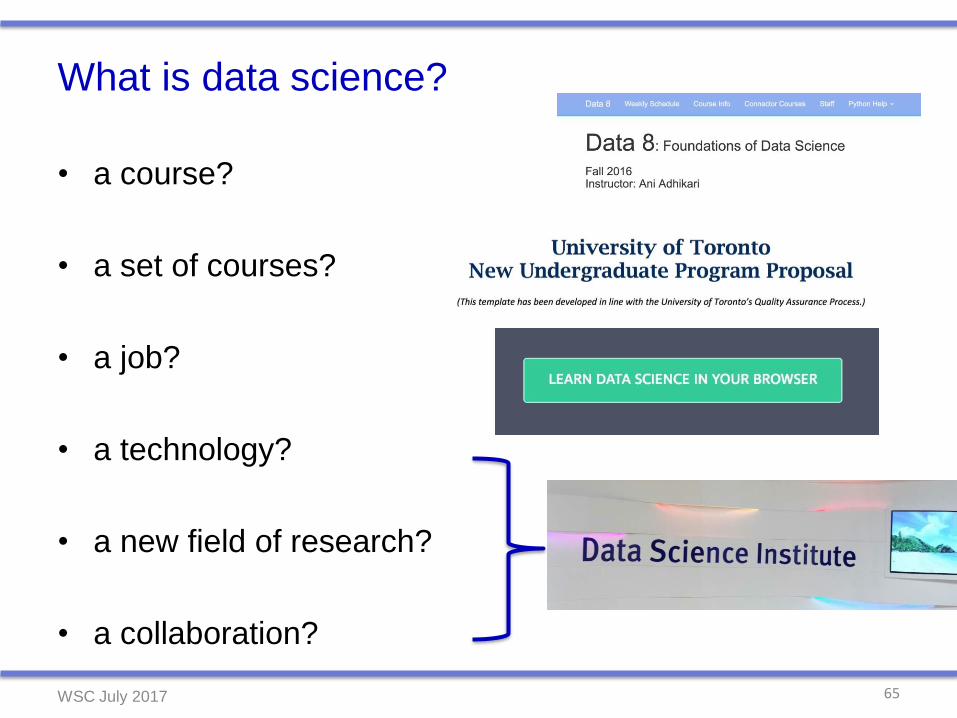
What is data science?
• a course?
• a set of courses?
• a job?
• a technology?
• a new field of research?
• a collaboration?
65WSC July 2017
What is data science?
• a course?
• a set of courses?
• a job?
• a technology?
• a new field of research?
• a collaboration?
66WSC July 2017
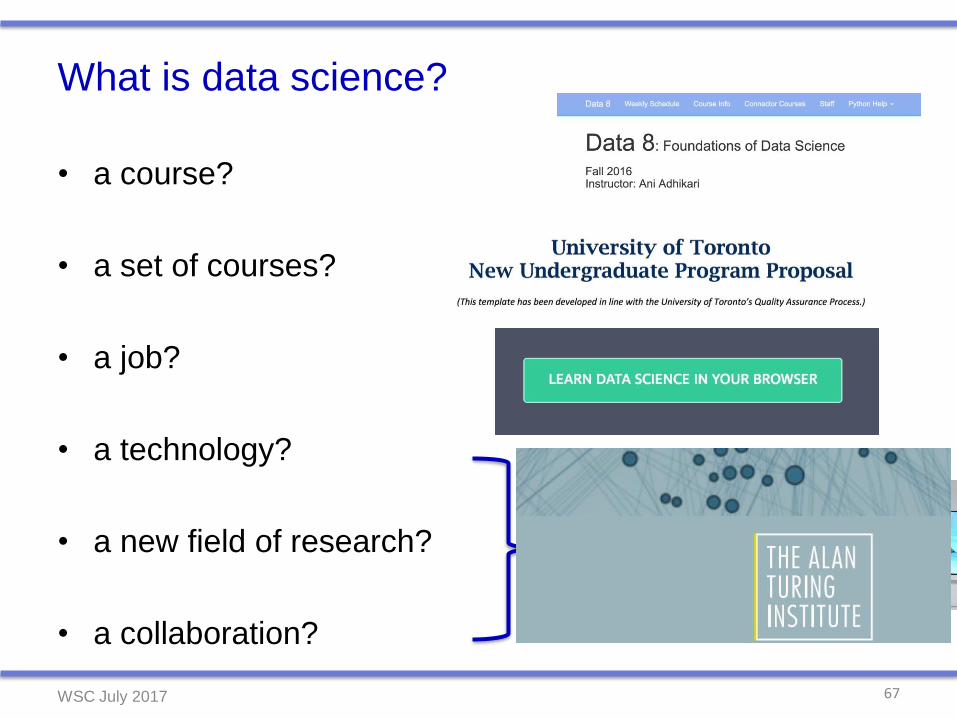
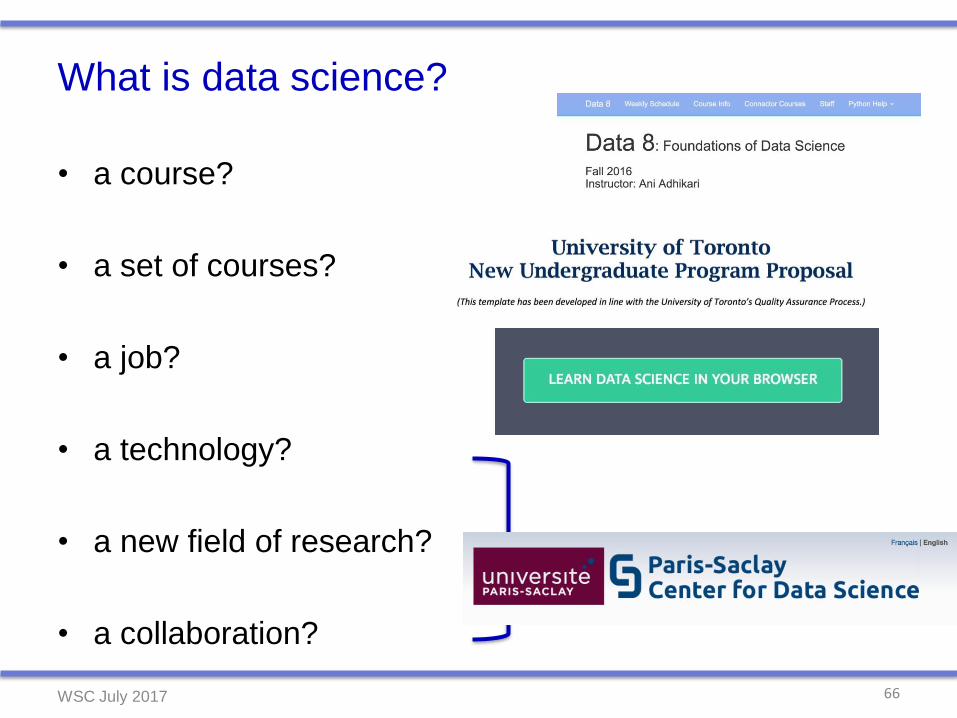
What is data science?
• a course?
• a set of courses?
• a job?
• a technology?
• a new field of research?
• a collaboration?
67WSC July 2017
Data Science Program(s) JHU DSS
• mathematical reasoning
• statistical theory
• statistical and machine learning methods
• programming and software development
• algorithms and data structure
• communication results and limitations
68WSC July 2017
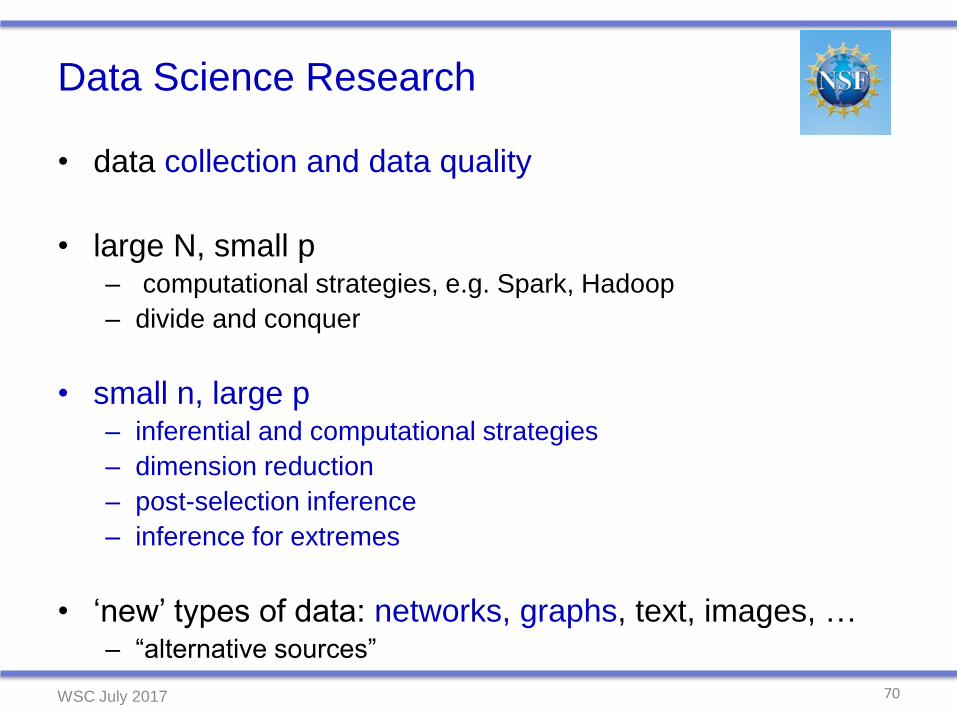
Data Science Research
• data collection and data quality
• large N, small p – computational strategies, e.g. Spark, Hadoop
– divide and conquer
• small n, large p – inferential and computational strategies
– dimension reduction
– post-selection inference
– inference for extremes
• ‘new’ types of data: networks, graphs, text, images, …– “alternative sources”
70WSC July 2017
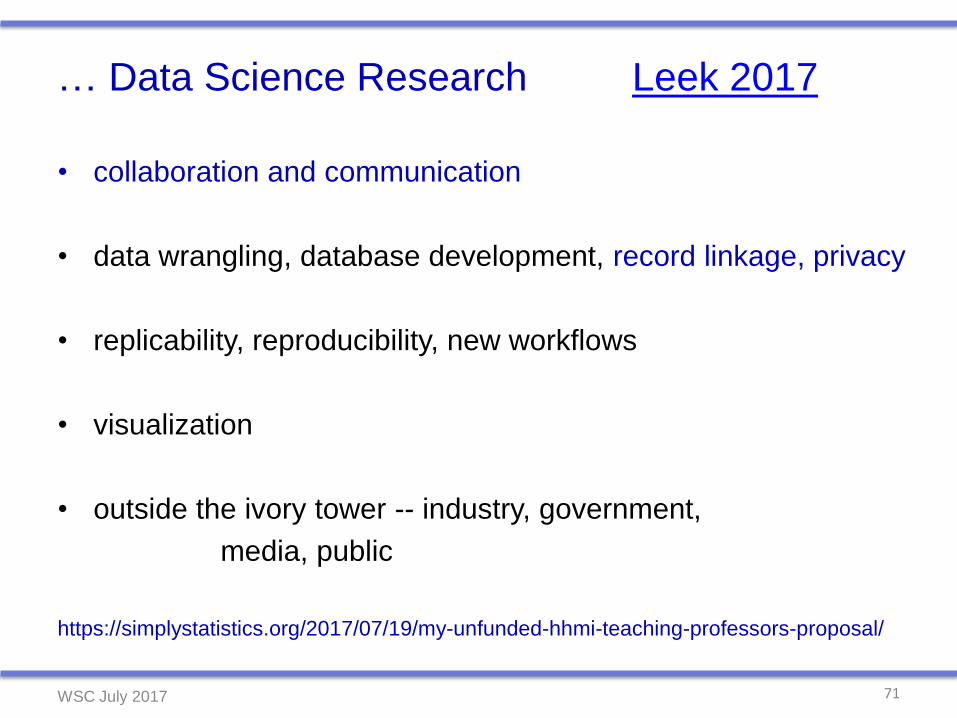
… Data Science Research Leek 2017
• collaboration and communication
• data wrangling, database development, record linkage, privacy
• replicability, reproducibility, new workflows
• visualization
• outside the ivory tower -- industry, government,
media, public
https://simplystatistics.org/2017/07/19/my-unfunded-hhmi-teaching-professors-proposal/
71WSC July 2017
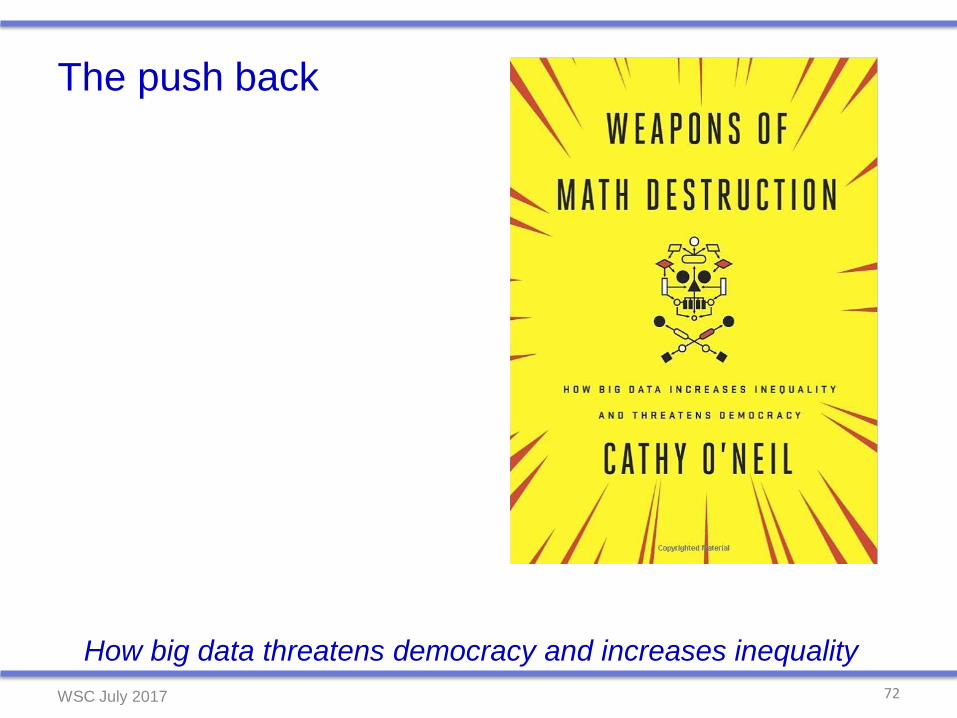
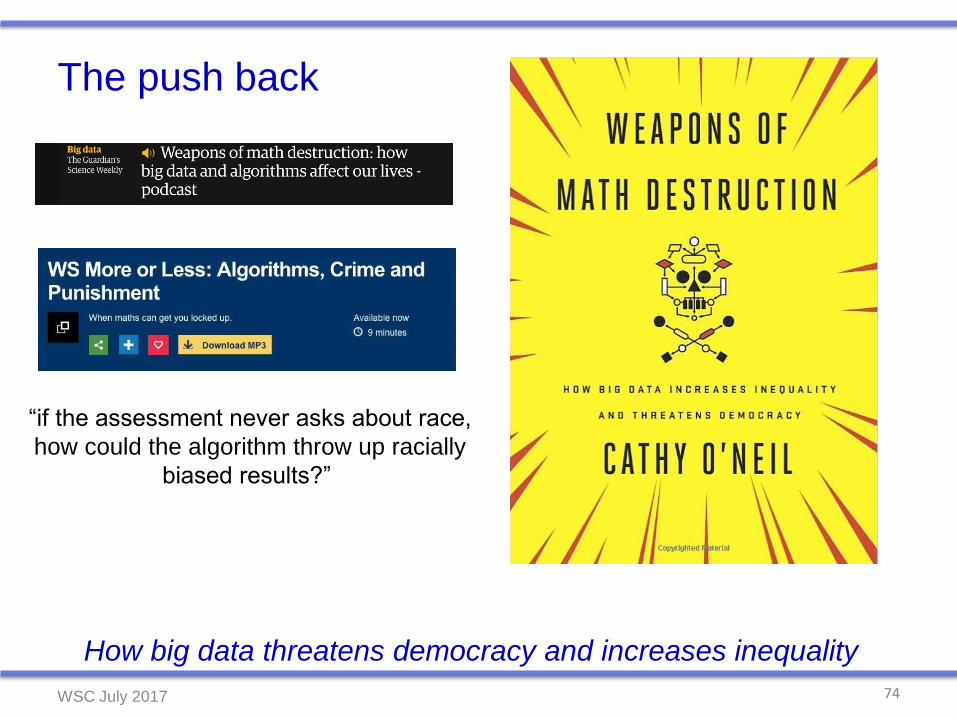
The push back
72
How big data threatens democracy and increases inequality
WSC July 2017
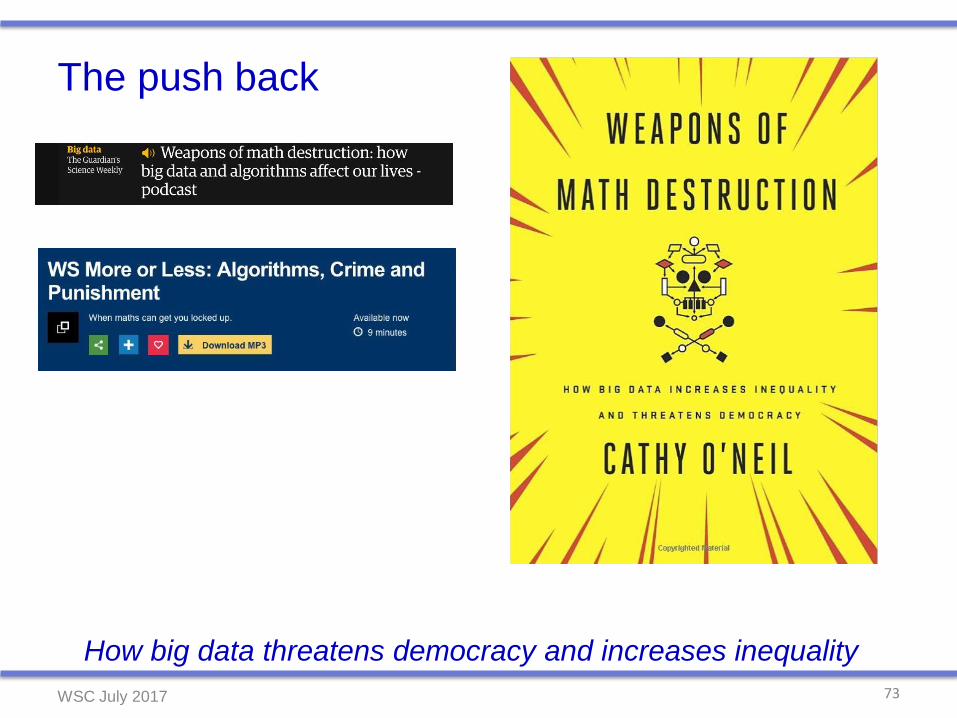
The push back
73
How big data threatens democracy and increases inequality
WSC July 2017
The push back
74
How big data threatens democracy and increases inequality
“if the assessment never asks about race,
how could the algorithm throw up racially
biased results?”
WSC July 2017
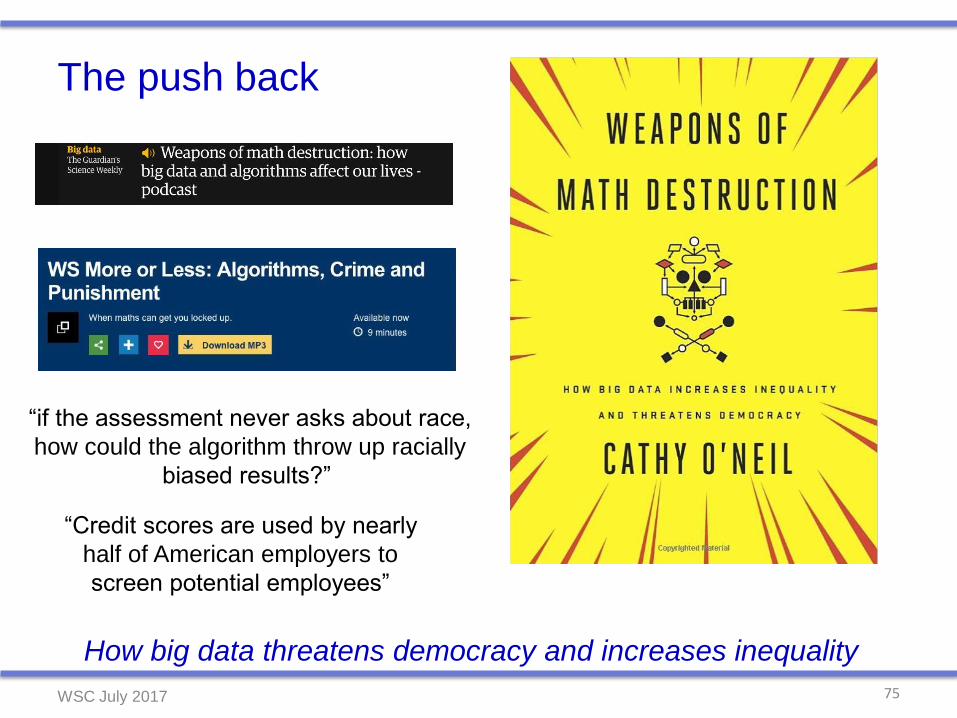
The push back
75
How big data threatens democracy and increases inequality
“if the assessment never asks about race,
how could the algorithm throw up racially
biased results?”
“Credit scores are used by nearly
half of American employers to
screen potential employees”
WSC July 2017
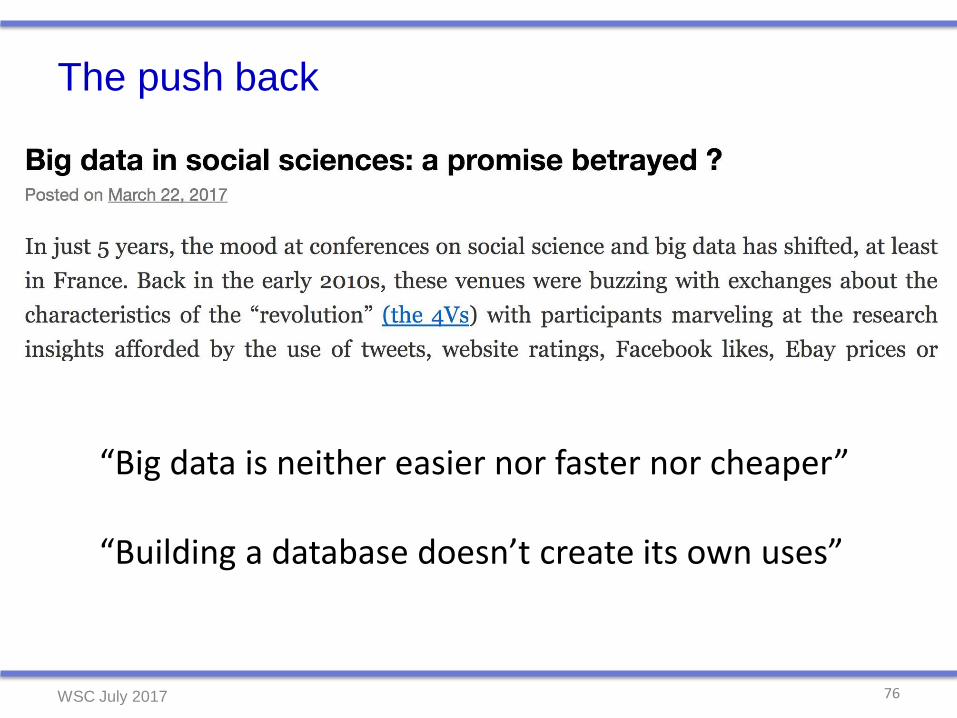
The push back
76WSC July 2017
“Big data is neither easier nor faster nor cheaper”
“Building a database doesn’t create its own uses”
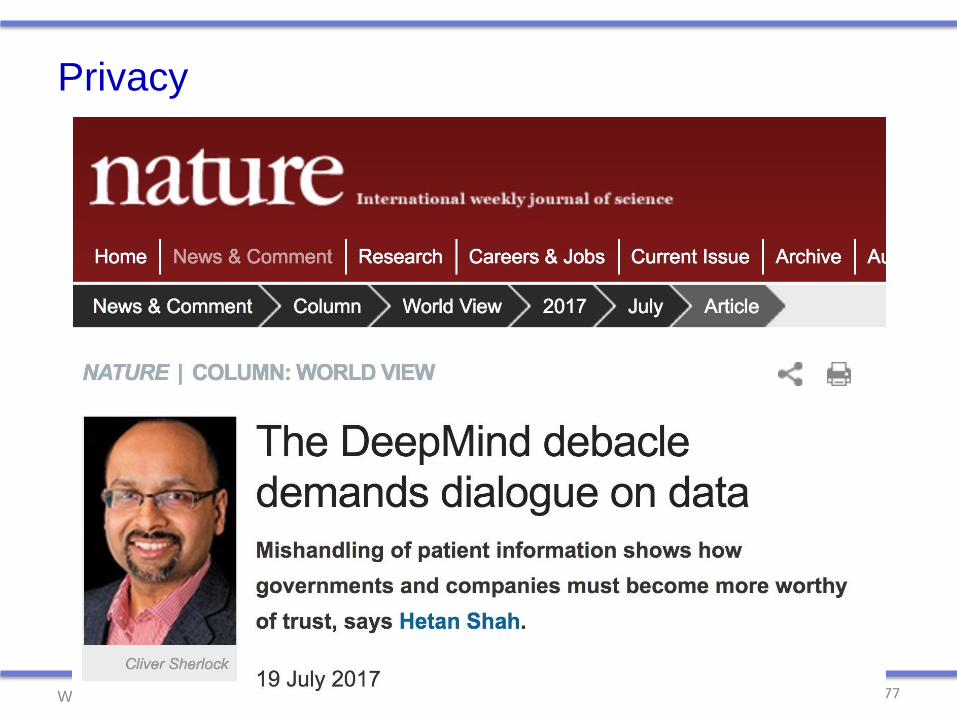
Privacy
WSC July 2017 77
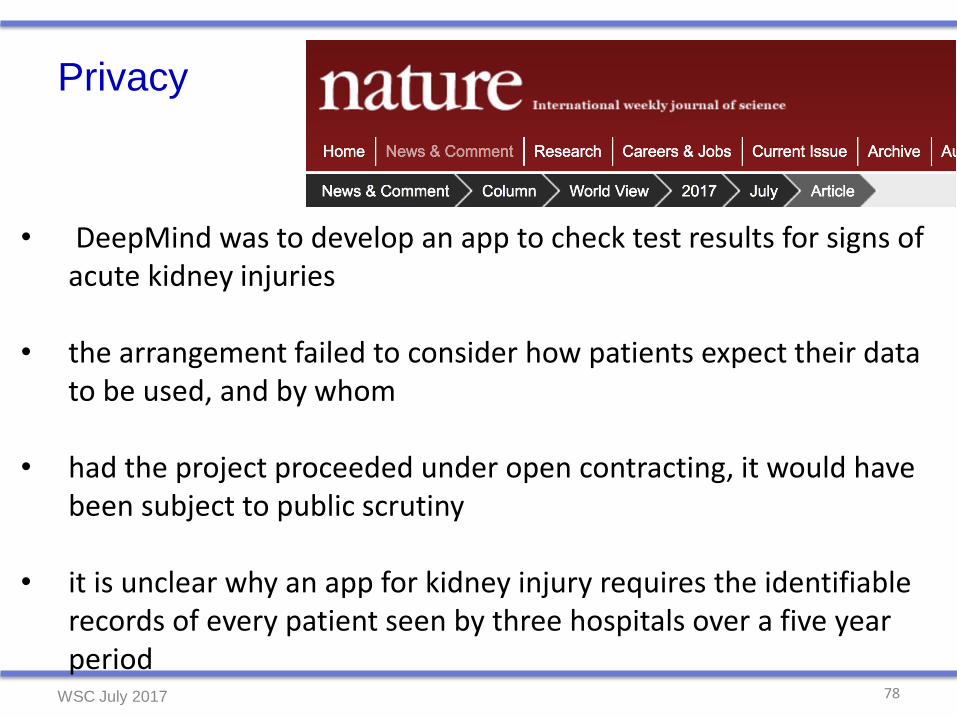
Privacy
WSC July 2017 78
• DeepMind was to develop an app to check test results for signs of acute kidney injuries
• the arrangement failed to consider how patients expect their data to be used, and by whom
• had the project proceeded under open contracting, it would have been subject to public scrutiny
• it is unclear why an app for kidney injury requires the identifiable records of every patient seen by three hospitals over a five year period
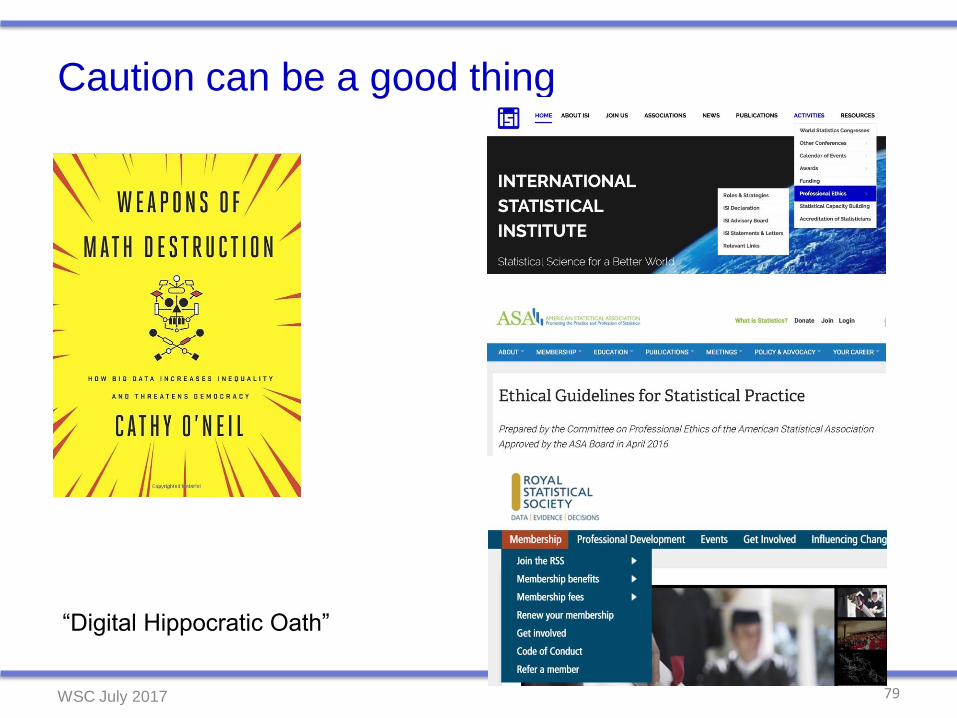
Caution can be a good thing
79
“Digital Hippocratic Oath”
WSC July 2017
Caution can be a good thing
80
“…from data we will get the cure for cancer as well as
better hospitals;
schools that adapt to children’s needs making them
happier and smarter;
better policing and safer homes;
and of course jobs.”
Guardian 2 July 2016
WSC July 2017
Thank You!
WSC July 2017
Thank You!
WSC July 2017