62:1 (2013) 33–40 | www.jurnalteknologi.utm.my | eISSN 2180–3722 | ISSN 0127–9696
Full paper Jurnal
Teknologi
Big Data Processing and Mining for the future ICT-based Smart Transportation Management System Jelena Fiosina, Maxims Fiosins, Jörg Müller
Clausthal University of Technology, Institute of Informatics, Julius-Albert Str. 4, D-38678, Clausthal-Zellerfeld, Germany
*Corresponding author: {Jelena.Fiosina, Maksims.Fiosins}@gmail.com, [email protected]
Article history
Received :11 September 2012 Received in revised form :
21 February 2013
Accepted :15 April 2013
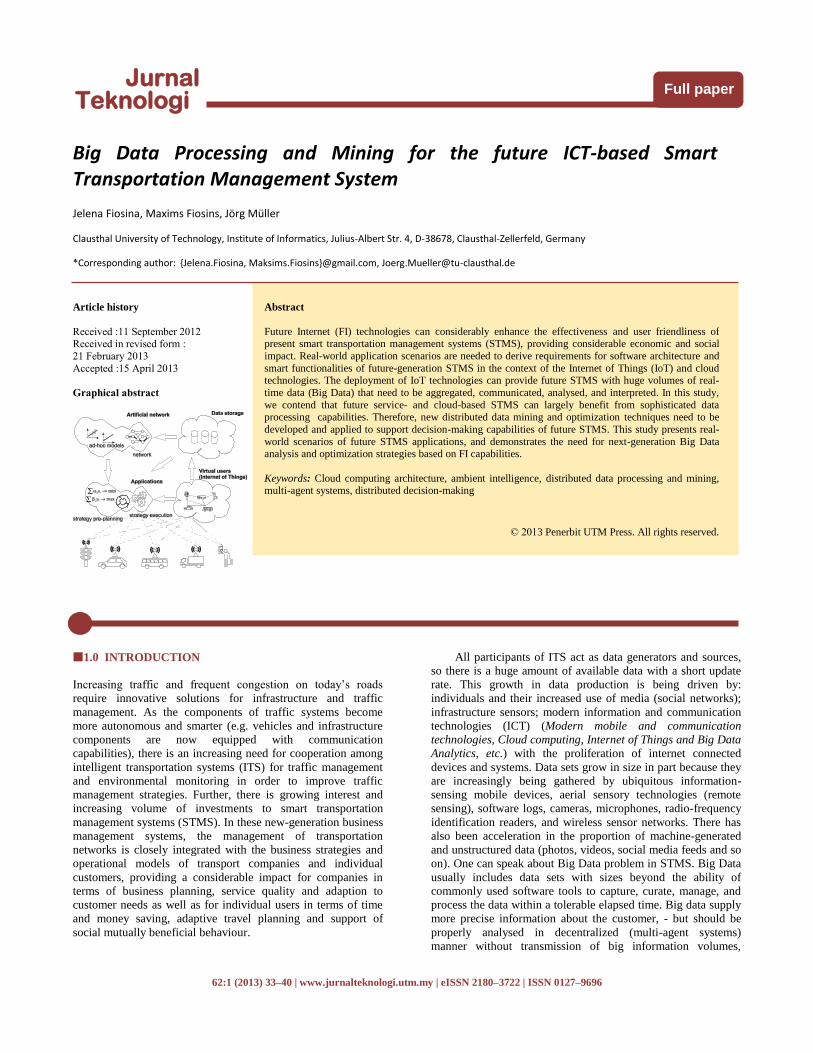
Graphical abstract
Abstract
Future Internet (FI) technologies can considerably enhance the effectiveness and user friendliness of present smart transportation management systems (STMS), providing considerable economic and social
impact. Real-world application scenarios are needed to derive requirements for software architecture and
smart functionalities of future-generation STMS in the context of the Internet of Things (IoT) and cloud technologies. The deployment of IoT technologies can provide future STMS with huge volumes of real-
time data (Big Data) that need to be aggregated, communicated, analysed, and interpreted. In this study,
we contend that future service- and cloud-based STMS can largely benefit from sophisticated data processing capabilities. Therefore, new distributed data mining and optimization techniques need to be
developed and applied to support decision-making capabilities of future STMS. This study presents real-
world scenarios of future STMS applications, and demonstrates the need for next-generation Big Data analysis and optimization strategies based on FI capabilities.
Keywords: Cloud computing architecture, ambient intelligence, distributed data processing and mining, multi-agent systems, distributed decision-making
© 2013 Penerbit UTM Press. All rights reserved.
1.0 INTRODUCTION
Increasing traffic and frequent congestion on today’s roads
require innovative solutions for infrastructure and traffic
management. As the components of traffic systems become
more autonomous and smarter (e.g. vehicles and infrastructure
components are now equipped with communication
capabilities), there is an increasing need for cooperation among
intelligent transportation systems (ITS) for traffic management
and environmental monitoring in order to improve traffic
management strategies. Further, there is growing interest and
increasing volume of investments to smart transportation
management systems (STMS). In these new-generation business
management systems, the management of transportation
networks is closely integrated with the business strategies and
operational models of transport companies and individual
customers, providing a considerable impact for companies in
terms of business planning, service quality and adaption to
customer needs as well as for individual users in terms of time
and money saving, adaptive travel planning and support of
social mutually beneficial behaviour.
All participants of ITS act as data generators and sources,
so there is a huge amount of available data with a short update
rate. This growth in data production is being driven by:
individuals and their increased use of media (social networks);
infrastructure sensors; modern information and communication
technologies (ICT) (Modern mobile and communication
technologies, Cloud computing, Internet of Things and Big Data
Analytics, etc.) with the proliferation of internet connected
devices and systems. Data sets grow in size in part because they
are increasingly being gathered by ubiquitous information-
sensing mobile devices, aerial sensory technologies (remote
sensing), software logs, cameras, microphones, radio-frequency
identification readers, and wireless sensor networks. There has
also been acceleration in the proportion of machine-generated
and unstructured data (photos, videos, social media feeds and so
on). One can speak about Big Data problem in STMS. Big Data
usually includes data sets with sizes beyond the ability of
commonly used software tools to capture, curate, manage, and
process the data within a tolerable elapsed time. Big data supply
more precise information about the customer, - but should be
properly analysed in decentralized (multi-agent systems)
manner without transmission of big information volumes,
40 Issham Ismail et al. / Jurnal Teknologi (Sciences & Engineering) 62:1 (2013), 33–40
therefore should be store and managed in cloud-based
infrastructure and processed using cloud and grid computing
capabilities. Big data is decentralized (physically and logically) by its
nature centralized virtually, which means that all information
sources/storages are interconnected, and any piece of
information can in principle be accessed by any component of
the system. This distributed big data volumes (very often)
created and managed in a decentralized fashion on the physical
(fabric) layer. This raises the information costs that should be
taken into account while accessing the information.
Thus, data mining and decision-making methods are
required to find an optimal balance between decentralized
information processing/decisions and costs of data
transfer/decision coordination. This creates a need to employ
innovative data mining and corresponding decision-making
algorithms to support STMS applications in finding, collecting,
aggregating, processing, and analysing information necessary
for optimal decision-making user behaviour strategies.
Modern ICT technologies including cloud computing are
developed to solve those problems in the more effective way.
All of those approaches cannot solve these problems themselves
and need the data volumes to be processed and big data
processing and mining (BDMP) methods to be developed. Such
methods help to store data in compact way (clustering) by
dimension reduction finding rules in data behavior by predictive
modeling, filtering and detecting outliners by change point
analysis.
Innovative cloud services can be created using the cloud
capabilities of future Internet (FI) to access smart objects via the
Internet of Things (IoT). This development can enable wide
access to necessary information, because all of this data will be
available in-the-cloud. Cloud computing paradigm based on
highly scalable computing resources, often configured as a
distributed system, provides BDPM framework with big storage
and fast computing capabilities. However, implementing a
traffic cloud is far from easy. From an end user’s point of view,
the complexity of data and algorithms is hidden in the cloud.
Users (ranging from traffic authorities to car drivers and
automated components) expect to work with relatively simple
applications on the Internet via mobile or embedded devices.
These devices are fully connected and can (theoretically) use all
the information available from all other users and system
elements. This creates great opportunities for coordinated near-
optimal management of the infrastructure (e.g. in terms of load
balancing).
The contribution of this study is fourfold: First, we analyse
related cloud-based architectures and STMS scenarios. Second,
we consider architectures for implementing the corresponding
data analysis and optimization of mobility operations. Third, we
discuss the employment of appropriate mathematical methods
for three use-cases; fourth, we point out and discuss work
directions and opportunities in the area of cloud-enabled STMS.
The remainder of this paper is organized as follows.
Section 2 reviews state of the art in the area of FI and cloud
architecture for mobility application. In Section 3, we review
Big Data data processing and mining (BDPM) methods
application to STMS. In Section 4, we present a cloud-based
data flow architecture for mobility networks. In Section 5, we
propose and analyse three application scenarios of STMS and
consider data analysis and optimization of participants’
behaviour strategies in traffic systems. Section 6 contains
experimental results. Section 7 concludes and discusses future
research opportunities.
2.0 STATE OF THE ART
2.1 Motivation and applications
A strong worldwide interest in opportunities in transportation
and mobility field has spurred the need for further analysing
these FI opportunities. In Europe, FI and IoT research has been
a priority direction for the 7th European Framework Programme
(FP7) and will continue to do so for the upcoming Horizon 2020
Programme (e.g. the objectives ’A reliable, smart and secure
IoT for Smart Cities’ or ’Integrated personal mobility for smart
cities’ in FP7 or ’Substantial improvements in the mobility of
people and freight’ in Horizon 2020). These research questions
are motivated and co-funded by private companies and
municipalities from the areas of transport, logistics,
communication and traffic management (e.g. the FP7 project
Instant Mobility [1]). These stakeholders understand the
possible enhancements to existing systems that new
technologies can provide to STMS. Research in this area is still
largely at the stage of formulation of scenarios and coordination
protocols.
In recent years, Big Data has become a major topic in the
field of ICT worldwide. It is evident that Big Data means
business opportunities, but also major research challenges.
According to McKinsey & Co [45] and Gartner [46] Big Data
is “the next frontier for innovation, competition and
productivity”. While US-based companies, including SMEs, are
widely recognized for their activities in Big Data, very few
research organizations, are known for their activities and
initiatives in this field in Europe. Analytical Big Data services
for SME's within Europe are currently non-existing. According
to EU White papers [44], there are currently a number of
initiatives aimed at adjusting the research landscape to lodge the
rapid changes taking place in the processing of data under the
current and seventh framework programme for Research and
Innovation. There are a number of projects addressing a vast set
of topics ranging from content creation and processing, "Big
Data" analytics and real-time processing. In Horizon 2020, Big
Data finds its place both in the Industrial Leadership, for
example in the activity line “Content technologies and
information management", and the Societal Challenges, relating
to the need for structuring data in all sectors of the economy
(health, climate, transport, energy, etc.). Not surprisingly, Big
Data is also important to the Excellent Science priority of
Horizon 2020, especially on scientific infrastructures and
development of innovative high value added services.
STMS development is connected with Big data processing,
therefore it is an important application domain for BDPM
methods. Let us describe the STMS applications that are
considered today as actual in the context of implementing FI
technologies. First of all it is personal travel companion, which
intends to provide to travellers, surface vehicle drivers and
transports operators the benefits of dynamic planning and
follow-up of multimodal journeys. The second very important
problem considered by many authors is smart city logistics
operations, which intends to provide benefits to actors and
stakeholders involved in, affected by or dependent on the
transportation of goods in urban environments.
2.2 Future ICT technologies
Future Internet (FI) technologies can enhance modern TMS and
provide large-scale infrastructures for high-performance
computing that are ’elastic’ in nature, by adapting to user and
application needs, [10].
41 Issham Ismail et al. / Jurnal Teknologi (Sciences & Engineering) 62:1 (2013), 33–40
Modern mobile and communication technologies such as
wireless transmission, mobile Internet, mobile sensors as well as
mobile devices (e.g. smart phones) serve as a good platform to
the future generation of ITS. In recent years, vehicles are
equipped with mobile devices with relatively powerful
communication and processing capabilities as well as with
sensors that provide various information about the environment.
Constant Internet connection using 3G or 4G mobile Internet is
nowadays usual and is favorable from price and quality point of
view. This means that many traffic participants are already
online and interconnected with rapidly growing trend; the
problem is how to use this connection in order to provide
efficient and reliable on-demand services to traffic participants.
Ambient intelligence (AmI) is a concept of interconnection
of sensors and computational resources and using of artificial
intelligence methods in order to improve everyday life. An
architecture of AmI-enabled STMS is proposed in [8]. It
supports virtual control strategists and management policy
makers in decision-making and is modelled using the metaphor
of autonomous agents. AmI is defined as the ability of the
environment to sense, adapt, and respond to actions of persons
and objects that inhabit its vicinity. Moreover, the multi-agent
system (MAS) paradigm makes AmI environments act
autonomously and socially, featuring collaboration, cooperation,
and even competitive abilities. Other examples of AmI
implementation are intelligent home or intelligent power grids.
MASs contain multiple autonomous self-interesting
software entities, called agents. Agents percept information
from the environment, create their own local data models and
then make decisions according to their goals and available
information. Decisions are then converted to actions, which
influence the environment. Agents can interact and cooperate on
the level of information models (data or model parameter
exchange) or on the level of actions (action coordination, group
formation). MASs provide a model of a system with intelligent
behavior are a very good tool for the representation of complex
distributed systems such as STMS.
Cloud computing systems are oriented towards a high level
of interaction with their users, real-time execution of a large
number of applications, and dynamic provisioning of on-
demand services. In this study, we consider the layered
architecture of cloud-based computing systems presented in [6].
It supports a class of specialized distributed systems that is
characterized by a high level of scalability, service
encapsulation, dynamic configuration, and delivery on demand.
Beside that transport infrastructure can be considered as a
service, which studies capabilities how to use FI technologies
such as cloud data storage, cloud computing virtualization or
services-in-the-cloud. The complexity of cloud-based systems is
hidden from end users.
Agent-based cloud computing is a paradigm that identifies
several common problems and provides several benefits by the
synergy between MASs and cloud computing. Cloud computing
is mainly focused on the efficient use of computing
infrastructure through reduced cost, service delivery, data
storage, scalable virtualization techniques, and energy
efficiency. In contrast, MAS are focused on intelligent aspects
of agent interaction and their use in developing complex
applications. In particular, cloud computing can offer a very
powerful, reliable, predictable and scalable computing
infrastructure for the execution of MASs by implementing
complex, agent-based applications for modeling and simulation.
On the other hand, software agents can be used as basic
components for implementing intelligence in clouds, making
them more adaptive, flexible, and autonomic in resource
management, service provisioning and large-scale application
executions [10].
The Internet of Things (IoT) provides a new approach for
virtual representation of the vehicles in the cloud-based STMS.
It is a very important aspect for constructing of a cloud-based
systems [12]. IoT semantically means a world-wide network of
interconnected objects (radio frequency identification (RFID),
infrared sensor (IR sensor), global positioning System (GPS),
laser scanner, etc) uniquely addressable, that ensure the
exchange and sharing of information in STMS. The basic idea
of this concept is the pervasive presence around us of a variety
of things or objects – such as (RFID) tags, sensors, actuators,
mobile vehicles, etc. – which, through unique addressing
schemes, are able to interact with each other and cooperate with
their neighbors to reach common goals. The development of IoT
based on Electronic Product Code (EPC) and RFID brings a
good opportunity for STMS. At first, EPC assigns a unique
electronic code for each traffic tool, ensuring the identification
uniqueness for them similar to license plate. And then, RFID is
a non-contact automatic identification technique and can
identify traffic tools automatically and obtain related data via
radio frequency signal. IoT provides for STMS two main things:
1) its data acquisition function provides more comprehensive
traffic data; 2) provides a good channel for traffic data
transmission. Therefore, STMS based on IoT has broad
prospects of development and expansion space [12].
2.3 STMS architectures
The first cloud-based traffic network architectures have been
proposed in [7], which employ ambient intelligence (AmI) [8]
or IoT components [6], [7].
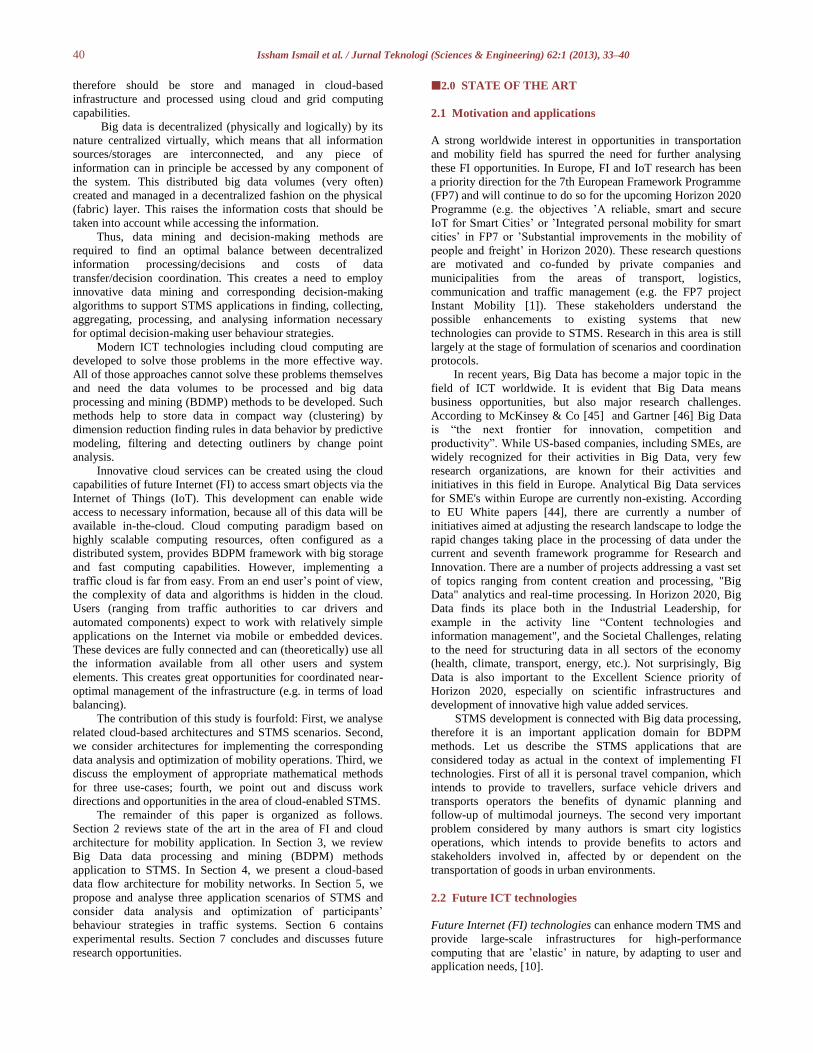
Figure 1 V-cloud architecture
V-cloud architecture was proposed in [9], which considers
cloud computing in STMS from the point of device,
communication and service level. It facilitates the interaction
between vehicle drivers and outside car world, taking into
account vehicle-to vehicle (V2V) and vehicle-to infrastructure
(V2I) interactions to share and utilize external resources in a
more effective way.
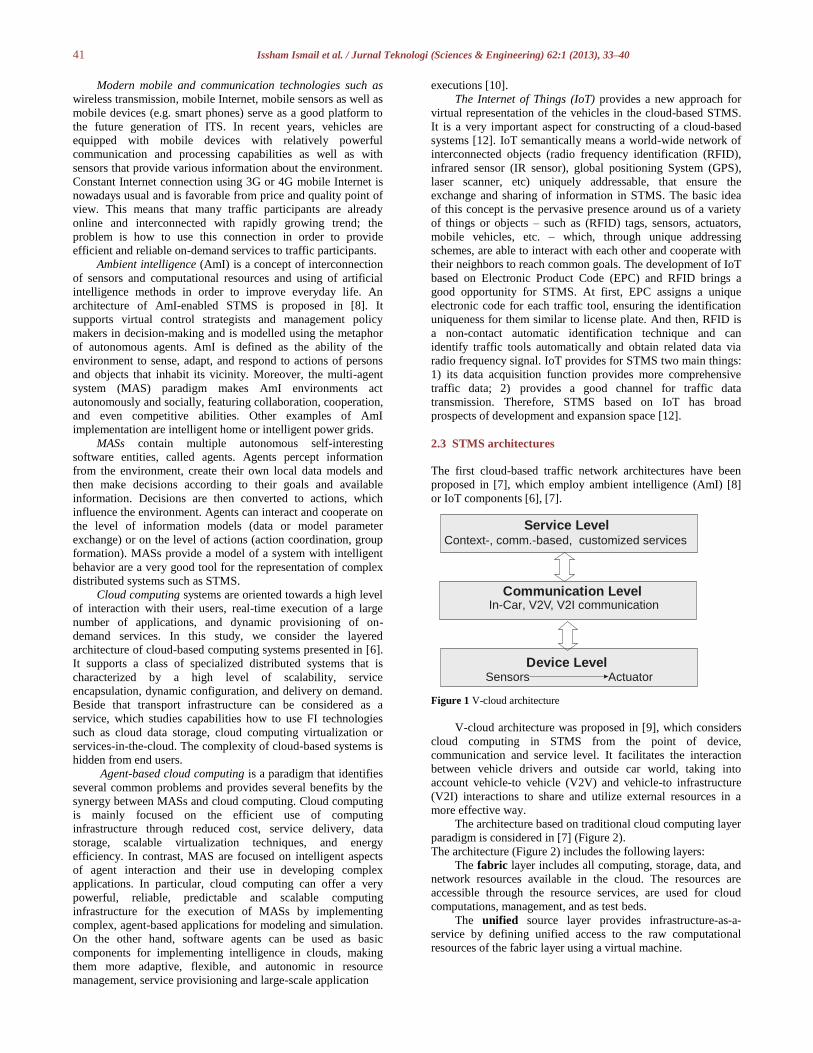
The architecture based on traditional cloud computing layer
paradigm is considered in [7] (Figure 2).
The architecture (Figure 2) includes the following layers:
The fabric layer includes all computing, storage, data, and
network resources available in the cloud. The resources are
accessible through the resource services, are used for cloud
computations, management, and as test beds.
The unified source layer provides infrastructure-as-a-
service by defining unified access to the raw computational
resources of the fabric layer using a virtual machine.
Service Level
Communication Level
Device Level
In-Car, V2V, V2I communication
Sensors Actuator
Context-, comm.-based, customized services
42 Issham Ismail et al. / Jurnal Teknologi (Sciences & Engineering) 62:1 (2013), 33–40
Figure 2 Cloud-based STMS architecture
The platform layer provides platform-as-a-service,
including a collection of specialized tools, middleware, and
services on the top of unified resources to create a deployment
platform (e.g. scheduling create service and artificial test beds).
The application layer contains all applications that are run
in the cloud. Application execution in the cloud is distributed:
applications can be partly executed on the client, partly in the
cloud.
The application of cloud-based architectures for STMS is
demonstrated in [7]. In order to provide an acceptable level of
service, a cloud-based STMS consists of two main components:
an application component, which provides dynamic services and
runs all the cloud applications; and a digital (simulated) traffic
network component, which performs constant information
collection and processing in order to provide in-time data. A
cloud-based STMS adapts its decisions by using available
information and by interacting with human as well as automated
traffic participants.
The logical architecture of ICT-enable STMS was
considered in [11], which data and computations can use traffic
clouds. The research centres on the ACP (artificial,
computational, parallel) approach. This approach involves
modelling with artificial systems, analysis with computational
experiments, and operation through parallel execution for
control and management of complex systems with social and
behavioural dimensions. They present an ACP -based
framework that is a generalization of the feedback control
mechanism in the control theory. The actual system and its
artificial counterparts can be connected in various modes
(learning and training, experimentation and evaluation, control
and management) for different purposes (Figure 3). Artificial
transportation system is developed to create a dynamic or
‘living’ ontology to present and organize transportation
knowledge, such as methods, algorithms, regulations, and case
studies, in a way that’s effective for search and ready for
computing and implementation. By comparing and analysing
real and simulated behaviours, systems’ future actions can be
learned and predicted; control and management strategies for
their operations can be accordingly planed and modified. The
most interesting mode for our study is the Learning and
Training mode. In this mode, the artificial systems serve mainly
as a data centre for learning operational procedures and for
training operators and administrators (Figure 4).
Figure 3 Another cloud-based STMS architecture
Figure 4 Architecture of the Learning and Training block
In [25] the following data processing stages in a typical
cloud-based TMS are described. We applied our experience in
implementing data processing, mining [3], [2], and decision-
making methods [4], [5] for existing transportation problems.
We present another BDPM oriented cloud-based STMS
architecture.
3.0 DDPM in STMS
The DDPM become one of the major research topics in
information systems after the growth of the networks
connectivity, and the data volume as well. Classical methods of
data processing and mining are centralized: this means that in
order to apply them, data should be available here and now.
However it is not the case in modern information systems,
including cloud-based STMS: huge volumes of data are
collected in physically distributed storages, and it is not feasible
or even impossible to collect all data in one place. Additional
feature of data is its constant update. This means that there is an
inherent need to develop effective BDPM algorithms that take
into account space and time distribution of data. In the context
of agent-based cloud computing, this problem is especially
actual, as volumes of available distributed data rapidly grow.
3.1 DDPM methods
Analyzing and processing Big Data is now feasible both
from a technical and cost perspective. Many big data
frameworks are built around an understanding of business
mechanics, analysis of the business strategy, identifying value
and correlation in unstructured and structured data, data mining,
predictive analysis and cost effective data [].Modern ICT
technologies are developed to solve those problems in the more
effective way. All of those approaches cannot solve these
problems themselves and need the data volumes to be processed
and big data processing and mining (BDMP) methods to be
developed. Such methods help to store data in compact way
(clustering) by dimension reduction finding rules in data
behavior by predictive modeling, filtering and detecting
Application layer
Platform layer
Unified source layer
artificial traffic system, virtual user agents, test beds
Virtual machine(s), uniform data access
intelligent service and management agents
Fabric layer
traffic participants, data storage, computing resources, network
management
servicesservices
services
servicesmanagement
Actual Transp. Sys. Actificial Transp. Sys.
Control & Management
Experimentation &Evaluationt
Leaarning &Training
Performance Evaluation
Traffic Simulation
Decision Generation
Experiment Design
Data SupportCenters
43 Issham Ismail et al. / Jurnal Teknologi (Sciences & Engineering) 62:1 (2013), 33–40
outliners by change point analysis. The BDPM methods on
which the project is focused are listed below:
Regression analysis is a set of statistical techniques to
determine how the value of the dependent variable changes
when one or more independent variables are modified. The
methods of regression analysis are the most widely used
statistical tools for discovering the relationships among
variables are often used for forecasting or prediction [47].
Time series analysis is the process of using statistical
techniques to model and explain a time-dependent series of data
points. Time series forecasting is the process of using a model to
generate predictions (forecasts) for future events based on
known past events. Time series data has a natural temporal
ordering - this differs from typical data mining/machine learning
applications where each data point is an independent example of
the concept to be learned, and the ordering of data points within
a data set does not matter […].
Cluster analysis is a statistical method for classifying
objects that splits a diverse group into smaller groups of similar
objects, whose characteristics of similarity are not known in
advance. This is a type of unsupervised learning because
training data are not used. This technique is in contrast to
classification, a type of supervised learning […].
Classification is a set of techniques to identify the
categories in which new data points belong, based on a training
set containing data points that have already been categorized.
These techniques are often described as supervised learning
because of the existence of a training set; they stand in contrast
to cluster analysis, a type of unsupervised learning [..].
Change-point analysis is a powerful new tool for outliner
detection determining whether a change has taken place. It is
capable of detecting subtle changes, it better characterizes the
changes detected by providing confidence levels and confidence
intervals. Change-point analysis is preferable processing
historical data, especially when dealing with large data sets. A
change-point analysis is powerful, well characterizes the
changes, controls the overall error rate, is robust to outliers, is
more flexible and is simpler to use […].
The BDMP become one of the major research topics in
information systems after the growth of the networks
connectivity. Classical methods of data processing and mining
are centralized: this means that in order to apply them, data
should be available here and now. In modern information
systems Big Data are constantly updated and collected in
physically distributed storages. Using the centralized approach
the system cannot adapt quickly to situations in real time, and it
is very difficult or simply impossible to transmit a large amount
of information over the network and to store, manage and
process large data sets in one location [15], [5]. In addition some
nodes of the distributed system prefer relay mostly of their own
experience in the prediction process. Therefore there is an
inherent need to develop effective BDMP algorithms using
decentralised architecture that take into account space and time
distribution of data.
3.2 MAS in BDPM
Usually MAS represents a complex system, which consists of a
large number of autonomous interacting components. Such
systems are usually characterized by huge volumes of
distributed data from various sources. One of the key challenges
in MASs is the capability of agents to process and mine such
distributed data in order to provide sufficient information for
optimal decisions.
BDPM provides algorithmic solutions for data analysis in a
distributed manner to detect hidden patterns in data and extract
the knowledge necessary for decentralised decision-making
[19], [20]. BDPM methods improve agent intelligence and MAS
performance [21], involving pro-active and autonomous agents
that perceive their environment, dynamically reason out actions
on the basis of the environment, and interact with each other.
Furthermore, the coupling of MAS with BDPM may be
described in terms of ubiquitous intelligence [22], with the aim
of fully embedding information processing into everyday life.
This concept is very similar to the architecture of data clouds,
where data and services are virtualised and provided on demand.
Some researchers describe a special type of agents that
perform BDPM. Klusch at al. [23] concludes that autonomous
data mining agents, as a special type of information agents, may
perform various kinds of mining operations on behalf of their
user(s) or in collaboration with other agents. Systems of
cooperative information agents for data mining in distributed,
heterogeneous, or homogeneous, and massive data
environments appear to be quite a natural progression for the
current systems to be realised in the near future.
Although the agents in MAS can be intelligent and
powerful enough to perform data processing operations
themselves. In many complex domains, the knowledge of agents
is a result of the outcome of empirical data analysis in addition
to the pre-existing domain knowledge. BDPM of agents often
involves detecting hidden patterns, constructing predictive and
clustering models, identifying outliers, etc. This collective
’intelligence’ of MAS must be developed by distributed domain
knowledge and analysis of the distributed data observed by
different agents. They collaborate to exchange knowledge that is
extracted from data at different geographically distributed
network nodes, creating as a result a distributed model of the
environment – collective knowledge of the agents [21].
Usually MASs (not cloud computing MASs) represent a
system, where communication is expensive and not possible
between all nodes. So usually BDPM for MAS suppose
computations with minimum network communication and
maximum local computations, if possible. Local computation is
carried out on each node, and either a central node
communicates with each distributed node to compute the global
models or a peer-to-peer (P2P) architecture is used. In the case
of the P2P architecture, individual nodes might communicate
with a resource-rich centralised node, but they perform most
tasks by communicating with neighbouring nodes through
message passing over an asynchronous network [21]. In our
works we demonstrated that properly established distributed
BDPM may provide almost the same quality of the models as
centralized traditional methods.
<Typically, communication involves bottlenecks. Since
communication is assumed to be carried out exclusively by
message passing, the primary goal of several BDPM methods,
as mentioned in the literature, is to minimise the number of
messages sent. Building a monolithic database in order to
perform non-distributed data processing and mining may be
infeasible or simply impossible in many applications. The costs
of transferring large blocks of data may be very expensive and
result in very inefficient implementations [24].>
Following [13], the benefits of using MASs for BDPM are
the following: 1) remaining the autonomy of data sources; 2)
facilitating interactive BDPM; 3) improving dynamic selection
of sources and data gathering; 4) having high scalability to
massive distributed data; 5) stimulating multi-strategy BDPM;
6) enabling collaborative BDPM.
3.3 CC in DDPM
44 Issham Ismail et al. / Jurnal Teknologi (Sciences & Engineering) 62:1 (2013), 33–40
As we discussed above, cloud computing architecture is
characterized by close integration of its users to the system and
creating of their virtual representations in terms of IoT. As there
is a large amount of data associated with each user and data is
stored in the cloud, cloud computing systems automatically gets
huge amounts of user data in the system. This data is used as
source data and is initially natively distributed by users.
However in contrast with the systems described in the previous
section, the virtual users are fully connected and each piece of
data can be accessed from other parts of the system.
The users of the cloud system usually have limited
computational capacity because often they are connected to the
cloud using mobile devices. So data processing is made by other
agents, which collect information from users and store in the
cloud. So the major issues of the BDPM are the workload and
the communication cost. The implementing of cloud computing
will handle a lots of this work load because of the high
connectivity of these data agents/centres [14].
So the main difference between BDPM for “pure” MASs
and for cloud computing is in dealing with communication. In
the first case communication should be avoided if possible and
was considered as a bottleneck. In the second case the
communication is broadly available; the methods of BDPM for
cloud computing should know which information and where is
available. Instead of communication, the bottleneck is
computation: usually more information is available that we are
able to process. So another challenge is quality of the
information: which one should be taken into account first.
This means that data processing and mining remains
distributed when applied to cloud computing. However the
question of the information availability will be replaced by a
question of the information cost, which takes into account such
factors as the information availability, speed of its extraction,
quality, reliability, etc. This is why we call the methods of
BDPM in cloud computing semi-distributed (SBDPM): they
deal with information, which is physically distributed, but is
available subject to costs.
Another challenge of SBDPM is common BDPM. There is
a big number of cloud computing system users, which have
similar but distinct requests to the cloud computing system. This
means that BDPM should be done for similar characteristics
(e.g. travel time) based on similar data in cloud computing
system, however taking into account individual data and
characteristics of user (e.g. its vehicle type and current route
information). For this purpose, different levels of data
processing should be done and characteristics pre-calculated and
then they should be efficiently combined with actual user data.
The big challenge of the SBDPM is the parallelism use the
calculation power to gain a precious time, the use of the cloud
computing brings the ability of use many powerful
interconnected servers with multi core processors without
needing to implement it physically in every user’s environment.
There are the following benefits of using SBDPM in cloud
environments: 1) virtual integration of data sources into system
without physical integration; 2) supporting availability of
massive distributed data for BDPM; 3) facilitating cost-based
selective BDPM; 4) stimulating multi-objective BDPM; 5)
supporting multi-stage BDPM and different levels of data
processing; 6) enabling common BDPM.
3.4 DDPM trend: Computational statistics
Cloud computing platform facilitates the data collection
and provides the necessary resources for the operation of the
computationally intensive methods of computational statistics.
Computational statistics is the interface between statistics
and computer science. It is the area of computational science
specific to the mathematical science of statistics. Computational
statistics is aiming at the design of algorithm for implementing
statistical methods on computers, including the ones unthinkable
before the computer age (e.g. bootstrap, simulation), as well as
to cope with analytically intractable problems.
The methods of computational statistics are modern
methods, which are similar to the numerical methods for
calculus [26]. Computational statistics supposes an application
of iterative calculations instead of complex analytical models by
using available data in different combinations. The resulting
solution of the problem is approximate; however in many
practical situations (small amount of available information,
complex and hierarchical structure of analyzed system,
dependency of data) this may give more robust and precise
results as classical methods. On the other hand, computational
statistics application is simple and does not require complex
statistical procedures
The term computational statistics may also be used to refer
to computationally intensive statistical methods including
resampling methods, Markov chain Monte Carlo methods, local
regression, kernel density estimation, artificial neural networks
and generalized additive models.
3.5 Core methods and problems of DDPM
Centralized/decentralized architectures
Let us describe the core methods and problems of BDPM
in traffic networks. In contemporary STMS, the modelling and
forecasting of traffic flow is one of the important techniques that
need to be developed [27]. It is a stochastic system in which a
lot of different factors should be estimated.
Traffic information generally goes through the following
three stages: data collection and cleansing, data fusion and
integration, and data distribution. The system presented in [28]
consists on three components, namely a Smart Traffic Agent,
the Real-time Traffic Information Exchange Protocol and a
centralised traffic information centre that acts as the backend.
There are several studies in which a centralised approach
is used to predict the travelling time. The approach was used in
various STMS, such as in-vehicle route guidance and advanced
traffic management systems. A good overview is given in [29].
To make the approach effective, agents should cooperate with
each other to achieve their common goal via so-called gossiping
scenarios. The estimation of the actual travelling time using
vehicle-to-vehicle communication without MAS architecture
was described in [30].
There are a lot of disadvantages of the centralized
approach. The system cannot adapt quickly to situations in real
time, and it is very difficult or simply impossible to transmit a
large amount of information over the network and to store and
process large data sets in one location. In addition, it is known
from practice that the most drivers rely mostly on their own
experience; they use their historical data to forecast the
travelling time [15], [5].
Thus, decentralised MASs with autonomous agents to
allow vehicles to make decisions autonomously are
fundamentally important for the representation of these
networks [27].
A combination of centralized and decentralized agent-
based approaches to the traffic control was presented in [35]. In
this approach, the agents maintain and share the ‘local weights’
for each link and turn, exchanging this information with a
centralized traffic information centre. The decentralised MAS
approach for urban traffic network was considered in [34] also,
45 Issham Ismail et al. / Jurnal Teknologi (Sciences & Engineering) 62:1 (2013), 33–40
where the authors forecast the traversal time for each link of the
network separately. Two types of agents were used for vehicles
and links, and a neural network was used as the forecasting
model.
We want to focus on the following problems of BDPM and
demonstrate the advantages of decentralized architecture.
Travel time forecasting: Predictive models
Travelling time factor that plays an important role in
transportation and logistics, and it can be applied in various
fields and purposes. From travellers’ viewpoints, the knowledge
about travelling time helps to reduce the travelling time and
improves reliability through better selection of travelling routes.
In logistics, accurate travelling time estimation could help to
reduce transport delivery costs and to increase the service
quality of commercial delivery by delivering goods within the
required time window by avoiding congested sections. For
traffic managers, travelling time is an important index for traffic
system operation efficiency [29].
A promising approach to agent-based parameter estimation
for partially heterogeneous data in sensor networks was
suggested in [33]. Another decentralised approach for
homogeneous data was suggested in [31] to estimate the
parameters of a wireless network by using a parametric linear
model and stochastic approximations.
A problem of decentralised travel time forecasting was
considered [2], [3], [18]. A MAS architecture with autonomous
agents was implemented for this purpose. A decentralised linear
[2], [18] and kernel density (KD) based [3], [18] multivariate
regression models were developed to forecast the travelling
time. The iterative least square estimation method was used for
regression parameter estimation, which is suitable for streaming
data processing. The resampling-based consensus method was
suggested for coordinated adjustment of estimates between
neighbouring agents. We illustrated the efficiency of the
suggested approach using simulation with real data from the
southern part of Hanover. The experiments show the efficiency
of the proposed approach. The prediction technique in tutorial
style was described in terms of distributed network intelligence
in [18]. The comparison of parametric and non-parametric
approaches for traffic-flow forecasting made in [39], shows the
efficiency of the non-parametric KD regression
Clustering traffic states
A problem of clustering was considered. The CST KD-
based methods were implemented [40], [41]. A MAS
architecture with autonomous agents was implemented for this
purpose. The resampling-based consensus method was
suggested for coordinated adjustment of estimates between
neighbouring agents. We illustrated the efficiency of the
suggested approach using simulation with real data from the
southern part of Hanover. The experiments show the efficiency
of the proposed approach. The most popular clustering and
classification problems in traffic research are traffic state
clustering [32] and participant behaviour clustering for group
formation [36]. Clustering of travel-time information trying to
discover homogeneous traffic patterns to be used with the
common forecasting model was discussed in [...]. A KD
clustering [...], which is a promising non-parametric method of
computational statistics tool and allows arbitrary shaped clusters
to be discovered. Fast clustering, which is based on KD, was
described by Hinnenburg and Gabriel [37]. The distributed (with
a central authority) version of KD-based clustering (KDEC
scheme) was considered in [23]. Another decentralised graph-
oriented not KD clustering approach was presented in [38].
Change point analysis
Change Point Analysis for data processing and data mining
of intelligent agents in city traffic was investigated [4]. The
necessary agent-oriented architectures, scenarios and data flows
were described [17]. Two CST-based resampling tests for
change point detection were suggested, which were
implemented at the DDM layer of agent logics. The efficiency
of the suggested approach was evaluated [17] for two different
scenarios based on real traffic data.
Traffic routing problem
A traffic routing problem with decentralized decision
making of vehicle agents in urban traffic system was
investigated, where the planning process for a vehicle agent is
separated into two stages: strategic planning for selection of the
optimal route and tactical planning for passing the current street
in the optimal manner. A MAS architecture for this problem was
developed [5], [15]; data flows and scenarios were analysed.
Necessary CST-based BDPM algorithms for comparing two
routes in a stochastic graph [5], [15], and the shortest path
search were developed [16] which are carried out at strategic
planning stage; the efficiency of the algorithms was evaluated.
The models were implemented to real data and integrated into a
traffic domain application use case. Experimental results show
evidence for the efficiency of our approach.
4.0 REFERENCE ARCHITECTURE FOR TRAFFIC
CLOUD DATA PROCESSING AND MINING
In the previous Section we demonstrated technologies and
BDPM methods used in cloud-based STMS. Now we
demonstrate a sample architecture of a cloud-based STMS and
explain the main data flows that occur there. We show as well
how the data flows can be processed in order to implement
SBDPM and provide sufficient information for fulfilling the
user requests.
The applications executed in cloud are data-intensive.
Services provided through the cloud require large amounts of
data to be processed, aggregated, and analysed. Then, the
processed data is used for calculating optimal strategies for
traffic participants.
As we already mentioned, computation is a bottleneck in
cloud computing. So a very important challenge of SBDPM is a
reasonable processing balance between local data sources
(clients) and a cloud. If a client has sufficient computational
power, it can pre-process data locally and provide already
processed data to the cloud, reducing cloud computations and
network traffic. If however the computational power of a client
does not allow information processing, the raw data are
provided to the cloud and should be processed there. This is
illustrated in Figure 5.
Figure 5 Data flow interconnections
46 Issham Ismail et al. / Jurnal Teknologi (Sciences & Engineering) 62:1 (2013), 33–40
Now we consider a reference architecture for traffic cloud
data mining and optimization of strategies (TCDMOS), which is
described in our previous works [] and based on [7]. In this
architecture, we concentrate on illustrating data flows and their
processing as well as using results for optimization of
participant strategies and fulfilling their requests. A principal
architecture of TCDMOS is illustrated in Figure 6.
Figure 6 TCDMOS Architecture: Traffic Cloud Data Mining and Optimization of Strategies
It should be noted that there is not one cloud. There can be
many clouds, made available from different providers. Some of
the problems can be similar for them, and cooperation between
them is possible.
The users of the TCDMOS (traffic participants such as
vehicles or pedestrians, business users such as logistic
providers, public transports or taxis, data providers such as
cameras or detectors, as well as traffic managers such as traffic
managements centers or traffic control elements) are connected
with the cloud using stable and permanent Internet connection.
This allows creating a virtual representation of each user in
terms of IoT and having in the cloud dynamic sensor data,
associated with them (pre-processed or raw). This creates a
network of virtual users, which in fact is a mirror of reality in
the cloud. This virtual reality contains distributed user data
(partly stored in user devices, partly in the virtual storages
provided by the cloud, but still associated with users). Note that
disconnection of a user from the cloud does not mean
elimination of its virtual representation; this only means that the
locally stored data become unavailable for the cloud.
On the first stage data should be pre-processed. Raw sensor
data requires very much storage space and cannot be stored for a
long time. This data can be processed locally or upload to the
cloud and pre-processed there. The results of the pre-processing
are stored in the user profile and can be uploaded to the cloud at
this stage.
The next very important stage is organizing of the virtual
cloud information storages. This is made by cloud data mining
agents, which collect the information, partially copying it to the
storages in the cloud, partially making references to the user
profiles, if they are available in the cloud. These agents put
special attention to cost of the information, which includes its
availability, reliability and precision. These virtual storages are
subject of further SBDPM.
Cloud-based systems have a big number of users, and
should fast react to their requests. For this purpose artificial ad-
hoc networks are created, which are oriented to concrete
problems, solved by the cloud system. For example, the
networks oriented to shortest path calculation, traffic light
regulation or passenger transit can be created.
There are two important problems solved in the artificial
network: estimation of its parameters and pre-calculation of user
strategies.
Estimation of the ad-hoc network parameters is the main
stage of SBDPM. It consists in the estimation of the network
parameters in order to obtain actual state of the network. Based
on the information in the virtual storages estimation of the
parameters is performed, taking costs of data into account and
receiving data from physical storages if necessary. These
parameters can be travel times on the network nodes, queues on
the intersections or travel times between stops for public
transport. A very important aspect is taking dynamic changes of
the information into account, which is constantly provided by
data mining agents.
Based on the estimated parameters pre-calculation
It includes the following stages of data processing and network
optimization:
Stage 1: Mining data from the IoT and its pre-processing.
All the participants of the cloud-based system have virtual
representations as active IoT components (agents). These virtual
agents are associated with data (mostly real-time) and act as
data sources for the cloud-based system. The cloud system
locates and collects the necessary data from different agents,
and provides usual data mining operations (changes and outliers
are detected, preliminary aggregation and dimensionality
reduction are performed). The collected data are stored as
historical information in the cloud and are used later as input
data for ad-hoc network models (Stage 2). Stream-based
methods of semi-decentralized change-point detection, outlier
detection, clustering and classification, and factor analysis occur
regularly in this stage.
Stage 2: Ad-hoc network models. The application-specific
digital networks of virtual traffic participants (e.g. regional,
social) are created, and the corresponding data models are used
in order to estimate the important characteristics and parameters
of these networks using the information collected in Stage 1 and
for strategy optimization at Stage 3. The future behaviour of
traffic participants is forecasted as well. Semi-decentralized,
flows forecasting (possibly with incomplete information)
methods such as (multiple-response) regression models,
Bayesian networks, time series, simulation, are also applied at
this stage. Many pre-defined data models can run concurrently
in the digital network. The corresponding data storages are
located in the cloud and are semi-centralized, so the methods
should take costs of different pieces of information into account.
Stage 3: Static decisions and initial strategy optimization.
Cloud applications use pre-calculated results of the ad-hoc
network models from Stage 2 and the available historical
information (including private information) about the traffic
network to perform their pre-planning tasks. Initial optimization
of the strategies is resource expensive, and can be partially pre-
calculated in ad-hoc network models and then instantiated
according to the application’s goals and preferences. These
models are also checked in the digital traffic network. This stage
can require aggregation of different data models and existing
strategies. Methods of self-learning stochastic (multi-criteria)
optimization such as neural networks, decision trees, Markov
decision processes, choice models, graph optimization
algorithms are used.
47 Issham Ismail et al. / Jurnal Teknologi (Sciences & Engineering) 62:1 (2013), 33–40
Stage 4: Dynamic decisions and strategy update. The pre-
planned tasks from Stage 3 are executed, and updates are made
according to the dynamic real-time situation extracted from the
virtual agents. The aggregation of the pre-planned data and
strategies with the dynamic ones is the most important problem
at this stage. An additional difficulty here is the requirement of
fast real-time execution. (Automatic) cooperation between users
in their decisions is possible; therefore, stream-based methods of
data models and strategy updates such as reinforcement
learning, Bayesian networks, dynamic decision trees, stream
regression, and distributed constraint satisfaction/optimization
can be applied.
5.0 TRAFFIC CLOUD SCENARIOS
We propose three cloud-based STMS application scenarios: 1)
A cooperative intersection control, which optimizes vehicle
flows in traffic networks by regulating the intersection
controllers. 2) A personal travel companion, which provides
dynamic planning and monitoring of multimodal journeys to
travellers, surface vehicle drivers, and transports operators. 3) A
logistics services companion, which provides benefits to clients
and stakeholders involved in, affected by, or dependent on the
transportation of goods in urban environments. We demonstrate
the most important stages of data processing and optimization in
order to derive requirements for a general architecture described
in the next section.
5.1 Virtualized cooperative intersection control
This scenario uses adaptive, semi-distributed traffic
management strategies hosted in the cloud for the regulation of
intersection controllers, and creates ad-hoc networks in the
cloud between clusters of vehicles and the traffic management
infrastructure. It recommends the optimal speed to drivers to
keep the traffic flow smooth, and assists adapting traffic
controllers (e.g. traffic lights, signs) based on the realtime
traffic situation. This service uses real-time traffic information
and a route-data collection service to formulate strategies for the
optimization of network operation.
Stage 1: Processing the following data streams (historical
and real-time): 1) floating-car data (speeds, positions, etc.); 2)
sensor data from the infrastructure (loops, traffic lights, etc.); 3)
information about routes and actual locations of collective
transport (public transport, taxi, shared cars, etc.) 4) data from
distribution vehicles (logistic transport); 5) weather conditions;
6) accidents, car breakdowns, road-works; 7) organizational
activities (sport events, conferences, etc.)
Stage 2: Creating ad-hoc networks, which are virtual
abstract networks for solving specific problems (intersection and
regional traffic models, green wave models, public transport
priority, jam avoidance, etc.). Estimating network parameters
(traffic flux, density, and speed, travel time estimation, etc.).
Stage 3: Developing static strategies of intersection control
and cooperation (such as increase of flows, changed weather
conditions, organizational activities); cooperation plans of
clusters of vehicles, etc.).
Stage 4: Combining dynamic real-time information with
static strategies in order to receive up-to-date controlling
decisions (correction of signal plans according to current
conditions, cooperation of signal controllers to resolve problems
such as jams, accidents, etc.) based on historical information,
previous experience, and data models from the previous stage
(traffic light signal plan optimization; signal plans for expected
events
5.2 Dynamic multi-modal journey planning
The purpose of this use case is to help travellers plan and adjust
a multi-modal, door-to-door journey in real-time. It provides
improved (i.e., quicker, more comfortable, cheaper, and greener)
mobility to daily commuters and other travellers by identifying
optimal transportation means and a strong real-time orientation.
This planning proposal for a multi-modal journey takes into
account the current means of transportation, the traveller’s
context and preferences, city traffic rules, and the current
requirements and constraints. The journey plan needs to obtain
an overall indication of the trip duration as well as
accommodate early reservation of resources (train or plane
ticket).
Stage 1: Processing of the following data streams
(historical and dynamic) in addition to the previous application:
1) floating passenger data; 2) travellers’ preferences; 3)
timetables and availability of collective transport (tickets, shared
cars availability, etc.); 4) changes in time-tables.
Stage 2: Creation of ad-hoc networks (transit stations,
public transport coordination, passenger choice of transport,
etc.) and estimation of network parameters (travel time for
different transport modes depending on various factors, waiting
times, passenger arrival at stops, price models, etc.).
Stage 3: Multi-modal route pre-planning based on
historical data and estimated network parameters for expected
conditions (pre-planning for popular routes, preplanning for pre-
booked routes, pre-planning for expected events) as well as
optimal time-table calculation for public transport based on the
expected conditions.
Stage 4: Dynamic update of pre-planned routes for the
actual multi-modal journey (actual travel-time estimation, re-
planning in the case of delays in previous trips in the multi-
modal chain, re-planning for additional travel possibilities, or
cancelling a part of the multi-modal journey), as well as
dynamic update of public transport time-tables (on-demand
changes, co-ordination of different transport means).
5.3 Itinerary booking and real-time optimized route
navigation
This use case helps a logistics provider (1) guarantee quick
(especially on-time) deliveries at a low cost based on up-to-date
information and (2) maximize the efficiency of each vehicle and
the fleet. It is fundamental to optimize the movements of the
logistics vehicles, to help them avoid traffic jams and take the
shortest routes when possible.
Stage 1: Processing of the following data streams
(historical and dynamic) in addition to the first application: 1)
order data (transportation demand); 2) available logistic vehicles
(possible load, speed, etc.); 3) timetables (if necessary) and
actual positions of the vehicles; 4) client data (drop-off
preferences, actual location, etc.).
Stage 2: Creation of ad-hoc networks (delivery models,
logistic provider-client interaction models, etc.), and estimation
of the network parameters (travel times for different route
segments, delay probability, drop-off process time distribution,
probability of accidents, probability of problems with vehicles,
etc.).
Stage 3: Pre-planning of the delivery process (preliminary
good distribution by vehicles, preliminary order of clients for
each vehicle, preliminary route for each vehicle, preliminary
time window for each client, etc.). Note that the itineraries of
large logistic operators can be used to provide better predictions
of the traffic situation using virtualized cooperative intersection
48 Issham Ismail et al. / Jurnal Teknologi (Sciences & Engineering) 62:1 (2013), 33–40
intelligence application as well as by applying priority rules for
logistic vehicles during booking.
Stage 4: Dynamic update of pre-planned delivery routes
depending on up-to-date information (re-planning of routes
depending on current traffic situation, re-planning in the case of
accidents or traffic jams, re-planning in the case of vehicle
problems, estimation of actual delivery time, etc.). Cooperation
between logistic vehicles (exchange or orders, adoption of other
vehicle’s orders in the case of problems, etc.). Dynamic
agreement with clients (agreement about drop-off place
depending on current position of the vehicle and client,
agreement about change of drop-off time, reaction to the
new/changed customer requests, etc.).
6.0 METHODS OF BDPM IN CLOUD-BASED STMS
In this Chapter we provide an overview of two very important
groups of BDPM methods, which can be applied in cloud-based
environments: decentralised clustering, which groups together
similar data and decentralised regression, which provides
estimation of some characteristics depending on given values of
factors. Both methods are distributed, which allows combination
of local and global computations, which provides a very good
basis for their application in cloud context.
6.1 Decentralised regression
Regression analysis models the dependency between the
dependent variable (usually denoted by ) and independent
variables (factors, usually denoted by ). It describes the
dependence of conditional expectation ] on the values of
several independent variables (factors) .
A linear regression model supposes that the dependent
variable is a linear combination of the factors . The linear
regression model in the matrix form can be expressed as
(6.1)
where is an vector of dependent variables; is an
matrix of explanatory (dependent) variables; is an vector of unknown coefficients, which are parameters of the
system to be estimated; is an vector of random errors.
The rows of the matrix correspond to observations and the
columns correspond to factors.
The well-known least square estimator (LSE) of is:
( ) . (6.2)
After the estimation of the parameters , we make a
forecast for a certain -th future values of the factors :
(6.3)
A KD regression model does not make certain assumptions
about the form of dependence of dependent variable on
factors . It can predict observations without reference to a
fixed parametric model. It uses kernel as a weighting function in
the estimation process.
A general form of a non-parametric regression model is:
( ) (6.4)
where is a random error such that and
( ); and ( ) . The Nadaraya-Watson KD estimator is
( ) ∑ ( )
∑ ( )
∑ ( )
∑
∑ ( )
(6.5)
where ( ) is the kernel function of is the bandwidth
matrix, ( ) (
) are the weights of the historical
observations in the forecast of x and ( ) ( )
∑
are the
corresponding normalised weights. If there is no additional
information about factor dependence, ( ). Kernel function is a symmetric density function, for example a
standard miultivariate normal distribution ( ), called the
multivariate Gaussian kernel.
Using the Nadaraya-Watson estimator, a forecast for any
future factors can be made:
( ) (6.6)
Now we consider distributed versions of the above-
mentioned linear and KD regressions. The main idea is that each
agent makes estimations of its models locally based on its
observations; in the case of difficulties it asks for a help from
other agents and receives the model parameters (e.g. in the case
of linear regression) or raw data (e.g. in the case of kernel
regression), which are used to improve initial model.
Suppose we have a MAS consisting of autonomous
agents ( ) ( ) ( ) , and each of them
contains a local regression model, which is estimated on the
basis of its experience. We now introduce a parameter
adjustment algorithm, which allows the agents to exchange their
model parameters in order to improve the forecasts.
Consider an agent ( ) which makes a forecasting for
some factors ( )
using linear or KD regression. After
forecasting, ( ) checks whether it needs help from other
agents. This is done when the agent considers a forecast
[ ( )
] as not reliable.
For the linear model, an approach to check a reliability of a
forecast is to compare the width of the confidence interval of the
forecast with a forecast value. The forecast [ ( )
] is
considered to be not reliable if its value is sufficiently smaller
than its confidence interval width:
( )( ( )
)
( )
( )
where is an agent’s parameter representing the maximal ratio
of the confidence interval width to the forecast, after which a
coordination takes place; ( )( ( )
) is the confidence interval
for factors ( )
based on the agent’s data.
For the KD model, we consider a forecast for ( )
as not
reliable if only one of the observations is taken with a
significant weight in this forecast:
( ( )
( ( )
))
where is a is an agent’s parameter representing the maximal
weight, after which a coordination takes place.
49 Issham Ismail et al. / Jurnal Teknologi (Sciences & Engineering) 62:1 (2013), 33–40
Now, let us describe the parameter adjustment procedure,
in which agent ( ) sends first a request to other agents within
its transmission radius. This request contains a set of factors
( )
as well as a threshold ( ) ( ( )
).
For the linear model this threshold is set equal to the
confidence interval width: ( ) ( ( )
) ( ) ( ( )
)
For the KD model this threshold for the observation weight
is set as the weight of the second best observation:
( ) ( ( )
) ( )( )
( ( )
) where an ordered sequence of
weights in the forecast for ( )
is represented by
( )( )
( ( )
) ( )( )
( ( )
) ( )( )
( ( )
).
Each agent ( ) in the transmission radius after the
receiving of data makes the following.
For the linear model it calculates the confidence interval
( )( ( )
) for the requested values of factors ( )
on the basis
of its data and compares it with the threshold. If this value is
less than the threshold, ( ) ( ( )
) ( ) ( ( )
) ( )
replies to ( ) by sending its parameters ( )
.
For the KD model it calculates the weights ( )
( ( )
) on
the basis of its own data. If there are observations with
weights ( )
( ( )
) ( ) ( ( )
) it forms a reply ( ) from
these observations (maximum 2) and sends it to ( ). Let us define ( ) , as a group of agents, who are able
to reply to ( ) by sending the requested data.
For the linear model each ( ) sends its parameters ( )
.
( ) receives replies from the group ( ). It assigns weights to
each ( ) ( ) (including itself) ( )={ ( )
}; these weights
are time-varying and represent the reliability level of each
( ) (including reliability of own experience). In our case, the
agents’ weights depend on the forecasting experience.
According to the logic of constructing discrete-time consensus,
we assume that ( ) is a stochastic vector for all t (the sum of its
elements is equal to 1). Then an updated estimate ( )
is
calculated as
( )
∑ ( )
( ) ( )
( )
(6.7)
For the KD model the agents ( ) send their data, which
are closest to the requested point. All the data ( ), ( )
( ) received by ( ) are verified and duplicated data are
discarded. These new observations are added to the dataset of
( ) ( ) ⋃ ( ) ( ) ( ) ( ) . Suppose that ( )
received r observations. Then, the new KD function of ( ) is
updated by considering the additive nature of this function:
( ) ( )
( )( ) ∑ ( )( ) ( ) ( )
( )( ) ∑ ( )( ) ( ) ( )
(6.8)
where ( )( ) and ( )( ) are the nominator and denominator
of (6.5), respectively, calculated by ( ). Finally, ( ) can
autonomously make its forecast for ( )
as ( )
( ( )
).
6.1 Decentralised clustering
We formulate first the clustering problem and describe the KD
clustering algorithm. Let , be a
dataset to be clustered into k non-overlapping subsets
. Non-parametric clustering methods are well suited for
exploring clusters without building a generative model of the
data. KD clustering consists of a two-step procedure: estimation
and optimisation. During the estimation step, the probability
density of the data space is directly estimated from data
instances. During the optimisation step, a search is performed
for densely populated regions in the estimated probability
density function.
Estimation step. The density function is estimated by
defining the density at any data object as being proportional to a
weighted sum of all objects in the data-set, where the weights
are defined by an appropriately chosen kernel function [23].
A KD estimator is
( )
∑ (‖ ‖)
(6.8)
where ‖ ‖ is a distance between and , ( ) ( )[42]. We use the multivariate Gaussian kernel
function in our study: ( ) ( ) ⁄ (
).
Optimisation step. Maxima of KD are detected and groups
all of the data objects in their neighbourhood are grouped into
corresponding clusters. We use a hill climbing method for KD
maxima estimation with Gaussian kernels (DENCLUE2) [37]
and modify the technique for the multivariate case. This method
converges towards a local maximum and adjusts the step size
automatically at no additional costs. Other optimization methods
[37] require more steps and additional computations for step
size detection. Each KD maximum can be considered as the
centre of a point cluster. With centre-defined clusters, every
local maximum of ( ) corresponds to a cluster that includes all
data objects that can be connected to the maximum by a
continuous, uphill path in the function of ( ). Such centre-
defined clusters allows for arbitrary-shaped clusters to be
detected, including non-linear clusters. An arbitrary-shape
cluster is the union of centre-defined clusters that have maxima
that can be connected by a continuous, uphill path. The goal of
the hill climbing procedure is to maximize the KD ( ). By
setting the gradient ( ) of KD to zero and solving the
equation ( ) for x, we get:
( ) ∑ (‖ ( ) ‖)
∑ (‖ ( ) ‖)
(6.9)
The formula (6.9) can be interpreted as a normalized and
weighted average of the data points. The weights for each data
point depend on the influence of the corresponding kernels on
( ). Hill climbing is initiated at each data point and is
iterated until the density does not change, i.e.
[ ( ( )
) ( ( )
)] ( ( )
) ⁄ , where is a
small constant. The end point of the hill climbing algorithm is
denoted by
( ), corresponding to a local maximum of KD.
Now we should determine a cluster for . Let
be an ordered set of already identified cluster centres
(initially, we suppose ). First we find an index of the
nearest cluster centre from in the set :
( )
‖
‖.
We describe now the cooperation for sharing the clustering
experience among the agents in a network. While working with
50 Issham Ismail et al. / Jurnal Teknologi (Sciences & Engineering) 62:1 (2013), 33–40
streaming data, one should take into account two main facts.
The nodes should coordinate their clustering experience over
some previous sampling period and adapt quickly to the changes
in the streaming data, without waiting for the next coordination
action.
Let us first discuss the cooperation technique. We
introduce the following definitions. Let
( ) ( ) ( ) , be a group of p agents. Each
( ) has a local dataset { }, where
. In order to underline the dependence of the KD
function (6.8) on the local dataset of ( ), we denote the KD
function by [ ]( ).
Consider a case when some agent ( ) is unable to
classify (after optimization has formed a new or small cluster)
some future data point because it does not have sufficient
data in the neighbourhood of this point. Our model uses a two-
phase protocol for performing communication between agents.
Agent ( ) sends the data point to the other neighbouring
agents.
We consider two different helping procedures: non-
parametric, in which some data are transmitted, no parameter
estimation is performed and semi-parametric, where the
observations are approximated with the mixture of multivariate
normal distributions and their parameters are transmitted.
In the non-parametric procedure, considered in […], each
of ( ) that has received the request classifies using its own
KD function [ ]( ) and performs the optimization step to
identify the cluster for this point. Let be a number of points
in the cluster of , not including
, itself. In the case of
successful clustering ( ), of ( ) forms an answer
with c nearest points to the requested data point from the same
cluster as , (or all points from the cluster, if . Let
be a number of points in the answer . The agent of ( )
sends together with and to of ( ). After receiving
all the answers, ( ) forms a new dataset .
In the semi-parametric procedure, considered in […], in
response to the help-request, the neighbours of ( ) send
parameters from their estimated KD functions. Since the KD
function is non-parametric and estimated directly from
observations, we approximate the function with a mixture of
multi-dimensional Gaussian distributions. Agent of ( )
identifies cluster associated with point and performs the
approximation of clusters with a mixture of normal
distributions. Next, of ( ) transmits the cluster parameters
(weight, mean and covariance matrix). The agent of ( ) adds
this information to its KD and updates its clusters. Since
After updating its KD function, of ( ) can perform a hill-
climbing optimization procedure to identify clusters in its local
data space.
parameter transmission requires less data, this approach requires
less transmission, however, the approximation reduces the
cluster shapes to a union of ellipsoids.
Let us consider an approximation step that approximates
KD functions with a mixture of multivariate normal
distributions. This step can be achieved with the expectation
maximisation (EM) algorithm proposed by Dempster [43]. The
approach is widely used for calculation of the maximum
likelihood estimate of mixture models. In a mixture model, the
probability density function is
( ) ∑ ( ) ,
where are positive mixing weights that sum to one, are
component density functions parameterized by , and are the model parameters. Each observation is assumed
to be from one of the B components. A common choice for
component density is a multivariate normal distribution with
parameters ( ), where is a mean and is a
covariance matrix.
In the EM procedure, the expected likelihood of a given
data-set is iteratively maximized. The algorithm [43] alternates
between the E and the M steps until convergence is achieved.
We assume that each helping-agent ( ) ( ) receives
data point and tries to classify it. If it is successful, of ( )
determines that belongs to a specific cluster and executes the
EM-algorithm with this cluster. This algorithm approximates the
cluster using a mixture of multidimensional normal
distributions with parameters { }, where
{
}, {
}, and {
}, which
are then returned to ( ). After receiving all answers, the agent
Ai has a vector of the parameters { }. The answers { } can be
interpreted by the agent ( ) as data points with the only
difference being that the additional weights and bandwidths
from should now be taken into account.
The next problem is the updating of the KD function of
( ) Denote as a dataset of the agent of ( ) that includes
the received answers. We take into account that density
estimates (6.8) of each agent are additive, i.e. the aggregated
density estimate [ ]( ) can be decomposed into the sum of
the local density estimates.
For the non-parametric approach [ ]( ) is updated with
respect to the new knowledge with one estimate for every
dataset :
[ ]( )
[ ]( )
( )
∑ ( ) ( )∑
( ) ( )
[ ]( ) (6.10)
where is a weight used for the agent’s own local
observations.
For the semi-parametric procedure it uses the estimated
parameters
[ ]( )= [ ]( )
( )
∑
( ) ( )
∑ ( ) ( )
∑
( ) ( )
(‖
‖)
(6.11)
After updating its KD function, of ( ) can perform a hill-
climbing optimization procedure to identify clusters in its local
data space.
To measure the clustering similarity [44] among the agents
( ) we use the following representation of a class
labeling by a matrix C with components:
{
Let two labelings have matrix representations ( ) and
( ), respectively. We define a dot product that computes the
number of pairs clustered together ⟨ ( ) ( )⟩ ∑ ( )
( )
.
The Jaccard’s similarity measure can be expressed as
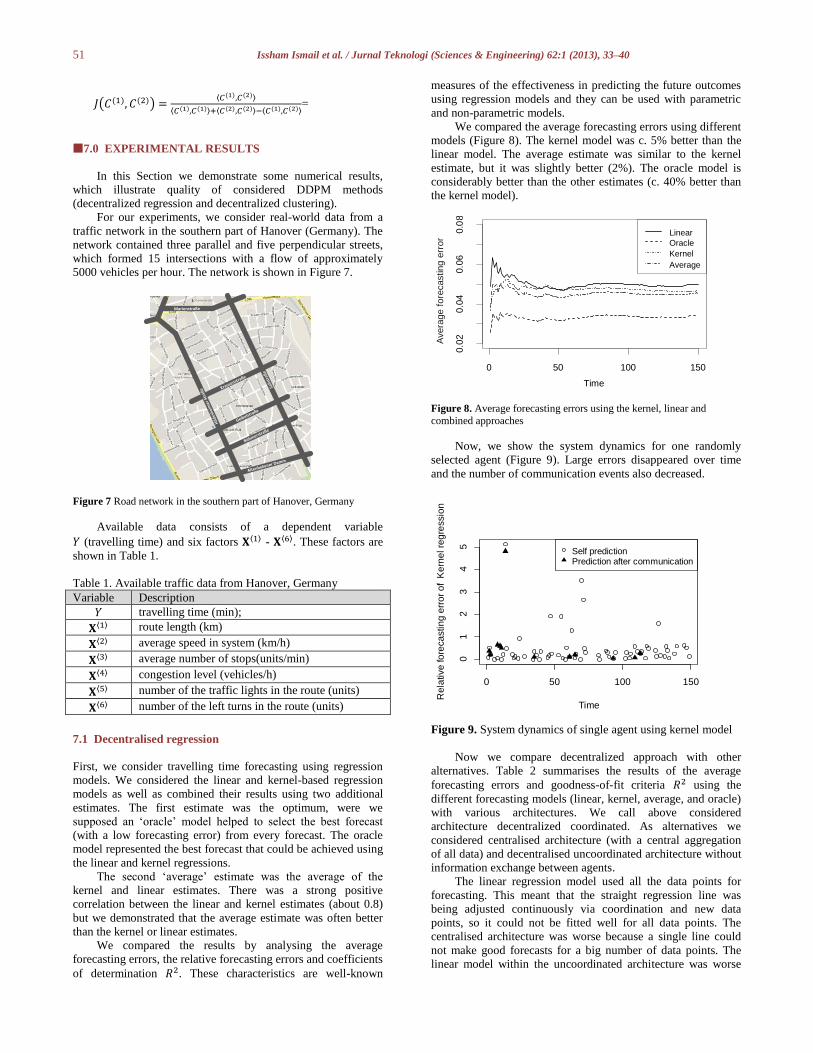
51 Issham Ismail et al. / Jurnal Teknologi (Sciences & Engineering) 62:1 (2013), 33–40
( ( ) ( )) ⟨ ( ) ( )⟩
⟨ ( ) ( )⟩ ⟨ ( ) ( )⟩ ⟨ ( ) ( )⟩=
7.0 EXPERIMENTAL RESULTS
In this Section we demonstrate some numerical results,
which illustrate quality of considered DDPM methods
(decentralized regression and decentralized clustering).
For our experiments, we consider real-world data from a
traffic network in the southern part of Hanover (Germany). The
network contained three parallel and five perpendicular streets,
which formed 15 intersections with a flow of approximately
5000 vehicles per hour. The network is shown in Figure 7.
Figure 7 Road network in the southern part of Hanover, Germany
Available data consists of a dependent variable
(travelling time) and six factors ⟨ ⟩ - ⟨ ⟩. These factors are
shown in Table 1.
Table 1. Available traffic data from Hanover, Germany
Variable Description
travelling time (min);
⟨ ⟩ route length (km)
⟨ ⟩ average speed in system (km/h)
⟨ ⟩ average number of stops(units/min)
⟨ ⟩ congestion level (vehicles/h)
⟨ ⟩ number of the traffic lights in the route (units)
⟨ ⟩ number of the left turns in the route (units)
7.1 Decentralised regression
First, we consider travelling time forecasting using regression
models. We considered the linear and kernel-based regression
models as well as combined their results using two additional
estimates. The first estimate was the optimum, were we
supposed an ‘oracle’ model helped to select the best forecast
(with a low forecasting error) from every forecast. The oracle
model represented the best forecast that could be achieved using
the linear and kernel regressions.
The second ‘average’ estimate was the average of the
kernel and linear estimates. There was a strong positive
correlation between the linear and kernel estimates (about 0.8)
but we demonstrated that the average estimate was often better
than the kernel or linear estimates. We compared the results by analysing the average
forecasting errors, the relative forecasting errors and coefficients
of determination . These characteristics are well-known
measures of the effectiveness in predicting the future outcomes
using regression models and they can be used with parametric
and non-parametric models.
We compared the average forecasting errors using different
models (Figure 8). The kernel model was c. 5% better than the
linear model. The average estimate was similar to the kernel
estimate, but it was slightly better (2%). The oracle model is
considerably better than the other estimates (c. 40% better than
the kernel model).
Figure 8. Average forecasting errors using the kernel, linear and
combined approaches
Now, we show the system dynamics for one randomly
selected agent (Figure 9). Large errors disappeared over time
and the number of communication events also decreased.
Figure 9. System dynamics of single agent using kernel model
Now we compare decentralized approach with other
alternatives. Table 2 summarises the results of the average
forecasting errors and goodness-of-fit criteria using the
different forecasting models (linear, kernel, average, and oracle)
with various architectures. We call above considered
architecture decentralized coordinated. As alternatives we
considered centralised architecture (with a central aggregation
of all data) and decentralised uncoordinated architecture without
information exchange between agents.
The linear regression model used all the data points for
forecasting. This meant that the straight regression line was
being adjusted continuously via coordination and new data
points, so it could not be fitted well for all data points. The
centralised architecture was worse because a single line could
not make good forecasts for a big number of data points. The
linear model within the uncoordinated architecture was worse
Salls
traß
e
Altenbekener Damm
Marienstraße
Böhmerstraße
Geibelstraße
Krausenstraße
Hild
eshe
imer
Str
aße
0 50 100 150
0.0
20.0
40.0
60.0
8
Time
Linear
Oracle
Kernel
Average
Avera
ge f
ore
casting
err
or
0 50 100 150
01
23
45
Time
Re
lative
fo
reca
stin
g e
rro
r o
f K
ern
el re
gre
ssio
n
Self predictionPrediction after communication

52 Issham Ismail et al. / Jurnal Teknologi (Sciences & Engineering) 62:1 (2013), 33–40
due to the convergence of the parameters of several agents to
local optima instead of global optima.
The kernel-based regression model used only neighbouring
points for forecasting. Coordination greatly improved the
quality of forecasting because new neighbouring data points
were provided. The centralised architecture made the best
forecasts because there were many nearby points for most
requested point. However, absence of experience
(uncoordinated architecture) produced bad forecasts.
Coordination sufficiently improved the .
Analysis of the relative forecasting errors showed that the
average estimator in coordinated and uncoordinated
architectures for relatively small amounts of data produced
relatively better results than kernel-based or linear estimators.
The kernel model was more accurate on average, but it
sometimes yielded highly inaccurate forecasts. The linear model
was less accurate, but it did not produce such big outliers. The
average method avoided big outliers of the kernel model and it
provided more accurate forecasts.
The oracle-based estimator, which combined the kernel-
based and linear estimators, provided a possible lower bound for
the average forecasting error. This algorithm could improve
forecasts by c. 25%. However, it is still unclear, how to choose
between kernel-based and linear estimates. Table 2. Average forecasting errors and goodness-of-fit criteria for
the different forecasting models
Model
Average
forecasting
errors
(After cross-
validation)
Linear
Centralised
Uncoordinated
Coordinated
0.051
0.054
0.050
0.829
0.811
0.819
Kernel-based
Centralised
Uncoordinated
Coordinated
0.045
0.053
0.047
0.913
0.814
0.859
Aggregated
(average)
Centralised
Uncoordinated
Coordinated
0.046
0.049
0.046
---
---
---
Aggregated (oracle)
Centralised
Uncoordinated
Coordinated
0.034
0.037
0.034
---
---
---
7.2 Decentralised clustering
Second, we considered decentralized clustering of data listed in
Table 1. The autonomous KD clustering and the decentralized
cooperative clustering algorithm was used in our experiments.
We illustrate a data synchronization step. The requesting
agent asks for help for point A, the helping agent clustered the
point using its own data, detected the corresponding cluster, and
approximated it with the mixture of three normal distributions
(shown as ellipses for two dimensional case with centres in B,
C, D at Fig. 10). Then the helping agent sent the corresponding
parameters to the helping agent. The helping agent added the
obtained parameters as data points to its data and made new
clustering. This allowed to improve clustering similarity of these
two agents from 0.011 to 0.037.
Figure 10 Approximation of a cluster containing A by three ellipsoids
with centres in B, C and D
Now we consider a system dynamics for a different number
of transmitted points. Clustering similarity (Fig. 11) increased
faster for a bigger number of the estimated and transmitted
components of normal distributions for cluster
approximations, but the number of communication events (Fig.
12) decreased faster.
Note, however, that one communication event was more
expensive for a bigger number of transmitted points, but
supplied more information.
Figure 11 Similarity of agents’ clusters over time depending on
components in a mixture of multidimensional normal distributions
Figure 12 A number of communication events over time depending on
components in a mixture of multidimensional normal distributions
53 Issham Ismail et al. / Jurnal Teknologi (Sciences & Engineering) 62:1 (2013), 33–40
8.0 FUTURE WORK AND CONCLUSIONS
The main contribution of this study is a reference architecture
for traffic cloud data mining and optimization of strategies
(TCDMOS) and related data processing and network
optimization methods. We envisage this as an important step
towards making FI and cloud technologies usable for next-
generation STMS. TCDMOS requirements were elicited from
traffic scenarios, which reflect needs and impact of STMS for
business and society, and the corresponding problems that
should be solved for effective cloud system operation were
illustrated. Future work will be devoted to elaborating the
architecture, developing novel algorithms, and integrating and
validating them in state-of-the-art cloud computing frameworks.
Acknowledgements
The research leading to these results has received funding from
the European Union Seventh Framework Programme
(FP7/2007-2013) under grant agreement No. PIEF-GA-2010-
274881.
References
[1] 7-th European Framework Programme project, Instant Mobility:
Multimodality for people and goods in urban area, cp 284806. URL
http://instant-mobility.com/
[2] Fiosina, J. 2012: Decentralised regression model for intelligent forecasting in multi-agent traffic networks. In: S. Omatu e.t. (ed.)
AISC - 9th Int. Conf. on Distributed Comp. and AI. (DCAI’12), vol.
151, pp. 255–263. Springer-Verlag, Berlin Heidelberg..
[3] Fiosina, J., Fiosins, M. 2012: Distributed cooperative kernel-based
forecasting in decentralized multiagent systems for urban traffic
networks. In: Proc. of Ubiquitous Data Mining (UDM) Workshop of
ECAI 2012, pp. 3–7. Montpellier, France.
[4] Fiosins, M., Fiosina, J., Müller, J.P. 2012: Change point analysis for intelligent agents in city traffic. In: Agents and Data Mining
Interaction, LNCS, vol. 7103. Springer.
[5] Fiosins, M., Fiosina, J., Müller, J.P., Görmer, J. 2011: Reconciling
strategic and tactical decision making in agent-oriented simulation of
vehicles in urban traffic. In: Proc. of 4th International ICST
Conference on Simulation Tools and Techniques (SimuTools’2011).
[6] Foster, I. 2008: Cloud computing and grid computing 360-degree compared. In: Proc. of the Grid Computing Environments Workshop,
pp. 1–10.
[7] Li, Z., Chen, C., Wang, K. 2011: Cloud computing for agent-based
urban transportation systems. IEEE Intelligent Systems 26(1), 73–79.
[8] Passos, L., Rossetti, R., Oliveira, E. 2010. Ambient-centred intelligent
traffic control and management. In: Proc. of the 13th Int. IEEE
Annual Conf. on ITS, pp. 224–229.
[9] Wang J.; Cho J.; Lee S.; Ma T. 2011: Real time services for future cloud computing enabled vehicle networks. In: Proc. of the 13th Int.
IEEE Annual Conf. on ITS, pp. 1-5.
[10] Talia, D. 2011: Cloud computing and software agents: Towards cloud
intelligent services. In: Proc. of the 12th Workshop on Objects and
Agents 741, pp. 2-6.
[11] Wang F.Y. 2011: Toward a Revolution in Transportation Operations:
AI for Complex Systems. Intelligent Systems, IEEE 23(6), 8 - 13.
[12] Xiao L., Wang Z. 2011: Internet of Things: a New Application for
Intelligent Traffic Monitoring System. Journal of Networks 6(6), 887
– 894.
[13] Zhang C., Zhang Z., Cao L. 2005: Agents and Data Mining: Mutual
Enhancement by Integration. AIS-ADM2005, LNCS 3505, Springer,
pp. 50-61.
[14] Othmane B., Hebri R. S.A, Boudiaf M. 2012: Cloud Computing and Multi-Agent Systems: A new Promising Approach for Distributed
Data Mining. In Proc. Of the 34th
Int. Conf. on Information
Technology Interfaces, June 25-28 Cavtat, Croatia, pp. 111-116.
[15] Fiosins, M., Fiosina, J., Müller, J., Görmer, J. 2011: Agent-based
integrated decision making for autonomous vehicles in urban traffic.
Adv. in Int. and Soft Comp. 88, 173–178.
[16] Fiosina, J., Fiosins, M. 2013: Selecting the shortest itinerary in a
cloud-based distributed mobility network. In: S.O. et al. (ed.) Proc. of
10th Int. Conf. on Distributed Computing and AI (DCAI 2013), Adv.
in Int. Syst. and Comp., vol. 217, pp. 103–110. Springer-Verlag,
Berlin Heidelberg
[17] Fiosina, J. and Fiosins, M. 2011: Resampling-based Change Point Estimation. In Proc. of the 10th Int. Sym. on Intelligent Data Analysis
(IDA'11), 29-31 Oct. 2011, Porto, Portugal, Springer Verlag, LNCS,
7014, Springer, pp. 150-161.
[18] Fiosina, J., Fiosins, M. 2013: Chapter 1: Cooperative regression-based
forecasting in distributed traffic networks. In: Q.A. Memon (ed.)
Distributed Network Intelligence, Security and Applications, pp. 3–
37. CRC Press, Taylor and Francis Group.
[19] Freitas A. 2002: Data Mining and Knowledge Discovery with Evolutionary Algorithms, Springer-Verlag, Berlin Heidelberg.
[20] Symeonidis, A.L., Mitkas, P.A. 2005: Agent Intelligence Through
Data Mining, Multi-agent Systems, Artificial Societies, and Simulated
Organizations, vol. 14. Springer-Verlag, New York.
[21] da Silva, J.C., Giannella, C., Bhargava, R., Kargupta, H., Klusch, M.
2005: Distributed data mining and agents. Eng. Appl. of AI 18(7),
791–807 [22] Cao, L., Luo, D., Zhang, C. 2009: Ubiquitous intelligence in agent
mining. In: L. Cao, V. Gorodetsky, J. Liu, G. Weiss, P.S. Yu (eds.)
ADMI, Lecture Notes in Computer Science, vol. 5680, pp. 23–35.
Springer
[23] Klusch, M., Lodi, S., Moro, G. 2003: Agent-based distributed data
mining: The KDEC scheme. In: AgentLink, pp. 104–122.
[24] Kargupta, H., Chan, P. (eds.) 2000: Advances in Distributed and
Parallel Knowledge Discovery. AAAI Press/MIT Press, California, USA.
[25] Fiosina, J., Fiosins, M., Müller, J.P. 2013: Mining the traffic cloud:
Data analysis and optimization strategies for cloud-based cooperative
mobility management. In: Proc. of Int. Sym. on Management Int.
Systems, Adv. in Int. Syst. and Comp., vol. 220, pp. 25–32. Springer-
Verlag, Berlin Heidelberg.
[26] Gentle, J. E. 2009: Computational Statistics. Springer, 752 p.
[27] Bazzan, A.L.C., Klügl, F. 2013: A review on agent-based technology for traffic and transportation. The Knowledge Engineering Review
FirstView, 1–29.
[28] Lee, W., Tseng, S., Shieh, W. 2010: Collaborative real-time traffic
information generation and sharing framework for the intelligent
transportation system. Inf. Sciences 180, 62–70.
[29] Lin, H.E., Zito, R., Taylor, M.A. 2005: A review of travel-time
prediction in transport and logistics. In: Proc. of the Eastern Asia Society for Transportation Studies, vol. 5, pp. 1433 – 1448. Hamburg
[30] Malnati, G., Barberis, C., Cuva, C.M. 2007: Gossip: Estimating actual
travelling time using vehicle to vehicle communication. In: 4-th Int.
Workshop on Intel. Transportation. Hamburg.
[31] Stankovic, S.S., Stankovic, M.S., Stipanovic, D.M. 2009:
Decentralized parameter estimation by consensus based stochastic
approximation. IEEE Trans. Automatic Control 56(3).
[32] Weijermars, W., van Berkum, E.: 2005. Analyzing highway flow patterns using cluster analysis. In: Proc. of the 8th Int. IEEE Conf. on
ITS, pp. 831–836. Vienna.
[33] Guestrin, C., Bodik, P., Thibaux, R., Paskin, M., Madden, S. 2004:
Distributed regression: an efficient framework for modeling sensor
network data. In: Proc. of the 3rd Int. Sym. on Information processing
in sensor networks, IPSN ’04, pp. 1–10. ACM, New York, NY, USA.
[34] Claes, R., Holvoet, T. 2011: Ad hoc link traversal time prediction. In: Proc. of the 14th Int. IEEE Conf. on Intelligent Transportation
Systems, pp. 1803–1808.
[35] Görmer, J., Ehmke, J.F., Fiosins, M., Schmidt, D., Schumacher, H.,
Tchouankem, H. 2011: Decision support for dynamic city traffic
management using vehicular communication. In: Proc. of 1st Int.l
Conf. on Simulation and Modeling Methodologies, Technologies and
Applications (SIMULTECH2011), pp. 327–332.
[36] Lee, J.G., Han, J., Whang, K.Y. 2007.: Trajectory clustering: A partition-and-group framework. In: ACM SIGMOD Int. Conf. on
Management of Data (SIGMOD’07), pp. 593–604. Beijing.
[37] Hinneburg, A., Gabriel, H.H. 2007: DENCLUE 2.0: Fast clustering
based on kernel density estimation. In: Proc. of IDA’07, Adv. in
Intelligent Data Analysis VII, LNCS, vol. 4723, pp. 70–80. Springer-
Verlag, Berlin Heidelberg.
[38] Ogston, E., Overeinder, B., van Steen, M., Brazier, F. 2003: A method
for decentralized clustering in large multi-agent systems. In: Proc. of 2nd Int. Conf. on Autonomous Agents and Multiagent Systems, pp.
789–796.
54 Issham Ismail et al. / Jurnal Teknologi (Sciences & Engineering) 62:1 (2013), 33–40
[39] Smith, B.L., Williams, B.M., Oswaldl, R. 2002: Comparison of
parametric and nonparametric models for traffic flow forecasting.
Transportation Research Part C: Emerging Technologies 10, 303–321.
[40] Fiosina, J., Fiosins, M., Müller, J.P. 2013: Decentralised Cooperative
Agent-based Clustering in Intelligent Traffic Clouds. MATES2013,
LNCS XXX, pp. XX-XX. (to be published) [41] Fiosina, J., Fiosins, M. 2013: Cooperative density-based clustering in
cloud-oriented multi-agent systems. HAIS2013, LNCS XXX, pp. XX-
XX. (to be published)
[42] Härdle, W., Müller, M., Sperlich, S., Werwatz, A. 2004:
Nonparametric and Semiparametric Models. Springer,
Berlin/Heidelberg
[42] Dempster, A.P., Laird, N.M., Rubin, D.B. 1977: Maximum likelihood
from incomplete data via the EM algorithm. J. of the Royal Stat. Society. Series B 39, 1–38.
[43] Ben-Hur, A., Elisseeff, A., Guyon, I. 2002: A stability based method
for discovering structure in clustered data. In: Pacific Sym. on
Biocomputing 7, pp. 6–17.
[44] NESSI – Big Data White Paper. Big Data - A New World of
Opportunities, European Commision, December 2012. URL:
http://www.nessi-europe.com/Files/Private/NESSI_WhitePaper_BigData.pdf
[45] Big Data: The next frontier for innovation, competition and
productivity, McKinsey Global Institute, (June 2011) URL:
www.mckinsey.com/
[46] Gartner, Gartner Reveals Top Predictions for IT Organisations and
Users for 2013 and Beyond, URL:
http://www.gartner.com/it/page.jsp?id=2211115
[47] Draper, N and Smith, H. 1998: Applied Regression Analysis. Third Edition, Willey.

55 Issham Ismail et al. / Jurnal Teknologi (Sciences & Engineering) 62:1 (2013), 33–40


