
Bio-Dosimetric Relationalship of Mobile Phone frequency Exposure and the Safety Criteria
School of Environmental SciencesJawaharlal Nehru University, New Delhi.Amity Institute of Environmental Toxicology Safety and ManagementAmity University, Noida (U.P).
Jitendra Behari

Introduction To Electromagnetic Radiation
Electromagnetic radiation is all around us. We are being bombarded with unseen waves of electric and magnetic charges that may be physically harmful to our bodies.
Waves of energy propagated through space as a result of electric charges. These charges are emitted from devices that produce, transmit, or use electric power.

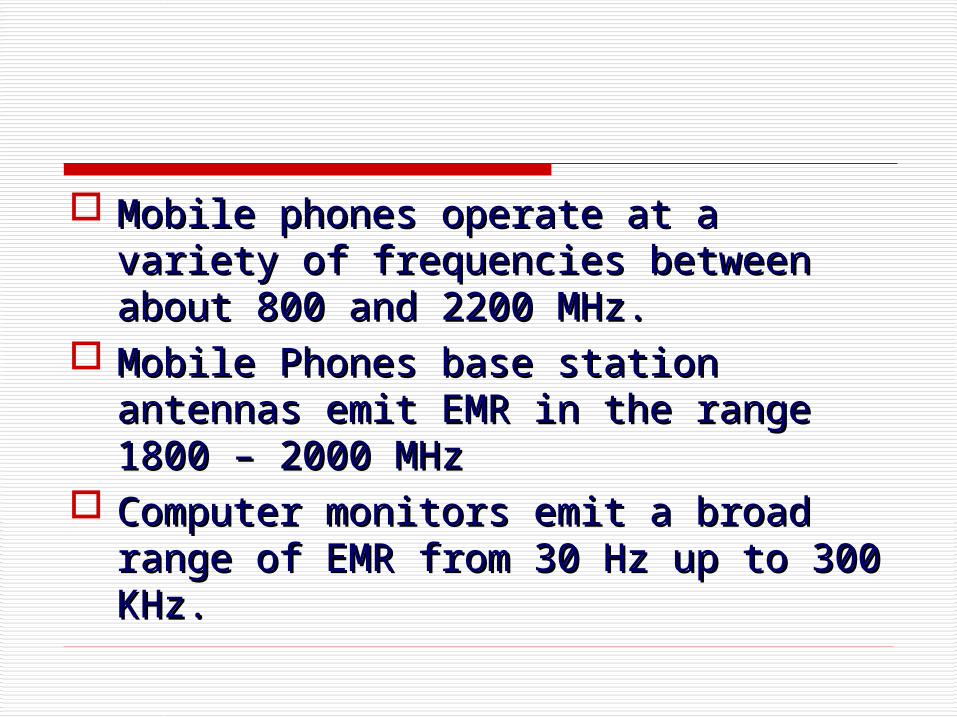
Mobile phones operate at a variety of Mobile phones operate at a variety of frequencies between about 800 and frequencies between about 800 and 2200 MHz.2200 MHz.
Mobile Phones base station antennas Mobile Phones base station antennas emit EMR in the range 1800 – 2000 emit EMR in the range 1800 – 2000 MHzMHz
Computer monitors emit a broad Computer monitors emit a broad range of EMR from 30 Hz up to 300 range of EMR from 30 Hz up to 300 KHz.KHz.

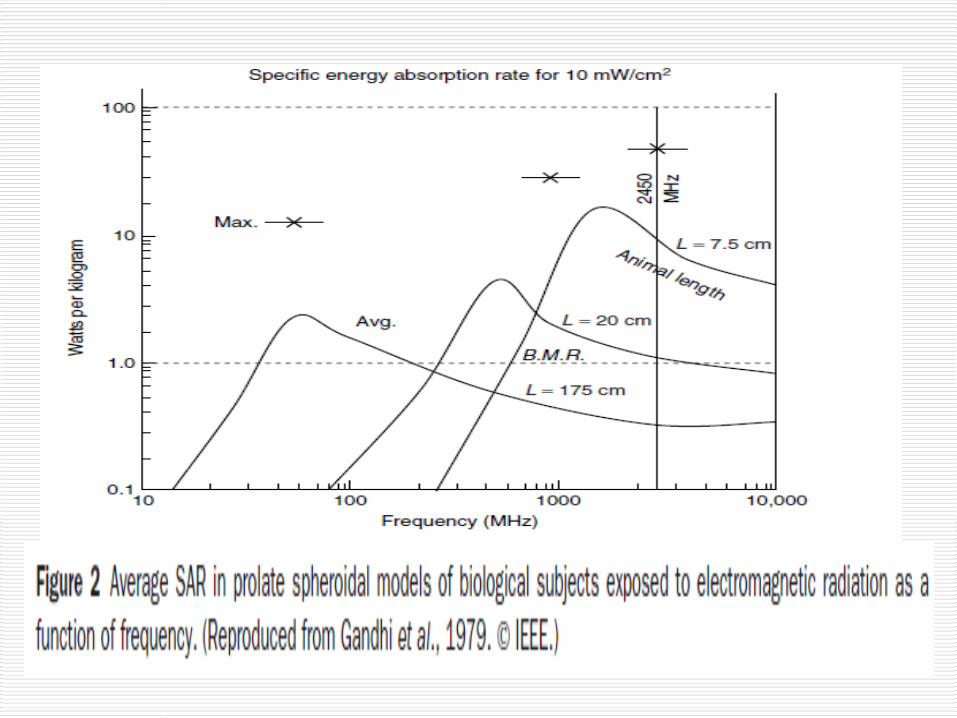
Problems in Dosimetry


To analyze the possible range of variations of the induced field strengths in the various tissues requires an extensive effort, since the local field strengths strongly depend on a large number of parameters, such as:
Ratio of length of the body to the wavelength (L/λ)Operational frequency and antenna input powerPosition of the device with respect to the head/bodyDesign of the deviceThe outer shape of the headThe distribution of the different tissues within the head andThe location of the body with respect to the surroundingsThe electric properties of the tissues.
The last four factors are different for various individuals and can even change with time.

The induced field data are used for computation of SAR is carried out using the expression: SAR = σ *E2/ρ-------(1)σ = Conductivity (S/m) E = Induced field (V/M) ρ= Density of the material (Kg/m3)SAR can be related to increase in temperature SAR= c* ∆T/∆t-------(2)∆T= Change in temperature (°C)∆t= Duration of exposure (S)c= Specific heat capacity ( J/Kg°C)

σ *E2/ρ ≠ c* ∆T/∆t

SAR is also dependent upon if the wave type, that is, square, sine or triangular. The power of the square is larger than the other two. The local SAR refers to the value within a defined unit volume or unit mass, which can be arbitrarily chosen.

Measurement of field distribution: Experimental set up
Ratrestrainer
Anechoic chamber
Rat cage
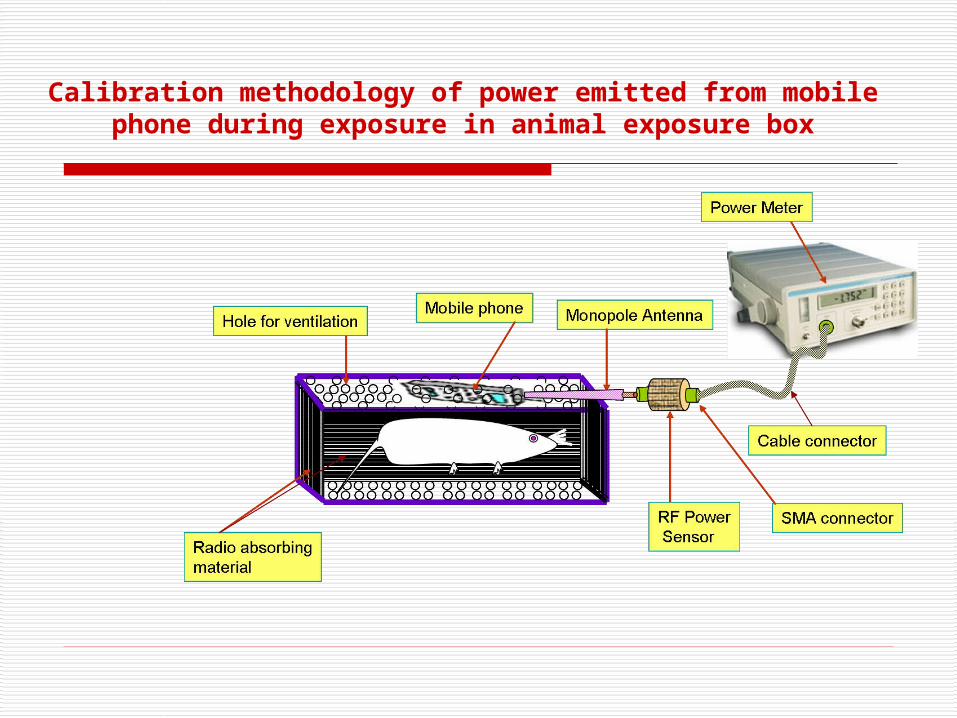
Calibration methodology of power emitted from mobile phone during exposure in animal exposure box

Figure 1. (A) sketch diagram of anechoic chamber with animal cage indicating individual animal’s position. (B) Exposure chamber indicating microwave oven connected with probe and releasing power through horn antenna (1369.8 cm). (C) An internal image of exposure chamber at the side of horn antenna. The internal area of chamber is lined with absorbing material.

Exposure set up of 3G mobile phone in Perspex box made of Plexiglass


Nokia Mobile Phone -2730
Fiber Optic Probe
Temperature Logger
(Fotemp1)
0→ Reference point0→ 1 = 25mm0→2 = 50 mm0→3 = 75 mm 0→4 = 100 mm0→5 = 125 mm0→6 = 150 mm
Reference point(0)
1 2 3 4 5 6
ab
c
e
dGlass Wool
Box

Angular Probe Posi
0→ Reference point0→ 1 = 25mm0→2 = 50 mm0→3 = 75 mm 0→4 = 100 mm
0→5 = 125 mm0→6 = 150 mm
1- Monopole Probe 1718 MHz2- Mobile Phone (Nokia 2730 Classic)3- Angular Probe Positioner 4- Spectrum Analyzer Agilent N9912A5- R.F Cable (Low loss)6- Small Size Rodent Box a = 120 mmb= 45 mmc= 25 mmd= 20 mme= 25 mm f= 50 mm
Ref(0) 1 2 3 4 5
6
a
b
c
e
d
MOTOR
MOTOR
Mob
Mob
SPECTRUM ANALYZER
Model- N9912A
SPECTRUM ANALYZER
Model- N9912A
Angle (0° to 20 ° )
Monopole Probe
Monopole Probe

SAR in 10 gm phantomAnimal Size Box 10 gm box
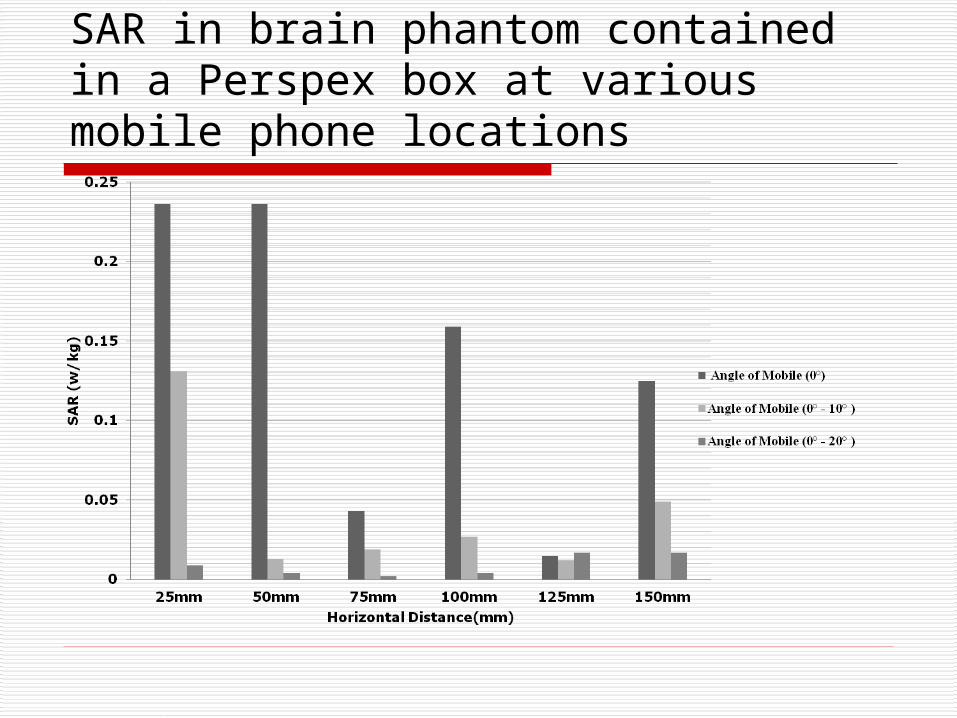
SAR in brain phantom contained in a Perspex box at various mobile phone locations

SAR Measurement (induced field )in Brain Phantom Contained in a box
SAR Measurement in 10 gm Brain Phantom
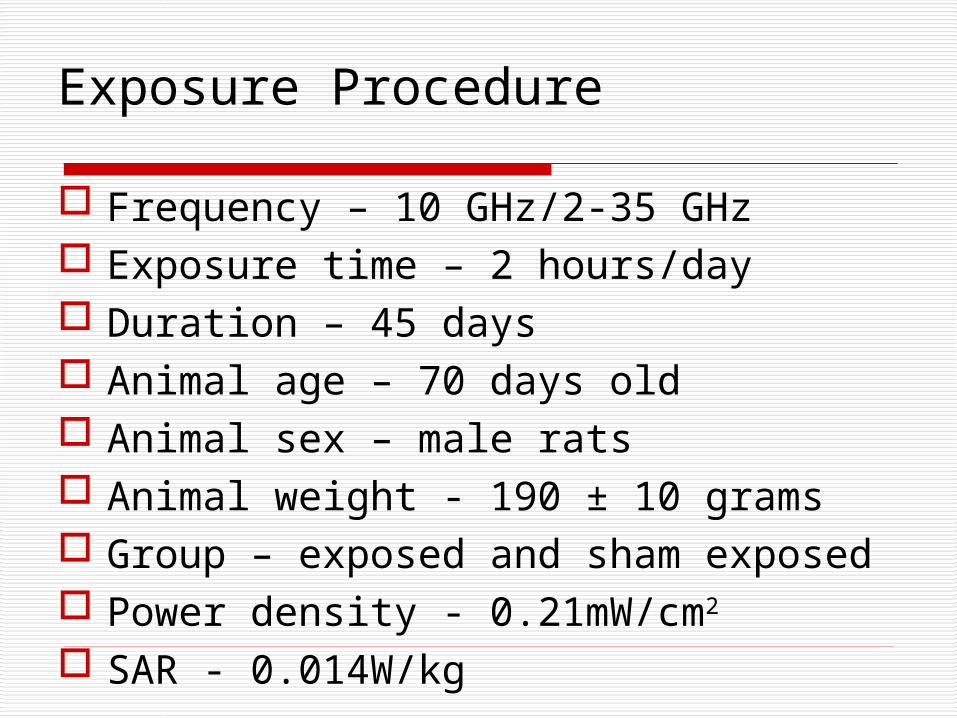
Exposure Procedure
Frequency – 10 GHz/2-35 GHz Exposure time – 2 hours/day Duration – 45 days Animal age – 70 days old Animal sex – male rats Animal weight - 190 ± 10 grams Group – exposed and sham exposed Power density - 0.21mW/cm2 SAR - 0.014W/kg

RESULTS
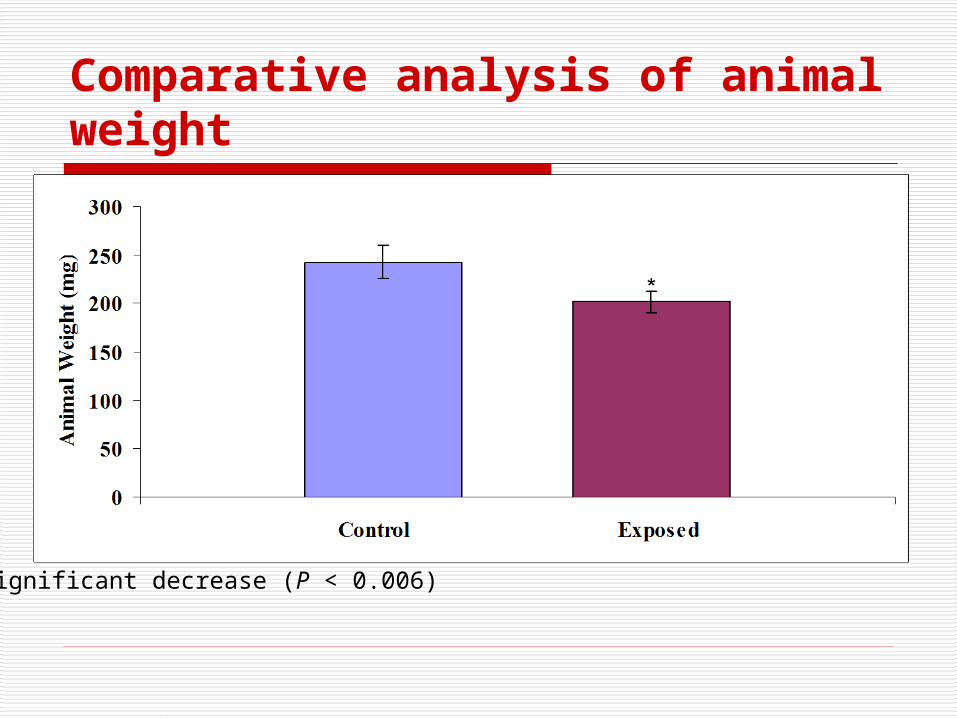
Comparative analysis of animal weight
Significant decrease (P < 0.006)

0
10
20
30
40
50
60
70
1
Spe
rm C
onc.
(2x1
06) Control
Exposed
Sperm count Apoptosis
*
*
Flow Cytometry analysis of mobile phone exposed and sham exposed Sperm Cells
Significant decrease in exposed group, (p<0.02)
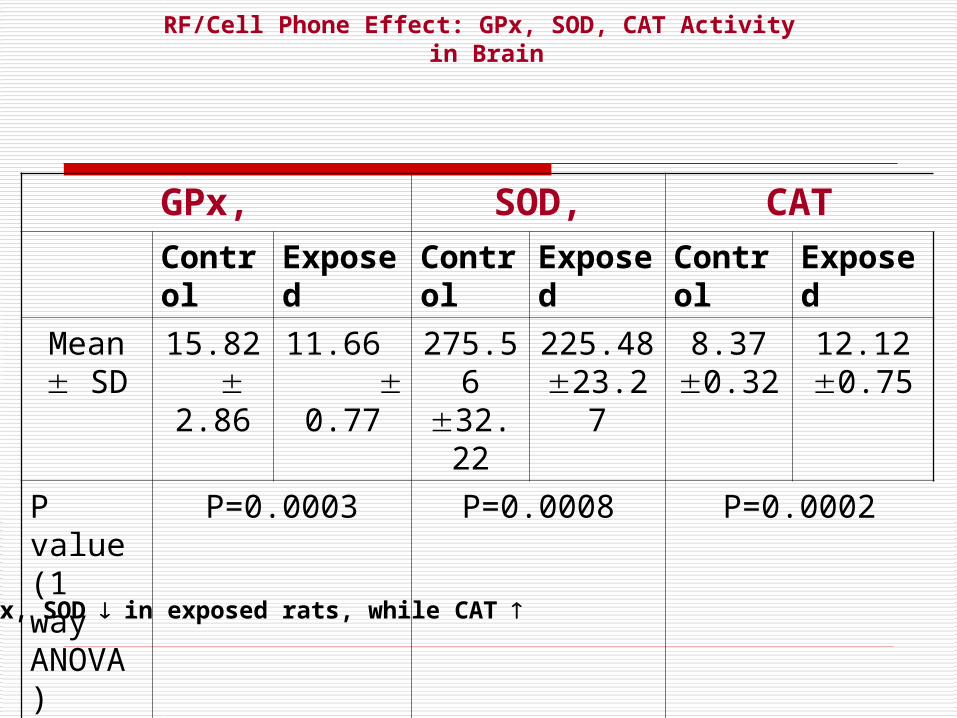
GPx, SOD, CATControl Exposed Control Exposed Control Exposed
Mean SD
15.82 2.86
11.66 0.77
275.56 32.22
225.48 23.27
8.37 0.32
12.12 0.75
P value (1 way ANOVA)
P=0.0003 P=0.0008 P=0.0002
RF/Cell Phone Effect: GPx, SOD, CAT Activity in Brain
GPx, SOD in exposed rats, while CAT

Comparative study of Micronuclei and Histone Kinase
(P = 0.006) (P < 0.002) P Value
(Student t-test)
(3659.08 ± 1399.40 p32counts/mg protein)
(0.67 ± 0.15) Exposed
(Mean±SD)
(5374.91 ± 1366.91 p32counts/mg protein)
(1.36 ± 0.07) Control
(Mean±SD)
Histone kinase (H1)Micronuclei
(PCE/NCE)
(P = 0.006) (P < 0.002) P Value
(Student t-test)
(3659.08 ± 1399.40 p32counts/mg protein)
(0.67 ± 0.15) Exposed
(Mean±SD)
(5374.91 ± 1366.91 p32counts/mg protein)
(1.36 ± 0.07) Control
(Mean±SD)
Histone kinase (H1)Micronuclei
(PCE/NCE)
Comparative statistical analysis of mobile phone exposure effect on micronuclei formation in peripheral blood and histone kinase activity in rat sperm showing significant changes in the exposed group as compared to the sham-exposed group (P<0.05)

Testosterone Caspase-3 activity Activity Apoptosis
0
1
2
3
4
5
6
7
Testos
terone
(ng/ml
)
Sham Exposed Exposed
*
0
5
10
15
20
25
30
35
40
Caspa
se Ac
tivity (
µmol
pN A/
min/m
l)
Sham Exposed Exposed
*

Antioxidant activity: Glutathione Peroxidase and Catalase
Significant change in GPx and CAT (P < 0.05)

Significant decrease (P < 0.05)
Antioxidant activity: Superoxide dismutase

Reactive Oxygen Species
Significant increase (P < 0.05

Significant decrease in exposed group (P < 0.05)
Melatonin activity in pineal gland

Significant increase in exposed group (P < 0.05)
Creatine kinase activity

Caspase-3 activity: Apoptosis
Significant increase in exposed group (P < 0.05)

Sperm Protein Kinase C
Significant decline (P < 0.05)
*

Sperm counts from male Wistar rats exposed to mobile phone radiation
Significant set at P<0.005 Significant set at P<0.05

The effects of mobile phone on the MDA production in sperm
Significantly different form the control (P < 0.05).
Significance set at p < 0.05.

It can be concluded that there are various indicators of tumour promotion, due to electromagnetic field exposure ,but not limited to the following and can be summarised thus:1.Increase in ODC and PKC activity.2.Increase in Ca2+ efflux.3.Altered anti oxidant enzyme activity(GX,GSH,Catalase) 4.DNA strand break (single and double)5.Na+/k+ Phosphatase activity6.Decreased melatonin levels7.Histone kinase activity
Cancer promotion (Stress Development/RF/MW Syndorme)/Effecting reproduction parameters
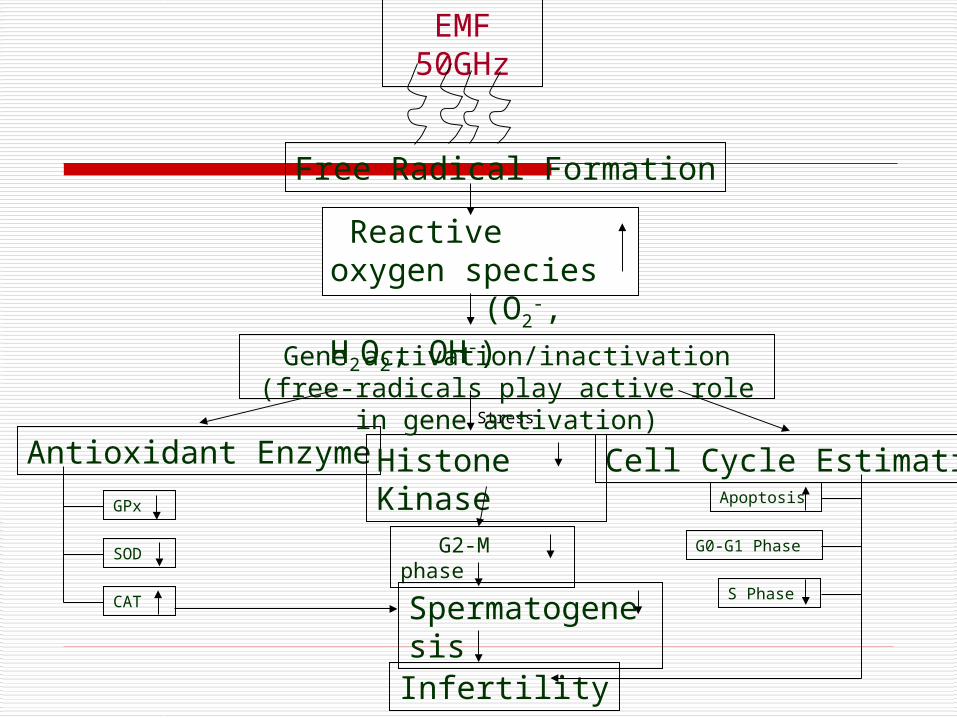
EMF 50GHz
Free Radical Formation
Reactive oxygen species (O2
-, H2O2, OH-)
Antioxidant Enzyme Histone Kinase Cell Cycle EstimationApoptosis
G0-G1 Phase
S Phase
SOD
CAT
GPx
G2-M phase
Stress
Gene activation/inactivation(free-radicals play active role in gene activation)
Infertility
Spermatogenesis

Effect of ELF-EMF: Signal transduction
Plasma membrane
Cellmembrane
Signal transduction & amplificationEnzymes,Genes, Proteins
Nucleus,DNA
Biochemical messenger
Co-operativism +Non linearity +
Non-equilibrium thermodynamic behavior
Amplifying effect of ELF-EMF
Transmembrane coupling of signal to cytoplasm(By soliton waves?)

DNA chain bending
A direct result of equation (7) is the relationship between flowing charge (current), magnetic field, and induced force shown in equation (8) below
Direction of current flow is opposite in 2 wires, applied MF causes repulsion
If DNA helix is considered 2 “wires” carrying charge through electron transport in opposing directions MF exposure may
bend chain in some instances
F I dl
B (8)
I
I
B
F
F
Aftertime I I

Radio Frequency Radiation
Neurons
Control Control
Health hazard ?
Tumor promoter ?
Brain cells
Single strand DNA break Double strand DNA break
Osteoblast
Bone
Positive effect
Fracture healing
Ostoep orosis

Mobile phone radiation effect: Head


Typical diagram of antenna system for measurement of emissions from mobile
towers


SUMMARY OF EMF MECHANISMS
Chronic exposure to EMF creates free radicals which damage DNA, etc.
EMF depress melatonin synthesis and deprive the body fluids of needed anti- oxidative status.
EMF interfere with evolutionarily developed vital life processes (heart beat, brain signals, wound healing etc)

Thank You


