Antonia M. Calafat, Ph.D.
Division of Laboratory SciencesNational Center for Environmental Health
Centers for Disease Control and PreventionAtlanta, GA
Biomonitoring for Exposure Assessment: Role,
Challenges, and Needs
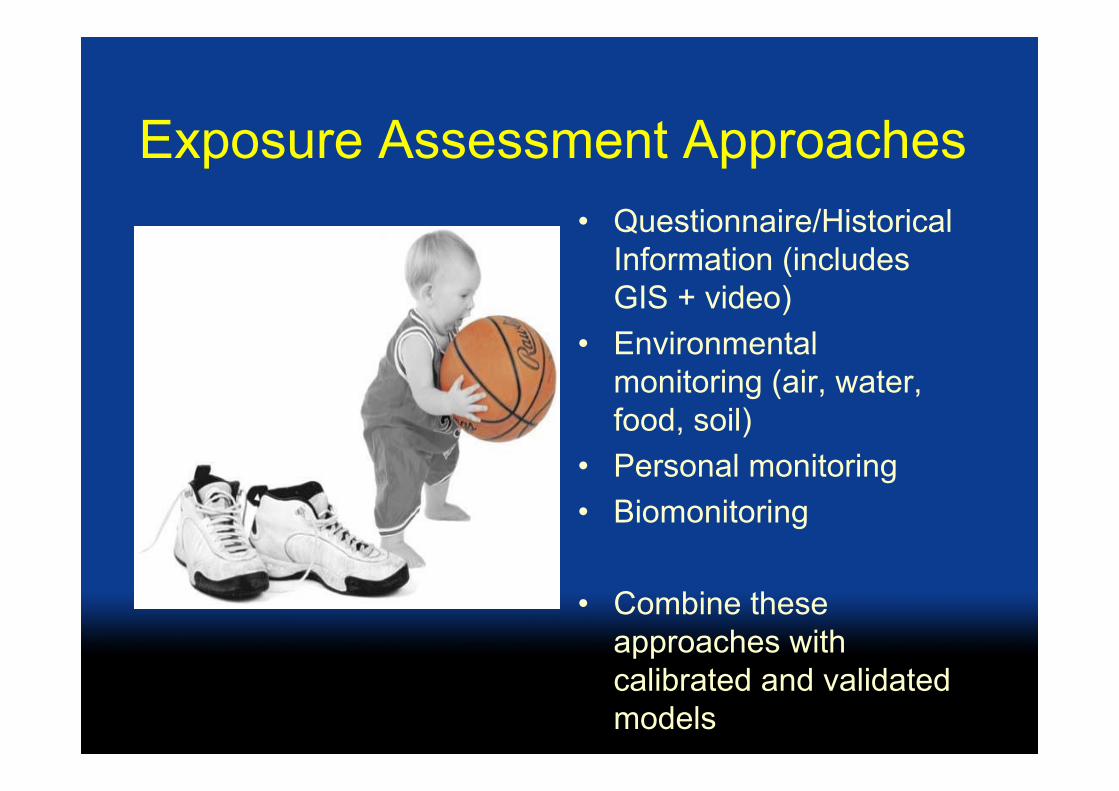
Exposure Assessment Approaches• Questionnaire/Historical
Information (includes GIS + video)
• Environmental monitoring (air, water, food, soil)
• Personal monitoring• Biomonitoring
• Combine these approaches with calibrated and validated models
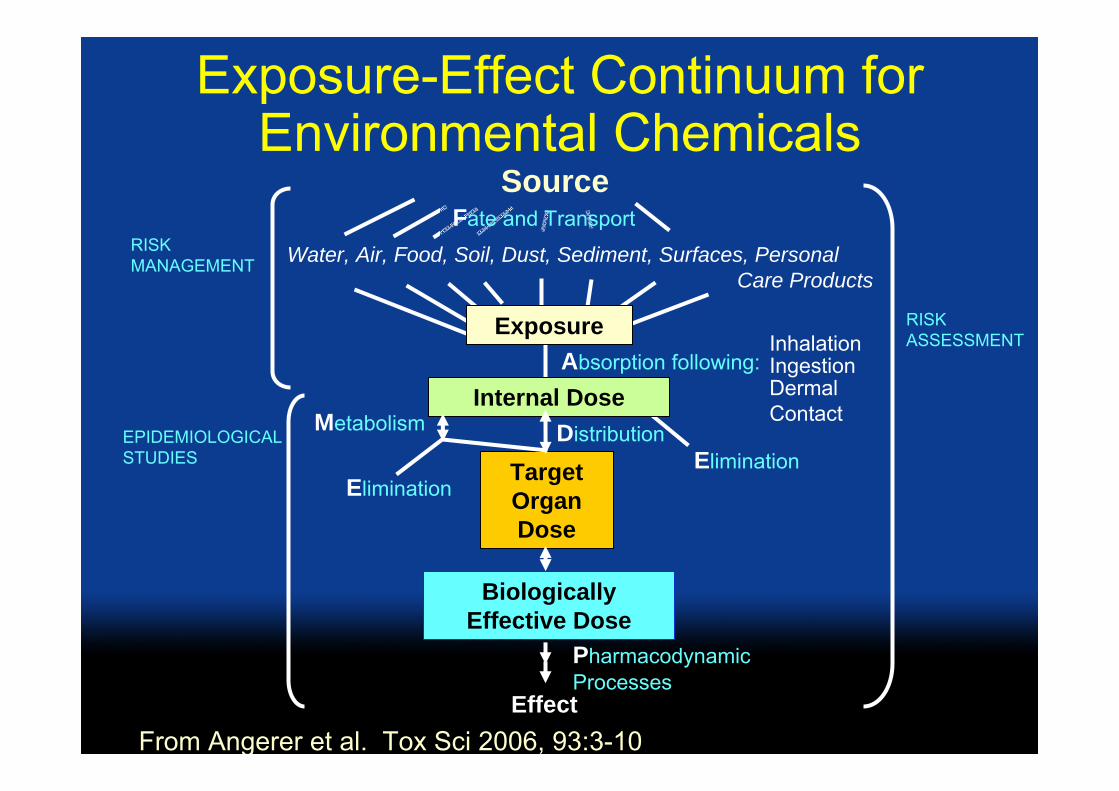
Water, Air, Food, Soil, Dust, Sediment, Surfaces, PersonalCare Products
Distribution
Source
Internal Dose
InhalationIngestionDermal Contact
Target Organ Dose
Biologically Effective Dose
Absorption following:
Metabolism
EliminationElimination
Effect
RISKMANAGEMENT
EPIDEMIOLOGICAL STUDIES
RISKASSESSMENT
PharmacodynamicProcesses
Exposure-Effect Continuum for Environmental Chemicals
From Angerer et al. Tox Sci 2006, 93:3-10
Exposure
Fate and Transport
Biomonitoring
Assessment of internal dose by measuring the parent chemical (or its metabolite or reaction product) in human blood, urine, milk, saliva, adipose, or other tissue

CDC’s Biomonitoring Programs for Exposure Assessment
• National Health and Nutrition Examination Survey (NHANES)
• Epidemiological studies of specific populations
What is NHANES?
• Annual survey (since 1999) conducted by the National Center for Health Statistics, CDC
• Stratified, multistage probability sample of the civilian, noninstitutionalized U.S. population• ~5,000 persons/year• 15 counties/year (mobile examination centers)
• Includes detailed medical history, dental & physical examinations, laboratory tests
• Collects demographic, socioeconomic & behavioral data• Also collects biological specimens
www.cdc.gov/nchs/nhanes.htm
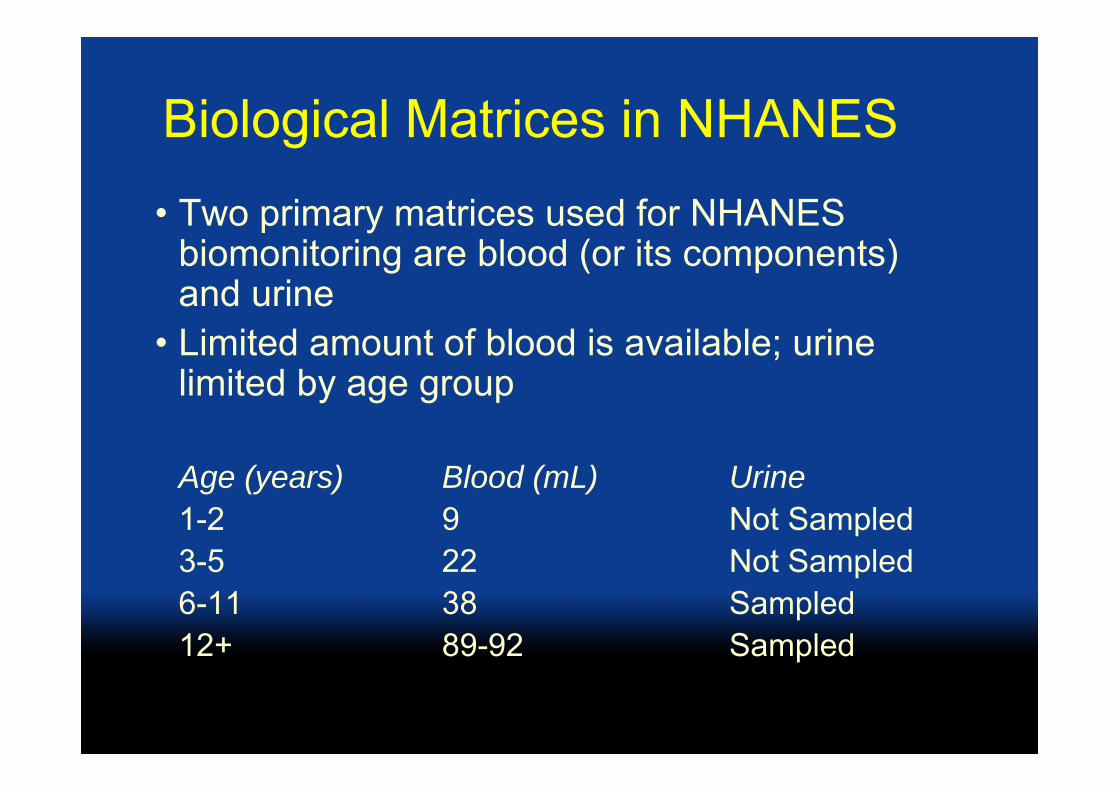
Biological Matrices in NHANES• Two primary matrices used for NHANES
biomonitoring are blood (or its components) and urine
• Limited amount of blood is available; urine limited by age group
Age (years) Blood (mL) Urine1-2 9 Not Sampled3-5 22 Not Sampled6-11 38 Sampled12+ 89-92 Sampled
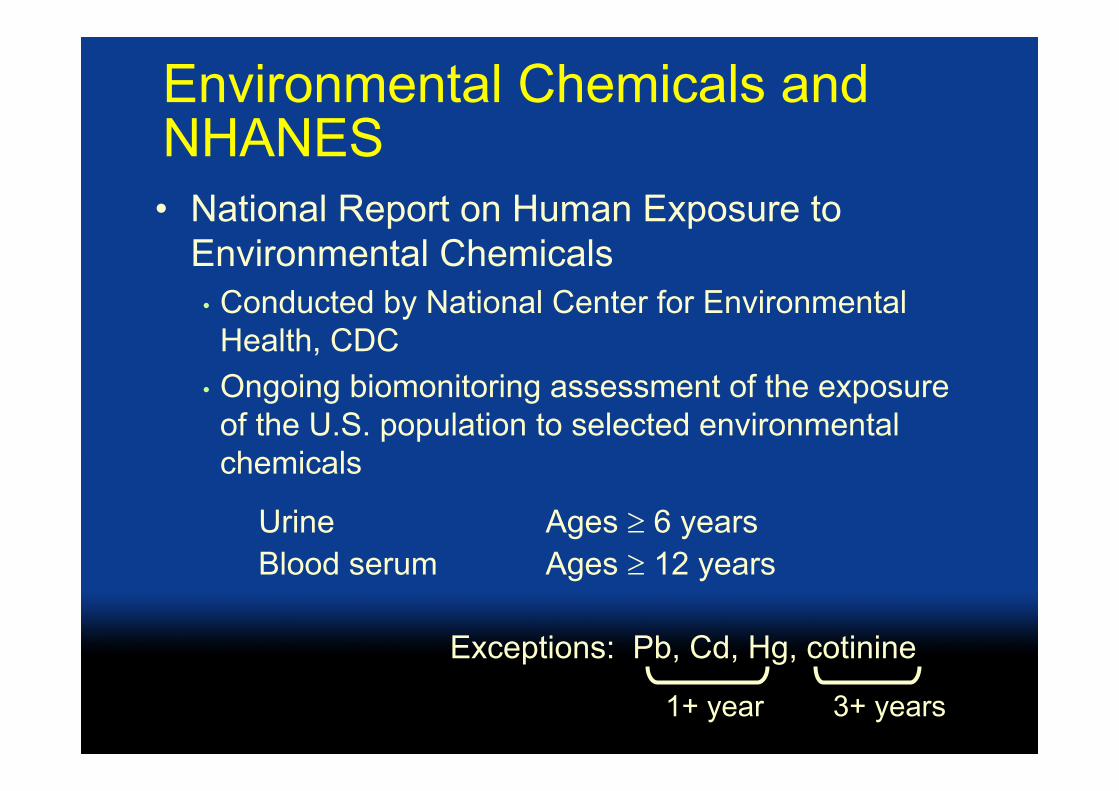
Environmental Chemicals and NHANES
Urine Ages ≥ 6 years Blood serum Ages ≥ 12 years
Exceptions: Pb, Cd, Hg, cotinine
1+ year 3+ years
• National Report on Human Exposure to Environmental Chemicals
• Conducted by National Center for Environmental Health, CDC
• Ongoing biomonitoring assessment of the exposure of the U.S. population to selected environmental chemicals
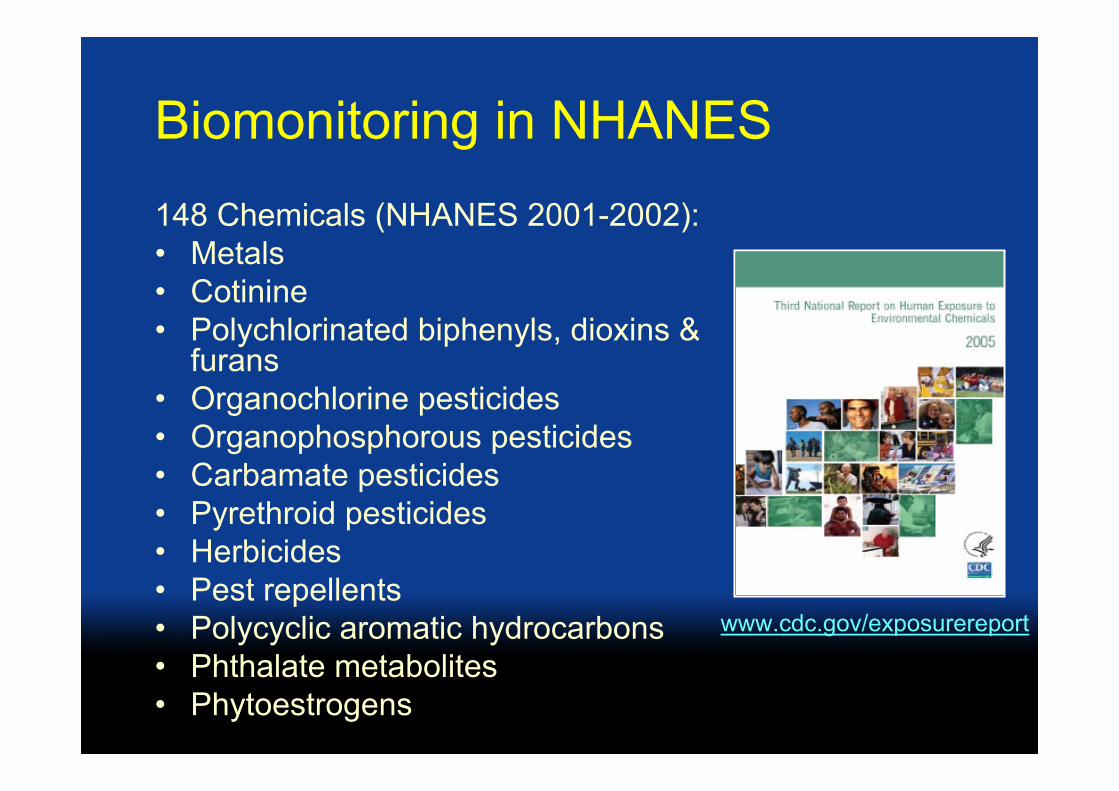
Biomonitoring in NHANES148 Chemicals (NHANES 2001-2002):• Metals• Cotinine• Polychlorinated biphenyls, dioxins &
furans• Organochlorine pesticides• Organophosphorous pesticides• Carbamate pesticides• Pyrethroid pesticides• Herbicides• Pest repellents• Polycyclic aromatic hydrocarbons• Phthalate metabolites• Phytoestrogens
www.cdc.gov/exposurereport
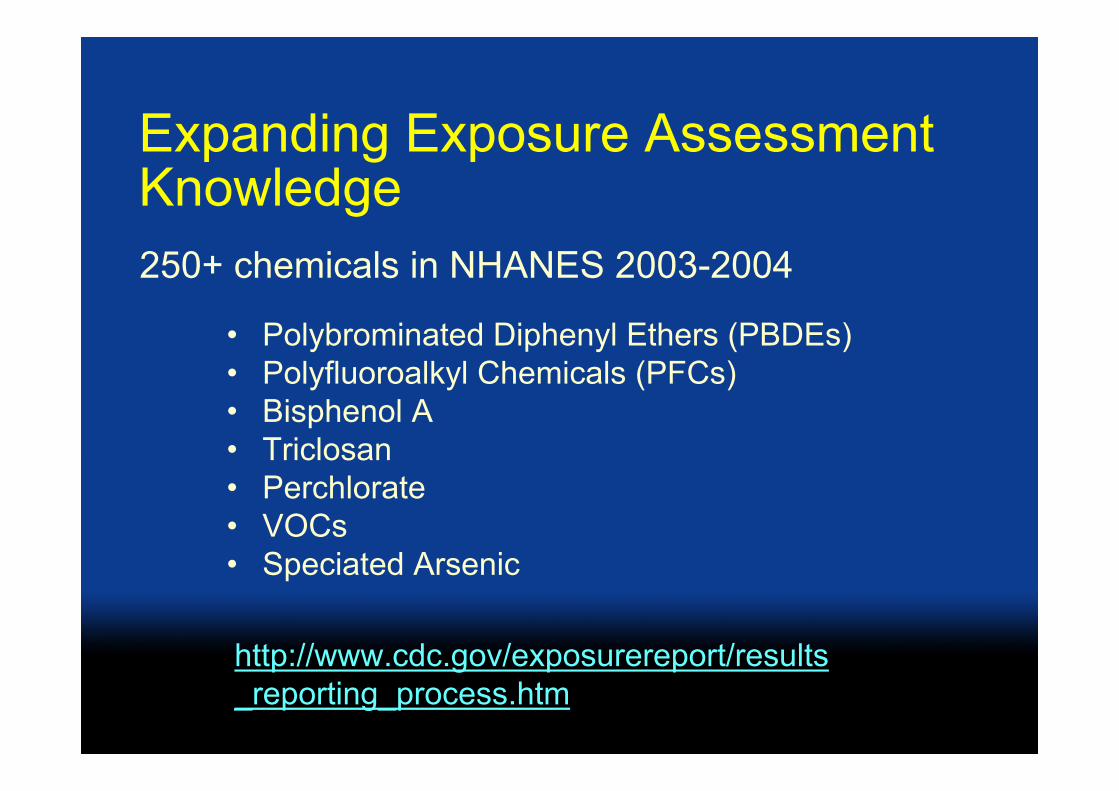
Expanding Exposure Assessment Knowledge
• Polybrominated Diphenyl Ethers (PBDEs)• Polyfluoroalkyl Chemicals (PFCs)• Bisphenol A• Triclosan• Perchlorate• VOCs• Speciated Arsenic
http://www.cdc.gov/exposurereport/results_reporting_process.htm
250+ chemicals in NHANES 2003-2004
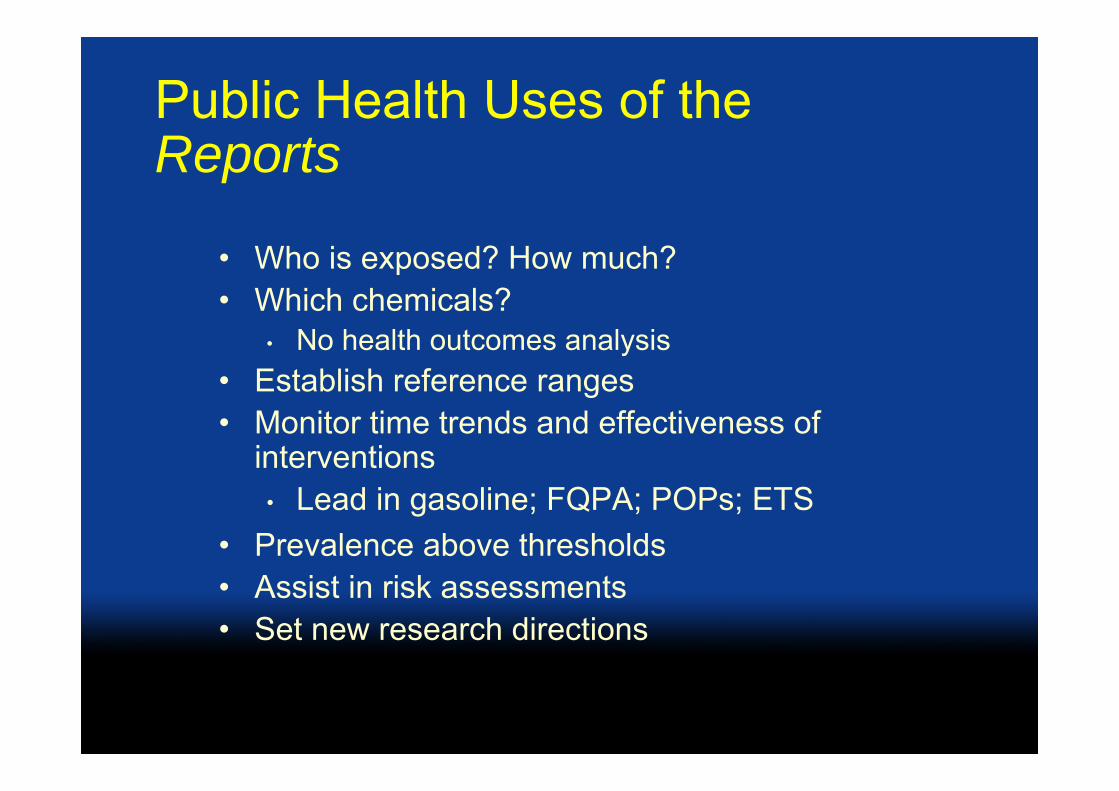
Public Health Uses of the Reports
• Who is exposed? How much?• Which chemicals?
• No health outcomes analysis• Establish reference ranges• Monitor time trends and effectiveness of
interventions• Lead in gasoline; FQPA; POPs; ETS
• Prevalence above thresholds• Assist in risk assessments• Set new research directions
Serum cotinine (ng/mL)
Per
cent
age
of th
e po
pula
tion
0
1
2
3
4
5
0.1 1.0 10 100 1000
ETS exposure(nonsmokers)
Smokers
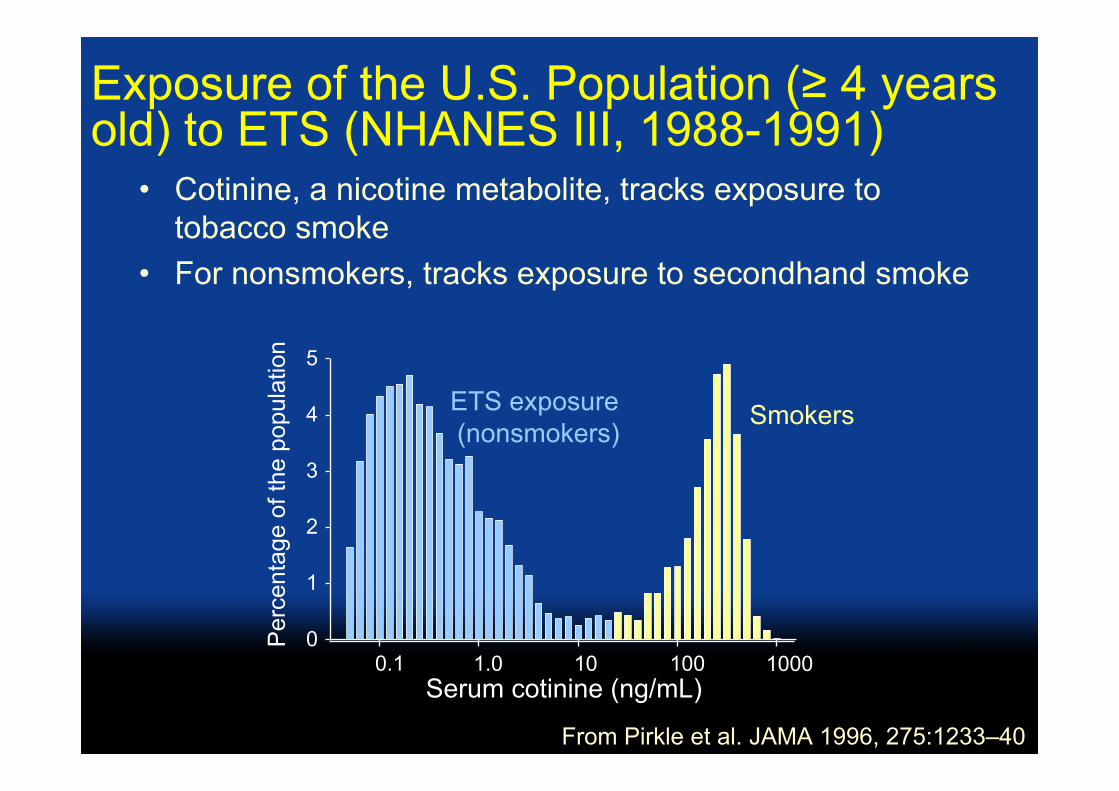
Exposure of the U.S. Population (≥ 4 years old) to ETS (NHANES III, 1988-1991)
From Pirkle et al. JAMA 1996, 275:1233–40
• Cotinine, a nicotine metabolite, tracks exposure to tobacco smoke
• For nonsmokers, tracks exposure to secondhand smoke
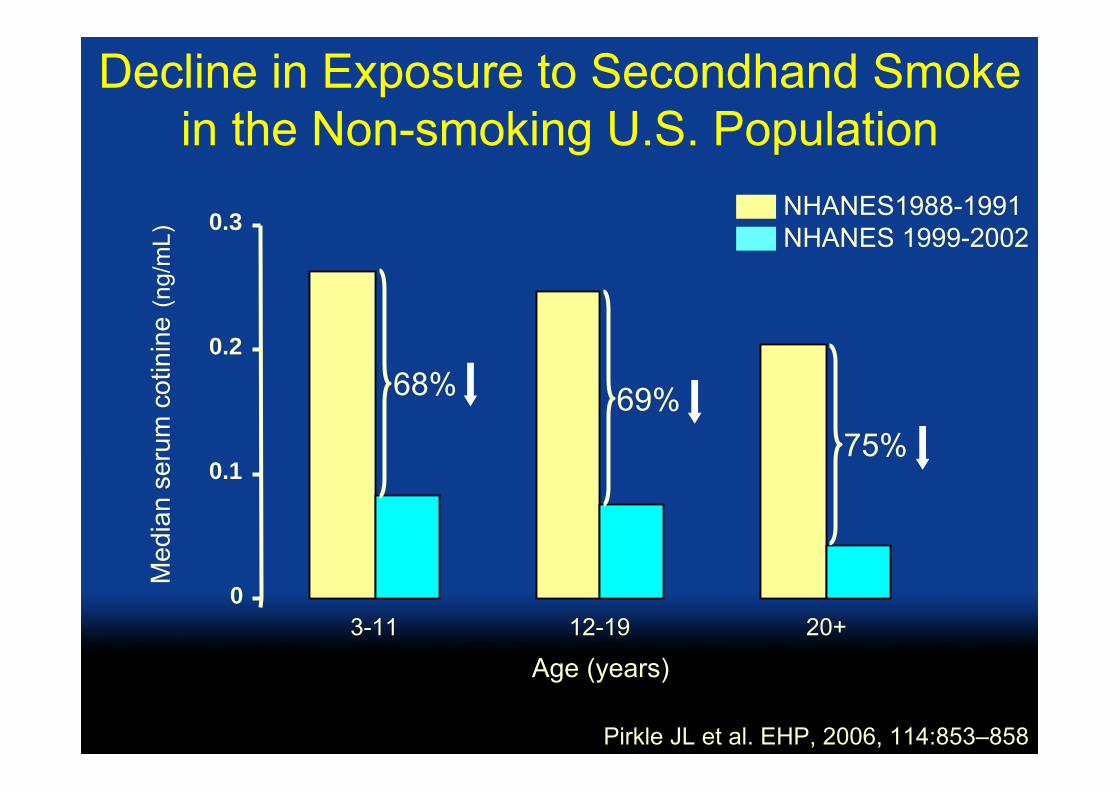
Decline in Exposure to Secondhand Smoke in the Non-smoking U.S. Population
0
0.1
0.2
0.3
3-11 12-19 20+
Age (years)
Med
ian
seru
m c
otin
ine
(ng/
mL)
68%
75% 69%
NHANES1988-1991NHANES 1999-2002
Pirkle JL et al. EHP, 2006, 114:853–858
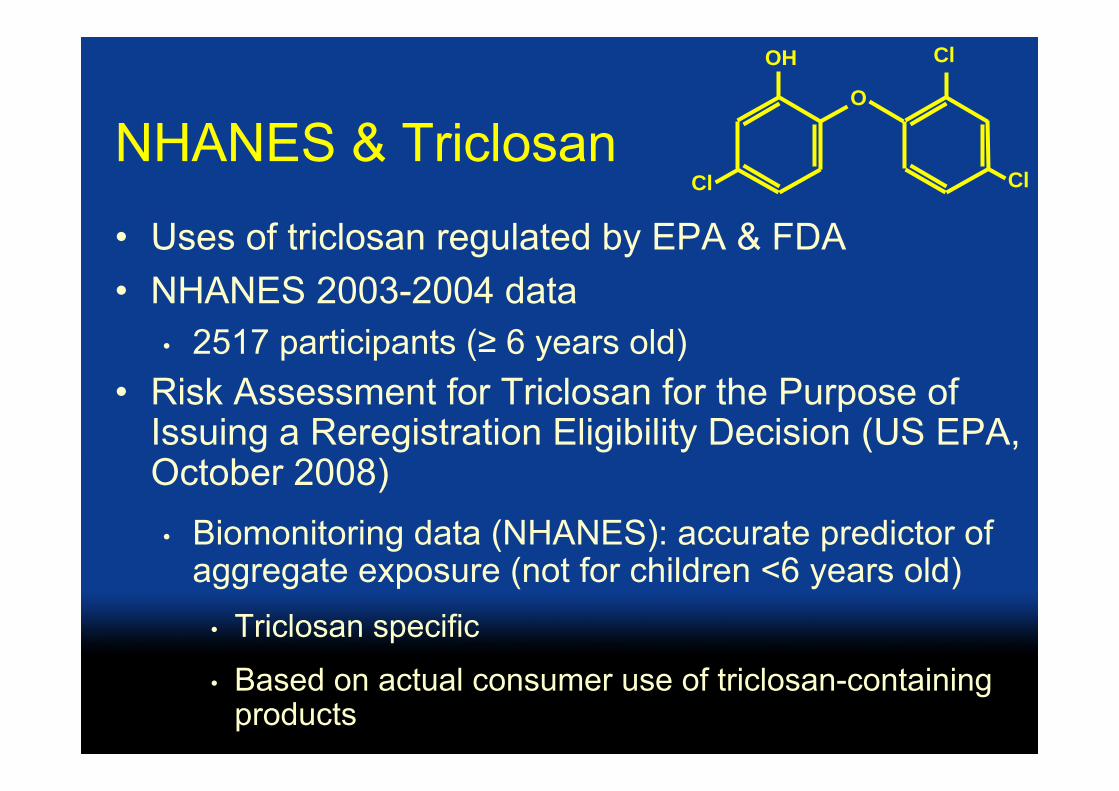
NHANES & Triclosan• Uses of triclosan regulated by EPA & FDA • NHANES 2003-2004 data
• 2517 participants (≥ 6 years old)• Risk Assessment for Triclosan for the Purpose of
Issuing a Reregistration Eligibility Decision (US EPA, October 2008)• Biomonitoring data (NHANES): accurate predictor of
aggregate exposure (not for children <6 years old)• Triclosan specific
• Based on actual consumer use of triclosan-containing products
ClOH
O
Cl Cl
Analyte vs Exposure Biomarker
Many analytes can be measured simultaneously, but additional information is needed to demonstrate the utility of these analytes as exposure biomarkers
To Interpret Biomonitoring Data• Metabolism & other toxicokinetics data
• Concentration vs exposure• Most representative/abundant biomarker• Comparing “exposure” among chemicals
• From exposure to dose• Interpret urinary concentrations• Unknown sources/routes
• Sampling & matrix considerations• Potential for contamination• Stability
NHANES Doesn’t Include
• Exposure data for the very young (including fetal and neonatal exposure)
• Data for specific population groups, sources & uses of the chemicals
• Geographical & seasonal informationOTHER STUDIES
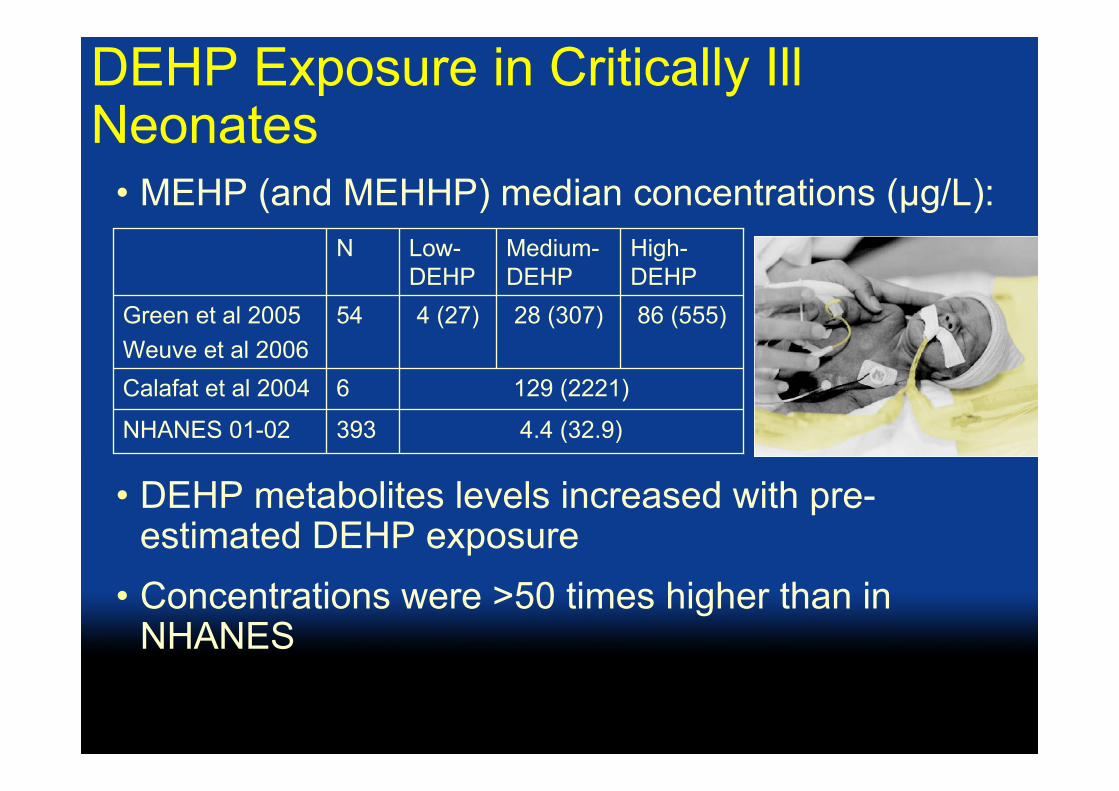
DEHP Exposure in Critically Ill Neonates
• MEHP (and MEHHP) median concentrations (µg/L):
• DEHP metabolites levels increased with pre-estimated DEHP exposure
• Concentrations were >50 times higher than in NHANES
NHANES 01-02
Calafat et al 2004
Green et al 2005Weuve et al 2006
129 (2221)6
4.4 (32.9)393
86 (555)28 (307)4 (27)54
High-DEHP
Medium-DEHP
Low-DEHP
N
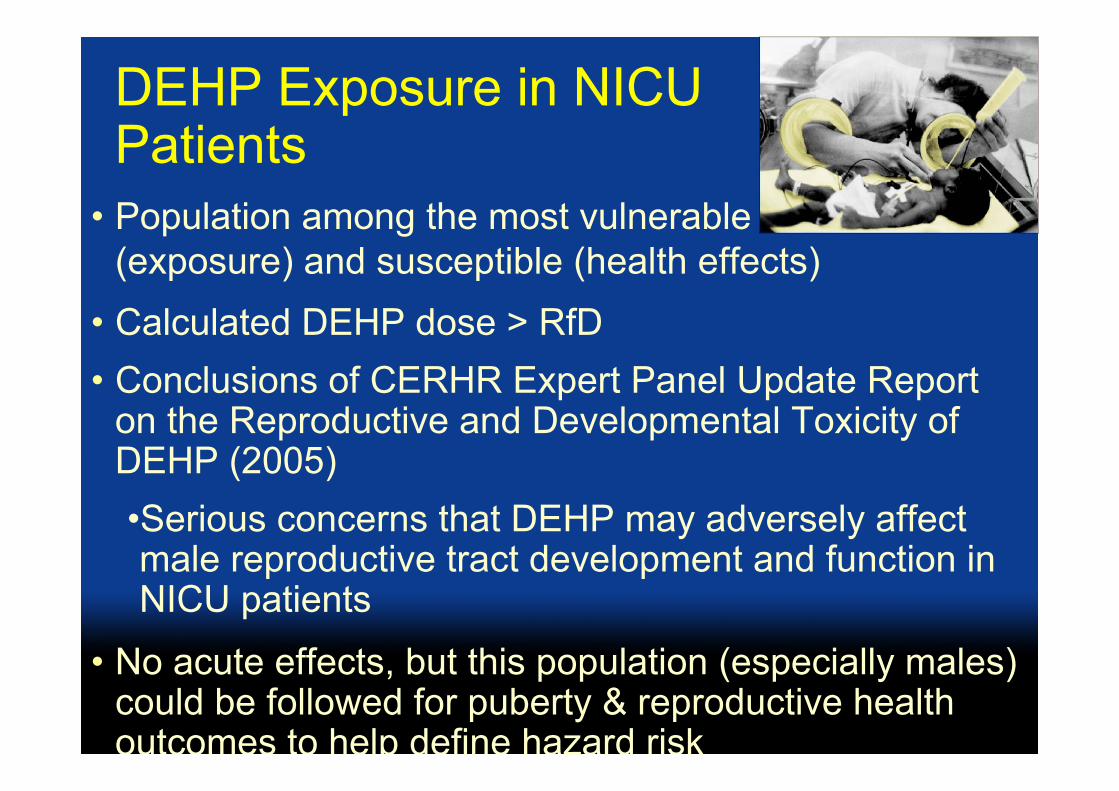
DEHP Exposure in NICU Patients
• Population among the most vulnerable (exposure) and susceptible (health effects)
• Calculated DEHP dose > RfD• Conclusions of CERHR Expert Panel Update Report
on the Reproductive and Developmental Toxicity of DEHP (2005)•Serious concerns that DEHP may adversely affect male reproductive tract development and function in NICU patients
• No acute effects, but this population (especially males) could be followed for puberty & reproductive health outcomes to help define hazard risk

Other Potential Roles of Biomonitoring in Risk Assessment• Hazard identification
• No exposure equals no hazard• Toxicology
• Dose response (animal & epi studies)• Dose administered & internal dose
• Exposure assessment • Aggregate exposure data
• Risk characterization• Number of people with internal dose levels above a
given toxic level (e.g., blood lead levels)
Additional Thoughts About Biomonitoring
• Reflect cumulative exposure(s)• Aggregate exposure & risk assessment
• Establish priorities• Identify chemicals w/ high exposure
prevalence• ATSDR Toxicological Profiles
• Monitor susceptible/vulnerable populations• Targeted vs general population data
Research Needs• Continue National Surveys
• Predict aggregate exposures • Additional studies
• Vulnerable/susceptible populations• Specific situations• Internal dose in animal studies
• Going from concentration to exposure• Improve understanding of toxicokinetics• Improve epi data
• Collection of additional data (e.g., urinary output)• Ranges vs point estimates
• Communication of results – public perception

THANK YOU!
“The findings and conclusions in this presentation have not been formally disseminated by the Centers for Disease Control and Prevention and should not be construed to represent any agency determination or policy”

This paper was produced for a meeting organized by Health & Consumer Protection DG and represents the views of its author on thesubject. These views have not been adopted or in any way approved by the Commission and should not be relied upon as a statement of the Commission's or Health & Consumer Protection DG's views. The European Commission does not guarantee the accuracy of the dataincluded in this paper, nor does it accept responsibility for any use made thereof.


