
BlueHealth is funded by the European Union’s Horizon 2020 research
& innovation programme, grant agreement No 666773
Blue Space and Human Health:
Maximising the co-benefits of adaptation to climate change
Dr Tim Taylor
University of Exeter Medical School
www.bluehealth2020.eu | @BlueHealthEU
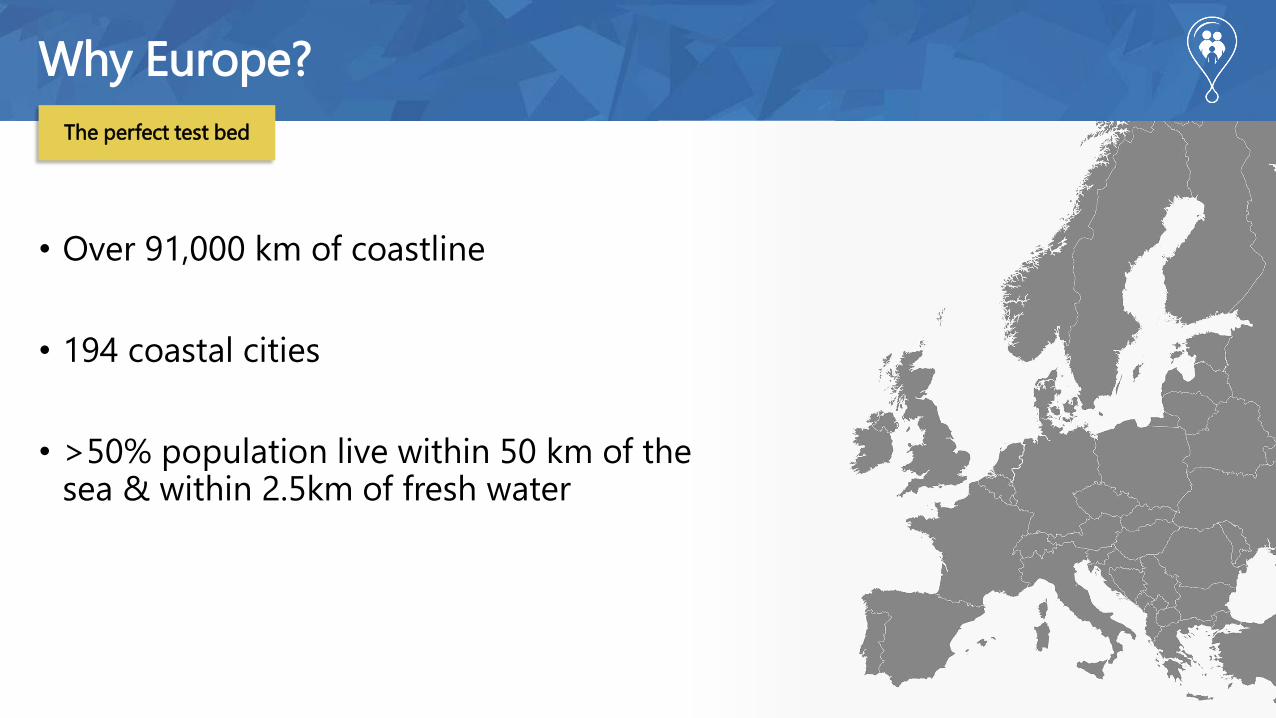
Why Europe?
The perfect test bed
• Over 91,000 km of coastline
• 194 coastal cities
• >50% population live within 50 km of the sea & within 2.5km of fresh water

www.bluehealth2020.eu | @BlueHealthEU
Nine institutions, 90+ researchers
An international multi-partner project

www.bluehealth2020.eu | @BlueHealthEU
Funded by the European Union
EU Horizon 2020 programme
• €6 million research grant
• Launched January 2016
• Runs until June 2020

www.bluehealth2020.eu | @BlueHealthEU
What is blue space?
Natural or manmade
Outdoor environment
Featuring water
Accessible to humans
In, on, near, sense
UrbanRural
Coastal
Inl&

www.bluehealth2020.eu | @BlueHealthEU
Conceptual model
Understanding the benefits of urban blue spaces
Population health &
wellbeing
How do we maximise the
positive impacts of urban
blue spaces?Activities in blue spaces
Physical, social, virtual
Contact with blue space
Indirect & direct interactions Climate & extreme
events
How will natural
processes change over
time?
Quantity & quality
of blue space
How do we ensure the
accessibility of these
spaces?
Urban planning &
infrastructure
How do we design our
cities?

www.bluehealth2020.eu | @BlueHealthEU
A historical perspective
Beneficial effects on health
Dr Richard Russell (1687– 1759)
Royal Sea Bathing Hospital (Est.1791)
Dr Fortescue Fox
(1934 & 1938 Lancet)
Charlier & Chaineux
(2009) Thalassotherapy

www.bluehealth2020.eu | @BlueHealthEU
Before BlueHealth
Where were the gaps?
• Previous work links natural environments &
improved health
• Tended to focus on green spaces
• Less known about blue space & health

www.bluehealth2020.eu | @BlueHealthEU
Knowledge on blue space and health
Existing literature
Slide: Mat White

www.bluehealth2020.eu | @BlueHealthEU
Knowledge on blue space and health
Existing literature
Slide: Mat White
www.bluehealth2020.eu | @BlueHealthEU
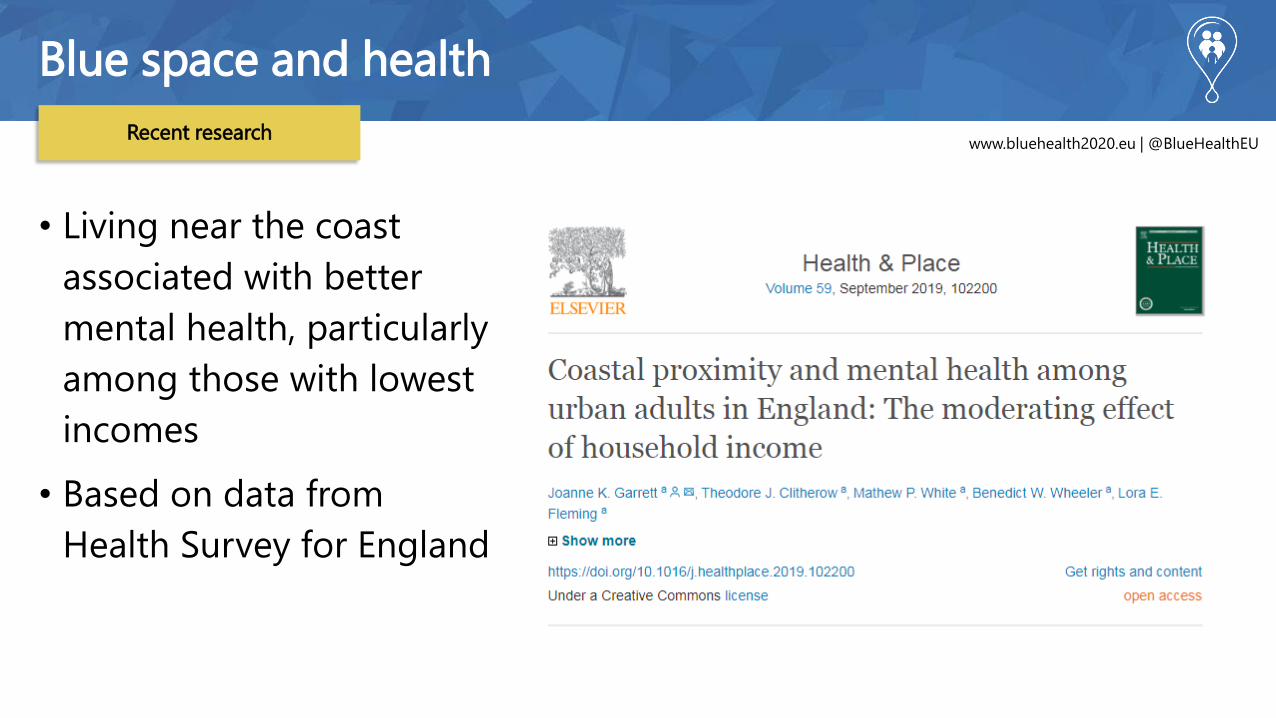
Blue space and health
Recent research
• Living near the coast
associated with better
mental health, particularly
among those with lowest
incomes
• Based on data from
Health Survey for England

www.bluehealth2020.eu | @BlueHealthEU
Blue space and health
Recent research
• Systematic review showed
consistent evidence of
positive associations between
blue space exposure and
mental health and physical
activity.
• Need for more longitudinal
studies and natural
experiments to understand
causality.

www.bluehealth2020.eu | @BlueHealthEU
Coastal adaptation and health
Why is it important?
• The coast is an important provider of benefits to health
• Climate change poses significant risks to the coastal
environment – e.g. sea level rise, flooding
• When planning adaptation it is important to take into
account the potential to increase the co-benefits for health…

www.bluehealth2020.eu | @BlueHealthEU
Examples of adaptations in coastal environments
Maximising co-benefits
• Seawalls => ensuring space for recreation (walking, cycling,
angling)

Image: oneblackline | Wikimedia Commons
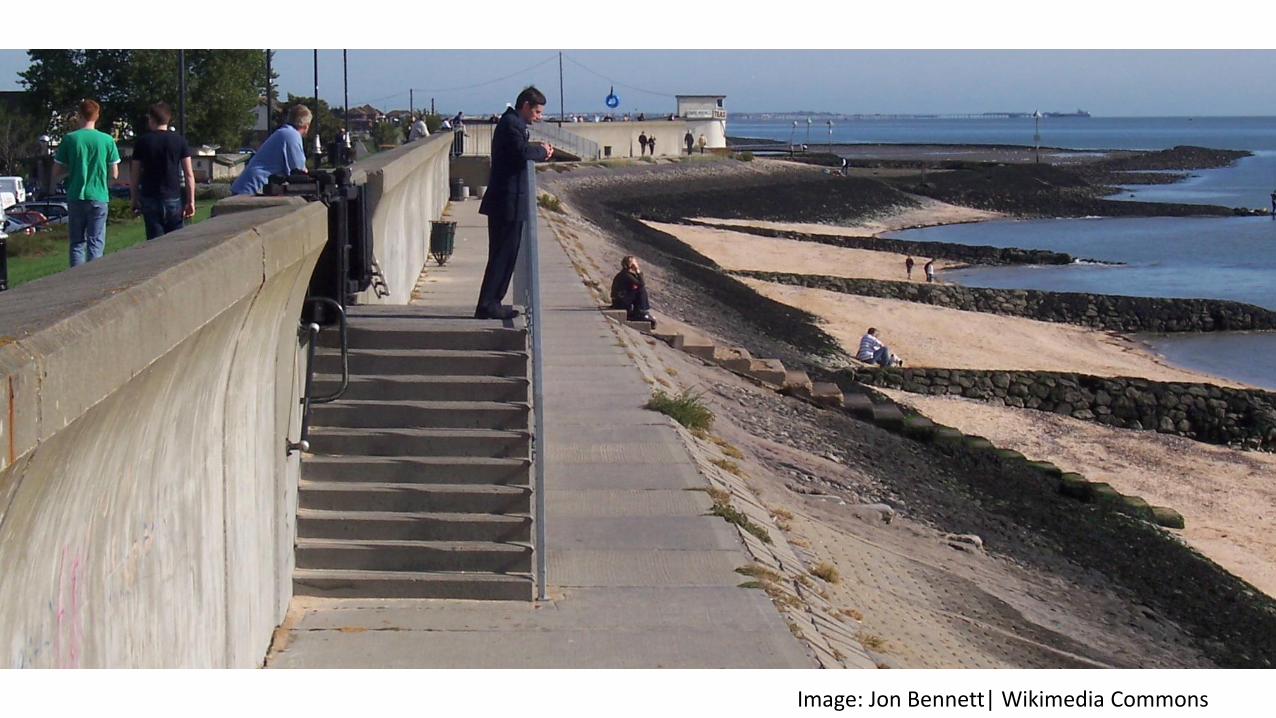
Image: Jon Bennett| Wikimedia Commons

www.bluehealth2020.eu | @BlueHealthEU
Examples of adaptations in coastal environments
Maximising co-benefits
• Use of water for cooling of buildings e.g. canals, fountains…
© atelier GROENBLAUW
www.bluehealth2020.eu | @BlueHealthEU
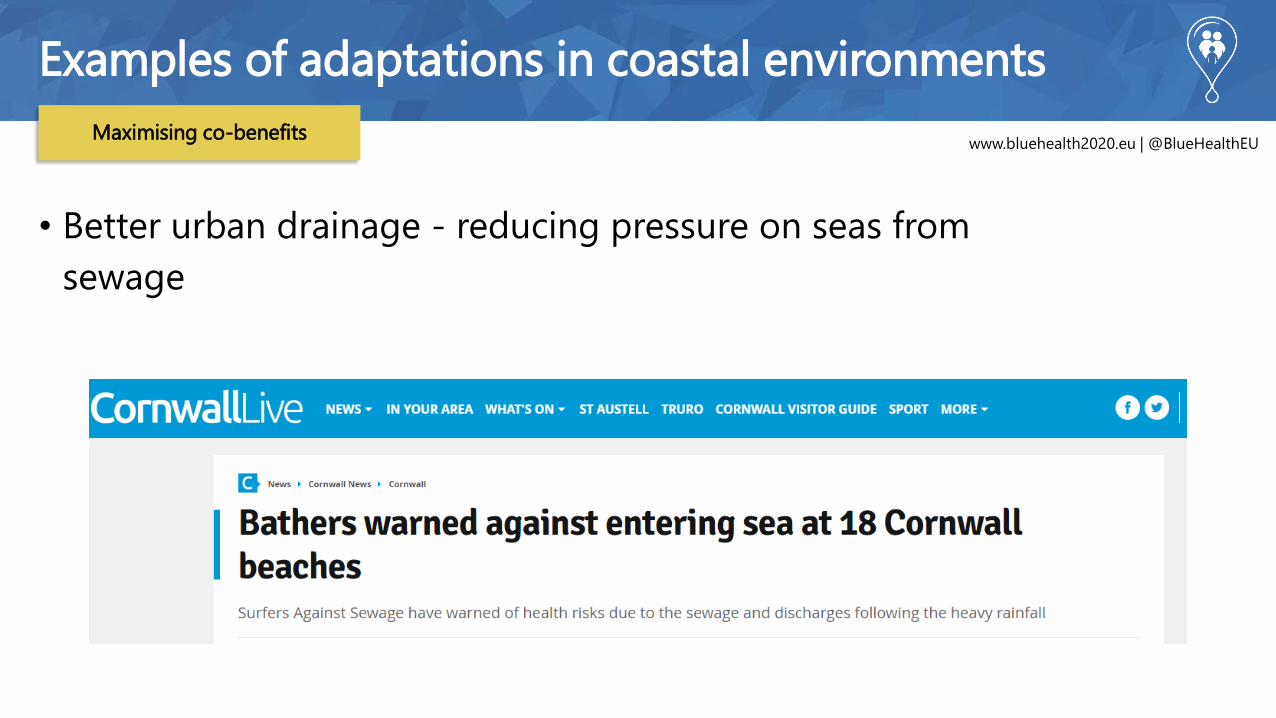
Examples of adaptations in coastal environments
Maximising co-benefits
• Better urban drainage - reducing pressure on seas from
sewage

Co-benefits and costs of adaptation
Source: Martinez-Juarez, Chiabai, Quiroga-Gomez and Taylor (2015) Ecosystems and human health: Towards a conceptual framework for assessing the co-benefits of adaptation. Basque Centre for Climate Change Working Paper.

Adaptation, Environment and Health Linkages
Adaptation measure Possible impacts on
natural environment
Potential health
implication
Sustainable urban drainage systems
Potential for green corridors for recreation
Possible increase in recreational walking and cycling, improved physical and psychological health
Green roofs Potential improvement in views, potential increase in biodiversity
Possible improved psychological health
Flood defences Potential to provide paths for walking
Possible increase in recreational walking and cycling, improved
physical and psychological health
Emergency warning systems Limited potential to reduce impacts
Direct impacts in terms of reduced mortality and morbidity
Improved wetlands for flood defence
Increased coverage of wetlands and biodiversity benefits
Possible increase in recreation
Urban forests Increased coverage of forests in urban area, cooling and
biodiversity benefits
Reduced heat stress and potential for increase in recreational walking
and cycling, improved physical and psychological health
Source: Martinez-Juarez, Chiabai, Quiroga-Gomez and Taylor (2015) Ecosystems and human health: Towards a conceptual framework for assessing the co-benefits of adaptation. Basque Centre for Climate Change Working Paper.

www.bluehealth2020.eu | @BlueHealthEU
Social & structural interventions
Lessons for coastal adaptation
• Teats Hill, Plymouth, UK
• Deprived area of coastal community
• Community and stakeholders involved:
• Community participation for the design
• Collaboration with council & planners
• New grass/seating/outdoor theatre
• Evaluating impacts• BlueHealth Behavioural Assessment Tool (BBAT)
• BlueHealth Behavioural Assessment Tool (BEAT)
• BlueHealth Community Level Survey (BCLS)
• BlueHealth Slam (DST)

www.bluehealth2020.eu | @BlueHealthEU
Social & structural interventions
3 new tools
1. Behavioural Assessment Tool (BBAT)
2. Environmental Assessment Tool (BEAT)
3. Community Level Survey (BCLS)
• Help planners, architects, communities
• Evaluate & monitor blue space use
• Assessments pre/post
• Inform blue infrastructure
• Robust, transparent, repeatable

www.bluehealth2020.eu | @BlueHealthEU
BlueHealth Behavioural Assessment Tool
Assessing what people do at a site
• Systematic observation of site
• Who is doing what, where?
• Maps passive/active behaviours
• Compares groups & activities
• Suggests an observation protocol
• Statistical analysis
• Built in QGIS
• Will be a plugin for public
• Visual geographic heat maps
Before interventionAfter intervention

www.bluehealth2020.eu | @BlueHealthEU
BlueHealth Community Level Survey
Surveying sites at the local level
• Measures social context & wellbeing:
• Flexible surveys: online, paper, in-person
• Adaptable: user can add questions
• Builds evidence base for plans:
• People: who?
• Visits: where/what/how?
• Did it affect health?

www.bluehealth2020.eu | @BlueHealthEU
Decision Support Tool
Planning, designing & managing blue spaces
• Aimed at planners, authorities, engineers,
policy makers, businesses, & the public.
• Highlights risks & benefits to
• public health & wellbeing
• the environment

www.bluehealth2020.eu | @BlueHealthEU
Valuing trips and water quality: an application
Data used
• 14 European countries
• Four waves (Jun-17, Sep-17, Dec-
17, Mar-18)
• Large number of attitudinal,
psychological and well-being
variables were assessed
• More detailed information on last
blue space site visited:
• Visit frequency (last 3 months)
• Perceived water quality

www.bluehealth2020.eu | @BlueHealthEU
Blue Space VisitsLessons from the BlueHealth
Survey
• 18 possible blue space site types
• Removal of 2 site types (fountains, ice rinks) N = 5,744
0 200 400 600 800 1000 1200
Salt marsh, estuary or lagoon
Sea cliffs
Fen, marsh or bog
Outdoor skating or ice hockey rink
Waterfall or rapids
Rocky or stony shore
Pier
Open sea
Outdoor public pool/lido/spa
Ornamental water feature/fountain
Harbour or marina
Sandy beach or dunes
Streams or ponds
Rural river/canal
Urban river/canal
Nat/art lake/reservoir
Seaside promenade

www.bluehealth2020.eu | @BlueHealthEU
Travel Cost Method
An introduction
• Assess number of visits to recreational site.
• Typically performed for one site. This study uses data from a general
pan-European household survey and asks about the last visit to a blue
space site.
• Calculation of individual travel cost to that site using information on:
• Round-trip distance between home and site
• Mode of transport
• Vehicle and/or public transport costs
• Opportunity cost of time (often a share of individual income)
• Collect additional information on site type, perceived water quality,
activities, etc.

www.bluehealth2020.eu | @BlueHealthEU
Perceived water quality
Overview
• Respondents stated the perceived
level of water quality of the site
they visited last
• European bathing water quality
scale:
• Excellent
• Good
• Sufficient (we used: “Acceptable”)
• Poor

www.bluehealth2020.eu | @BlueHealthEU
Contingent behaviour method
Overview
• Works in combination with travel cost method
Visits in last 4 weeks
Visits in next 4 weeks?
Visits in next 4 weeks?
Perceived water quality at site
Imagine water quality improvement
Imagine water quality deterioration
Travel cost method
Contingent behaviour method
• This results in three observations per respondent (N = 17,232)

www.bluehealth2020.eu | @BlueHealthEU
BlueHealth Survey
Respondents by country
0 100 200 300 400 500 600
Bulgaria
Czech Republic
Estonia
Finland
France
Germany
Greece
Ireland
Italy
Netherlands
Portugal
Spain
Sweden
United Kingdom
Respondents

www.bluehealth2020.eu | @BlueHealthEU
Perceived water qualityLessons from the BlueHealth
survey
0% 10% 20% 30% 40% 50% 60% 70% 80% 90% 100%
Urban river/canal
Streams or ponds
Salt marsh, estuary o
Rural river/canal
Harbour or marina
Seaside promenade
Pier
Total
Fen, marsh or bog
Nat/art lake/reservoi
Open sea
Rocky or stony shore
Sandy beach or dunes
Outdoor public pool/l
Sea cliffs
Waterfall or rapids
Poor Sufficient Good Excellent
• Perceived water
quality across blue
space site types (N =
5,744)

www.bluehealth2020.eu | @BlueHealthEU
Perceived water quality
Cross country comparison
0% 20% 40% 60% 80% 100%
Czech Republic
Finland
Bulgaria
Netherlands
Estonia
Italy
France
Germany
Greece
United Kingdom
Sweden
Portugal
Spain
Ireland
Poor Sufficient Good Excellent

www.bluehealth2020.eu | @BlueHealthEU
Estimating travel cost
Method
• Extract road distances and average travel times between home / point of departure
and visited blue space site from Open Street Map.
• Compute travel cost consisting of:
• Vehicle running costs for a return journey
• Car: 3.6-41 cents per pax per km (from national vehicle associations and/or national tax authorities)
• Bicycle: 6 cents per km (from Bertram and Larondelle 2017)
• Bus: 2.5-12 cents (from EC 2016a)
• Train: 1-15 cents (from EC 2016b)
• Walk / run: €0 vehicle cost.
• Opportunity cost of time: 1/3 of hourly salary, based on annual earning data from
Eurostat, specific to country, marital status and number of children
www.bluehealth2020.eu | @BlueHealthEU
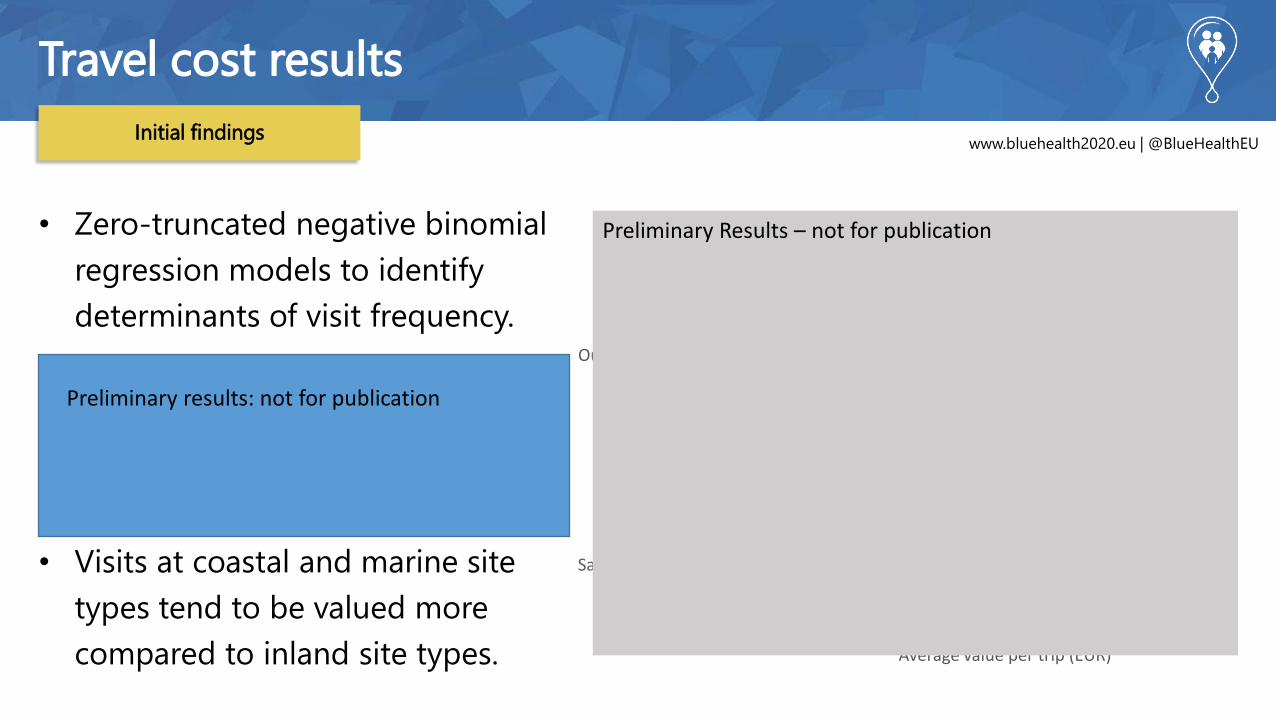
Travel cost results
Initial findings
• Zero-truncated negative binomial
regression models to identify
determinants of visit frequency.
• Average values of a visit to a blue
space site vary between €16 to a
fen, marsh or bog and €176 to a
seaside promenade.
• Visits at coastal and marine site
types tend to be valued more
compared to inland site types. 0 50 100 150 200
Fen, marsh or bog
Salt marsh, estuary or lagoon
Streams or ponds
Rocky or stony shore
Sea cliffs
Rural river/canal
Harbour or marina
Urban river/canal
Open sea
Outdoor public pool/lido/spa
Nat/art lake/reservoir
Waterfall or rapids
Pier
Sandy beach or dunes
Seaside promenade
Average value per trip (EUR)
Preliminary Results – not for publication
Preliminary results: not for publication

www.bluehealth2020.eu | @BlueHealthEU
Reaction to (hypothetical) water quality changes
Initial results
• Water quality at the site was changed up and down
experimentally.
• The majority of respondents would not change their visit
frequency as a result.
Improvement Deterioration
N % N %
No change 4,200 73% 4,002 70%
Fewer visits 126 2% 1,285 22%
More visits 1,418 25% 457 8%
Total 5,744 100% 5,744 100%

www.bluehealth2020.eu | @BlueHealthEU
Valuation of water quality levels
Initial findings
• Average values of
recreational visits to sites
according to water quality
level (N = 17,232)
• These are averages over all
types of blue spaces across
all 14 countries
• Note: these may change with
further statistical analysis
154
208224 224
255
0
50
100
150
200
250
300
Poor Sufficient Good Excellent Outstanding
Val
ue
of
a re
crea
tio
nal
vis
it (
EUR
) (Perceived) water quality level
Preliminary Results – Not for Publication

www.bluehealth2020.eu | @BlueHealthEU
Implications for adaptation
Maximising the co-benefits
• We know that the coastal environment is important for health
and wellbeing.
• The economic values of health and recreation are large and if
coastal adaptation do not factor these in there can be
maladaptation.
• Considering bathing water quality may also be important for
certain adaptation options – and other negative health
consequences (e.g. vector borne disease)

www.bluehealth2020.eu | @BlueHealthEU
Maximising co-benefits
Summary
• A range of adaptation options have implications for health
• Need for cross-sectoral working
• The opportunities are there – and we have tools to assess the
benefits

www.bluehealth2020.eu | @BlueHealthEU
Acknowledgements
• Thanks to collaborators, especially Tobias Borger, Mat White,
Lewis Elliott and to the Bluehealth team.

www.bluehealth2020.eu | @BlueHealthEU
More information online
www.bluehealth2020.eu

BlueHealth is funded by the European Union’s Horizon 2020 research
& innovation programme, grant agreement No 666773
Find out more at www.bluehealth2020.eu
Icons courtesy of www.flaticon.com
Thank you
Presenter name
Email address


