THE UNIVERSITY OF AUCKLANDDEPARTMENT OF STATISTICS
Causeweb Webinar22 Nov 2011
Bootstrapping and randomization: Seeing all the moving parts
Chris WildThe University of Auckland
New Zealand
Causeweb Teaching & Learning Webinar 22 Nov 2011

THE UNIVERSITY OF AUCKLANDDEPARTMENT OF STATISTICS
Causeweb Webinar22 Nov 2011
Abstract
• This webinar is a short visual, narrative journey from the vibrating boxplot imagery of the author’s 2009 USCOTS Plenary and Wild et al. (2011) to visualisations of bootstrap confidence intervals and, if time permits, randomisation tests. Software under development will be used and made available as-is to any brave souls willing to live on the edge
References:• http://www.stat.auckland.ac.nz/~wild/09.USCOTSTalk.html• Wild, C.J., M. Pfannkuch, M., Regan, M. and Horton, N.J. (2011). Towards more accessible
conceptions of statistical Inference (with Discussion). Journal of the Royal Statistical Society A, 174, 247–295.

THE UNIVERSITY OF AUCKLANDDEPARTMENT OF STATISTICS
Causeweb Webinar22 Nov 2011
Buyer Beware
want in 20 mins to cover the flavour of a broad sweep• Corollary: Can’t afford to …
• dot any i ’s• cross any t ’s• qualify any sweeping assertions
• Many of these slides are just springboards for animations
THE UNIVERSITY OF AUCKLANDDEPARTMENT OF STATISTICS
Causeweb Webinar22 Nov 2011
“Reminders”
My story needs familiarity with certain forms of animated graphics

THE UNIVERSITY OF AUCKLANDDEPARTMENT OF STATISTICS
Causeweb Webinar22 Nov 2011
80 100 120 140 160 180 200
From samples of size 30
Boys
Girls
Comparing heights of boys and girls at age 12
Boxplots

THE UNIVERSITY OF AUCKLANDDEPARTMENT OF STATISTICS
Causeweb Webinar22 Nov 2011
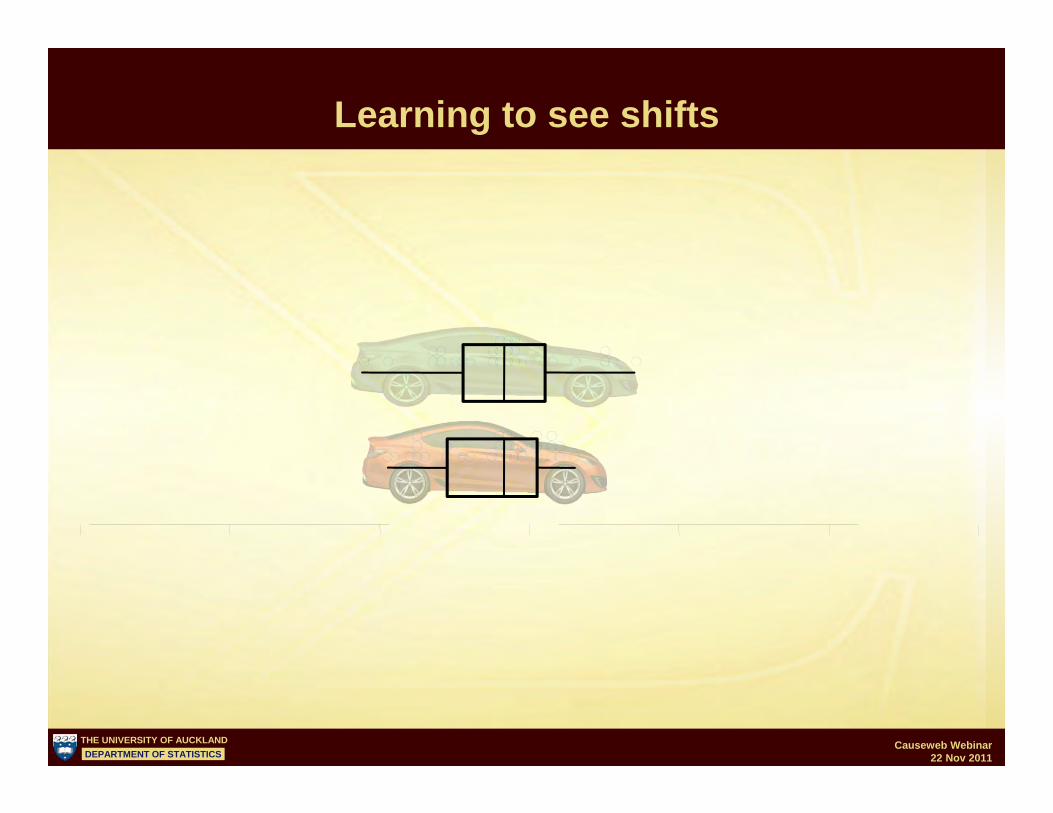
Learning to see shifts
THE UNIVERSITY OF AUCKLANDDEPARTMENT OF STATISTICS
Causeweb Webinar22 Nov 2011
Learning to see shifts

THE UNIVERSITY OF AUCKLANDDEPARTMENT OF STATISTICS
Causeweb Webinar22 Nov 2011
Learning to see shifts
Obvious measure of extent of shift …
is distance between centres

THE UNIVERSITY OF AUCKLANDDEPARTMENT OF STATISTICS
Causeweb Webinar22 Nov 2011
80 100 120 140 160 180 200
From samples of size 30
Boys
Girls
Comparing heights of boys and girls at age 12

THE UNIVERSITY OF AUCKLANDDEPARTMENT OF STATISTICS
Causeweb Webinar22 Nov 2011
80 100 120 140 160 180 200
From samples of size 30
Boys
Girls
Comparing heights of boys and girls at age 12

THE UNIVERSITY OF AUCKLANDDEPARTMENT OF STATISTICS
Causeweb Webinar22 Nov 2011
80 100 120 140 160 180 200
From samples of size 30
Boys
Girls
Comparing heights of boys and girls at age 12

THE UNIVERSITY OF AUCKLANDDEPARTMENT OF STATISTICS
Causeweb Webinar22 Nov 2011
Population distributions
Boys
Girls
Comparing heights of boys and girls at age 12
THE UNIVERSITY OF AUCKLANDDEPARTMENT OF STATISTICS
Causeweb Webinar22 Nov 2011
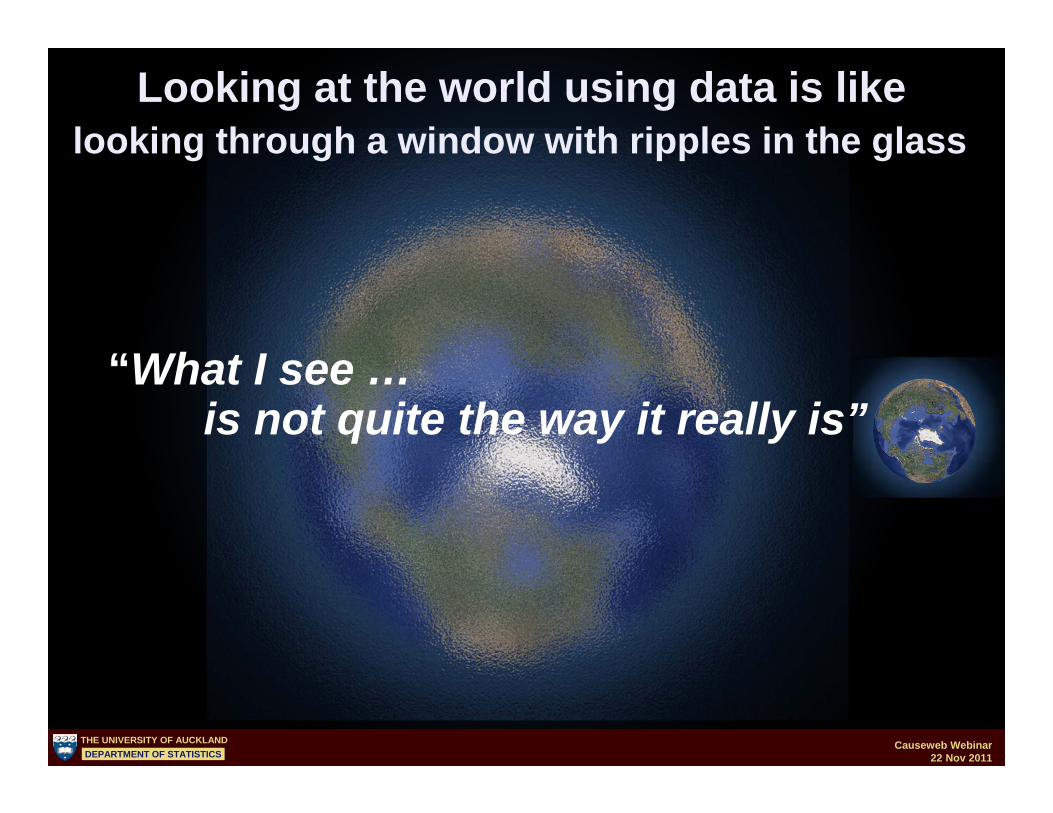
Looking at the world using data is likelooking through a window with ripples in the glass
“What I see …is not quite the way it really is”

THE UNIVERSITY OF AUCKLANDDEPARTMENT OF STATISTICS
Causeweb Webinar22 Nov 2011
Dot and Boxplot Animations
THE UNIVERSITY OF AUCKLANDDEPARTMENT OF STATISTICS
Causeweb Webinar22 Nov 2011
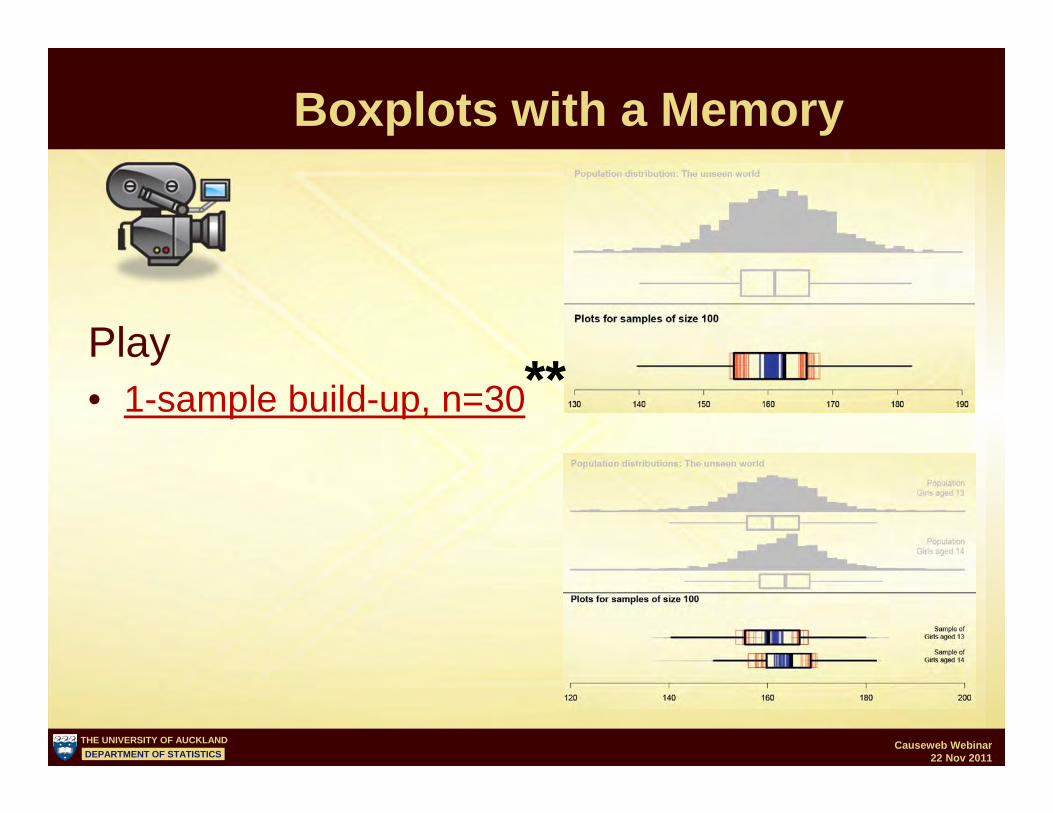
Boxplots with a Memory
Play• 1-sample build-up, n=30**
THE UNIVERSITY OF AUCKLANDDEPARTMENT OF STATISTICS
Causeweb Webinar22 Nov 2011
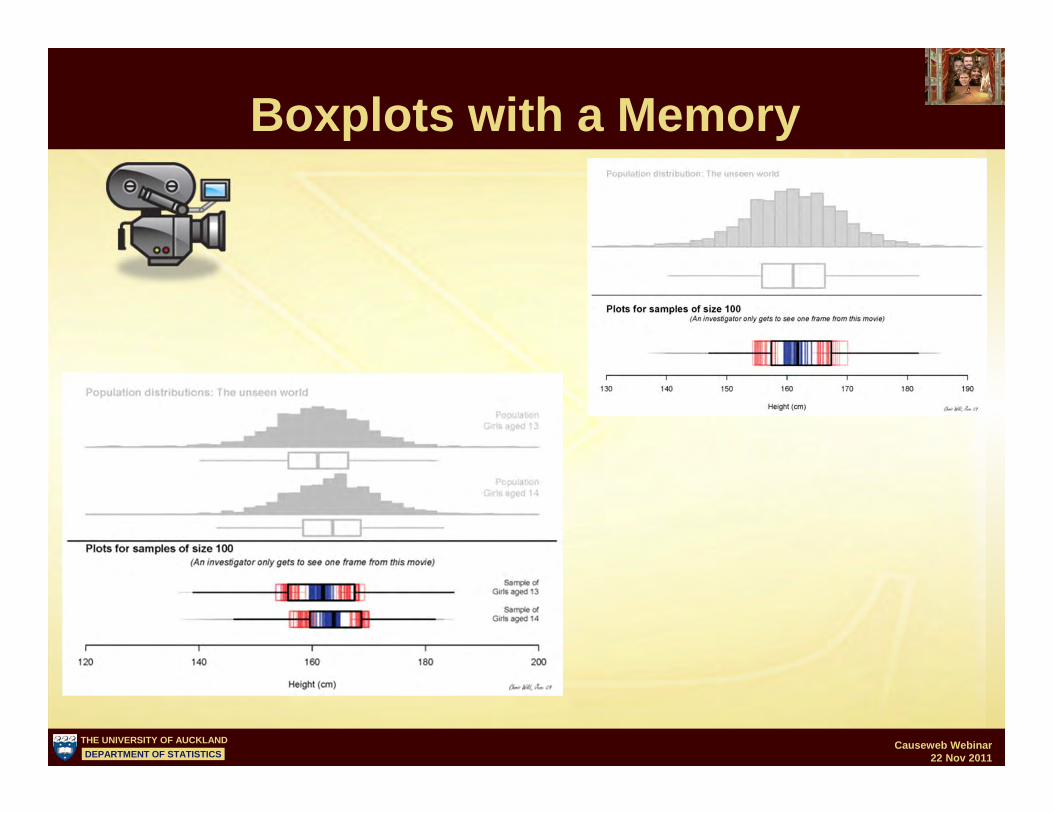
Boxplots with a Memory
THE UNIVERSITY OF AUCKLANDDEPARTMENT OF STATISTICS
Causeweb Webinar22 Nov 2011
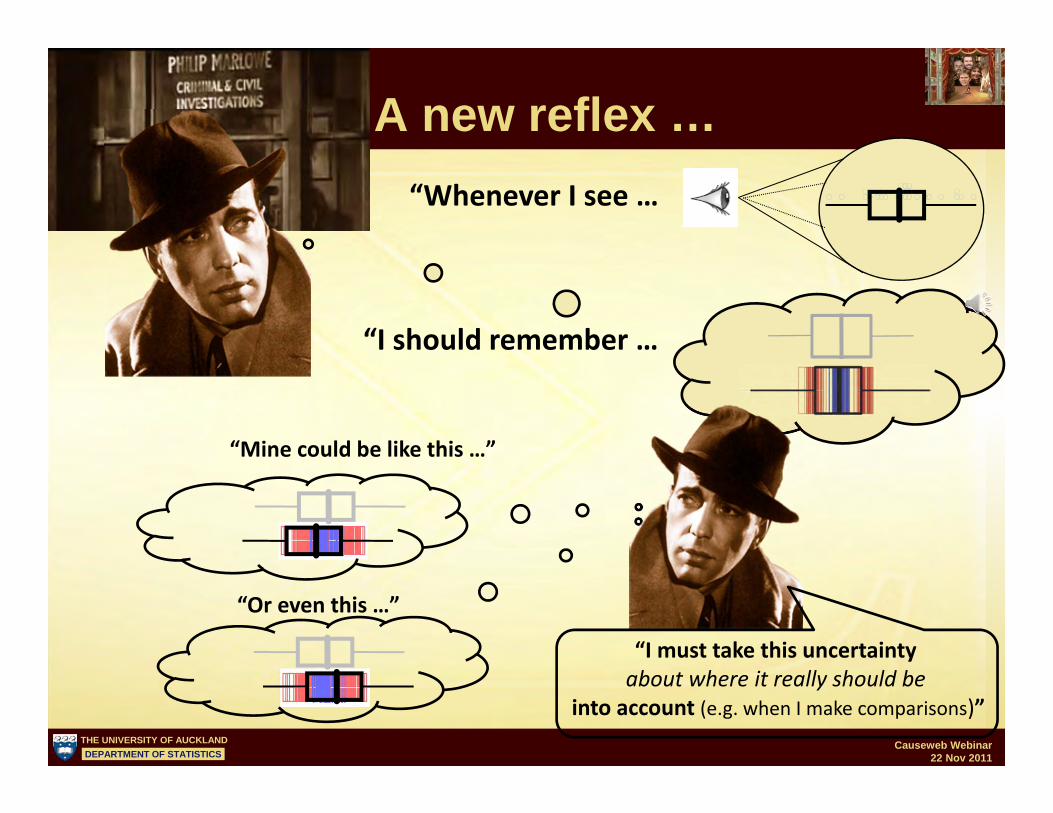
“Whenever I see …
“I should remember …
“Mine could be like this …”
“Or even this …”
“I must take this uncertaintyabout where it really should be
into account (e.g. when I make comparisons)”
A new reflex …
THE UNIVERSITY OF AUCKLANDDEPARTMENT OF STATISTICS
Causeweb Webinar22 Nov 2011
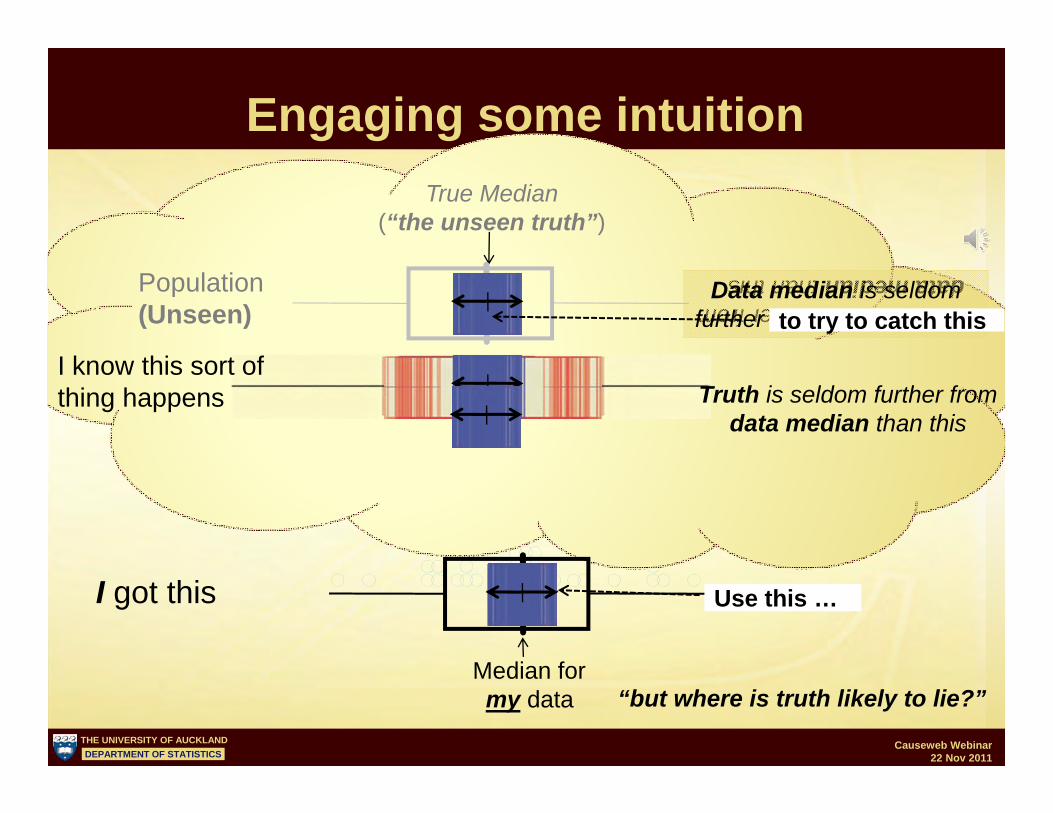
Truthis seldom further fromdata median than this
Data median is seldomfurther from truth than this
Engaging some intuition
“but where is truth likely to lie?”
I got this
Median formy data
Population(Unseen)
True Median(“the unseen truth”)
I know this sort ofthing happens Truth is seldom further from
data median than this
Use this …
to try to catch this

THE UNIVERSITY OF AUCKLANDDEPARTMENT OF STATISTICS
Causeweb Webinar22 Nov 2011
“Where is truth likely to lie?”
I got this Truth is seldom further frommy data median than this
Problem: I don’t actually see width of this “uncertainty” band
Why?: I only see one frame of sampling variation movie
So: We need some sort of estimate of the width of uncertainty band from the single sample itself
How ????
Intuition
Seems impossible!!
THE UNIVERSITY OF AUCKLANDDEPARTMENT OF STATISTICS
Causeweb Webinar22 Nov 2011
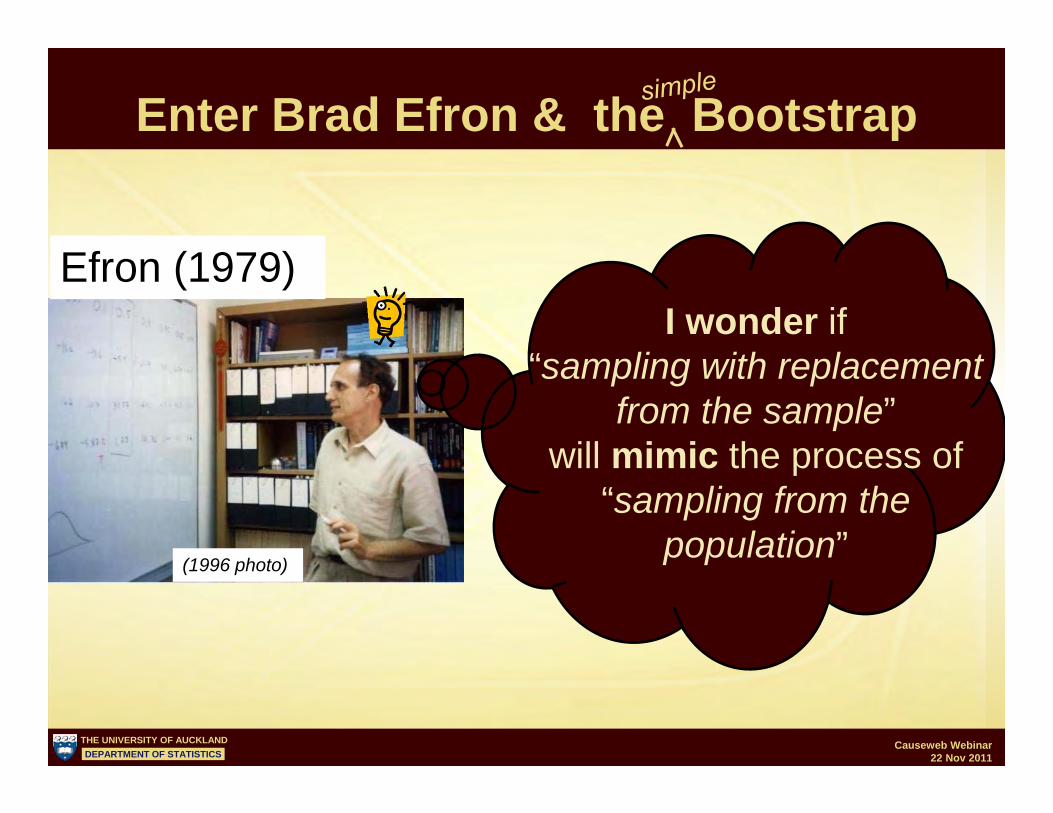
Efron (1979)
(1996 photo)
Enter Brad Efron & the Bootstrap
I wonder if“sampling with replacement
from the sample”will mimic the process of
“sampling from the population”
THE UNIVERSITY OF AUCKLANDDEPARTMENT OF STATISTICS
Causeweb Webinar22 Nov 2011
“Re-sampling without replacement”
Bootstrap intervals
Play
• What is it?

THE UNIVERSITY OF AUCKLANDDEPARTMENT OF STATISTICS
Causeweb Webinar22 Nov 2011
“Re-sampling without replacement”
• What does it do?• Why might it work?
Bootstrap intervals
Plausibility

THE UNIVERSITY OF AUCKLANDDEPARTMENT OF STATISTICS
Causeweb Webinar22 Nov 2011
What does bootstrap resampling look like?
How can we use it?

THE UNIVERSITY OF AUCKLANDDEPARTMENT OF STATISTICS
Causeweb Webinar22 Nov 2011
Use this ...
to try to catch this
What does bootstrap resampling look like?

THE UNIVERSITY OF AUCKLANDDEPARTMENT OF STATISTICS
Causeweb Webinar22 Nov 2011
Using re-sampling to construct an interval
• How is it done?
Construction
Bootstrap intervals
Play

THE UNIVERSITY OF AUCKLANDDEPARTMENT OF STATISTICS
Causeweb Webinar22 Nov 2011
Use this ... to try to catch this
Bootstrap intervals
Looks plausible …
Does it work ??
“Simulate & see”
THE UNIVERSITY OF AUCKLANDDEPARTMENT OF STATISTICS
Causeweb Webinar22 Nov 2011
Using re-sampling to construct an interval
Does this method work?
Confirmation
Bootstrap intervals
Play

THE UNIVERSITY OF AUCKLANDDEPARTMENT OF STATISTICS
Causeweb Webinar22 Nov 2011
Lot’s of programs that do this
• What we are adding • reducing abstraction by making the foundational
connections along the way• as concretely as we can

THE UNIVERSITY OF AUCKLANDDEPARTMENT OF STATISTICS
Causeweb Webinar22 Nov 2011
Using re-sampling to construct an interval
How do I use it?
Operation
Bootstrap intervals
THE UNIVERSITY OF AUCKLANDDEPARTMENT OF STATISTICS
Causeweb Webinar22 Nov 2011
2-sample shift in centres
Bootstrap intervals
Play

THE UNIVERSITY OF AUCKLANDDEPARTMENT OF STATISTICS
Causeweb Webinar22 Nov 2011
Randomised experiments and Randomisation tests

THE UNIVERSITY OF AUCKLANDDEPARTMENT OF STATISTICS
Causeweb Webinar22 Nov 2011
Experiential Context• Simple randomised experiment
• (e.g. drug vs control)• Follows experiences on why do randomised
experiments• Following up message that randomisation is best
way we know of balancing groups – on unforeseen factors so that apart from treatment we are
comparing like with like
THE UNIVERSITY OF AUCKLANDDEPARTMENT OF STATISTICS
Causeweb Webinar22 Nov 2011
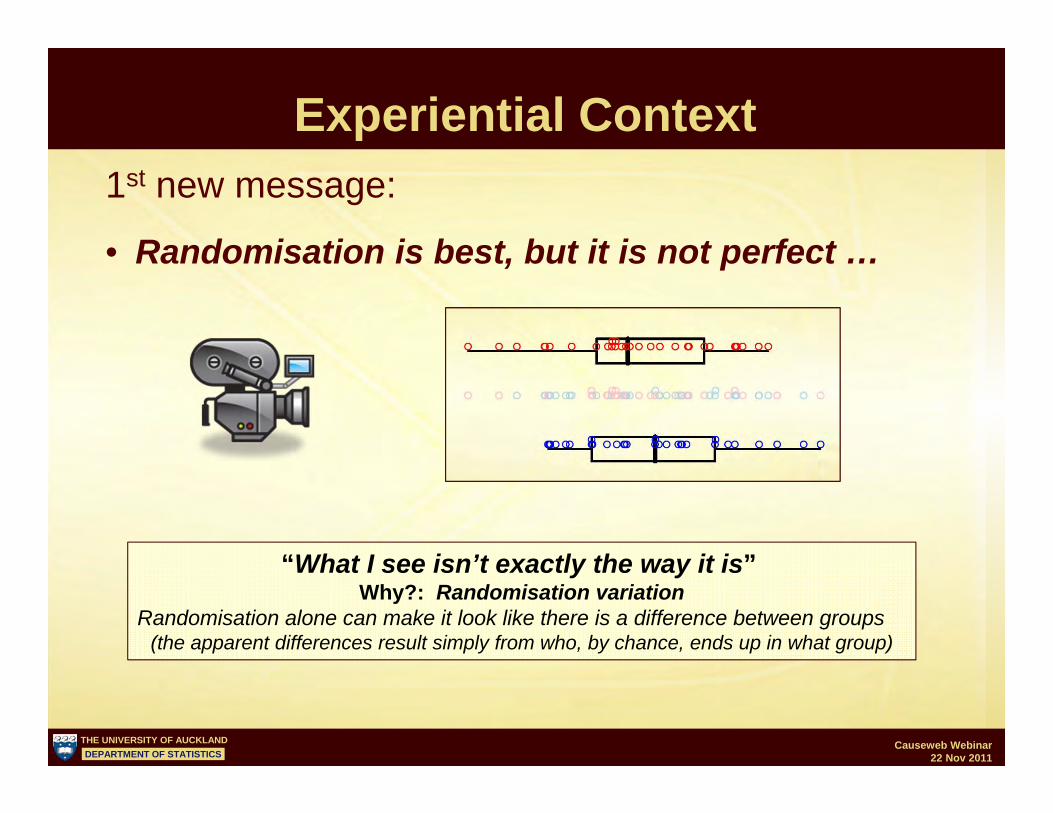
Experiential Context1st new message:
• Randomisation is best, but it is not perfect …
“What I see isn’t exactly the way it is”Why?: Randomisation variation
Randomisation alone can make it look like there is a difference between groups(the apparent differences result simply from who, by chance, ends up in what group)

THE UNIVERSITY OF AUCKLANDDEPARTMENT OF STATISTICS
Causeweb Webinar22 Nov 2011
2-sample randomisation test visualisation
Play
Can randomisation alone (“chance alone”) explain what I’m seeing?
***PUT THIS PHRASE IN THE MOVIE ***

THE UNIVERSITY OF AUCKLANDDEPARTMENT OF STATISTICS
Causeweb Webinar22 Nov 2011
VIT: Visual Inference Tools
Double click
Data import
Part of plotting window
http://www.stat.auckland.ac.nz/~wild/VIT

THE UNIVERSITY OF AUCKLANDDEPARTMENT OF STATISTICS
Causeweb Webinar22 Nov 2011

THE UNIVERSITY OF AUCKLANDDEPARTMENT OF STATISTICS
Causeweb Webinar22 Nov 2011
VIT: In the can or coming sooner or later
• Bootstrap CIs• 1-sample mean/median & proportion (could add LQ, UQ)
• 2-sample differences in mean/median & proportion• Regression slope• 1-sample IQR?
• Randomisation tests• 2-sample differences in mean/median & proportions• k-sample differences in mean/median & proportions
• Confidence Interval Coverage• 1-sample mean/median & proportion (could add LQ, UQ)
http://www.stat.auckland.ac.nz/~wild/VIT

THE UNIVERSITY OF AUCKLANDDEPARTMENT OF STATISTICS
Causeweb Webinar22 Nov 2011
VIT: Visual Inference Tools• what currently exists for anyone interested in playing with it
• Includes download & instructions• on an as-is, where-is basis - will update as we fine-tune, fix bugs and build additional modules
Programming Credits
Keng Hao(Danny) Chang
Jieping(Vivian) Li
GarrettGrolemund (Rice)
(New)Infrastructure
Current Team(UoA)
BenStevenson
SimonPotter
Earlier Prototypes (UoA)
http://www.stat.auckland.ac.nz/~wild/VIT
THE UNIVERSITY OF AUCKLANDDEPARTMENT OF STATISTICS
Causeweb Webinar22 Nov 2011
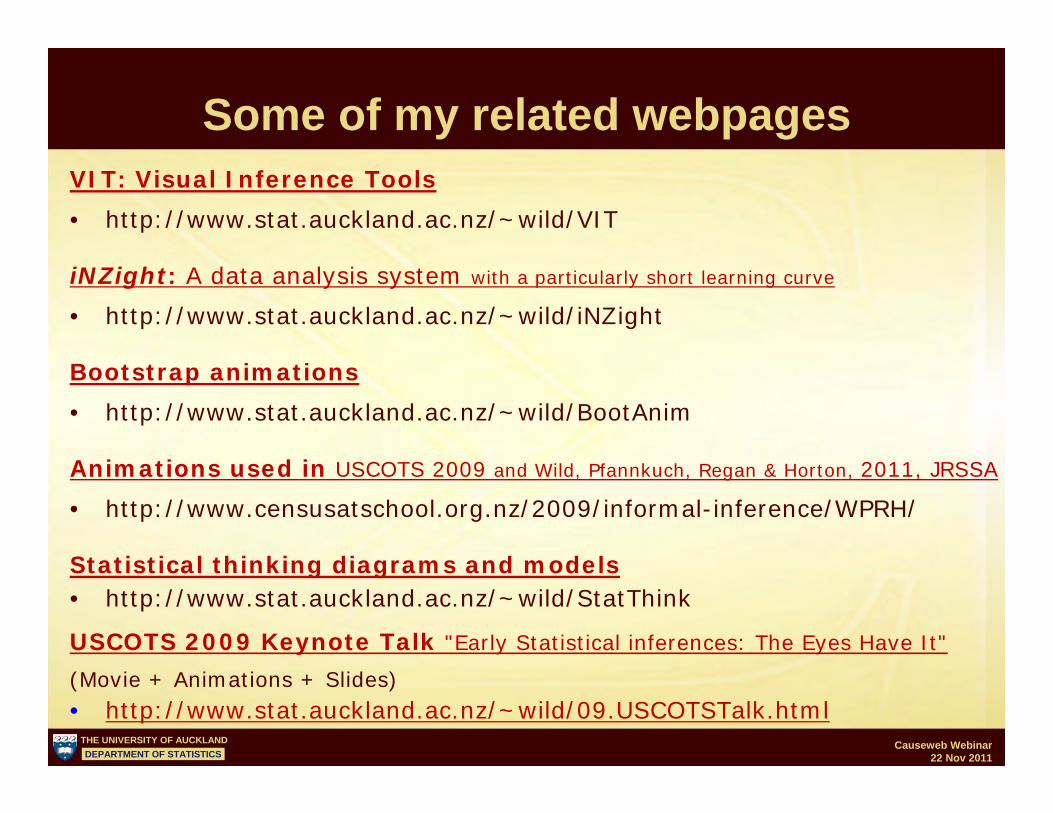
Some of my related webpagesVIT: Visual Inference Tools• http://www.stat.auckland.ac.nz/~wild/VIT
iNZight: A data analysis system with a particularly short learning curve
• http://www.stat.auckland.ac.nz/~wild/iNZight
Bootstrap animations• http://www.stat.auckland.ac.nz/~wild/BootAnim
Animations used in USCOTS 2009 and Wild, Pfannkuch, Regan & Horton, 2011, JRSSA
• http://www.censusatschool.org.nz/2009/informal-inference/WPRH/
Statistical thinking diagrams and models• http://www.stat.auckland.ac.nz/~wild/StatThink
USCOTS 2009 Keynote Talk "Early Statistical inferences: The Eyes Have It"
(Movie + Animations + Slides)• http://www.stat.auckland.ac.nz/~wild/09.USCOTSTalk.html
THE UNIVERSITY OF AUCKLANDDEPARTMENT OF STATISTICS
Causeweb Webinar22 Nov 2011
Thank you


