ISO 13485:2016 Supplier Controls—Best Practices that Make Sustainable Change
James ShoreQUALITY LEAN SOLUTIONS“Simplified Sustainable Solutions ™”
BOSCON ‘19

Abstract
The changes to ISO 13485:2016 have placed additional emphasis on Supplier Controls. As more companies outsource more of their processes or become virtual, the expectation are controls are implemented. What are the big problems found during the ISO audits? What are the best practices?
During this presentation, we will review the ISO Requirements and some of the best practices that are being used in industry.

Question to answer
© Copyright by Quality Lean Solutions – 31 Mar 2019 3
•Are there compliance issues with Supplier Controls?
• Do Supplier Controls extend into other regulatory or compliance requirements?
• What do we need to know?
• What are best practices to be compliant?

Source: FY2017 Annual FDA Medical Device Quality System Data
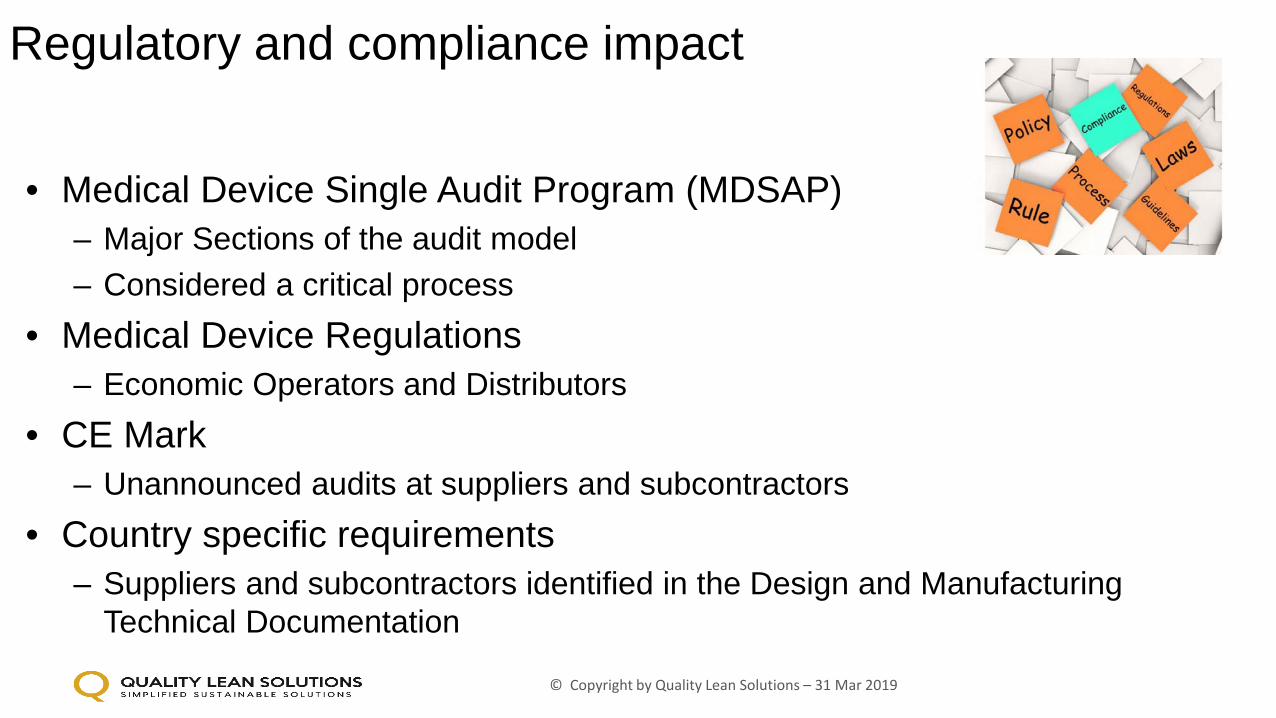
Regulatory and compliance impact
• Medical Device Single Audit Program (MDSAP)– Major Sections of the audit model– Considered a critical process
• Medical Device Regulations– Economic Operators and Distributors
• CE Mark– Unannounced audits at suppliers and subcontractors
• Country specific requirements– Suppliers and subcontractors identified in the Design and Manufacturing
Technical Documentation
© Copyright by Quality Lean Solutions – 31 Mar 2019

Expectations of Notifying Bodies/Regulatory Authorities
Understand:• The changes to ISO 13485:2016 specific to supplier controls and changes
needed to your Quality System• The requirements regarding the necessary controls on purchased, services and
outside processes• The requirements needed to effectively select and manage suppliers based on
risk proportionate to the product risk• The tools necessary to properly monitor suppliers and evaluate ongoing quality
based on risk
Controls proportionate to risk
© Copyright by Quality Lean Solutions – 31 Mar 2019

Definitions and requirements (ISO 13485:2016)
purchased product - product provided by a party outside the organization’s quality management systemWhen the organization chooses to outsource any process that affects product conformity to requirements, it shall monitor and ensure control over such processes. The organization shall retain responsibility of conformity to this International Standard and to customer and applicable regulatory requirements for outsourced processes.
The controls shall be proportionate to the risk involved and the ability of the external party to meet the requirements….The controls shall include written quality agreements.
© Copyright by Quality Lean Solutions – 31 Mar 2019 7

So is there any good news?
• Most changes to ISO 13485:2016 are harmonized to 21 CFR 820– FDA plans of migrating to the ISO requirements
• Captures the current practices of most companies• More importance with other requirements
– Makes justification for compliance easier• Three major process streams:
© Copyright by Quality Lean Solutions - 31 Mar 2019
Purchasing Controls
Purchasing Information
Verification of Purchased
Product
RequirementsGap AnalysisBest Practices

© Copyright by Quality Lean Solutions - 31 Mar 2019
Criteria for evaluation and selection of suppliers • Supplier ability to meet requirements.• Supplier performance• Proportional to the risk associated with the device.Monitoring and re-evaluation of suppliers• Product performance shall be monitored• Results shall be part of the re-evaluationCommunication and controls• Adequate specific purchasing requirements• PO shall include “change notification”• Traceability of relevant information in the form of documents and
records.
Purchasing Controls
Purchasing Information
Verification of Purchased
Product
Reference:• ISO 13485, Para 7.4.1• 21 CFR 820.50(a)(b)• MDSAP Checklist
Selection | Performance | Risk | Change Management
Gap Analysis – Purchasing Controls
• Does the Approved Supplier List have the list of outside processes?– Manufacturing, QMS, Consulting– Distributors– Sponsors (Australia)
• Does your company use risk levels and performance in selecting suppliers?
• Does your company monitor performance of your suppliers at regular intervals? – If so, what are the limits and what action is taken if those limits are
exceeded?– How is this documented?
© Copyright by Quality Lean Solutions - 31 Mar 2019

Start with the process mapCreate Process Map
© Copyright by Quality Lean Solutions - 31 Mar 2019
Easier to follow which results in compliance – people are visual leaners
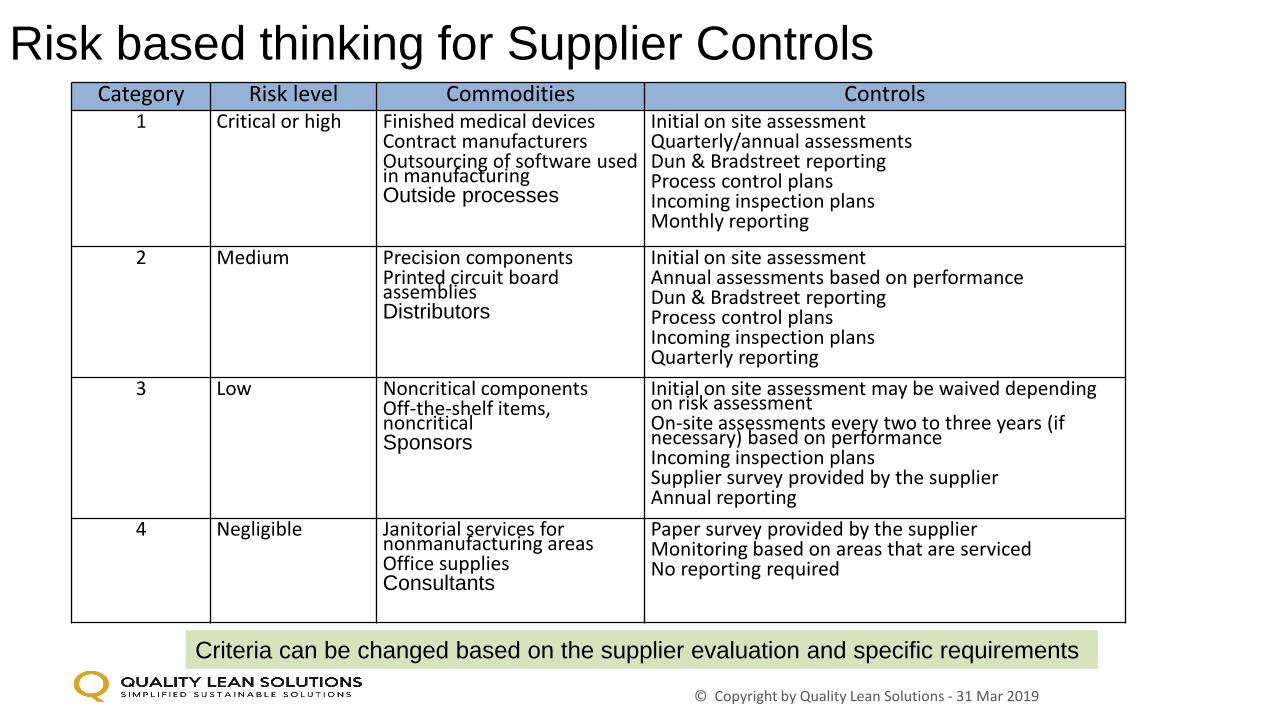
Risk based thinking for Supplier ControlsCategory Risk level Commodities Controls
1 Critical or high Finished medical devicesContract manufacturersOutsourcing of software used in manufacturingOutside processes
Initial on site assessmentQuarterly/annual assessmentsDun & Bradstreet reportingProcess control plansIncoming inspection plansMonthly reporting
2 Medium Precision componentsPrinted circuit board assembliesDistributors
Initial on site assessmentAnnual assessments based on performanceDun & Bradstreet reportingProcess control plansIncoming inspection plansQuarterly reporting
3 Low Noncritical components Off-the-shelf items, noncriticalSponsors
Initial on site assessment may be waived depending on risk assessmentOn-site assessments every two to three years (if necessary) based on performanceIncoming inspection plans Supplier survey provided by the supplierAnnual reporting
4 Negligible Janitorial services for nonmanufacturing areasOffice suppliesConsultants
Paper survey provided by the supplierMonitoring based on areas that are servicedNo reporting required
Criteria can be changed based on the supplier evaluation and specific requirements
© Copyright by Quality Lean Solutions - 31 Mar 2019

Approved Supplier List
Number Name Location Commodity Critical Risk Level Outside Process
Unique Number
Full Name If more than one, each one should have a separatenumber
MachiningPCBHardwareDistributor
Yes or No
Use simple list of levels or categories
If yes, what do they do?
Plating SterilizationConsultingSponsor
© Copyright by Quality Lean Solutions - 31 Mar 2019
Watch outs:• Minimum items• If the master list is from a software system, make sure the validation is documented!• Outsourced processes, sponsors and Consultants need to be on list

Supplier Monitoring• Break up the list into four equal parts, review those suppliers on a
quarterly basis• Criteria can be simple
– Quality and Delivery• KEY: define the metric and calculation
– Quality =Lots accepted/lots received– Delivery=Lots received (3 days early/no days late)/lots received
• Key: have limits– Warning Limits – review and investigate– Action Limits – full corrective action
• Watch outs –– software validation if quality decisions are made based on this report
© Copyright by Quality Lean Solutions - 31 Mar 2019 14

© Copyright by Quality Lean Solutions - 31 Mar 2019
Information shall describe or reference the product to be purchased• Product specs• Requirements for acceptance• Requirements for supplier personnel qualification• QMS requirements
PO shall be reviewed prior to sending to the supplierChange notification shall be included (as applicable)
Purchasing Controls
Purchasing Information
Verification of Purchased
Product
Reference:• ISO 13485, Para 7.4.2• 21 CFR 820.50(a)(b)• MDSAP Checklist
Acceptance Requirements| Change Management
Gap Analysis – Purchasing Info
• Do you have clear quality requirements including acceptance methods documented? Do you share them with your suppliers?
• Do you have Supplier Quality Agreements for your critical or high risk suppliers?– Do your agreements include notification of change approval prior to making those
changes?– Do you have at least Change Notification Agreements to notify you of any changes
to the product or service?• If your product has CE mark approval, do your SQA documents include
the unannounced audit requirements (critical suppliers)?
© Copyright by Quality Lean Solutions - 31 Mar 2019
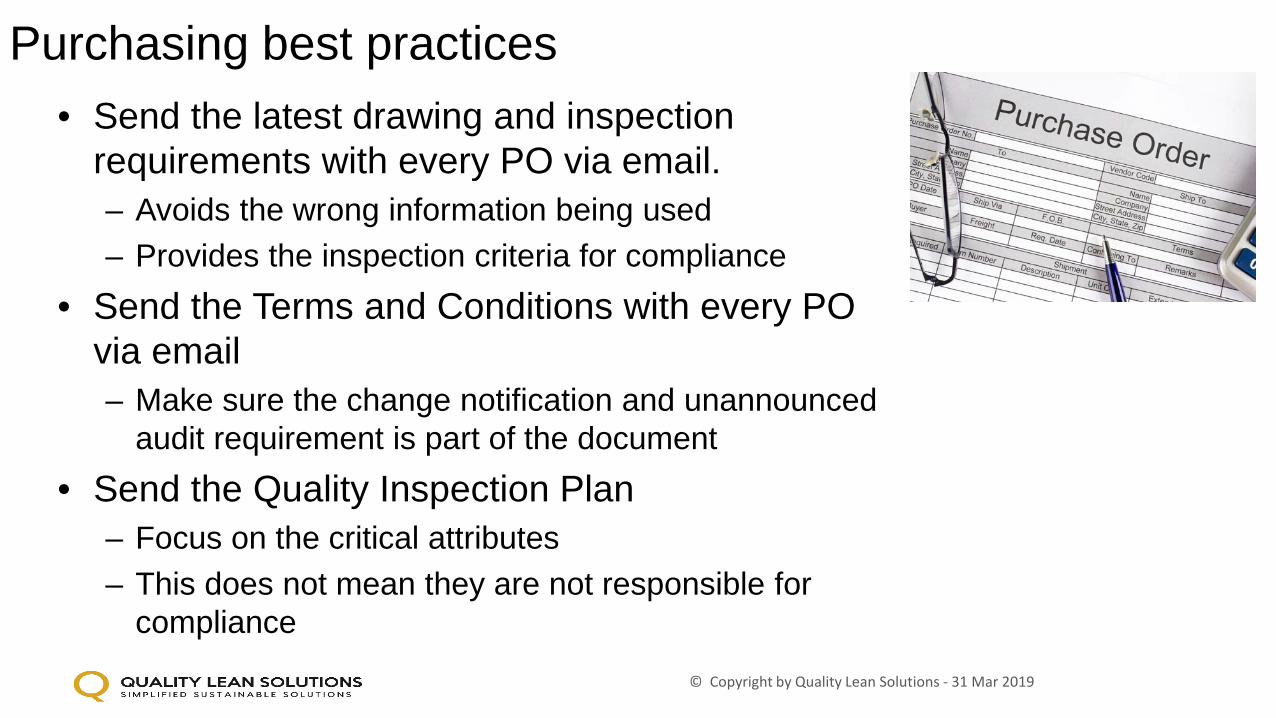
Purchasing best practices• Send the latest drawing and inspection
requirements with every PO via email.– Avoids the wrong information being used– Provides the inspection criteria for compliance
• Send the Terms and Conditions with every PO via email– Make sure the change notification and unannounced
audit requirement is part of the document• Send the Quality Inspection Plan
– Focus on the critical attributes– This does not mean they are not responsible for
compliance© Copyright by Quality Lean Solutions - 31 Mar 2019
Risk based thinking for Quality AgreementsChange Notification Agreement• Most times this covers 70% of the suppliers for change controlSupplier Quality Agreements (SQA)• Which suppliers require SQA is based on product risk levels.• The agreements should cover the scope of work that the supplier is
providing and the regulations that are required.– Make the agreement flexible for the specific situation.– Don’t add incoming inspection requirements for the Software Development supplier.
• Unannounced Audits (for CE Marked product only)
© Copyright by Quality Lean Solutions - 31 Mar 2019

© Copyright by Quality Lean Solutions - 31 Mar 2019
Shall stablish and implement inspection or other activities• Ensure the product meets the purchasing requirements• The extent of the verification shall be proportional to the supplier
evaluation and the risk of the purchased item.
If the company is notified of any changes• Shall determine if the changes affect product realization process• Or the finished medical device
Source Inspection• If the acceptance is going to be at the suppliers facility• The intended verification and method shall be documented on the PO• Records shall be maintained
Purchasing Controls
Purchasing Information
Verification of Purchased
Product
Reference:• ISO 13485, Para 7.4.3• 21 CFR 820.50(a)(b)• MDSAP Checklist
Verification| Risk | Change Management
Gap Analysis – Verification of Purchased Product
• Do you have a method to identify which items require inspection?Are they clearly identified in a risk matrix?
• For those inspection plans, is the inspection level based on the riskidentified in the Risk Management File, such as the Design FMEA or Hazard Analysis?
• Do you have procedures in place to assess supplier changes and how are they handled through your inspection process?
© Copyright by Quality Lean Solutions - 31 Mar 2019

Analysis of Control methodsControls Cost Resources3rd party inspection requirement high 3rd party inspectorsSource Inspection high Traveling inspectors100% Lot inspection high In-house inspection and required metrology equipmentSampling Lot inspection medium In-house inspection and required metrology equipmentReduced sampling inspection medium In-house inspection and required metrology equipmentSupplier Provided Inspection data review/acceptance
medium In-house inspection and less metrology equipment
Skip lot sampling inspection low In-house inspection and less metrology equipment (less frequent)Tailgate sampling inspection low In-house inspection and less metrology equipment (less frequent)
Dock to Stock/periodic inspection low In-house inspection and less metrology equipment (less frequent)No inspection/Certification program ideal In-house inspectors/traveling inspectors
Little to no required metrology equipmentReview of Supplier Process Control Plans ideal Traveling Engineers and Inspectors based on performance (not
schedule)
“Proactive Supplier Management in the Medical Device Industry,” Quality Press, 2016.
© Copyright by Quality Lean Solutions - 31 Mar 2019
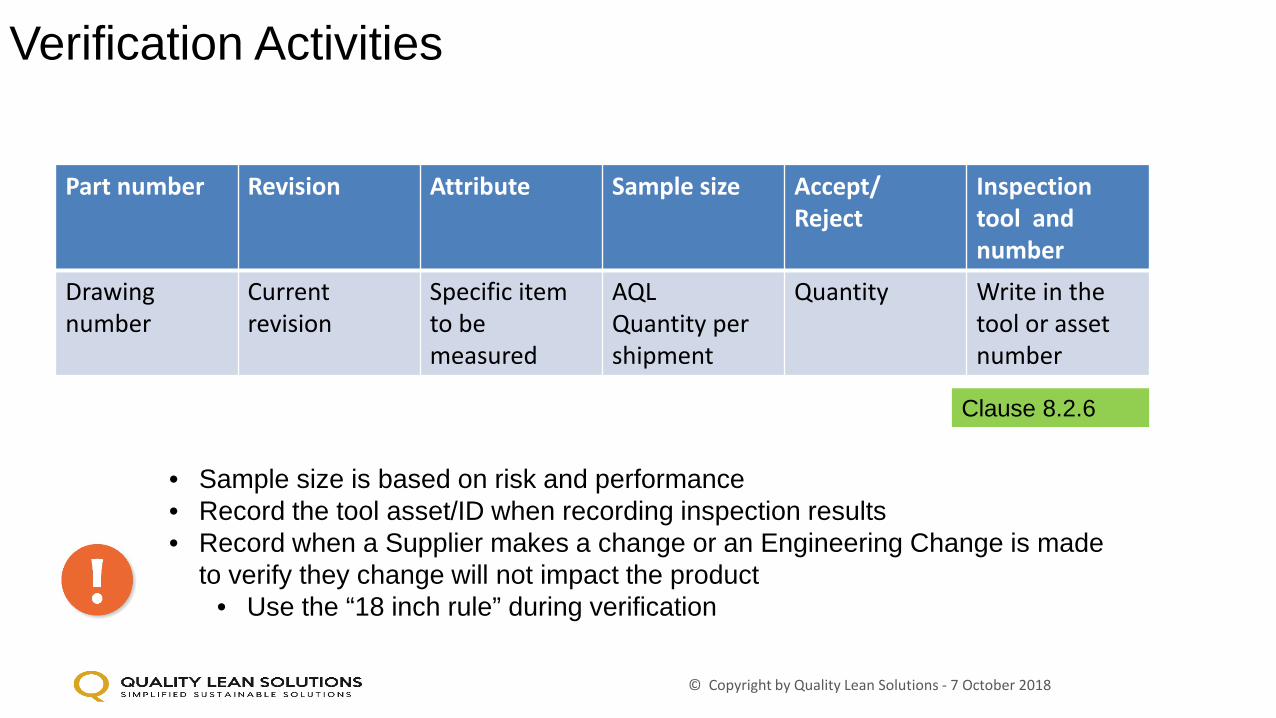
Verification Activities
Part number Revision Attribute Sample size Accept/Reject
Inspectiontool and number
Drawing number
Current revision
Specific item to be measured
AQLQuantity per shipment
Quantity Write in the tool or asset number
© Copyright by Quality Lean Solutions - 7 October 2018
Clause 8.2.6
• Sample size is based on risk and performance• Record the tool asset/ID when recording inspection results• Record when a Supplier makes a change or an Engineering Change is made
to verify they change will not impact the product• Use the “18 inch rule” during verification
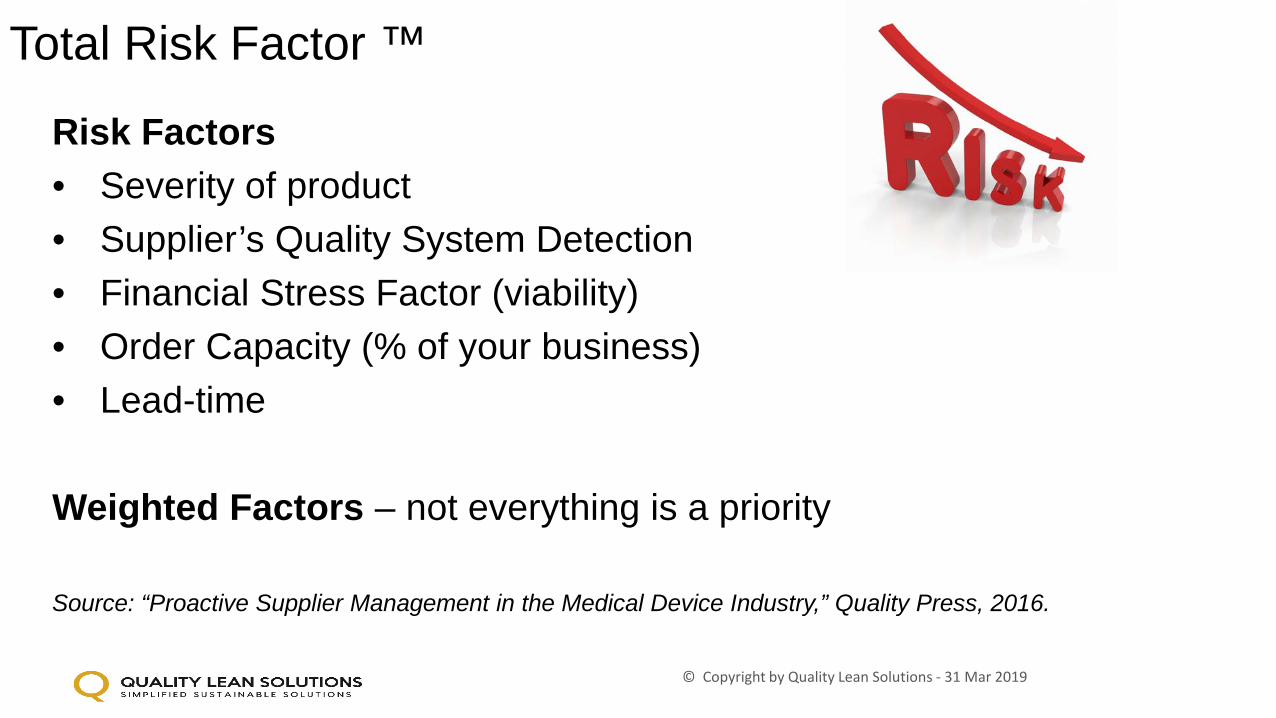
Total Risk Factor ™
Risk Factors• Severity of product• Supplier’s Quality System Detection• Financial Stress Factor (viability)• Order Capacity (% of your business)• Lead-time
Weighted Factors – not everything is a priority
Source: “Proactive Supplier Management in the Medical Device Industry,” Quality Press, 2016.
© Copyright by Quality Lean Solutions - 31 Mar 2019

Risk Factor examples
Financial stress risk class Financial stress score 1 1316–1875
2 1288–1315
3 1255–1287
4 1216–1254
5 1001–1215
Detection CriteriaSuggested range of detection
method Ranking
Almost impossible
Quality system (QS) will not and/or cannot detect a potential cause/mechanism and subsequent failure mode.
None; no QS in place. 10
Low QS has a poor chance of detecting a potential cause/mechanism and subsequent failure mode.
Indirect/infrequent checks only.
8
Moderate QS may detect a potential cause/mechanism and subsequent failure mode.
Visual checks and measurements/gauging components. Periodic charting and tracking.
6
High QS has a good chance to detect potential cause/mechanism and subsequent failure mode.
Measurements/gauging or testing/sampling of components during production to prevent potential failures.Continuous charting and tracking.
4
Almost certain
QS almost certain to detect potential cause/mechanism and subsequent failure mode.
Continuous monitoring predicts potential failures prior to occurrence.
2
Effect Criteria: Severity of effect Ranking
Hazardous Very high severity ranking when a potential failure mode affects safe product operation. Noncompliance with government regulations. Patient death.
10
High Product inoperable, with loss of primary function. Customer very dissatisfied.
8
Moderate Product operable, but nonessential system inoperable. Customer experiences discomfort or dissatisfaction.
6
Low Fit and finish does not conform. Defect noticed by most customers. 4
Minor to none Fit and finish does not conform. Defect noticed by discriminating (<25%) customers, or no effect
2
© Copyright by Quality Lean Solutions - 31 Mar 2019
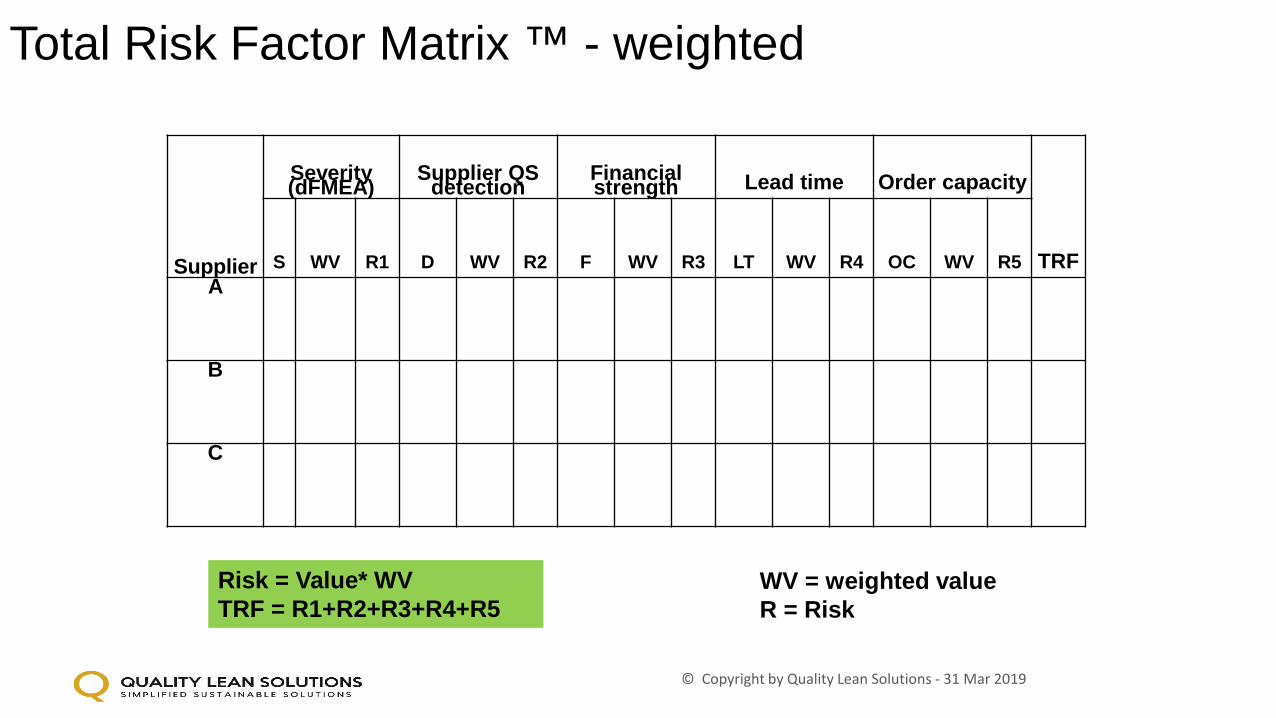
Total Risk Factor Matrix ™ - weighted
Supplier
Severity (dFMEA) Supplier QS detection Financial strength Lead time Order capacity
TRFS WV R1 D WV R2 F WV R3 LT WV R4 OC WV R5A
B
C
WV = weighted valueR = Risk
Risk = Value* WVTRF = R1+R2+R3+R4+R5
© Copyright by Quality Lean Solutions - 31 Mar 2019
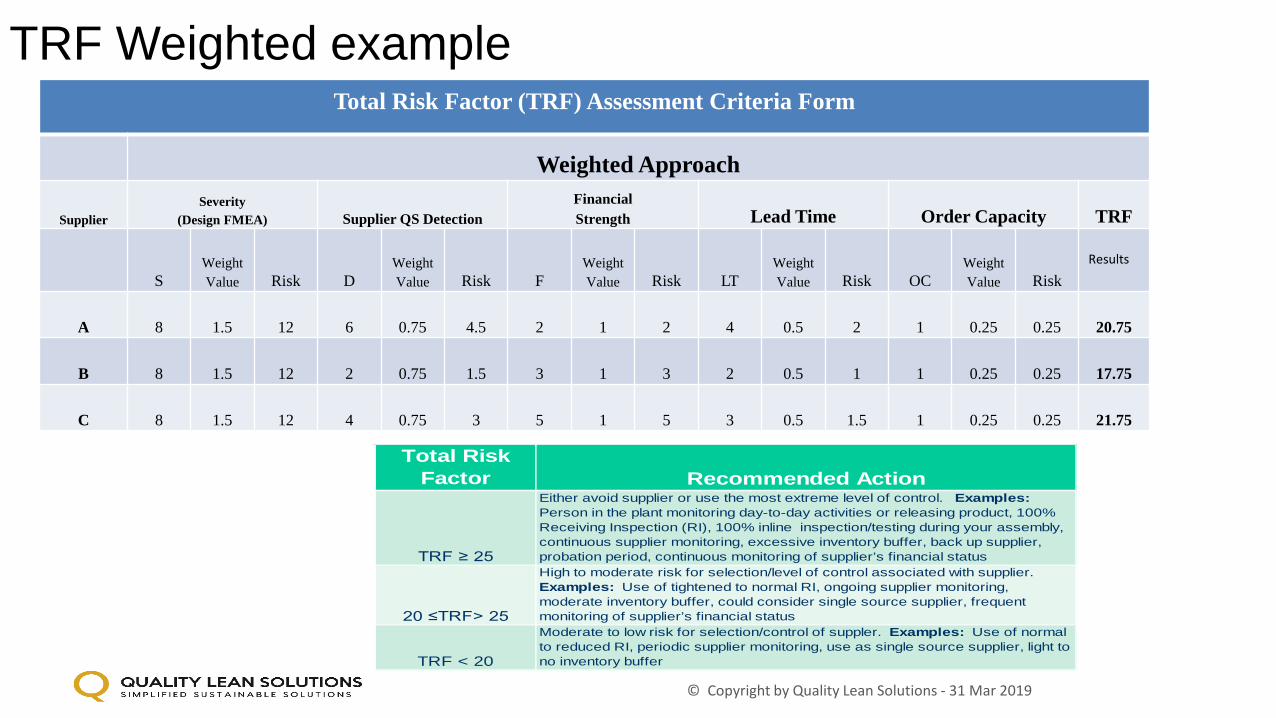
TRF Weighted example
Total Risk Factor Recommended Action
TRF ≥ 25
Either avoid supplier or use the most extreme level of control. Examples: Person in the plant monitoring day-to-day activities or releasing product, 100% Receiving Inspection (RI), 100% inline inspection/testing during your assembly, continuous supplier monitoring, excessive inventory buffer, back up supplier, probation period, continuous monitoring of supplier’s financial status
20 ≤TRF> 25
High to moderate risk for selection/level of control associated with supplier. Examples: Use of tightened to normal RI, ongoing supplier monitoring, moderate inventory buffer, could consider single source supplier, frequent monitoring of supplier’s financial status
TRF < 20
Moderate to low risk for selection/control of suppler. Examples: Use of normal to reduced RI, periodic supplier monitoring, use as single source supplier, light to no inventory buffer
Total Risk Factor (TRF) Assessment Criteria Form
Weighted Approach
SupplierSeverity
(Design FMEA) Supplier QS DetectionFinancial Strength Lead Time Order Capacity TRF
SWeight Value Risk D
Weight Value Risk F
Weight Value Risk LT
Weight Value Risk OC
Weight Value Risk
Results
A 8 1.5 12 6 0.75 4.5 2 1 2 4 0.5 2 1 0.25 0.25 20.75
B 8 1.5 12 2 0.75 1.5 3 1 3 2 0.5 1 1 0.25 0.25 17.75
C 8 1.5 12 4 0.75 3 5 1 5 3 0.5 1.5 1 0.25 0.25 21.75
© Copyright by Quality Lean Solutions - 31 Mar 2019

TRF Example – Audit determination task
High = 10 Medium = 5 Low = 1 10 8 1 10 5 8 5
Short Description
Supplier Product Impact
H= Repac, Relabel, Manufac. Creates
CoAM= DistributorL= Broker/Sales
Office
SuppliedH=Tier One
M= Tier TwoL= Tier Three
Quality AgreementH=No
M= In progressL= Yes
Audit HistoryH=Critical Obs
or Tier 1 no site audit
M=3 + Major ObsL=0 Major Obs
Site FeedbackH= Critical Issue or
>1M= 1 Issue
L= No issues
Supplier Status H= New
M=Approved/Accepted
L=Qualified
(Site Feedback)Complaints/
SCARSH= 2+ or Any Unresolved
M= 1L= 0
Total
Scottsdale, AZ 5 10 10 10 1 5 1 290
Buffalo, NY 10 1 10 1 1 5 1 178
Fort Worth, TX 5 1 10 1 1 5 1 128
Visalia, CA 5 1 10 1 1 5 1 128
Batavia, IL 5 1 10 1 1 5 1 128
Scarborough, ME 5 1 10 1 1 5 1 128
Randolph, MA 5 1 10 1 1 5 1 128
York Beach, ME 5 1 10 1 1 5 1 128
Cataumet, MA 5 1 10 1 1 5 1 128
St. Louis, MO 5 1 10 1 1 5 1 128
Scope: 600 suppliers with resources to cover only 400TRF™ assessment = 250 audits, solid justification

Benefits of Consolidation/Risk Reduction
28
• Overall reduces risks• Reduction of suppliers will reduce your overall costs• Improved relationships • Focus on issues quicker and reduce the impact on production• Stronger relationships can be built• Larger buying power• Shipping and Freight costs
© Copyright by Quality Lean Solutions – 31 Mar 2019
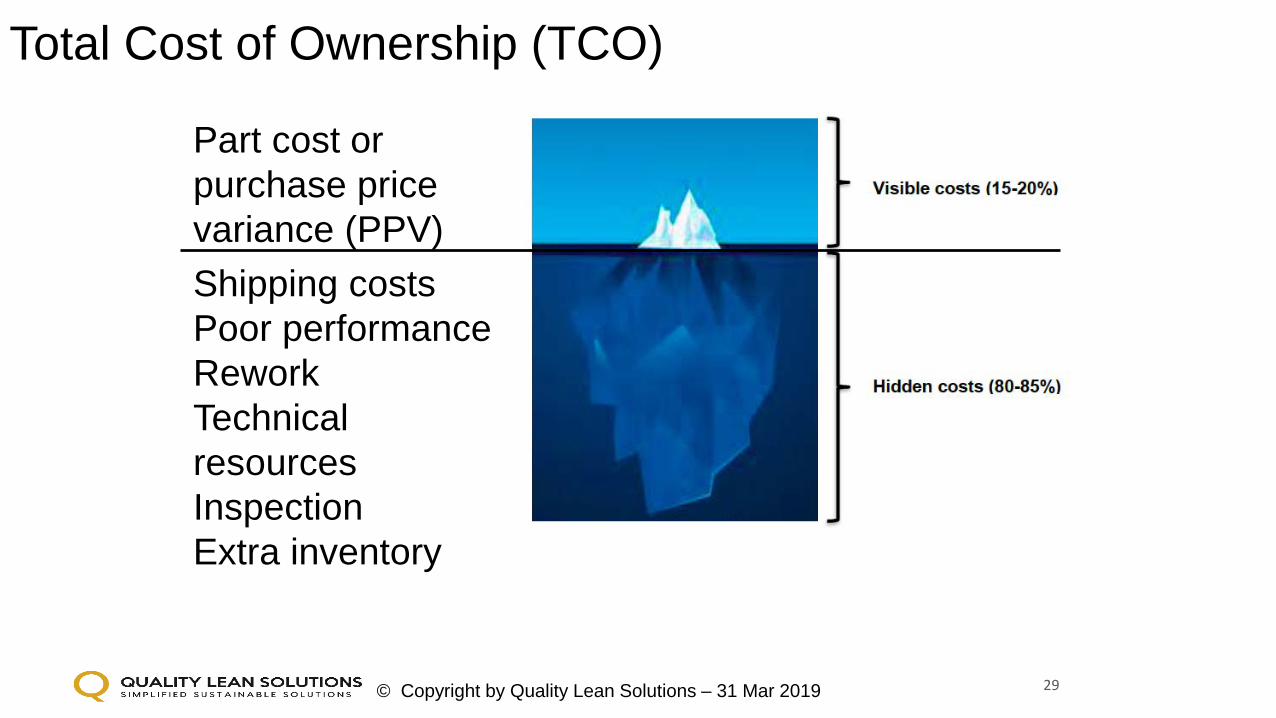
Total Cost of Ownership (TCO)
29
Part cost or purchase price variance (PPV)Shipping costsPoor performanceReworkTechnical resourcesInspectionExtra inventory
© Copyright by Quality Lean Solutions – 31 Mar 2019
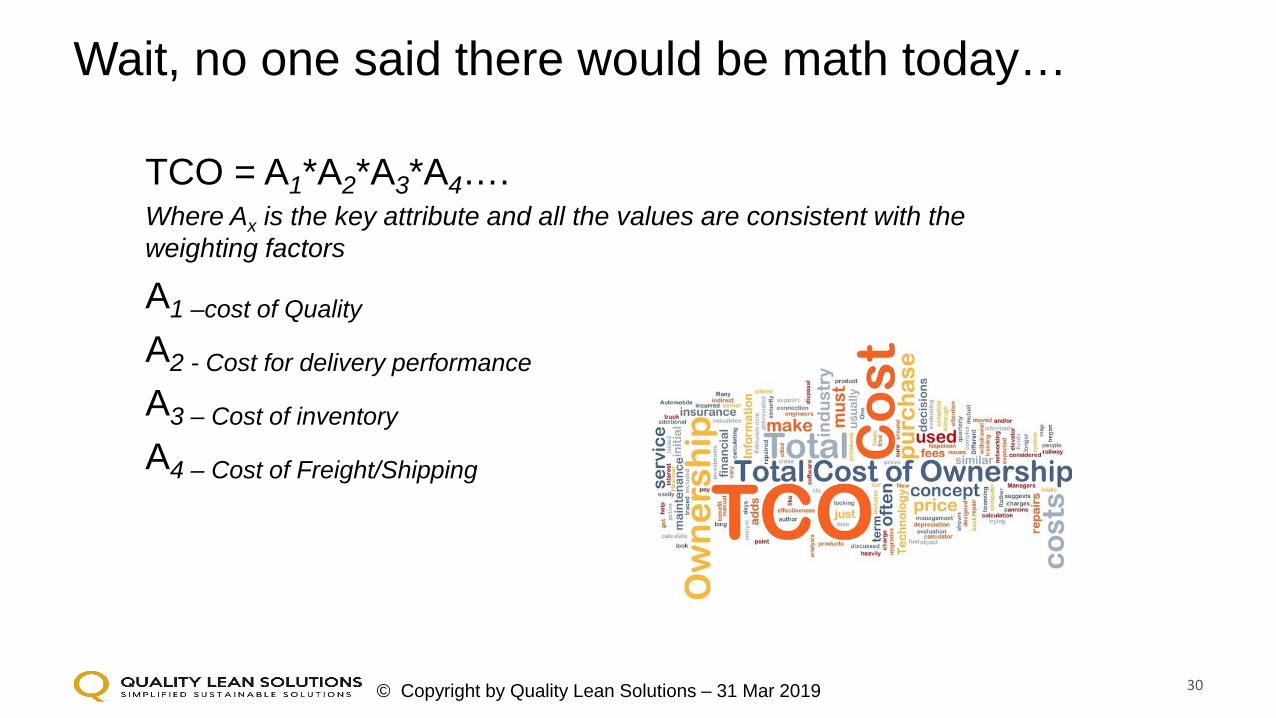
Wait, no one said there would be math today…
30
TCO = A1*A2*A3*A4….Where Ax is the key attribute and all the values are consistent with the weighting factors
A1 –cost of Quality
A2 - Cost for delivery performance
A3 – Cost of inventory
A4 – Cost of Freight/Shipping
© Copyright by Quality Lean Solutions – 31 Mar 2019
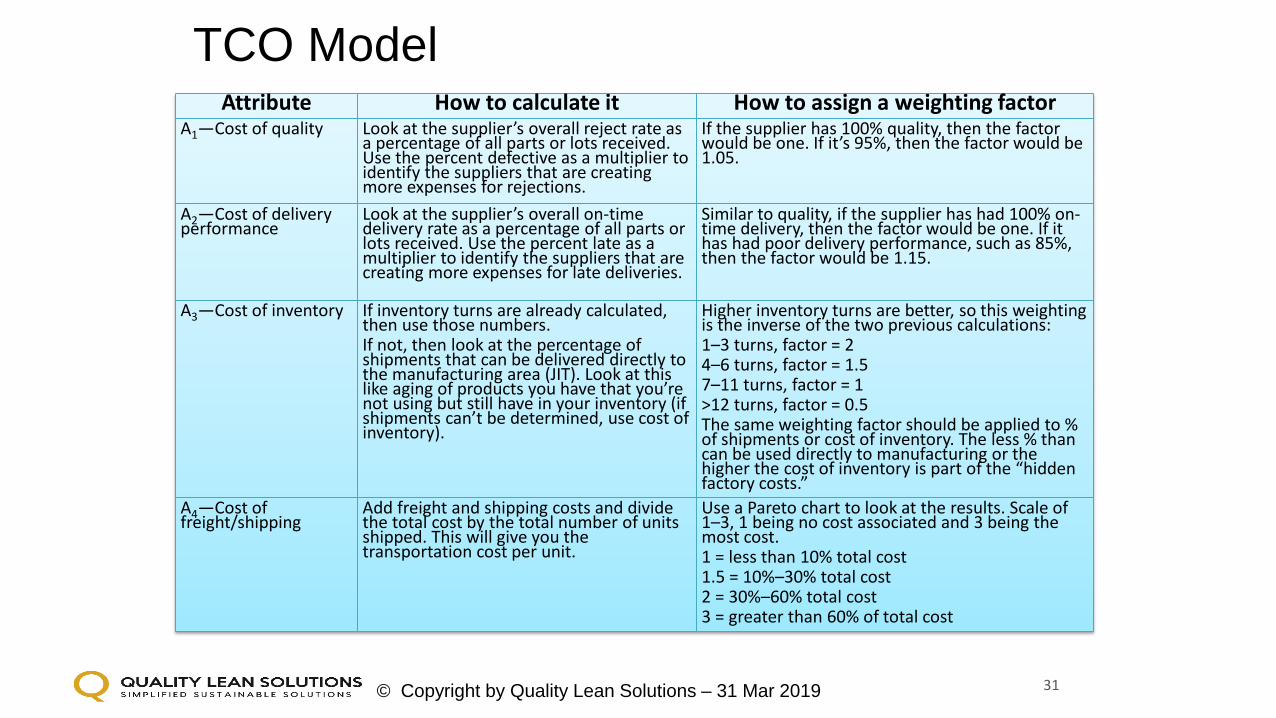
TCO Model
31
Attribute How to calculate it How to assign a weighting factorA1—Cost of quality Look at the supplier’s overall reject rate as
a percentage of all parts or lots received. Use the percent defective as a multiplier to identify the suppliers that are creating more expenses for rejections.
If the supplier has 100% quality, then the factor would be one. If it’s 95%, then the factor would be 1.05.
A2—Cost of delivery performance
Look at the supplier’s overall on-time delivery rate as a percentage of all parts or lots received. Use the percent late as a multiplier to identify the suppliers that are creating more expenses for late deliveries.
Similar to quality, if the supplier has had 100% on-time delivery, then the factor would be one. If it has had poor delivery performance, such as 85%, then the factor would be 1.15.
A3—Cost of inventory If inventory turns are already calculated, then use those numbers.If not, then look at the percentage of shipments that can be delivered directly to the manufacturing area (JIT). Look at this like aging of products you have that you’re not using but still have in your inventory (if shipments can’t be determined, use cost of inventory).
Higher inventory turns are better, so this weighting is the inverse of the two previous calculations:1–3 turns, factor = 24–6 turns, factor = 1.57–11 turns, factor = 1>12 turns, factor = 0.5The same weighting factor should be applied to % of shipments or cost of inventory. The less % than can be used directly to manufacturing or the higher the cost of inventory is part of the “hidden factory costs.”
A4—Cost of freight/shipping
Add freight and shipping costs and divide the total cost by the total number of units shipped. This will give you the transportation cost per unit.
Use a Pareto chart to look at the results. Scale of 1–3, 1 being no cost associated and 3 being the most cost.1 = less than 10% total cost1.5 = 10%–30% total cost2 = 30%–60% total cost3 = greater than 60% of total cost
© Copyright by Quality Lean Solutions – 31 Mar 2019

TCO in action
32
Measurements Supplier A Supplier B Supplier CPricing The Best! Great pricing Not as good as
Supplier BQuality Performance
95% 95% 99%
Delivery Performance
100% 90% 99%
How is the product delivered?
Large overseas shipping container, requires 100% sorting through incoming inspection
Your company pays for shipment costs so that the deliveries can be on time
Weekly shipment via UPS by the supplier
How much inventory do you have on hand?
Three months Two months Two weeks
© Copyright by Quality Lean Solutions – 31 Mar 2019

TCO = Quality*Delivery*Inventory*Freight
33
quality delivery inventory freight
Supplier TCO A1 A2 A3 A4
A 4.20 1.05 1.00 2.00 2.00
B 2.60 1.05 1.10 1.50 1.50
C 1.28 1.01 1.01 1.00 1.25
Supplier C is 1/3 less expensive than Supplier A
© Copyright by Quality Lean Solutions – 31 Mar 2019
Summary
© Copyright by Quality Lean Solutions - 31 Mar 2019 34
•YES but avoidable! Are there compliance issues with Supplier Controls?
• Yes - MDSAP, MDR and CEDo Supplier Controls extend into other
regulatory or compliance requirements?
• Understand the requirement• Keep it simple – sustainable - solution
What do we need to know?
• Risk based decision making toolsWhat are best practices to be
compliant?

ASQhttps://asq.org/quality
-press
Item H1509
100 % of royalties are donated to Veteran Services
#payitforward#freedomisnotfree
© Copyright by Quality Lean Solutions - 7 October 2018

© Copyright by Quality Lean Solutions - 31 Mar 2019 36
FREESupplier Quality Agreement templateTotal Risk Factor ™Cost of Ownership worksheet
www.qualityleansolutions.com
• What do you like about the site?• What are three things that should be changed,
updated or removed?
Would you like some free stuff?
Thank you!!
www.qualityleansolutions.comFollow me on Twitter - @Qualityleansoln
508.726.0574 mobile

Sources and References“Proactive Supplier Management in the Medical Device Industry,” Quality Press, 2016.http://www.mpo-mag.com/issues/2016-10-01/view_features/iso-134852016-are-your-suppliers-ready
https://www.fda.gov/downloads/Drugs/DevelopmentApprovalProcess/SmallBusinessAssistance/UCM466495.pdf
https://www.fda.gov/downloads/AboutFDA/CentersOffices/OfficeofMedicalProductsandTobacco/CDRH/CDRHTransparency/UCM597261.pdfProactive Supplier Management in the Medical Device Industry – James Shore and John Freijehttps://asq.org/quality-press/display-item?item=H1509
Websites • GHTF/SG3/N17:2008• http://www.imdrf.org/documents/doc-ghtf-sg3.asp• https://www.fda.gov/medicaldevices/internationalprograms/mdsappilot/
© Copyright by Quality Lean Solutions - 31 Mar 2019


