
Bottom-up drivers of species interactions on the Oregon Coast
Jonathan Robinson and Bruce MengeOregon State University – PISCO
WSN 2014 Talk

The ocean is changing
Ruggiero et al. 2010
Increasing wave height
Increases in upwelling along the Oregon coast
Huyer et al. 2010
Feely et al. 2009
Increasing ocean acidification
What are the likely consequences for coastal ecosystems?

Long-Term Research in Environmental Biology (LTREB) Project
• Question: How will intertidal community dynamics and structure change with changing climate?
• (Very General) PredictionsChanges could:– Alter ecological subsidies– Alter species interactions – Affect diversity, zonation, abundance– BUT – Directions of change difficult to predict mussels could decrease increased macrophytes sea stars or whelks could decrease increased abundance of prey altered zonation

• Cape Foulweather • Narrower shelf• Offshore currents• Less retentive
• Cape Perpetua• Wider shelf• Mixed currents• More retentive
• Cape Blanco• Narrow shelf• Offshore currents • Stronger upwelling• Less retentive
Today’s focus: Central interaction in most
temperate rocky intertidal communities
Predator – Barnacle – Mussel interaction web
Photo by E. Sanford
Oregon coastal intertidal meta-ecosystem

Oregon capes oceanographic differences generate differences in ecological subsidies
CF CP CB
chlo
rop
hyll-a (
g/l)
0
5
10
15
20
25
CF CP CB
# mu
ssels/collecto
r/day
0
20
40
60
80
CF CP CB
barn
acles/collecto
r/day
0
10
20
30
40
50
60
70
phytoplankton
barnacle recruitment
mussel recruitment
a
bb
aa
a
b
b b
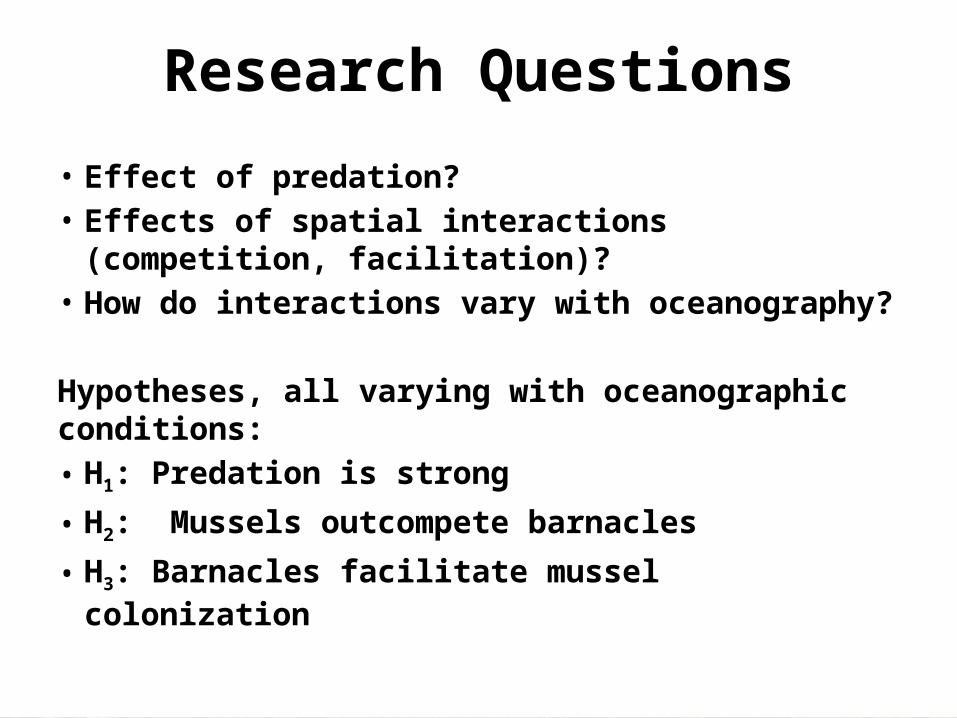
Research Questions
• Effect of predation?• Effects of spatial interactions (competition,
facilitation)?• How do interactions vary with oceanography?
Hypotheses, all varying with oceanographic conditions:• H1: Predation is strong
• H2: Mussels outcompete barnacles
• H3: Barnacles facilitate mussel colonization

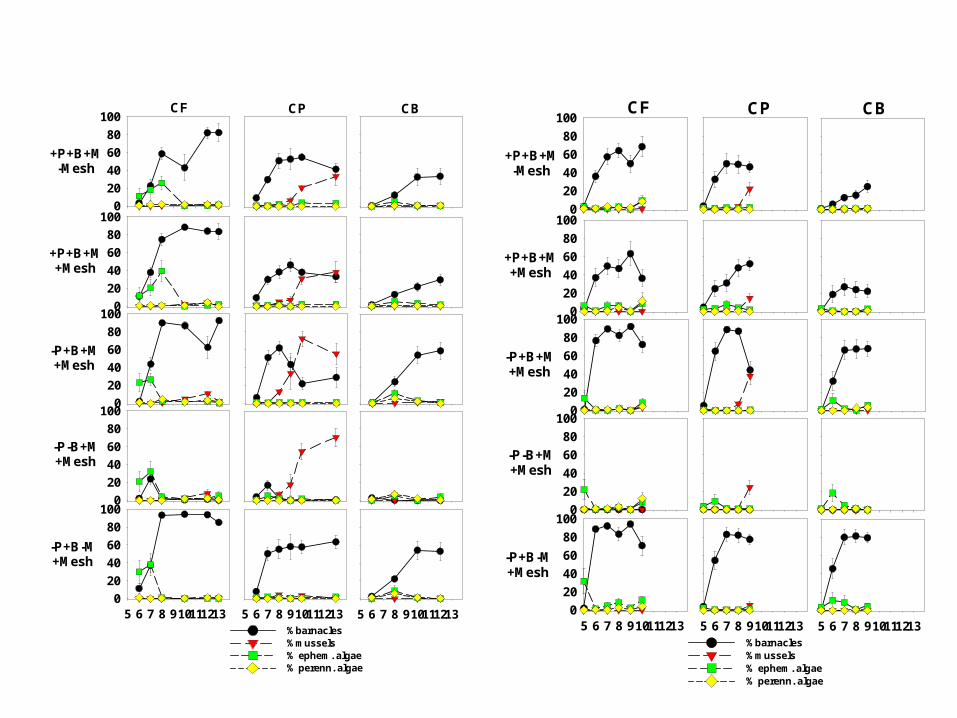
Methods• 5 Treatments
+P+B+M -meshCape Foulweather
Cape Perpetua
Cape Blanco
CA
Oregon
WA
+P+B+M +mesh
-P+B+M +mesh
-P+B-M +mesh
-P-B+M +mesh

Methods
Cape Foulweather
Cape Perpetua
Cape Blanco
CA
Oregon
WA
• 5 Replicates• Cleared in spring• Photographed once/twice a
month • Percent cover of species
analyzed• ~1500 pictures analyzed• Results from 2011 & 2012• RMANOVA– Linear Constraints (post hoc)

0
20
40
60
80
1000
20
40
60
80
100
0
20
40
60
80
1000
20
40
60
80
100
p=0.02
• Yes: except for CF 2011, p = 0.02 or more• CP different from CF, CB; consistent with difference in larval retention, food
2012
H1: Predation effect? Varies with oceanography?
+Pred
-Pred
+Pred
-Pred
CF CP CB
All capes:Prey cover in –P > +P
%barnacles%mussels% ephem. algae% perenn. algae
p=0.0005
p=<0.0001p=<0.0001
p=0.004
p=<0.0001
2011

5 6 7 8 9101112130
20
40
60
80
100
5 6 7 8 910111213 5 6 7 8 910111213
0
20
40
60
80
100
5 6 7 8 9101112130
20
40
60
80
100
5 6 7 8 910111213 5 6 7 8 910111213
H2: Competition effect?• Yes but context-dependent
0
20
40
60
80
100
2011
CF CP CB
2012
-P+B+M
-P+B-M
-P+B-M
-P+B+M
ns p=0.002 ns
ns p=0.1 ns
CP: If mussels removed during colonization, barnacles persist
CF, CB: Mussel removal had no effect on barnacles
%barnacles%mussels% ephem. algae% perenn. algae

0
20
40
60
80
100
0
20
40
60
80
100
H3: Facilitation effect?
0
20
40
60
80
100
0
20
40
60
80
100
2011
CF CP CB
2012
-P+B+M
-P-B+M
-P-B+M
-P+B+M
No.
ns p=0.07 ns
ns p=0.053 ns
CP: Trend towards lowerabundance of mussels without barnacles, but NS
CF, CB: No difference
%barnacles%mussels% ephem. algae% perenn. algae

Discussion• Predation important everywhere• Competition only occurred at CP sites• Facilitation not observed, WHY?• Field observations suggest that facilitation depends on recruitment rates– When recruitment is low
• Abundances too low for interactions to occur (short-term)
– When recruitment is high• Variable result: other experiments, saw facilitation• In this experiment, mussel recruitment overwhelming, so
even rugose rock surfaces acceptable

LTREB Goals• Study designed to test change through (longer)
time (10 yrs)– So these results are preliminary with respect to
temporal changes• Key result of ACE – Interaction strength and abundance of interactors
is driven by subsidy rates along the capes

Acknowledgements A Huge Thanks To:• The OSU PISCO Lab
FRAsJerod Sapp, Angela Johnson, Shawn Gerrity, Megan Poole, Lindy Hunter Tully Rohrer, Becky Focht, Kim Page-Albins
SRAsSteven Cook, Emma Fraser, Peter McBride, Megan Urton, Marissa Duncan, Dani Smull, Kersten Schnurle, Kamala Earl, Alexander Carsh, Lacey Schrock-Purkey
GradsAllie Barner, Liz Cerny-Chipman, Chenchen Shen, Sarah Close, Jenna Sulliven, Jessie Reimer
UndergradsSilke Bachhuber, Kaitlyn Boze
Photos by: Thomas Robinson
Funding provided by:
A special thanks to Christina Robinson

Questions?
0
20
40
60
80
100
%barnacles%mussels% ephem. algae% perenn. algae
5 6 7 8 9101112130
20
40
60
80
1000
20
40
60
80
1000
20
40
60
80
1000
20
40
60
80
100
5 6 7 8 910111213 5 6 7 8 910111213
CF CP CB
+P+B+M-Mesh
-P+B+M+Mesh
+P+B+M+Mesh
-P-B+M+Mesh
-P+B-M+Mesh
0
20
40
60
80
100
%barnacles%mussels% ephem. algae% perenn. algae
5 6 7 8 9101112130
20
40
60
80
1000
20
40
60
80
1000
20
40
60
80
1000
20
40
60
80
100
5 6 7 8 910111213 5 6 7 8 910111213
CF CP CB
+P+B+M-Mesh
-P+B+M+Mesh
+P+B+M+Mesh
-P-B+M+Mesh
-P+B-M+Mesh

CCLME (California Current Large Marine Ecosystem)
• Unique large scale study area
• Good place to study rocky intertidal– Why?
• Highly productive• Diverse, highly
dynamic biological communities
• Species interactions (facilitation, competition, and predation)


