

Brain Resource Limited
ABN 24 094 069 682
Board of Directors
Evian Gordon (Executive Chairman) Louis Gagnon (Managing Director) Matthew Morgan (Non-executive Director) Stephen Koslow (Non-executive Director) Ajay Arora (Non-executive Director)
Contact Information
Email: [email protected] Website: http://www.brainresource.com Share Registry
Boardroom Pty Limited Telephone: +61 (0) 2 9290 9600 Facsimile: +61 (0) 2 9279 0664 Email: [email protected] Website: www.boardroomlimited.com.au
Auditors
Grand Thornton Stock Exchange Listing
Listed on Australian Securities Exchange – ASX Code: BRC American Depository Receipt quoted on OTC market – Code: BRRZY
Table of Contents
Chairman’s Letter 3 Operational Review 5 Reports of the Directors 17 Consolidated Financial Statements & Notes 31 Directors Declaration 73 Shareholder Information 80
2
30 September 2018
Dear Shareholders,
On behalf of the Board of Directors of Brain Resource Limited (the “Company” or “BRC”), I am pleased to
present our Annual Report for the Financial Year ended 30 June 2018 (FY2018).
Financial Year 2018 was a year of major transformation for Brain Resource.
During the first half of the year, our team was mainly focused on executing the complex restructuring of the
company’s balance sheet and securing funding necessary to pursue the Company’s growth objectives. In
December 2017, this culminated in the successful recapitalisation of the business, conversion of convertible
securities to equity, and removal of the secured interest over the Company’s assets. During the second half
of the year, our focus shifted to the revamp of our value proposition and the building of a scalable business
operation. Key initiatives included:
(i.) complete product overhaul and transition from MBS to Total Brain brand successfully executed on 12 September 2018, ahead of plan;
(ii.) business infrastructure overhaul and migration of all platforms to the cloud; (iii.) process re-engineering across all business functions; (iv.) new positioning as a Brain Performance Monitoring and Training Platform; (v.) MBS product redevelopment and new product development to support new positioning; (vi.) several marquee new client contracts, including a direct contract with the American Association
of Retired Persons (“AARP”), an expansion of the number of users with The Boeing Company, and an exclusive software and data license agreement with Neurocare;
(vii.) exclusive agreement and distribution relationship with Transformational Leadership for Excellence (“TLEX”) Institute for collaboration on mind-body training content to be incorporated in the Total Brain product;
(viii.) completion of “GWAS” data acquisition and validation of a genetic test for the iSpot depression study to be completed in the fall of 2018, while exploring strategic avenues.
These initiatives have already started yielding results with our MyBrainSolutions (“MBS”) employer product
in the United States showing a 28% annual increase in revenues ($2.1m in FY2018 compared to $1.6m in
FY2017). The MBS segment is also the primary driver behind the 8.5% annual growth we experienced in
the total revenue of the Company, reversing the -17% growth in FY2017. At the same time, User
Registrations and Brain Profiles grew 40% and 58%, respectively, on an annual basis.
These positive results were achieved without the benefit of the redesigned Total Brain product. We expect
that in the months following the successful re-brand and launch which occurred on 12 September 2018, we
will experience a very significant increase in new contracts and revenues. We have already seen early
evidence of this momentum with our current sales pipeline, which has tripled in size during the second half
of CY2018. Part of the increase was driven by commitments from existing customers to buy our new Total
Brain Screening product which is expected to have a very material impact on their average order size.
Meanwhile, the macro tailwinds behind our business continue to accelerate. Optimal Brain Performance
Monitoring and Training positioning is fast gaining traction with corporates, payers and consumers. It
addresses the mainstream problem of Brain Hacking, by virtue of which always-on technologies induce
people to feel, think and connect sub-optimally. The same tech-driven trends also accelerate the growth of
3

undiagnosed mental health issues. There are 44 million Americans who currently suffer from a mental health
condition, half of whom, while undiagnosed and untreated, are costing an incremental $8,000 per person per
year. At the same time, 50% of teenagers and 27% of adults are addicted to their devices. A Brain
Performance Monitoring and Training Solution which includes the world’s first non-stigmatizing mental
condition screening tool represents an opportunity for social and monetary returns that is unprecedented.
The long-standing content differentiation of BRC’s standardised database and platform, coupled with the
exceptional innovation, implementation discipline, and commercial experience that Louis Gagnon and the
new team have forged into Total Brain, will be transformative for our business over the coming year.
Yours sincerely,
Dr. Evian Gordon, PhD
Chairman of Board of Directors
4

5
Operational Review for the fiscal year ended to 30 June 2018
1 HIGHLIGHTS
● During FY2018, Brain Resource delivered positive financial results amidst a year of significant
changes for the business:
o 28% annual growth in revenue from the MyBrainSolutions employer segment
o 8.5% annual growth in total revenue, reversing negative growth from FY2017 of -17%,
despite a -33% decline in non-core revenue
o 20-30% quarterly growth in cash receipts over 3 consecutive quarters, including the highest
quarterly cash receipt amount in 5 years in the June quarter
● As of 30 June 2018, the Company grew cumulative User Registrations to 600k, representing 40%
annual growth and a 4-year CAGR of 61%, while the cumulative number of Brain Profiles increased
to 447k, representing 58% annual growth and 4-year CAGR of 63%
● BRC executed several large new client contracts:
o Direct, 2-year agreement with the American Association of Retired Persons, expected to
bring a minimum of A$675k over the length of the contract;
o Agreement to expand the eligible population of The Boeing Company to 47k of its union
workers, representing A$230k of annualized recurring revenue;
o A 4-year, A$150k exclusive agreement with Neurocare, a global operator of mental health
clinics, to license BRC’s proprietary EEG software and data.
● BRC completed multiple operational initiatives across each business function:
o Aligned corporate and functional planning and established best practices in sales and
customer success, human resource management, financial reporting, and marketing
automation
o De-risked and modernised the MBS infrastructure, including migrations of systems and data
to best of breed cloud-based solutions
o Recruited, hired and onboarded 15 people to double the size of our team, with key hires across engineering, product, marketing, sales and operations
o Executed an exclusivity agreement with the Transformational Leadership for Excellence
Institute for collaboration on mind-body training content to be provided by TLEX and
integrated into the new Total Brain product by the end of CY2018
o Successfully completed product overhaul and transition from MBS to Total Brain brand on 12
September 2018, ahead of plan
● Brain Resource completed a share placement of A$10 million and converted A$14 million in debt
securities in December 2017, removing the security interest over the Company’s assets and all debt
from its balance sheet
o A Share Purchase Plan of A$1.25 million was also completed in January 2018, enabling
eligible shareholders to invest in BRC under similar terms to the December 2017 placement
6

2 BUSINESS OPERATIONS
2.1 USER KPIS
User Registrations and Brain Profiles are the key user KPIs for the business today because they directly
reflect product adoption and usage among clients, while also underpinning the value of the Company’s
proprietary database. As such, growing user KPIs is a top priority for Brain Resource, along with growing
revenue and cash receipts. During FY2018:
● User Registrations increased by 171k, a 40% year-on-year growth in cumulative users and a 61%
CAGR since 2014; and
● Brain Profiles increased by 165k, a 58% year-on-year growth in cumulative profiles and a 63% CAGR
since 2014.
This growth was achieved without the benefit of a redesigned product experience or additional functionalities
launched with the new platform on 12 September 2018 (the upgraded and rebranded MBS). The figures also
exclude any uplift expected from the launch of the direct partnership with AARP and several large
opportunities in BRC’s sales pipeline.
2.2 PRODUCT AND TECHNOLOGY
FY2018 was a year of significant transformation for Brain Resource’s product and technology. Not only is the
lead product being redeveloped but the infrastructure and automated processes required to achieve a highly
scalable Software as a Service (SaaS) based business have been upgraded to ensure the product, the data
81,645
113,028
199,767
367,870
447,543
114,519
151,895
296,265
519,387
600,340
0
100,000
200,000
300,000
400,000
500,000
600,000
700,000
CY2014 CY2015 CY2016 CY2017 June 2018 (FY2018)
Total Brain Profiles (Cumulative)
Total User Registrations (Cumulative)
* Represents cumulative actual figures through 30 June 2018. User Registration figures exclude employer-pre-registered users. Brain
Profiles figures include multiple assessments taken by same user. Note that the historical Brain Profile figures were amended to
include an additional 27k of previously unaccounted-for profiles.
7

security, and the connectivity are in place to service an increase in the number of users and data sets,
consistent with the Company’s sales objectives. Key accomplishments included:
● Successfully executed against an aggressive product roadmap and successfully delivered the new product in desktop and mobile versions on 12 September 2018, ahead of previously-communicated timelines;
o Launched new client-facing Brain Performance Report, which has received very positive feedback from existing and new clients to-date;
o Completed a new user experience (UX) and user interface (UI) design of the brain
assessment, results dashboard, and onboarding modules of the product;
o Fundamentally re-developed the brain assessment, one of the most critical components
of the new Total Brain platform;
● De-risked and modernised the Company’s IT infrastructure, including migrations of systems and
data from hosted operations to best of breed cloud-based solutions, while re-architecting the full
technology stack to support BRC’s big data and analytics ambitions at scale;
● Reimagined the MyBrainSolutions product as a scalable, user-centric software platform for brain performance monitoring, screening and training;
● Executed an exclusivity agreement with the Transformational Leadership for Excellence Institute
for collaboration on mind-body training content, including restorative practices, practical wisdom,
and meditation, to be provided by TLEX and integrated into the new Total Brain product by the
end of CY2018;
o TLEX Institute is a leader in well-being and leadership training in the corporate sector,
having taught courses to 200+ large organisations across the globe, including American
Express, Amazon, Microsoft and Intuit.
2.3 SALES AND CUSTOMER SUCCESS
During FY2018, Brain Resource has completely overhauled its Sales and Customer Success function, driven
by two primary objectives: (i.) accelerate CY2018 revenue while renovating and broadening the product
offering, and (ii.) maximise long-term value for the business and its shareholders with a focus on recurring
revenue and scalability.
The first part of the year was focused on building out business infrastructure, best-in-class processes, and
developing a go-to-market strategy in alignment with the new vision for the Total Brain product. Key
accomplishments include:
● Executed a channel partner enablement plan to revive BRC’s existing channel relationships with
insurers and human resource consultancies;
● Developed new go-to-market priorities, including opportunities with new channel partners, affinity
groups, Employee Assistance Programs, and Health Risk Assessment providers;
● Implemented a CRM/pipeline solution and corresponding financial forecasting processes;
● Revamped the compensation incentive plans for internal and external sales and signed new sales
referral agreements with key industry connectors;
● Developed and executed on a comprehensive customer success campaign for all existing clients
with a focus on expanding the share of wallet, retention, and improved satisfaction rates in advance
of the new product launch.
8

These initiatives started to yield positive results in the second half of FY2018 through a significant increase
in the set of pipeline opportunities (3x growth during 2H FY2018), and the execution of several large new
contracts:
● Direct, 2-year agreement with the American Association of Retired Persons, expected to bring a
minimum of A$675k in revenue over the length of the contract, double the amount of the previous
contract with AARP that was intermediated by a third party (i.e. indirect);
● Agreement to expand the eligible population of The Boeing Company to 47k of its union workers,
representing A$230k of incremental annualized recurring revenue;
● 4-year, A$150k exclusive agreement with Neurocare, a global operator of mental health clinics, to
license BRC’s proprietary EEG software and data.
2.4 MARKETING
On the marketing front, BRC has made notable progress in establishing the infrastructure required to scale
a B2B SaaS business. Accomplishments include:
● Acquired 1750+ new B2B leads by leveraging industry events, lead lists, content syndication, and
social media advertising targeting and, channel and reseller partners engagement;
o Represented BRC in several marquee industry events, including the HLTH “Future of
Healthcare” Conference in Las Vegas, the largest conference for health innovation, and the
National Wellness Institute Conference in Minneapolis, generating 100+ direct B2B sales
leads;
● Developed an automated B2B prospect marketing campaign with a variety of nurture tactics,
including webinars, social ad retargeting and highly-targeted direct mail, enabling shortened sales
cycle and accelerated conversion;
● Developed a wide range of high-quality marketing materials to enable Sales and Customer Success,
including sales presentations and scientific case studies;
● On track to execute complete rebrand of MyBrainSolutions to Total Brain in September 2018,
including an overhaul of the MBS website and all marketing collateral;
● Published unique thought leadership content in Forbes, Real Leaders, and Thrive Global, with social
amplification across Twitter, Facebook, and LinkedIn.
2.5 HUMAN RESOURCES
During FY2018 quarter, BRC successfully recruited, hired and onboarded 15 people to double the size of
our team. Following the recapitalisation in December 2017, key hires were made across engineering,
product, sales, marketing, and operations. The Company’s executive team was expanded with the addition
of Chief Marketing Officer, Matt Resteghini (ex-Monster), Vice President of User Experience, Pablo Sanchez
(ex-TiVo and Yahoo), and Director of Human Resources, Meredith Haase (ex-Monster), all of whom have
brought needed expertise and leadership in their respective areas. The Company has also been successful
in identifying several high-profile advisors and a Board Director to support the business in its new form,
including:
● Ajay Arora, an executive at Netflix, contributing 20 years of experience in SaaS, user acquisition and subscriptions to the Company’s Board of Directors;
● Barbara Van Dahlen, President of Give an Hour Foundation and one of Time Magazine’s 100 Most
9

Influential People in the World in 2012; ● Patrick Manzo, ex-Chief Privacy Officer of Monster; ● Christopher Dolan, CTO of ANSWR and Director of Data Platforms at Sonos.
In addition, Brain Resource has established best-in-class HR processes, while fostering a culture focused
on collaboration and personal well-being across the organisation. Key accomplishments include:
● Developed a new company mission, values and strategic framework;
● Rolled out KPI-driven incentive plans including a new Employee Stock Option Plan;
● Commenced the implementation of a HRIS software system and overhauled legacy systems and
policies;
● Rolled out a discretionary time off policy for US employees, limiting company liability for paying out
long-term unused balances;
● Launched quarterly in-person retreats to align on business strategy, team interdependencies, and
learn practical tools for personal well-being;
● Developed an online meditation program, allowing employees to de-stress with practical mind-body
tools throughout the week.
2.6 CLINICAL BUSINESS
BRC’s clinical business refers to the segment of our company that sells directly to psychologists,
psychiatrists and other medical clinics. With its current focus on the US corporate sector through
MyBrainSolutions and given the fact that clinics currently use a different product platform, the Company
has taken an opportunistic approach to the clinical business seeking out only large potential clients on an
ad-hoc basis. BRC continues to harvest its existing book of business with minimal spend on product, sales
and marketing, which has been reflected in the -18% decline in revenue from this business line during
FY2018.
2.7 ISPOT DIAGNOSTIC AND TREATMENT PREDICTION TESTS
While the Company’s current business plan is focused on the development of the corporate market, BRC
continues to explore strategic alternatives to maximize shareholder value from the iSpot assets. As previously
communicated, Brain Resource has commenced a targeted outreach process to engage potential
commercial partners for iSpot with the help of a New York-based healthcare investment bank retained in late
April 2018. Meanwhile, the scientific team has completed the initial GWAS-based scientific analysis in July
2018, as planned. The preliminary indications stemming from the acquisition of genetics data, which includes
850,000 genetic variants or “SNPs” on 1,000 patients with depression, have been promising. Further
replication work is currently underway to confirm these findings.
10
3. FINANCIALS
3.1 REVENUES
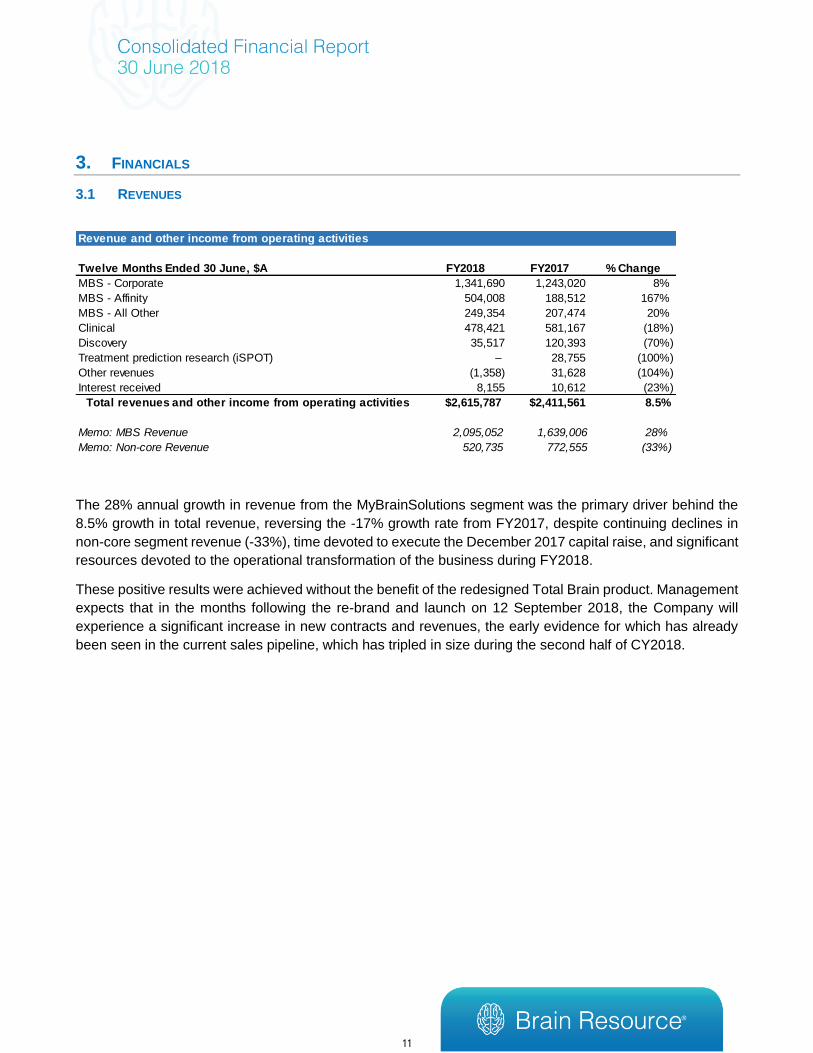
The 28% annual growth in revenue from the MyBrainSolutions segment was the primary driver behind the
8.5% growth in total revenue, reversing the -17% growth rate from FY2017, despite continuing declines in
non-core segment revenue (-33%), time devoted to execute the December 2017 capital raise, and significant
resources devoted to the operational transformation of the business during FY2018.
These positive results were achieved without the benefit of the redesigned Total Brain product. Management
expects that in the months following the re-brand and launch on 12 September 2018, the Company will
experience a significant increase in new contracts and revenues, the early evidence for which has already
been seen in the current sales pipeline, which has tripled in size during the second half of CY2018.
Revenue and other income from operating activities
Twelve Months Ended 30 June, $A FY2018 FY2017 % Change
MBS - Corporate 1,341,690 1,243,020 8%
MBS - Affinity 504,008 188,512 167%
MBS - All Other 249,354 207,474 20%
Clinical 478,421 581,167 (18%)
Discovery 35,517 120,393 (70%)
Treatment prediction research (iSPOT) – 28,755 (100%)
Other revenues (1,358) 31,628 (104%)
Interest received 8,155 10,612 (23%)
Total revenues and other income from operating activities $2,615,787 $2,411,561 8.5%
- -
Memo: MBS Revenue 2,095,052 1,639,006 28%
Memo: Non-core Revenue 520,735 772,555 (33%)
11
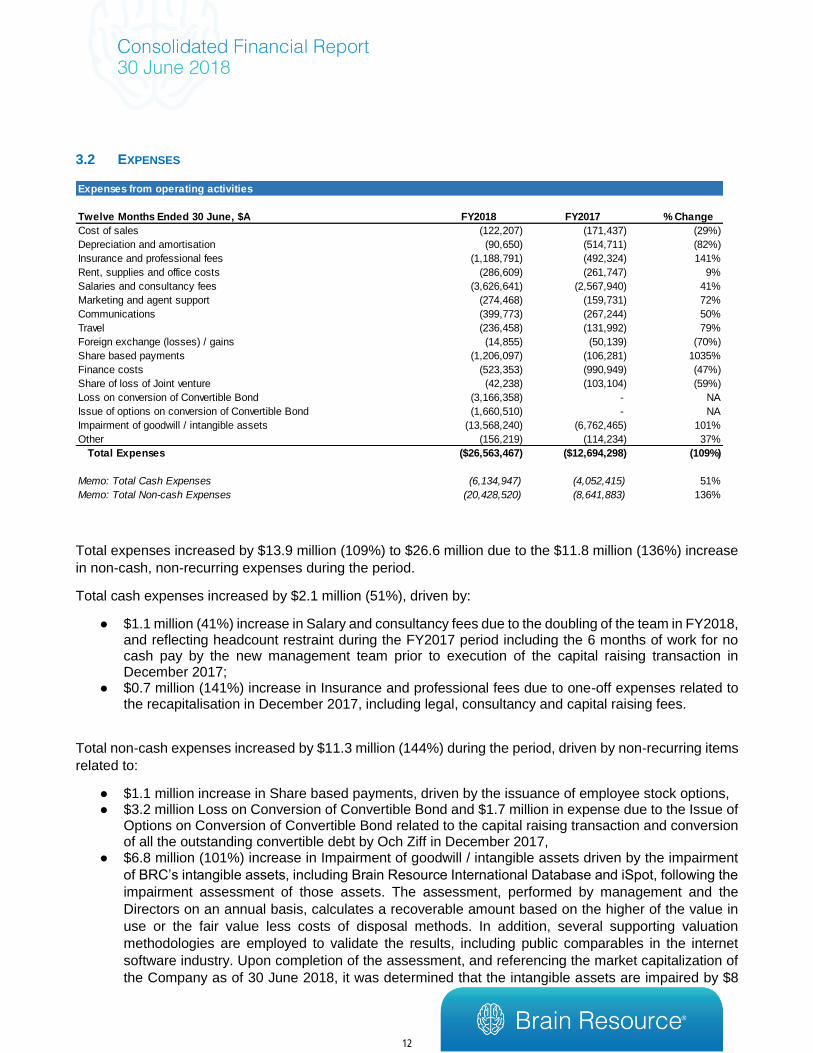
3.2 EXPENSES
Total expenses increased by $13.9 million (109%) to $26.6 million due to the $11.8 million (136%) increase
in non-cash, non-recurring expenses during the period.
Total cash expenses increased by $2.1 million (51%), driven by:
● $1.1 million (41%) increase in Salary and consultancy fees due to the doubling of the team in FY2018, and reflecting headcount restraint during the FY2017 period including the 6 months of work for no cash pay by the new management team prior to execution of the capital raising transaction in December 2017;
● $0.7 million (141%) increase in Insurance and professional fees due to one-off expenses related to the recapitalisation in December 2017, including legal, consultancy and capital raising fees.
Total non-cash expenses increased by $11.3 million (144%) during the period, driven by non-recurring items
related to:
● $1.1 million increase in Share based payments, driven by the issuance of employee stock options, ● $3.2 million Loss on Conversion of Convertible Bond and $1.7 million in expense due to the Issue of
Options on Conversion of Convertible Bond related to the capital raising transaction and conversion of all the outstanding convertible debt by Och Ziff in December 2017,
● $6.8 million (101%) increase in Impairment of goodwill / intangible assets driven by the impairment
of BRC’s intangible assets, including Brain Resource International Database and iSpot, following the
impairment assessment of those assets. The assessment, performed by management and the
Directors on an annual basis, calculates a recoverable amount based on the higher of the value in
use or the fair value less costs of disposal methods. In addition, several supporting valuation
methodologies are employed to validate the results, including public comparables in the internet
software industry. Upon completion of the assessment, and referencing the market capitalization of
the Company as of 30 June 2018, it was determined that the intangible assets are impaired by $8
Expenses from operating activities
Twelve Months Ended 30 June, $A FY2018 FY2017 % Change
Cost of sales (122,207) (171,437) (29%)
Depreciation and amortisation (90,650) (514,711) (82%)
Insurance and professional fees (1,188,791) (492,324) 141%
Rent, supplies and office costs (286,609) (261,747) 9%
Salaries and consultancy fees (3,626,641) (2,567,940) 41%
Marketing and agent support (274,468) (159,731) 72%
Communications (399,773) (267,244) 50%
Travel (236,458) (131,992) 79%
Foreign exchange (losses) / gains (14,855) (50,139) (70%)
Share based payments (1,206,097) (106,281) 1035%
Finance costs (523,353) (990,949) (47%)
Share of loss of Joint venture (42,238) (103,104) (59%)
Loss on conversion of Convertible Bond (3,166,358) - NA
Issue of options on conversion of Convertible Bond (1,660,510) - NA
Impairment of goodwill / intangible assets (13,568,240) (6,762,465) 101%
Other (156,219) (114,234) 37%
Total Expenses ($26,563,467) ($12,694,298) (109%)
Memo: Total Cash Expenses (6,134,947) (4,052,415) 51%
Memo: Total Non-cash Expenses (20,428,520) (8,641,883) 136%
12

million. Note that since the intangible assets related to the iSpot study did not produce revenue in the
current year, no direct iSpot-related revenue was included in the value assessment. If in future
periods the Company generates revenue from those assets, thereby increasing the valuation of the
intangible assets, the impairment loss can be reversed in part or in full.
3.3 LOSS AFTER TAX
The $3.0 million (161%) reduction in EBITDA was driven by the $2.1 million (51%) increase in cash expenses,
including the $1.1 million (41%) increase in Salaries and consultancy fees and $0.7 million (141%) increase
in Insurance and professional fees, as well as the $1.1 million increase in non-cash Share-based payments
expense related to the issuance of employee stock options. The corresponding $13.2 million (134%) increase
in the Loss after tax was further impacted by the $11.8 million (136%) increase in the Company’s non-cash,
non-recurring expenses, including the $3.2 million Loss on Conversion of Convertible Bond, the $1.7 million
in expense due to the Issue of Options on Conversion of Convertible Bond related to the capital raising
transaction and conversion of all the outstanding convertible debt by Och Ziff in December 2017, and the
$6.8 million (101%) increase in Impairment of goodwill / intangible assets driven by the impairment of BRC’s
intangible assets.
Loss after Tax
Twelve Months Ended 30 June, $A FY2018 FY2017 % Change
EBITDA* (4,889,631) (1,871,981) 161%
Impairment of Goodwill / Intangible Assets (13,568,240) (6,762,465) 101%
Loss on conversion of Convertible Bond (3,166,358) - NA
Issue of Options on Conversion of Convertible Bond (1,660,510) - NA
Foreign Exchange (Losses) / Gains (14,855) (50,139) (70%)
Finance Costs (notional interest) (523,353) (990,949) (47%)
Share of loss of Joint venture (42,238) (103,104) (59%)
Depreciation and amortisation (90,650) (514,711) (82%)
Interest income 8,155 10,612 (23%)
Loss before tax (23,947,680) (10,282,737) 133%
Taxes 846,340 413,783 105%
Loss after tax (23,101,340) (9,868,954) 134%
* EBITDA pre-FX, notional interest cost, share of loss of JV and non-cash impairment and other losses
13
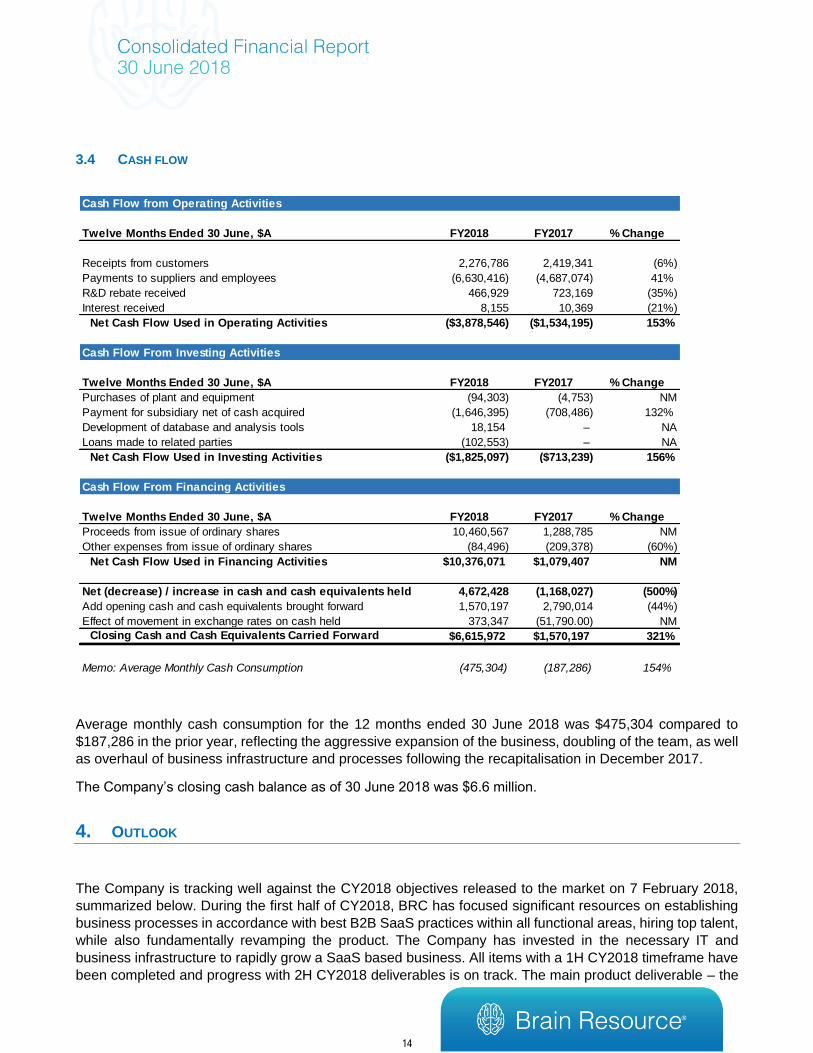
3.4 CASH FLOW
Average monthly cash consumption for the 12 months ended 30 June 2018 was $475,304 compared to
$187,286 in the prior year, reflecting the aggressive expansion of the business, doubling of the team, as well
as overhaul of business infrastructure and processes following the recapitalisation in December 2017.
The Company’s closing cash balance as of 30 June 2018 was $6.6 million.
4. OUTLOOK
The Company is tracking well against the CY2018 objectives released to the market on 7 February 2018,
summarized below. During the first half of CY2018, BRC has focused significant resources on establishing
business processes in accordance with best B2B SaaS practices within all functional areas, hiring top talent,
while also fundamentally revamping the product. The Company has invested in the necessary IT and
business infrastructure to rapidly grow a SaaS based business. All items with a 1H CY2018 timeframe have
been completed and progress with 2H CY2018 deliverables is on track. The main product deliverable – the
Cash Flow from Operating Activities
Twelve Months Ended 30 June, $A FY2018 FY2017 % Change
Receipts from customers 2,276,786 2,419,341 (6%)
Payments to suppliers and employees (6,630,416) (4,687,074) 41%
R&D rebate received 466,929 723,169 (35%)
Interest received 8,155 10,369 (21%)
Net Cash Flow Used in Operating Activities ($3,878,546) ($1,534,195) 153%
($21,060) –
Cash Flow From Investing Activities
Twelve Months Ended 30 June, $A FY2018 FY2017 % Change
Purchases of plant and equipment (94,303) (4,753) NM
Payment for subsidiary net of cash acquired (1,646,395) (708,486) 132%
Development of database and analysis tools 18,154 – NA
Loans made to related parties (102,553) – NA
Net Cash Flow Used in Investing Activities ($1,825,097) ($713,239) 156%
– –
Cash Flow From Financing Activities
Twelve Months Ended 30 June, $A FY2018 FY2017 % Change
Proceeds from issue of ordinary shares 10,460,567 1,288,785 NM
Other expenses from issue of ordinary shares (84,496) (209,378) (60%)
Net Cash Flow Used in Financing Activities $10,376,071 $1,079,407 NM
– –
Net (decrease) / increase in cash and cash equivalents held 4,672,428 (1,168,027) (500%)
Add opening cash and cash equivalents brought forward 1,570,197 2,790,014 (44%)
Effect of movement in exchange rates on cash held 373,347 (51,790.00) NM
Closing Cash and Cash Equivalents Carried Forward $6,615,972 $1,570,197 321%
Memo: Average Monthly Cash Consumption (475,304) (187,286) 154%
14

overhaul of the MBS platform and rebrand to Total Brain was successfully launched on 12 September 2018,
ahead of plan.
Objective Timeframe Status
FINANCIAL &
USER KPIs
2x CY18 revenue to US$3.2mm (from US$1.6mm in
CY17) CY-18 Ongoing
75%+ Recurring SaaS-based revenue (from 60% in
CY17) CY-18 Ongoing
2x Total User Registrations (from 223k in CY17)* CY-18 Ongoing
2x Total Brain Profiles (from 131k in CY17)* CY-18 Ongoing
PRODUCT
Upgrade MBS value proposition, new features & UX CY-18 ✓
Transition to scalable cloud-based software
infrastructure Q2-18 ✓
Complete iSPOT GWAS Testing and Validation and
explore Strategic Options Q2-18 ✓
Rebrand MBS to TotalBrain Q3-18 ✓
CORPORATE
Enable sale of unmarketable parcel share Q1-18 ✓
Appoint 3 New Advisors & 1 New Board Director Q1-18 ✓
Complete hiring plan Q1-18 ✓
Increase media engagement and PR CY-18 Ongoing
With proper business infrastructure in place, the Company’s focus for the balance of the calendar year is to
continue its quarter-on-quarter growth in cash receipts, User Registrations and Brain Profiles. This will in-
turn enable a successful delivery against BRC’s calendar year-end revenue and User KPI objectives. Given
the ongoing positive sales momentum and the launch of the new product platform in 2H CY2018, the
Company is well-positioned to achieve its targets and build a solid recurring revenue base for CY2019 and
beyond.
*User Registrations defined as total individuals who create a registration in Brain Resource system. Brain Profiles defined as
number of total assessments captured.
15

5. CAPITALISATION TABLE
# Shareholder # Shares % Holding
1 HSBC Custody Nominees (Australia) Ltd. 146,914,757 27.7%
2 HSBC Custody Nominees (Australia) Ltd.-GSCO 56,439,634 10.6%
3 Buttonwood Nominees Pty Ltd. 19,010,630 3.6%
4 Stuttgart Pty Ltd. 17,604,735 3.3%
5 Morgan Stanley Australia Securities (Nominee) 16,606,440 3.1%
6 CS Third Nominees Pty Ltd. 12,956,480 2.4%
7 Dr. Evian Gordon 11,240,248 2.1%
8 Gleneagle Securities (Aus) Pty Ltd. 11,000,000 2.1%
9 UBS Nominees Pty Ltd. 10,250,000 1.9%
10 DBPC Group Finance Pty Ltd. 10,250,000 1.9%
11 JP Morgan Nominees Aaustralia Ltd. 9,542,586 1.8%
12 Red Star Developments Pty Ltd. 6,655,429 1.3%
13 Spinite Pty Ltd. 5,500,000 1.0%
14 Mr. Dan Segal 4,731,250 0.9%
15 Mr. Louis Gagnon 4,159,225 0.8%
16 HSBC Custody Nominees (Australia) Ltd.-A/C 2 3,753,393 0.7%
17 Ceyx Holdings Pty Ltd. 3,500,000 0.7%
18 Arch 2000 Management Pty Ltd. 3,300,000 0.6%
19 Segal Super Pty Ltd. 3,270,000 0.6%
20 Mr. David Yett 3,190,394 0.6%
Top 20 Holdings 359,875,201 67.7%
Other Holdings 171,384,667 32.3%
Fully Paid Ordinary Shares quoted on ASX 531,259,868 100.0%
Transaction $ Amount
IPO Aug 2001 (at 25.0 cents per share) 5,003,006
Feb 2002 Placement (at 25.0 cents per share) 1,000,000
May 2003 Placement (at 26.5 cents per share) 2,250,000
Nov 2003 Placement (at 45.0 cents per share) 3,812,026
Jul 2005 Placement (at 30.0 cents per share) 1,634,510
Jun 2006 Placement (26.5 cents per share) 1,499,900
Feb 2013 Placement (30.0 cents per share) 1,000,000
Aug 2013 Placement (30.0 cents per share) 2,000,000
Aug/Sep 2014 Placement / SPP (25.0 cents per share) 8,058,500
Nov 2015 Placement / SPP (20.0 cents per share) 3,109,500
Apr 2017 Placement / SPP (at 8.0 cents per share) 1,321,500
Aug 2017 Placement (at 8.0 cents per share) 90,000
Dec 2017 Placement (at 6.0 cents per share) 10,097,181
Jan/Feb 2018 SPP – incl. shortfall (at 6.0 cents per share) 1,250,000
Option exercises 322,136
Total Funds Raised through ordinary equity 42,448,259
Convertible Bonds 10,000,000
Exchangeable Convertible Preference Shares 4,000,000
Total Funds Raised 56,448,259
16

Your Directors submit their report for the year ended 30 June 2018.
DIRECTORS
The following persons held office as Directors during or since the end of the financial year:
17

Dr Evian Gordon, BSc (Hons), PhD, MBBCh (Chairman and Executive Director)
Dr Gordon has over 30 years of experience in human brain research. He was the director of the Brain Dynamics
Centre at Westmead Hospital and a senior lecturer in the Department of Psychological Medicine at the University
of Sydney. Dr Gordon edited the book “Integrative Neuroscience” and has more than 200 publications. Appointed
a Director on 8 August 2000.
Mr Louis Gagnon, MSC, BBA (Executive Director and Chief Executive Officer)
Mr Gagnon has been the Chief Executive Officer (CEO) of BRC since 23 May 2017. Louis has 25 years’ worth of
experience as a high-growth global digital business leader, most notably at Amazon’s subsidiary Audible, where
he served as Chief Product and Marketing Officer. Prior to working with BRC, Louis was an Advisor to TPG Capital
following a short CEO assignment to turn around portfolio company Ride.com. His other past roles include Chief
Product and Marketing Officer at Yodle and Senior VP of Global Products at Monster Worldwide. Appointed a
Director on 27 December 2017.
Mr Matthew Morgan, MBA, B Com, B App Sc (Non-Executive Director)
Mr Morgan is the Principal of Millers Point Company, an advisory business to emerging companies with high
growth or turnaround objectives. He is a former venture capitalist and is experienced in capital raisings, mergers
and acquisitions and has held executive positions in a variety of private equity funded organisations. He was the
first Australian to be awarded a Kauffman Fellowship and was the co-founder of Diversa Ltd (ASX: DVA) a
financial service business acquired by OneVue Holdings Ltd (ASX: OVH). He is currently a non-executive
Chairman of ASX listed company Sensera Limited (ASX: LER) and a non-executive director at Leaf Resources
Limited (ASX: LER). He Chairs the Audit and Risk Committee for both Companies. Appointed a Director on 1
March 2016.
Dr Stephen Koslow BS, PhD (Non-Executive Director)
Dr Koslow served as the inaugural Director of the Neuroscience Research Branch at the National Institute of
Mental Health, including initiating the multi-Agency Human Brain Project. Dr Koslow has 90 publications in
referred journals, 20 invited chapters in books and has edited 16 books, including “Databasing the Brain”. He has
been a key part of Brain Resource since our inception and formally a consultant since 2008. Appointed a Director
on 1 March 2016.
Mr Ajay Arora, MBA, MSEE, B.Eng (Non-Executive Director)
Mr Arora is currently a Director of Product Innovation at Netflix, a world-leading internet entertainment service. He
has spent the last 20 years in management roles within the most successful digital subscription businesses in the
world, with a primary focus on user acquisition and partnerships. Mr Arora was previously VP of Product
Management at Imgur, a top 100 global web destination for image sharing, where he led the product, design and
data teams. He also led global product management for Audible, Inc., an Amazon company specialising in spoken
audio, where he oversaw mobile and desktop experiences, and led the integration of Audible into Amazon’s Kindle
and Echo product lines. Appointed a Director on 8 May 2018.
COMPANY SECRETARY
Mr Robert Waring, BEc, ACA, FCIS, ASIA, FAICD
Mr Waring has more than 40 years of experience in financial and corporate roles, including more than 25
years in company secretarial roles for ASX-listed companies. He is a director of Oakhill Hamilton Pty Ltd, a
company that provides secretarial and corporate advisory services to a range of listed and unlisted
companies. Mr Waring is also the Company Secretary of ASX-listed companies Aeris Environmental Ltd,
Vectus Biosystems Limited, Nanosonics Limited and Xref Limited. Ceased to be Company Secretary on 27
June 2018.
18

Mr Phillip Hains, CA, MBA (Joint Company Secretary)
Mr Hains brings almost 30 years of experience in corporate secretarial, accounting and general management
through his firm The CFO Solution, a boutique professional services firm for listed companies. Mr Hains is
currently a Director and Treasurer of the Australian Outward Bound Foundation. Mr Hains holds an MBA from
RMIT and received his Public Practice Certificate from the Institute of Chartered Accountants in 1998. Appointed
Joint Company Secretary on 27 June 2018.
Mr Harvey Bui, ACCA, B Com (Joint Company Secretary)
Mr Bui is a qualified chartered accountant with 10 years of experience in providing accounting finance and
corporate compliance advisory services to a wide range of businesses from not-for-profit organisations to
multinational ASX/NASDAQ listed companies, along with experience in auditing and assurance, having
started his career with Ernst & Young in 2008. Mr Bui is also a member of The CFO Solution. Appointed
Joint Company Secretary on 27 June 2018.
DIRECTORS’ INTERESTS IN SHARES AND OPTIONS
Directors' interests in shares and options as at 30 June 2018 and at the date of this report are set out in the
Remuneration Report.
ACTIVITIES
The principal continuing activity of the Group is the provision of brain performance monitoring, training and
screening services.
RESULTS
The net consolidated result of operations after applicable income tax expense was a $23,101,340 loss (2017:
$9,868,954 loss).
DIVIDENDS
No dividends were paid or proposed during the year (2017: $nil).
REVIEW OF OPERATIONS
A review of the operations of the Group during the financial year and the results of those operations are contained
in the Operational Review section of this report.
CORPORATE STRUCTURE
Brain Resource Limited (the ‘Company’) is a company incorporated and domiciled in Australia. It acts as the
holding company for six wholly owned Australian subsidiaries: BRC Operations Pty Ltd; BRC IP Pty Ltd; BRC
Distribution Pty Ltd; BRC International Pty Ltd; BRC Development Pty Ltd; PoweringUpMBS Pty Ltd (wholly
owned from 14/12/17) and one wholly owned USA subsidiary: Brain Resource, Inc., a California USA company.
BRC Operations Pty Ltd wholly owns two international subsidiaries: MyBrainSolutions, Inc. a Delaware USA
company and Brain Resource Europe Limited, a company incorporated in Ireland. Up until 14 December 2017
BRC had an interest in a joint venture, PoweringUpMBS Pty Ltd, which was subsequently 100% acquired.
Together, these companies form Brain Resource Limited (the ‘Group’).
SIGNIFICANT CHANGES IN STATE OF AFFAIRS
Directors are not aware of any significant changes in the state of affairs of the Group occurring during the
financial year, other than as disclosed in the Operational Review provided in this report.
19

MATTERS SUBSEQUENT TO END OF FINANCIAL YEAR
On 24 July 2018, the Company announced that it has partnered with the TLEX institute (Transformational
Leadership for Excellence) which offers tools for well-being, adaptive leadership and creativity, to create the
first end-to-end brain performance monitoring and training platform.
The exclusive partnership will allow the MyBrainSolutions product (to be rebranded TotalBrain) to bring
greater emotional and mental agility to its customers by merging cutting-edge brain research with ancient
wisdom and meditation provided by TLEX in its soon to be launched upgraded product.
On 19 September 2018, the Company announced the release of a significant upgrade, expansion to its
technological platform and the brand repositioning of legacy “MyBrainSolutions” to “Total Brain”: the worlds
first Brain Performance Monitoring and Training Platform.
LIKELY DEVELOPMENTS AND FUTURE RESULTS
It is not possible to accurately postulate likely developments and expected future results other than as described
in the Operational Review.
DIRECTORS’ EMOLUMENTS
i) Remuneration policy: Please refer to the report below for remuneration policy and details of Directors’
emoluments paid by the Company and Group during the year to 30 June 2018.
ii) Executive Officers: The executive officers other than the executive directors are disclosed below in the
remuneration report.
SHARE OPTIONS
As at the date of this report, there were 254,534,140 unissued ordinary shares under option. Details of share
options are disclosed in the remuneration report and at Notes 13(c) and 25. During the financial year,
employees and executives have not exercised any options to acquire fully paid ordinary shares in Brain
Resource Limited.
REMUNERATION REPORT (Audited)
i) Remuneration Policy
A remuneration committee is in place, comprising two non-executive directors who periodically reviewed the
remuneration of all Directors and executives. There is a fixed fee policy for all non-executive directors, which
was reviewed by the Board of Directors. The Committee used market comparisons as necessary.
Remuneration levels, including participation in the Company’s Employee Share Option Scheme, are set to
provide reasonable compensation in line with the Company’s financial resources. Equity options issued are
subject to operationally relevant performance conditions (including sales and timeliness of project delivery
targets) and vest over 3 years.
The remuneration policy of Brain Resource Limited has been designed to align the new executive’s objectives
with shareholder and business objectives by providing a fixed remuneration component and offering specific
long-term incentives based on key performance areas affecting the consolidated group's financial results.
The Board of Brain Resource Limited believes the remuneration policy to be appropriate and effective in its
ability to attract and retain high-quality Key Management Personnel (KMP) to run and manage the
consolidated group, as well as create goal congruence between directors, executives and shareholders.
During the year, no Director of the Company has received or became entitled to receive a benefit by reason
of a contract made by the Company or a related corporation with the director or with a firm of which he is a
20

member, or with a company in which he has a substantial financial interest. For details of shares and options
issued to Directors during the current year, see elsewhere in this Remuneration Report.
Employment Details of Members of Key Management Personnel
The following table provides employment details of persons who were, during the financial year, members of
the Key Management Personnel (KMP) of the consolidated group. The table also illustrates the proportion of
remuneration that was performance and non-performance based.
The employment terms and conditions of all KMP are formalised in contracts of employment.
Changes in Executives Subsequent to year-end
There were no changes to executives subsequent to year end.
Remuneration Expense Details for the Year Ended 30 June 2018
Non-
performance
% of
Remuneratio
n
Non-salary
Cash-based
Incentives
Shares/Unit
s
Fixed
Salary/Fees
Dr E Gordon Executive Chairman
No Fixed Term. 1 month’s
notice required to terminate.
Entitled to 75% of of gross
salary
28% 0% 72%
Mr M Morgan Non-Executive Director
No Fixed Term. No notice to
terminate. Entitled to 0% of
gross fees
70% 0% 30%
Dr S Koslow Non-Executive Director
No Fixed Term. No notice to
terminate. Entitled to 0% of
gross fees
0% 0% 100%
Mr A Arora Non-Executive Director
No Fixed Term. No notice to
terminate. Entitled to 0% of
gross fees
0% 0% 0%
Mr L Gagnon CEO / Managing Director
No Fixed Term. 1 month
notice to terminate. Entitled
to 12 mos. of gross salary,
medical insurances and pro-
rata portion of annual bonus
0% 0% 100%
Mr M Mund COO
No fixed term. No notice
required to terminate.
Entitled to 6 months of gross
salary, medical insurances
and pro-rata portion of
annual bonus
0% 0% 100%
Mr E Vasilev Director of Finance & Operations
No fixed term. No notice
required to terminate.
Entitled to 6 months of gross
salary, medical insurances
and pro-rata portion of
annual bonus
0% 0% 100%
Group KMP
Position at 30 June 2018 /
Change during period
Contract Details (Duration
and Termination)
Performance % of
Remuneration (ex.
Options)
21

The following table of benefits and payments represents the components of the current year and comparative
year remuneration expenses for each member of KMP of the consolidated group. Such amounts have been
calculated in accordance with Australian Accounting Standards.
Table of Benefits and Payments for the Year Ended 30 June 2018
* Included in salaries, fees and leave for Mr E Gordon is a payment of $100,000 for unused annual leave, reduced
from an amount owing to him of $308,234. The $135,727 amount that has been recorded as a cash bonus paid
to Mr E Gordon was previously held on the statement of financial position in relation to unpaid salary for the period
from October 2012 to June 2016.
** Included for Mr M Morgan is a $127,463 fee for recapitalisation services, which was subsequently reinvested
in the December 2017 capital raising – refer to the next table for details
*** Included in short-term benefits for Mr D Segal in 2017 is $136,986 of unused annual leave, paid out upon
termination after 15 years of service.
**** Mr Koslow directors fees are $36,000 per annum. 2018 includes a catch-up payment from 2017.
*****Refer to Note 13(c) for information about how these options have been valued.
Securities Received that Are Not Performance-related
No members of KMP are entitled to receive securities that are not performance-based as part of their
remuneration package.
Cash Bonuses, Performance-related Bonuses and Share-based Payments.
The terms and conditions relating to options and bonuses granted as remuneration during the year to KMP
are as follows:
Post-
employment
Benefits
Equity-settled
Share-based
Payments
Salary, Fees &
Leave
Cash
Bonus
Pension &
Superannuation
Incentiv
e PlansLSL
Options/Right
s*****
2018* 388,735 135,727 12,894 - - - 537,356
2017 257,892 - 1,425 - - - 259,317
2018** 55,000 127,463 - - - 100,937 283,400
2017 30,000 - - - - 130 30,130
2018 45,464**** - - - - 141 45,605
2017 26,667 - - - - 130 26,797
Mr A Arora 2018 - - - - - - -
2018 208,350 - - - - 454,093 662,443
2017 - - - - - 137,845 137,845
Mr M Mund 2018 173,625 - - - - 238,496 412,121
2018 203,389 - - - - 95,549 298,938
2017 33,333 -- - - - - 33,333
D Segal 2017*** 217,720 - 20,683 - - - 238,403
2018 1,074,563 263,190 12,894 - - 889,216 2,239,863
2017 565,612 - 22,108 - - 138,105 725,825
Group KMP Total
Total KMP
Mr E Vasilev
Mr L Gagnon
Dr S Koslow
Mr M Morgan
Dr E Gordon
Short-term BenefitsLong –term
Benefits
Year
22

Note 1(a) Under the terms of the services agreement between Mr Matthew Morgan and the company,
he was entitled to be paid $US100,000 ($A127,463 – paid by way of issuance of 2,124,234
6 cent shares and 708,078 1 year options) and to be issued with 4,000,000 options (valued
at $127,182) upon completion of the recapitalisation of the company, which was achieved on
14 December 2017.
Note 1(b) Refer to the information in the table “Options and Rights Granted as Remuneration” for
information about Mr Gagnon’s option package.
Note 1(c) The options were issued under the terms of the Company's Employee and Director Share
Option Plan, as a key component of their remuneration in order to retain their services and to
provide incentive linked to the performance of the company.
All options were issued by Brain Resource Limited and entitle the holder to one ordinary share in Brain
Resource Limited for each option exercised.
There have not been alterations to the terms or conditions of any grants since grant date. Refer to the
following table for more information.
Group KMPRemuneration
Type
Grant
Date
Grant
Value
Reason for
Grant (Note 1)
% Vested
/ Paid
during
the Year
%
Forfeited
during
Year
%
Remainin
g
Unvested
Expiry
Date for
Vesting or
Payment
Range of
Possible
Values for
Future
Payments
Dr E GordonCash bonus &
Super14-Dec-17 $148,621 See prior table - - - - -
Shares &
Options14-Dec-17 $127,463 (a) 100% - - 14-Dec-18 -
Options 14-Dec-17 $127,182 (b) 50% - 50% 10-Jan-23 -
Dr S Koslow - - - - - - - - -
Mr A Arora - - - - - - - - -
Mr L Gagnon Options 22-May-17 $227,406 (b) 69% - 31% 22-May-22 -
Mr M Mund Options 16-Jul-17 $250,733 (c) 57% - 43% 16-Jul-22 -
Mr E Vasilev Options 17-May-17 $98,203 (c) 82% - 18% 17-May-22 -
Mr M Morgan
23

Options and Rights Granted as Remuneration
Note 1 The fair value of options granted as remuneration as shown in the above table has been
determined in accordance with Australian Accounting Standards and will be recognised as an
Grant Details Exercised Lapsed
Issue Date No.Value
(Note 1)# (Note 2) Value $ #
Dr E Gordon - - - - - - - -
Mr M Morgan 250,000 14/12/17* 4,000,000 $127,182 - - - 4,250,000
Dr S Koslow 249,500 - - - - - - 249,500
Mr A Arora - - ** - - - - - -
Mr L Gagnon 48,891,827 22/5/17*** 12,574,084 $227,406 - - - 61,465,911
Mr M Mund - 16/7/17**** 30,732,957 $250,733 - - - 30,732,957
Mr E Vasilev - 17/5/17**** 6,530,754 $98,203 - - - 6,530,754
Total 49,391,327 53,837,795 $703,524 - - - 103,229,122
Group KMPBalance at
Beginning of Year
Balance at
End of Year
Unvested
Exercisable UnexercisableTotal at
End of Year
Dr E Gordon - - - - -
Mr M Morgan 4,250,000 2,250,000 - 2,250,000 2,000,000
Dr S Koslow 249,500 249,500 - 249,500 -
Mr L Gagnon 61,465,911 42,643,941 - 42,643,941 18,821,970
Mr M Mund 30,732,957 17,366,479 - 17,366,479 13,366,477
Mr E Vasilev 6,530,754 5,353,836 - 5,353,836 1,176,917
Total 103,229,120 67,863,756 - 67,863,756 35,365,364
Group KMPBalance at
End of Year
VestedTotal at
End of Year
24

expense over the relevant vesting period to the extent that conditions necessary for vesting are
satisfied.
Note 2 All options exercised resulted in the issue of ordinary shares in Brain Resource Limited on a 1:1
basis. All persons exercising options paid the applicable exercise price.
* Under the terms of the services agreement between Mr Matthew Morgan and the company, he is entitled to be issued with 4,000,000 options upon completion of the recapitalisation of the company, which was achieved on 14 December 2017. 2,000,000 of the options will be fully vested on the date of issue, with 1,000,000 to vest 12 months after the issue date and a further 1,000,000 to vest 24 months after the date of issue, subject to Mr Morgan remaining engaged by the company. These options can be exercised for up to 4,000,000 shares in BRC and will have an exercise price of $0.10 and an exercise period of 5 years.
Other options terms are as specified in the Company’s ESOP rules, which were approved by shareholders at the EGM held on 14 July 2017.
These options were issued on 10 January 2018.
** Mr Arora has been offered 1,920,810 options under the Company’s Employee Share Option Plan. The options have a life of five years and vest over a 3-year period with 25% upfront, and the remaining 75% in equal increments of 25% over the following 3 years on each annual anniversary of the date of issue, subject to Mr Arora remaining engaged by the company. The Exercise prices of the options are as follows: Upfront: A$0.08, year 1: A$0.12, year 2: A$0.16, year 3: A$0.16. Options can only be issued to Directors if approved by shareholders, and this approval will be sought at the 2018 AGM.
*** Eligibility for the additional grant of options (in addition to the 5,000,000 granted on 22 May 2017) depended upon consummation of a recapitalisation of the company, with recapitalisation being defined as an equity financing of the company of an estimated amount of AUD $13,000,000 together with recapitalisation of the company’s existing convertible debt, with an anticipated closing date before 31 October 2017. Based on the assumption that the recapitalisation occurred at a capital raising price of $0.085 and a convertible bond conversion price of $0.085, Mr Gagnon would have been entitled to an additional 43,891,827 options as follows:
- 19,445,913 options with a strike price of $0.08 vesting at the recapitalisation date (Tranche 2);
- 8,148,638 options with a strike price of $0.12, vesting 12 months after grant date (being 22 May 2018) (Tranche 3);
- 8,148,638 options with a strike price of $0.16, vesting 24 months after grant date (being 22 May 2019) (Tranche 4);
- 8,148,638 options with a strike price of $0.16, vesting 36 months after grant date (being 22 May 2020) (Tranche 5).
Subject to meeting the various conditions above, and subject to the agreement whereby Mr Gagnon had agreed not to exercise until the earlier of a series of events (referred to above), Mr Gagnon may exercise vested options at any time prior to the fifth anniversary of 22 May 2017 but such exercise period shall be shortened to 90 days following separation.
Now the recapitalisation of the company has occurred, the number of options to be issued has been adjusted to reflect the finalised terms and conditions of the conversion of the convertible bond and the recapitalisation, such that the total number of options equals 8% of the fully diluted share capital of the company.
With the previously estimated number of options bracketed, Mr Gagnon was entitled to an additional 56,465,911 options as follows:
- 28,232,956 (previously 19,445,913) options with a strike price of $0.08 vesting at the recapitalisation date (Tranche 2);
25
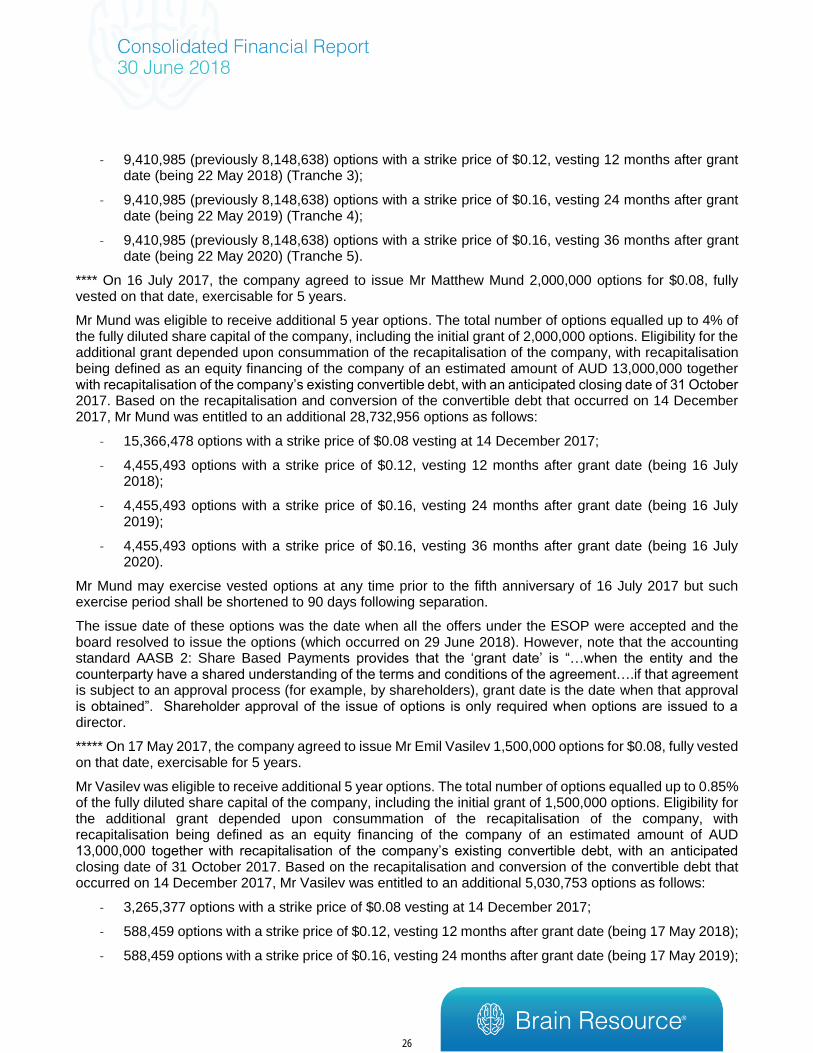
- 9,410,985 (previously 8,148,638) options with a strike price of $0.12, vesting 12 months after grant date (being 22 May 2018) (Tranche 3);
- 9,410,985 (previously 8,148,638) options with a strike price of $0.16, vesting 24 months after grant date (being 22 May 2019) (Tranche 4);
- 9,410,985 (previously 8,148,638) options with a strike price of $0.16, vesting 36 months after grant date (being 22 May 2020) (Tranche 5).
**** On 16 July 2017, the company agreed to issue Mr Matthew Mund 2,000,000 options for $0.08, fully vested on that date, exercisable for 5 years.
Mr Mund was eligible to receive additional 5 year options. The total number of options equalled up to 4% of the fully diluted share capital of the company, including the initial grant of 2,000,000 options. Eligibility for the additional grant depended upon consummation of the recapitalisation of the company, with recapitalisation being defined as an equity financing of the company of an estimated amount of AUD 13,000,000 together with recapitalisation of the company’s existing convertible debt, with an anticipated closing date of 31 October 2017. Based on the recapitalisation and conversion of the convertible debt that occurred on 14 December 2017, Mr Mund was entitled to an additional 28,732,956 options as follows:
- 15,366,478 options with a strike price of $0.08 vesting at 14 December 2017;
- 4,455,493 options with a strike price of $0.12, vesting 12 months after grant date (being 16 July 2018);
- 4,455,493 options with a strike price of $0.16, vesting 24 months after grant date (being 16 July 2019);
- 4,455,493 options with a strike price of $0.16, vesting 36 months after grant date (being 16 July 2020).
Mr Mund may exercise vested options at any time prior to the fifth anniversary of 16 July 2017 but such exercise period shall be shortened to 90 days following separation.
The issue date of these options was the date when all the offers under the ESOP were accepted and the board resolved to issue the options (which occurred on 29 June 2018). However, note that the accounting standard AASB 2: Share Based Payments provides that the ‘grant date’ is “…when the entity and the counterparty have a shared understanding of the terms and conditions of the agreement….if that agreement is subject to an approval process (for example, by shareholders), grant date is the date when that approval is obtained”. Shareholder approval of the issue of options is only required when options are issued to a director.
***** On 17 May 2017, the company agreed to issue Mr Emil Vasilev 1,500,000 options for $0.08, fully vested on that date, exercisable for 5 years.
Mr Vasilev was eligible to receive additional 5 year options. The total number of options equalled up to 0.85% of the fully diluted share capital of the company, including the initial grant of 1,500,000 options. Eligibility for the additional grant depended upon consummation of the recapitalisation of the company, with recapitalisation being defined as an equity financing of the company of an estimated amount of AUD 13,000,000 together with recapitalisation of the company’s existing convertible debt, with an anticipated closing date of 31 October 2017. Based on the recapitalisation and conversion of the convertible debt that occurred on 14 December 2017, Mr Vasilev was entitled to an additional 5,030,753 options as follows:
- 3,265,377 options with a strike price of $0.08 vesting at 14 December 2017;
- 588,459 options with a strike price of $0.12, vesting 12 months after grant date (being 17 May 2018);
- 588,459 options with a strike price of $0.16, vesting 24 months after grant date (being 17 May 2019);
26
- 588,459 options with a strike price of $0.16, vesting 36 months after grant date (being 17 May 2020).
Mr Vasilev may exercise vested options at any time prior to the fifth anniversary of 17 May 2017 but such exercise period shall be shortened to 90 days following separation.
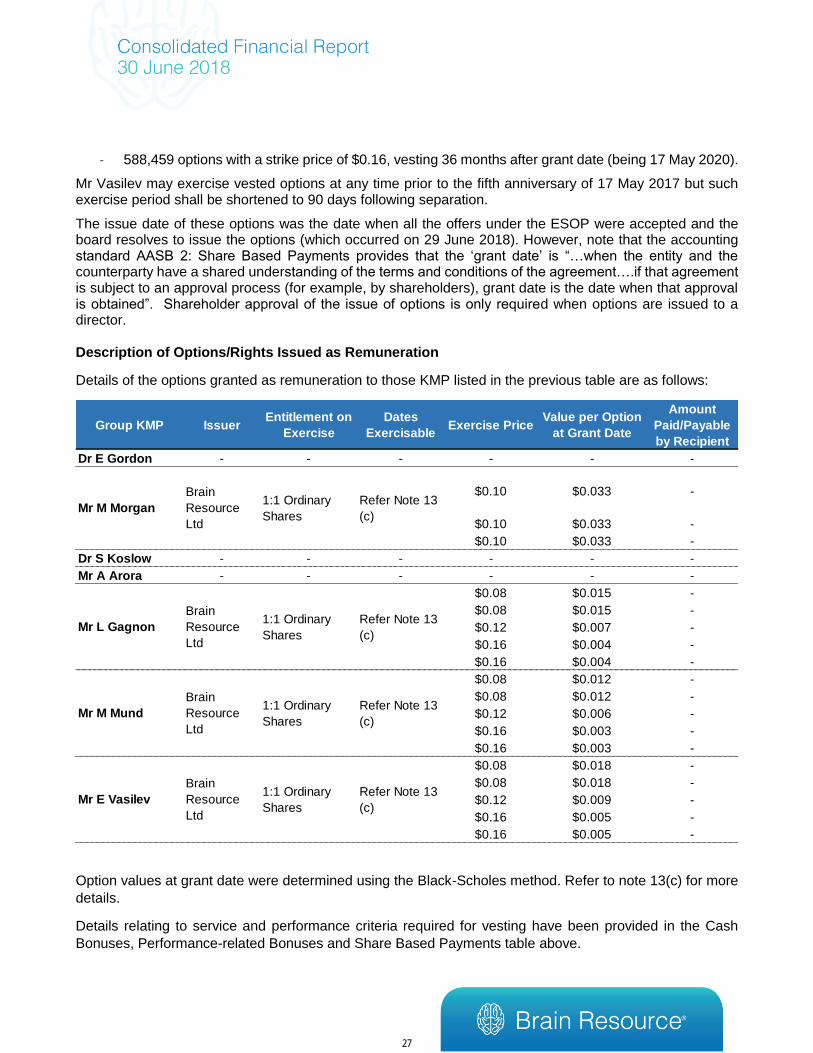
The issue date of these options was the date when all the offers under the ESOP were accepted and the board resolves to issue the options (which occurred on 29 June 2018). However, note that the accounting standard AASB 2: Share Based Payments provides that the ‘grant date’ is “…when the entity and the counterparty have a shared understanding of the terms and conditions of the agreement….if that agreement is subject to an approval process (for example, by shareholders), grant date is the date when that approval is obtained”. Shareholder approval of the issue of options is only required when options are issued to a director. Description of Options/Rights Issued as Remuneration
Details of the options granted as remuneration to those KMP listed in the previous table are as follows:
Option values at grant date were determined using the Black-Scholes method. Refer to note 13(c) for more
details.
Details relating to service and performance criteria required for vesting have been provided in the Cash
Bonuses, Performance-related Bonuses and Share Based Payments table above.
Group KMP IssuerEntitlement on
Exercise
Dates
ExercisableExercise Price
Value per Option
at Grant Date
Amount
Paid/Payable
by Recipient
Dr E Gordon - - - - - -
$0.10 $0.033 -
$0.10 $0.033 -
$0.10 $0.033 -
Dr S Koslow - - - - - -
Mr A Arora - - - - - -
$0.08 $0.015 -
$0.08 $0.015 -
$0.12 $0.007 -
$0.16 $0.004 -
$0.16 $0.004 -
$0.08 $0.012 -
$0.08 $0.012 -
$0.12 $0.006 -
$0.16 $0.003 -
$0.16 $0.003 -
$0.08 $0.018 -
$0.08 $0.018 -
$0.12 $0.009 -
$0.16 $0.005 -
$0.16 $0.005 -
Mr E Vasilev
Brain
Resource
Ltd
1:1 Ordinary
Shares
Refer Note 13
(c)
Mr L Gagnon
Brain
Resource
Ltd
1:1 Ordinary
Shares
Refer Note 13
(c)
Mr M Mund
Brain
Resource
Ltd
1:1 Ordinary
Shares
Refer Note 13
(c)
Mr M Morgan
Brain
Resource
Ltd
1:1 Ordinary
Shares
Refer Note 13
(c)
27

Other Equity-related KMP Transactions
There have been no other transactions involving equity instruments apart from those described in the tables
above relating to options, rights and shareholdings.
Other Transactions with KMP and/or their Related Parties
There were no other transactions conducted between the Group and KMP or their related parties, apart from
those disclosed above relating to equity, compensation and loans, that were conducted other than in
accordance with normal employee, customer or supplier relationships on terms no more favourable than
those reasonably expected under arm’s length dealings with unrelated persons, other than those noted at
Note 17.
Value of Directors’ options awarded, exercised and lapsed during the year: refer tables above
Directors’ Shareholdings and Options as at 30 June:
*Refer to the notes of the previous table, 5,000,000 options issued, 48,891,827 granted
Shares held by Directors include those held by the Directors and their director-related entities. All shares and
options, excluding those under Employee Share Option Scheme, were issued or granted on terms no more
favourable than to other shareholders or option holders. All changes from 2017 to 2018 were due to additions.
End of Remuneration Report (Audited)
MEETINGS OF DIRECTORS
The following table sets out the number of Directors’ meetings and Committee meetings held during the
financial year, and the number of meetings attended by each Director (while they were a Director):
Ordinary Shares Fully PaidOptions over Ordinary
Shares
2018 2017 2018 2017
E Gordon 13,018,749 12,206,248 - -
M Morgan 3,417,152 187,310 5,138,889 250,000
S Koslow 94,250 94,250 249,500 249,500
L Gagnon (appointed on 27 Dec 17) 4,159,225 - 62,173,987 5,000,000*
A Arora (appointed on 8 May 18) - - - -
D Segal (resigned 13 Oct 2016) N/A 6,534,264 N/A -
Total 20,689,376 19,022,072 67,562,376 5,499,500
Name
28

The Audit Committee reviews the Company's financial systems, accounting policies, half-year and annual
financial statements.
EMPLOYEES
There were 24 full time equivalent employees (2017:17) working for the consolidated entity during the year,
being a mixture of full time staff, permanent part time and casuals with 17 (2017:7) based in the United
States. There were around 29 full time equivalent employees at year end.
INDEMNIFICATION AND INSURANCE OF DIRECTORS AND OFFICERS
The Company has paid a premium in respect of a contract insuring all the Directors against a liability incurred
as an officer for certain costs or expenses to defend legal proceedings. The insurance contract prohibits the
disclosure of the total amount of the premiums and a summary of the nature of the liabilities. The Company
has not otherwise, either during or since the end of the financial year, indemnified or agreed to indemnify an
officer of the Company or any related body corporate against a liability incurred as such an officer.
INDEMNIFICATION OF AUDITORS
To the extent permitted by law, the Company has agreed to indemnify its auditors, Grant Thornton, as part
of the terms of its audit engagement agreement against claims by third parties arising from the audit (for an
unspecified amount). No payment has been made to indemnify Grant Thornton during or since the financial
year.
ENVIRONMENTAL REGULATION AND PERFORMANCE
The Company is not aware of any specific requirements, as issued by the relevant environmental protection
authorities, with which it has to comply.
CORPORATE GOVERNANCE
The Group’s Corporate Governance Statement and ASX Appendix 4G are released to the ASX on the same
day the Annual Report is released. The Corporate Governance Statement and Corporate Governance
Compliance Manual can be found on the Company’s website at http://www.brainresource.com/investors.html
NON-AUDIT SERVICES
The following non-audit services were provided by the entity’s auditor, Grant Thornton. The directors are
satisfied that the provision of non-audit services is compatible with the general standard of independence for
auditors imposed by the Corporations Act 2001. The nature and scope of each type of non-audit service
provided means that auditor independence was not compromised.
Grant Thornton received or are due to receive the following amounts for the provision of non-audit services:
Name Board MeetingAudit Committee
Meeting
Remuneration
Committee Meeting
# Meetings held 4 2 -
Evian Gordon 4 2 -
Stephen Koslow 4 - -
Matthew Morgan 4 2 -
Louis Gagnon 2 - -
Ajay Arora - - -
29

Independent Experts Report
AUDITOR INDEPENDENCE
The Directors have received a declaration of independence from the auditor, which is included on page
79.
Signed in Sydney on 28 September 2018 in accordance with a resolution of the Directors.
Dr Evian Gordon
Chairman of Directors
$35,000
30
31

Consolidated Statement of Comprehensive Income
Consolidated
Year ended 30 June Note 2018 2017
REVENUE AND OTHER INCOME 2 2,615,787 2,411,561
Cost of equipment and third party drug trial expense 3 (122,207) (171,437)
Depreciation and amortisation 3 (90,650) (514,711)
Insurance and professional fees (1,188,791) (492,324)
Rent, supplies and office costs (286,609) (261,747)
Salaries and consultancy fees (3,626,641) (2,567,940)
Marketing and agent support (274,468) (159,731)
Communications (399,773) (267,244)
Travel (236,458) (131,992)
Foreign exchange (losses)/ gains 3 (14,855) (50,139)
Share based payments 13(c) (1,206,097) (106,281)
Finance costs (523,353) (990,949)
Share of loss of joint venture (42,238) (103,104)
Loss on conversion of Convertible Bond 28 (3,166,358) -
Issue of Options on conversion of Convertible Bond 28 (1,660,510) -
Impairment of goodwill / intangible assets 3 (13,568,240) (6,762,465)
Other (156,219) (114,234)
TOTAL EXPENSES (26,563,467) (12,694,298)
LOSS BEFORE INCOME TAX (23,947,680) (10,282,737)
Income tax benefit / (expense) 4 846,340 413,783
LOSS AFTER INCOME TAX 14 (23,101,340) (9,868,954)
Other Comprehensive Income - -
Items that may be reclassified subsequently to profit and loss
when specific conditions are met:
Exchange differences on translating foreign operation, net of tax 395,053 -
TOTAL COMPREHENSIVE LOSS ATTRIBUTABLE TO
MEMBERS OF BRAIN RESOURCE LIMITED(22,706,287) (9,868,954)
Basic loss per share (cents per share) 15 (6.38) (6.45)
Diluted loss per share (cents per share) 15 (6.38) (6.45)
32

Year ended 30 June
Note 2018 2017
CURRENT ASSETS
Cash and cash equivalents 21 6,615,972 1,570,197
Trade and other receivables 6 1,317,206 473,189
Inventories 7 - -
Other current assets 10 28,783 25,620
TOTAL CURRENT ASSETS 7,961,961 2,069,006
NON-CURRENT ASSETS
Plant and equipment 8 221,636 167,856
Intangible assets 9 14,659,278 22,420,786
Investment in joint venture 29 - 1,270,462
Other non-current assets 10 11,800 14,766
Deferred tax assets 4 - -
TOTAL NON-CURRENT ASSETS 14,892,714 23,873,870
TOTAL ASSETS 22,854,675 25,942,876
CURRENT LIABILITIES
Payables 11 489,476 688,657
Interest-bearing loans 31 - 712,968
Employee benefits 12 488,495 698,914
TOTAL CURRENT LIABILITIES 977,971 2,100,539
NON-CURRENT LIABILITIES
Convertible Bond 28 - 7,566,701
Employee benefits 12 29,884 17,089
Deferred tax liabilities 4 65,165 911,506
TOTAL NON-CURRENT LIABILITIES 95,049 8,495,296
TOTAL LIABILITIES 1,073,020 10,595,835
NET ASSETS 21,781,655 15,347,041
EQUITY
Contributed equity 13 58,080,521 37,516,453
Accumulated losses 14 (40,197,025) (22,834,351)
Reserves 14 3,898,159 664,939
TOTAL EQUITY 21,781,655 15,347,041
Consolidated Statement of Financial Position
Consolidated
33

Year ended 30 June
Note 2018 2017
CASH FLOWS FROM OPERATIONS
Receipts from customers 2,276,786 2,419,341
Payments to suppliers and employees (6,630,416) (4,687,074)
R&D tax incentive 466,929 723,169
Interest received 8,155 10,369
NET CASH FLOWS USED IN OPERATING ACTIVITIES 21 (3,878,546) (1,534,195)
CASH FLOWS FROM INVESTING ACTIVITIES
Purchases of plant and equipment (94,303) (4,753)
Payment for intangible assets (1,646,395) (708,486)
Cash acquired in acquisition of subsidiary 30 18,154 -
Loans made to related parties (102,553) -
NET CASH FLOWS USED IN INVESTING ACTIVITIES (1,825,097) (713,239)
CASH FLOWS FROM FINANCING ACTIVITIES
Net proceeds from issue of ordinary shares 10,460,567 1,288,785
Repayments of borrowings to joint venture (84,496) (209,378)
NET CASH FLOWS PROVIDED BY FINANCING ACTIVITIES 10,376,071 1,079,407
Net decrease in cash & cash equivalents held 4,672,428 (1,168,027)
Add opening cash & cash equivalents brought forward 1,570,197 2,790,014
Exchange rate adjustments 373,347 (51,790)
CLOSING CASH & CASH EQUIVALENTS CARRIED
FORWARD21 6,615,972 1,570,197
Consolidated Statement of Cash Flows
Consolidated
34
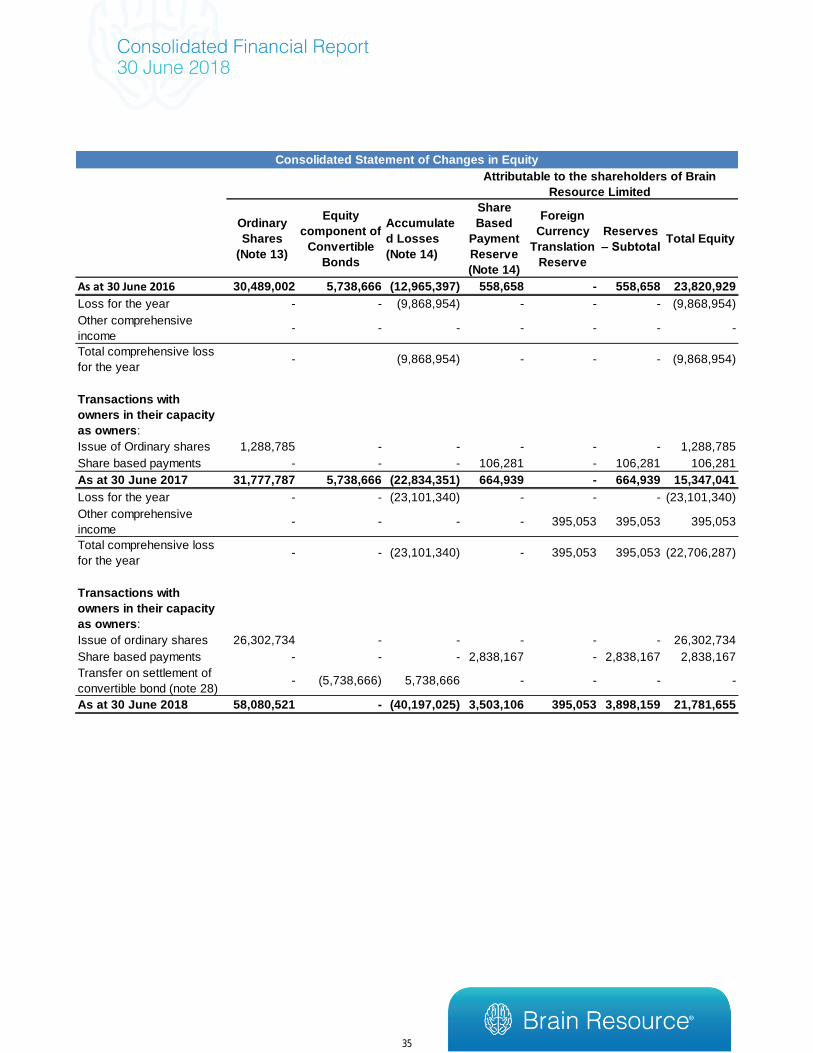
Ordinary
Shares
(Note 13)
Equity
component of
Convertible
Bonds
Accumulate
d Losses
(Note 14)
Share
Based
Payment
Reserve
(Note 14)
Foreign
Currency
Translation
Reserve
Reserves
– SubtotalTotal Equity
As at 30 June 2016 30,489,002 5,738,666 (12,965,397) 558,658 - 558,658 23,820,929
Loss for the year - - (9,868,954) - - - (9,868,954)
Other comprehensive
income- - - - - - -
Total comprehensive loss
for the year- (9,868,954) - - - (9,868,954)
Transactions with
owners in their capacity
as owners:
Issue of Ordinary shares 1,288,785 - - - - - 1,288,785
Share based payments - - - 106,281 - 106,281 106,281
As at 30 June 2017 31,777,787 5,738,666 (22,834,351) 664,939 - 664,939 15,347,041
Loss for the year - - (23,101,340) - - - (23,101,340)
Other comprehensive
income- - - - 395,053 395,053 395,053
Total comprehensive loss
for the year- - (23,101,340) - 395,053 395,053 (22,706,287)
Transactions with
owners in their capacity
as owners:
Issue of ordinary shares 26,302,734 - - - - - 26,302,734
Share based payments - - - 2,838,167 - 2,838,167 2,838,167
Transfer on settlement of
convertible bond (note 28)- (5,738,666) 5,738,666 - - - -
As at 30 June 2018 58,080,521 - (40,197,025) 3,503,106 395,053 3,898,159 21,781,655
Attributable to the shareholders of Brain
Resource Limited
Consolidated Statement of Changes in Equity
35
Notes to Consolidated Financial Statements
1. SUMMARY OF SIGNIFICANT ACCOUNTING POLICIES
The financial report of Brain Resource Limited (the Company) for the year ended 30 June 2018 was
authorised for issue in accordance with a resolution of the directors on 28 September 2018. Brain Resource
Limited (the parent) is a for-profit company limited by shares incorporated in Australia whose shares are
publicly traded on the Australian Stock Exchange. The nature of the operations and principal activities of
Brain Resource Limited and its subsidiaries (the Group) are described in the Directors' Report.
(a) Basis of preparation
The financial report is a general-purpose financial report, prepared in accordance with the requirements of
the Corporations Act 2001, Australian Accounting Standards and other authoritative pronouncements of the
Australian Accounting Standards Board (AASB). The financial report has also been prepared on a historical
cost basis, with the exception of share-based payments which are recorded at fair value.
The financial report is presented in Australian dollars.
New Accounting Standards and Interpretations
The Group has adopted all of the new and revised Standards and Interpretations issued by the AASB that
are relevant to its operations and effective for the current reporting period.
Adoption of these Standards and Interpretations did not have any effect on the financial position or
performance of the Group.
New Accounting Standards and Interpretations not yet mandatory or early adopted
Australian Accounting Standards and Interpretations that have recently been issued or amended but are not
yet mandatory, have not been early adopted by the group for the annual reporting period ended 30 June
2018. The group's assessment of the impact of these new or amended Accounting Standards and
Interpretations, most relevant to the group, are set out below.
AASB 9 Financial Instruments
This standard is applicable to annual reporting periods beginning on or after 1 January 2018. The standard
replaces all previous versions of AASB 9 and completes the project to replace IAS 39 'Financial Instruments:
Recognition and Measurement'. AASB 9 introduces new classification and measurement models for financial
assets. A financial asset shall be measured at amortised cost, if it is held within a business model whose
objective is to hold assets in order to collect contractual cash flows, which arise on specified dates and solely
principal and interest. All other financial instrument assets are to be classified and measured at fair value
through profit or loss unless the entity makes an irrevocable election on initial recognition to present gains
and losses on equity instruments (that are not held-for-trading) in other comprehensive income ('OCI'). For
financial liabilities, designated at fair value through profit or loss, the standard requires the portion of the
change in fair value that relates to the entity's own credit risk to be presented in OCI (unless it would create
an accounting mismatch). New simpler hedge accounting requirements are intended to more closely align
the accounting treatment with the risk management activities of the entity. New impairment requirements will
use an 'expected credit loss' ('ECL') model to recognise an allowance. Impairment will be measured under a
12-month ECL method unless the credit risk on a financial instrument has increased significantly since initial
recognition in which case the lifetime ECL method is adopted. The standard introduces additional new
disclosures. The group will adopt this standard from 1 July 2018, and the adoption of this standard is not
expected to significantly impact the financial statements on the basis that the main financial assets
recognised represent cash and cash equivalent and trade receivables that do not carry a significant financing
36

Note 1. Significant accounting policies (continued)
component and involve a single cash flow representing the repayment of principal, which in the case of trade
receivables is the transaction price. Both asset classes will continue to be measured at face value. Other
financial asset classes are not material to the group. Financial liabilities of the group are not impacted as the
group does not carry them at fair value.
AASB 15 Revenue from Contracts with Customers
This standard is applicable to annual reporting periods beginning on or after 1 January 2018. The standard
provides a single standard for revenue recognition. The core principle of the standard is that an entity will
recognise revenue to depict the transfer of promised goods or services to customers in an amount that
reflects the consideration to which the entity expects to be entitled in exchange for those goods or services.
Commonly referred to as the 5-step approach, the standard requires:
(i) identification of contracts (either written, verbal or implied) with a customer;
(ii) identification of the separate performance obligations within the contract;
(iii) determination of the transaction price adjusted for the time value of money excluding credit risk;
(iv) allocation of the transaction price to the separate performance obligations on a basis of relative
stand-alone selling price of each distinct good or service, or estimation approach if no distinct
observable prices exist; and
(iv) recognition of revenue when each performance obligation is satisfied.
Credit risk will be presented separately as an expense rather than adjusted to revenue. Under AASB15, an
entity recognises revenue when (or as) a performance obligation is satisfied, i.e. when 'control' of the goods
or services underlying the particular performance obligation is transferred to the customer. Contracts with
customers will be presented in an entity's statement of financial position as a contract liability, a contract
asset, or a receivable, depending on the relationship between the entity's performance and the customer's
payment. Sufficient quantitative and qualitative disclosure is required to enable users to understand the
contracts with customers; the significant judgements made in applying the guidance to those contracts; and
any assets recognised from the costs to obtain or fulfil a contract with a customer.
The group derives its revenue primarily from ‘software-as-a-service’ subscriptions, where customers
subscribe to access the platform, content, database and associated support services. Under the current
revenue recognition standard AASB 118 'Revenue', software-as-a-service revenue is recognised over the
service period.
The group will adopt this standard from 1 July 2018 and management's assessment of the new standard is
as follows:
37

Note 1. Significant accounting policies (continued)
Revenue stream Assessment
Software-as-a-Service
Value-added services
The focus of management’s assessment was to first to evaluate its standard
subscription and support services against each of the 5-steps noted above, with
regards to any other specific guidance in the standard. Secondly, management
has additionally assessed any unique performance obligations and/or pricing
arrangements within its material contracts to determine the appropriate
treatment for these.
Management’s assessment was to evaluate the revenue stream against the 5-
steps noted above, with a focus on the specific performance obligations to
determine the appropriate treatment under the standard.
Management have completed their evaluation of the group's material contracts against the 5-step approach
noted above, and based on this evaluation have determined that, other than additional disclosures required,
the implementation of AASB 15 from 1 July 2018 is not expected to have a significant financial impact on the
group.
AASB 16 Leases
This standard is applicable to annual reporting periods beginning on or after 1 January 2019. The standard
replaces AASB 117 'Leases' and for lessees will eliminate the classifications of operating leases and finance
leases. Subject to exceptions, a lease liability will be capitalised in the statement of financial position,
measured as the present value of the unavoidable future lease payments to be made over the lease term.
The exceptions relate to short-term leases of 12 months or less and leases of low-value assets (such as
personal computers and small office furniture) where an accounting policy choice exists whereby either a
'right-of-use' asset is recognised or lease payments are expensed to profit or loss as incurred. A
'right of use' asset corresponding to the lease liability will also be recognised, adjusted for lease prepayments,
lease incentives received, initial direct costs incurred and an estimate of any future restoration, removal or
dismantling costs. Straight-line operating lease expense recognition will be replaced with a depreciation
charge for the leased asset (included in operating costs) and an interest expense on the recognised lease
liability (included in finance costs). In the earlier periods of the lease, the expenses associated with the lease
under AASB 16 will be higher when compared to lease expenses under AASB 117. However EBITDA
(Earnings Before Interest, Tax, Depreciation and Amortisation) results will be improved as the operating
expense is replaced by interest expense and depreciation in profit or loss under AASB 16. For classification
within the statement of cash flows, the lease payments will be separated into both a principal (financing
activities) and interest (either operating or financing activities) component. For lessor accounting, the
standard does not substantially change how a lessor accounts for leases. The group will adopt this standard
from 1 July 2019. Information on the undiscounted amount of the group’s operating lease commitments under
AASB 117, the current leasing standard, is disclosed in note 30. The group is considering the available
options for transition. To date, work has focused on the identification of the provisions of the standard which
will most impact the group. Management will subsequently carry out a detailed review of the contracts to
assess the financial reporting impacts.
38
Note 1. Significant accounting policies (continued)
(b) Statement of compliance
This financial report complies with Australian Accounting Standards as issued by the Australian Accounting
Standards Board. This financial report also complies with the International Financial Reporting Standards
(IFRS) as issued by the International Accounting Standards Board.
(c) Significant accounting judgements, estimates and assumptions
The carrying amounts of certain assets and liabilities are often determined based on estimates and
assumptions of future events. The key estimates and assumptions that have a significant risk of causing a
material adjustment to the carrying amounts of certain assets and liabilities within the next annual reporting
period are:
(i) Research & development costs – development costs are only capitalised by the Group when the
feasibility of completing the intangible asset is valid and likely to result in a saleable asset.
(ii) Impairment of intangible assets - the Group determines whether indefinite life intangibles are impaired
at least on an annual basis and where impairment indicators are present for finite life intangibles. The
assumptions used in the estimation of recoverable amount and the carrying amount of intangibles is
discussed in Note 9.
(iii) Share-based payment transactions - the Group measures the cost of equity-settled transactions with
employees by reference to the fair value of the equity instruments at the date at which they are granted.
The fair value is determined using a Black Scholes model, using the assumptions detailed in Note
13(c).
(iv) Deferred tax assets – deferred tax assets are recognised for deductible temporary differences as
management considers that it is probable that future taxable profits will be available to utilise those
temporary differences.
(v) Taxation - The Group's accounting policy for taxation requires management's judgement as to the
types of arrangements considered to be a tax on income in contrast to an operating cost. Judgement
is also required in assessing whether deferred tax assets and certain deferred tax liabilities are
recognised on the statement of financial position. Deferred tax assets, including those arising from
unrecouped tax losses, capital losses and temporary differences, are recognised only where it is
considered more likely than not that they will be recovered, which is dependent on the generation of
sufficient future taxable profits. Assumptions about the generation of future taxable profits and
repatriation of retained earnings depend on management's estimates of future cash flows. Judgements
are also required about the application of income tax legislation. These judgements and assumptions
are subject to risk and uncertainty, hence there is a possibility that changes in circumstances will alter
expectations, which may impact the amount of deferred tax assets and deferred tax liabilities
recognised on the statement of financial position and the amount of other tax losses and temporary
differences not yet recognised. In such circumstances, some or all of the carrying amounts of
recognised deferred tax assets and liabilities may require adjustment, resulting in a corresponding
credit or charge to the statement of comprehensive income.
(vi) Estimation of useful lives of assets - The estimation of the useful lives of assets has been based on
historical experience and judgement. In addition, the condition of the assets is assessed at least once
per year and considered against the remaining useful life. Adjustments to useful lives are made when
considered necessary.
(vii) Fair value of convertible bonds – The interest rate used to determine the fair value of the convertible
bond is based on the interest rate for a fixed loan with similar characteristics to the convertible bond.
39
(d) Summary of significant accounting policies
(i) Basis of consolidation
The consolidated financial statements comprise the financial statements of the Group as at and for the year
ended 30 June each year.
The Group is exposed, or has rights, to variable returns from its involvement with the subsidiaries and has
the ability to affect those returns through its power over the subsidiaries. The existence and effect of potential
voting rights that are currently exercisable or convertible are considered when assessing whether a group
controls another entity.
The financial statements of the subsidiaries are prepared for the same reporting period as the parent
company, using consistent accounting policies. In preparing the consolidated financial statements, all
intercompany balances, transactions, unrealised gains and losses resulting from intra-group transactions
and dividends have been eliminated in full.
Subsidiaries are fully consolidated from the date on which control is obtained by the Group and cease to be
consolidated from the date on which control is transferred out of the Group.
Investments in subsidiaries held by Brain Resource Limited are accounted for at cost in the separate financial
statements of the parent entity less any impairment charges. Dividends received from subsidiaries are
recorded as a component of other revenues in the separate statement of profit or loss and other
comprehensive income of the parent entity, and do not impact the recorded cost of the investment. Upon
receipt of dividend payments from subsidiaries, the parent will assess whether any indicators of impairment
of the carrying value of the investment in the subsidiary exist. Where such indicators exist, to the extent that
the carrying value of the investment exceeds its recoverable amount, an impairment loss is recognised.
(ii) Foreign currency translation
The Group’s consolidated financial statement are presented in Australian dollars, which is also the parent
company’s functional currency. For each entity, the Group determines the functional currency and items
included in the financial statements of each entity are measured using that functional currency.
The functional currency of Brain Resource Inc., a subsidiary of the ultimate parent company, Brain Resource
Limited, was changed from Australian dollars to US dollars, prospectively from 1 July 2017. The functional
currency was changed coinciding with the appointment of an all-US based management team.
The Group used the direct method of consolidation and on disposal of a foreign operation, the gain or loss
that is reclassified to profit or loss reflects the amount that arises from using this method.
Transactions and balances
Transactions in foreign currencies are initially recorded by the Group’s entities at their respective functional
currency spot rates at the date the transaction first qualifies for recognition.
Monetary assets and liabilities denominated in foreign currencies are translated at the functional currency
spot rates of exchange at the reporting date.
Differences arising on settlement or translation of monetary items are recognised in profit or loss.
Non-monetary items that are measured in terms of historical cost in a foreign currency are translated using
the exchange rates at the dates of the initial transactions. Non-monetary items measured at fair value in a
foreign currency are translated using the exchange rates at the date when the fair value is determined. The
gain or loss arising on translation of non-monetary items measured at fair value is treated in line with the
recognition of the gain or loss on the change in fair value of the item (i.e., translation differences on items
40

whose fair value gain or loss is recognised in OCI or profit or loss are also recognised in OCI or profit or loss,
respectively).
Group companies
On consolidation, the assets and liabilities of foreign operations are translated into Australian dollars at the
rate of exchange prevailing at the reporting date and their statements of profit or loss are translated at an
average exchange rate across the period. The exchange differences arising on translation for consolidation
are recognised in OCI. On disposal of a foreign operation, the component of OCI relating to that particular
foreign operation is reclassified to profit or loss.
Any goodwill arising on the acquisition of a foreign operation and any fair value adjustments to the carrying
amounts of assets and liabilities arising on the acquisition are treated as assets and liabilities of the foreign
operation and translated at the spot rate of exchange at the reporting date.
(iii) Cash and cash equivalents
Cash and short-term deposits in the statement of financial position comprise cash on bank and in hand and
short-term deposits with an original maturity of three months or less. For the purposes of the Statement of
Cash Flows, cash and cash equivalents consist of cash and cash equivalents as defined above, net of outstanding
bank overdrafts.
(iv) Trade and other receivables
Trade receivables, which generally have 30 – 60 day terms, are recognised and carried at original invoice
amount less an allowance for any uncollectible amounts. An estimate for doubtful debts is made when
collection of the full amount is no longer probable. Bad debts are written off when identified. The government
grant receivable for R&D tax incentives is recognised to the degree that the Group can reliably estimate that
R&D expenditure for the full year will fall within the eligibility requirements. Advances in Other receivables
are provided as an advance contractual payment generally covering the payable expected to accrue over a
60-90 day period. Trade and other receivables with maturity greater than 12 months after reporting date are
classified as non-current.
(v) Inventories
Inventories are valued at the lower of cost and net realisable value.
(vi) Plant and equipment
Plant and equipment is included at cost. Depreciation is provided on a diminishing value basis on all plant
and equipment at rates calculated to write off the cost, less estimated residual value at the end of the useful
lives of the assets, over those estimated useful lives. The majority of the assets, comprising primarily
computer equipment and software, are being depreciated over a three to ten year period. Refer to Note 1d
(viii) for recoverability of assets.
Gains and losses on disposals are determined by comparing proceeds with the carrying amount. These are
included in the statement of comprehensive income.
An item of property, plant and equipment is derecognised upon disposal or when no further future economic
benefits are expected from its use or disposal.
(vii) Intangible assets
Intangible assets are capitalised at cost. The useful lives of intangible assets are assessed to be either finite
or indefinite. Where amortisation is charged on assets with finite lives, this expense is taken to the statement
of profit or loss and other comprehensive income. Useful lives are also examined on an annual basis and
adjustments, where applicable, are made on a prospective basis.
41

Intangible assets with indefinite lives or assets not yet available for use are tested annually for impairment,
either individually or at the cash generating unit level. Finite life assets are tested where indicators of
impairment exist. Research costs are charged against profits in the period in which the expenditure is
incurred. Development costs are capitalised in the period in which the expenditure is incurred where the
future benefits are expected to at least equal these costs.
The Brain Resource International Database and associated analysis tools (‘BRID’) is treated as a single
integrated asset for presentation and impairment testing. Amortisation of components of BRID that are ready
for use are calculated on a straight line basis over 7 years, with the remaining amortisation period being 6.5
years.
(viii) Recoverable amount of assets
At each reporting date, the Group assesses whether there is any indication that an asset may be impaired.
Where an indicator of impairment exists, the Group makes a formal estimate of recoverable amount. Where
the carrying amount of an asset exceeds its recoverable amount the asset is considered impaired and is
written down to its recoverable amount. Recoverable amount is the greater of fair value less costs of disposal
and value in use. It is determined for an individual asset, unless the asset’s value in use cannot be estimated
to be close to its fair value less costs of disposal and does not generate cash inflows that are largely
independent of those from other assets or groups of assets, in which case, the recoverable amount is
determined for the cash-generating unit to which the asset belongs. In assessing value in use, the estimated
future cash flows are discounted to their present value using a pre-tax discount rate that reflects current
market assessments of the time value of money and the risks specific to the asset.
Fair value is determined by the directors based on an assessment of the price that would be received to sell
the BRID in an orderly transaction between market participants at the measurement date. This assessment
has used a categorisation of data types, including the number of datasets within each data type in the BRID.
It also takes into account prices to set up data analysis platforms as well as prices for data acquisition, which
includes subject recruitment and other costs to acquire the relevant data.
(ix) Trade and other payables
Trade and other payables are carried at amortised costs and represent liabilities for goods and services
provided to the Group prior to the end of the financial year that are unpaid and arise when the Group becomes
obliged to make future payments in respect of the purchase of these goods and services.
(x) Provisions
Provisions are recognised when the Group has a present obligation (legal or constructive) as a result of a
past event, it is probable that an outflow of resources embodying economic benefits will be required to settle
the obligation and a reliable estimate can be made of the amount of the obligation.
(xi) Revenue recognition
Revenue is recognised to the extent that it is probable that the economic benefits will flow to the Group and
the revenue can be reliably measured.
a) Treatment prediction research is typically contract based, with payments to Brain Resource tied to
achieving agreed milestones, and do not necessarily lead to the creation of new intellectual property
owned by Brain Resource. Milestones can include equipment set-up and completing testing on a
selected number of subjects. Revenues are only recognised where the milestones have been met or
where the stage of completion can be reliably measured. Accordingly, where payments are received in
advance, this is recorded as unearned income until such time as the work to which the payment relates
has been completed.
b) Revenues from all other sources are recognised at the time of delivery.
(xii) Share-based payment transactions
42

The Group provides benefits to employees (including directors) of the Group in the form of share-based
payment transactions, whereby employees render services in exchange for shares or rights over shares
(‘equity-settled transactions’). There is currently an Employee Share Option Plan (ESOP) in place which
provides benefits to all employees, including senior executives and directors. The cost of these equity-settled
transactions with employees is measured by reference to the fair value at the date at which they are granted.
In valuing equity-settled transactions, no account is taken of any vesting conditions, other than conditions
linked to the price of the shares of Brain Resource (‘market conditions’). The cost of equity-settled
transactions is recognised, together with a corresponding increase in equity, over the period in which the
performance conditions are fulfilled, ending on the date on which the relevant employees become fully
entitled to the award (‘vesting date’).
The cumulative expense recognised for equity-settled transactions at each reporting date until vesting date
reflects (i) the extent to which the vesting period has expired and (ii) the number of awards that, in the opinion
of the directors of the Group, will ultimately vest. This opinion is formed based on the best available
information at balance date. No adjustment is made for the likelihood of market performance conditions being
met as the effect of these conditions is included in the determination of fair value at grant date.
No expense is recognised for awards that do not ultimately vest, except for awards where vesting is
conditional upon a market condition. Where the terms of an equity-settled award are modified, as a minimum
an expense is recognised as if the terms had not been modified. In addition, an expense is recognised for
any increase in the value of the transaction as a result of the modification, as measured at the date of
modification. Where an equity-settled award is cancelled, it is treated as if it had vested on the date of
cancellation, and any expense not yet recognised for the award is recognised immediately. However, if a
new award is substituted for the cancelled award, and designated as a replacement award on the date that
it is granted, the cancelled and new award are treated as if they were a modification of the original award, as
described above. The dilutive effect, if any, of outstanding options is reflected as additional share dilution in
the computation of earnings per share.
(xiii) Income tax
Current tax assets and liabilities for the current period are measured at the amount expected to be recovered
from or paid to the taxation authorities based on the current period's taxable income.
Deferred income tax liabilities are recognised for all taxable temporary differences except: when the taxable
temporary difference is associated with investments in subsidiaries, associates or interests in joint ventures,
and the timing of the reversal of the temporary difference can be controlled and it is probable that the
temporary difference will not reverse in the foreseeable future.
Deferred income tax assets are recognised for all deductible temporary differences, carry-forward of unused
tax assets and unused tax losses, to the extent that it is probable that taxable profit will be available against
which the deductible temporary differences, and the carry-forward of unused tax assets and unused tax
losses can be utilised.
The carrying amount of deferred income tax assets is reviewed at each reporting date and reduced to the
extent that it is no longer probable that sufficient taxable profit will be available to allow all or part of the
deferred income tax asset to be utilised. Deferred income tax assets and liabilities are measured at the tax
rates that are expected to apply to the year when the asset is realised, or the liability is settled, based on tax
rates (and tax laws) that have been enacted or substantively enacted at the reporting date. Income taxes
relating to items recognised directly in equity are recognised in equity and not in the statement of profit or
loss and other comprehensive income.
43

Deferred tax assets and deferred tax liabilities are offset only if a legally enforceable right exists to set off
current tax assets, against current tax liabilities and the deferred tax assets and liabilities relate to the same
taxable entity and the same taxable authority.
R&D tax offsets are refundable tax offsets equivalent to the value of deductions available under the R&D Tax
Concession provisions (that is a qualifying company is eligible for a cash rebate and the associated carry
forward loss extinguished) and are applied to the capitalised amounts of the expenditure to which they relate.
Brain Resource Limited and its subsidiaries are taxed on a stand-alone basis.
(xiv) Employee benefits
Provision is made for employee benefits accumulated as a result of employees rendering services up to the
reporting date. These benefits include wages, salaries and annual leave. Liabilities arising in respect of
wages, salaries and any other employee benefits expected to be settled wholly within twelve months of the
reporting date are measured at their nominal amounts based on remuneration rates which are expected to
be paid when the liability is settled. Long service leave is measured at the present value of the estimated
future cash outflow to be made in respect of services provided by employees up to the reporting date. In
determining the present value of future cash outflows, the market yield as at the reporting date on high quality
corporate bonds, which have terms to maturity approximating the terms of the related liability, are used.
Employee benefit expenses and revenues arising in respect of the following categories: wages and salaries,
non-monetary benefits, annual leave and other leave benefits; and other types of employee benefits are
recognised against profits on a net basis in their respective categories. Long service leave is provided for
employees with an assumption made over the likelihood of that employee achieving their tenth anniversary.
Superannuation is provided for employees in accordance with the legislative requirements.
(xv) Leases
Operating lease payments, where the lessor effectively retains substantially all of the risks and benefits of
ownership of the leased items, are included in the determination of the operating profit in equal instalments
over the lease term.
(xvi) Earnings per share
Basic earnings per share amounts are calculated by dividing net profit for the year attributable to ordinary
shareholders of the parent by the weighted average number of ordinary shares outstanding during the year.
Diluted earnings per share amounts are calculated by dividing the net profit attributable to ordinary
shareholders by the weighted average number of ordinary shares outstanding during the year (adjusted for
the effects of dilutive options and dilutive convertible non-cumulative redeemable preference shares).
Potential ordinary shares are treated as dilutive when and only when their conversion to ordinary shares
would increase loss per share or decrease the profit per share from continuing operations.
(xvii) Interest income
Revenue is recognised as interest accrues using the effective interest method. This is a method of calculating
the amortised cost of a financial asset and allocating the interest income over the relevant period using the
effective interest rate, which is the rate that discounts estimated future cash receipts through the expected
life of the financial asset to the net carrying amount of the financial asset.
(xviii) Contributed equity
Ordinary shares are classified as equity. Incremental costs directly attributable to the issue of new shares or
options are shown in equity as a deduction, net of tax, from the proceeds.
(xix) Goods and Services Tax (GST)
44

Cash flows are included in the cash flow statement on a gross basis. The GST component of cash flows
arising from investing and financing activities are classified as operating cash flows and are included in
receipts from customers or payments to suppliers, as appropriate.
Revenues, expenses and assets are recognised net of the amount of GST except: when the GST incurred
on a purchase of goods and services is not recoverable from the taxation authority, in which case the GST
is recognised as part of the cost of acquisition of the asset or as part of the expense item as applicable; and
Receivables and payables, which are stated with the amount of GST included.
The net amount of GST recoverable from, or payable to, the taxation authority is included as part of
receivables or payables in the statement of financial position.
Cash flows are included in the statement of cash flows on a gross basis and the GST component of cash
flows arising from investing and financing activities, which is recoverable from, or payable to, the taxation
authority is classified as part of operating cash flows.
Commitments and contingencies are disclosed net of the amount of GST recoverable from, or payable to,
the taxation authority.
(xx) Convertible bonds
The component of the convertible bonds that exhibit characteristics of a liability is recognised as a liability in
the statement of financial position, net of transaction costs. On issuance of the convertible bonds, the fair
value of the liability component is determined using a market rate for an equivalent non-convertible bond and
this amount is carried as a long-term liability using the amortised cost basis until extinguished on conversion
or redemption. The increase in the liability due to the passage of time is recognised as a finance cost. The
remainder of the proceeds is allocated to the conversion option that is recognised and included in
shareholders’ equity, net of transaction costs. The carrying amount of the conversion option is not
remeasured in subsequent years. Interest on the liability component of the convertible bonds is recognised
as an expense in profit or loss. Transaction costs are apportioned between the liability and equity components
of the convertible bond based on the allocation of proceeds to the liability and equity components when the
instruments are first recognised. Note that the convertible bonds were all converted during the year.
(xxi) Business Combinations and Goodwill
Business combinations are accounted for using the acquisition method. The cost of an acquisition is
measured as the aggregate of the consideration transferred, which is measured at acquisition date fair value,
and the amount of any non-controlling interests in the acquiree. For each business combination, the Group
elects whether to measure the non-controlling interests in the acquiree at fair value or at the proportionate
share of the acquiree’s identifiable net assets. Acquisition-related costs are expensed as incurred and
included in administrative expenses.
When the Group acquires a business, it assesses the financial assets and liabilities assumed for appropriate
classification and designation in accordance with the contractual terms, economic circumstances and
pertinent conditions as at the acquisition date. This includes the separation of embedded derivatives in host
contracts by the acquiree.
Any contingent consideration to be transferred by the acquirer will be recognised at fair value at the
acquisition date. Contingent consideration classified as an asset or liability that is a financial instrument and
within the scope of IAS 39 Financial Instruments: Recognition and Measurement, is measured at fair value
with the changes in fair value recognised in the statement of profit or loss.
45
Goodwill is initially measured at cost (being the excess of the aggregate of the consideration transferred and
the amount recognised for non-controlling interests and any previous interest held over the net identifiable
assets acquired and liabilities assumed). If the fair value of the net assets acquired is in excess of the
aggregate consideration transferred, the Group re-assesses whether it has correctly identified all of the
assets acquired and all of the liabilities assumed and reviews the procedures used to measure the amounts
to be recognised at the acquisition date. If the reassessment still results in an excess of the fair value of net
assets acquired over the aggregate consideration transferred, then the gain is recognised in profit or loss.
After initial recognition, goodwill is measured at cost less any accumulated impairment losses. For the
purpose of impairment testing, goodwill acquired in a business combination is, from the acquisition date,
allocated to each of the Group’s cash-generating units that are expected to benefit from the combination,
irrespective of whether other assets or liabilities of the acquiree are assigned to those units.
Where goodwill has been allocated to a cash-generating unit (CGU) and part of the operation within that unit
is disposed of, the goodwill associated with the disposed operation is included in the carrying amount of the
operation when determining the gain or loss on disposal. Goodwill disposed in these circumstances is
measured based on the relative values of the disposed operation and the portion of the cash-generating unit
retained.
(xxii) Investment in joint venture
Up until 14 December 2017 the Company had an interest in a joint venture, which was a jointly held entity,
whereby the venturers had a contractual arrangement that established joint control over the economic
activities of the entity. The agreement required unanimous agreement for financial and operating decisions
that are Fundamental Matters (defined as including new issues, borrowings, material departures from
business plan, unusual transactions, guarantees, dividends, related party agreements, mergers and
reconstructions, variation of securities rights and key contracts). The financial statements of the joint venture
were prepared for the same reporting period as the Company. Adjustments were made where necessary to
bring the accounting policies in line with those of the Group.
The Company’s investment in the joint venture was accounted for using the equity method. Under the equity
method, the investment in the joint venture was carried on the statement of financial position at cost plus
post acquisition changes in the Company’s share of net assets of the joint venture. The statement of profit
or loss and other comprehensive income reflected the Company’s share of the results of operations of the
joint venture.
After application of the equity method, the Group determined whether it is necessary to recognise an
additional impairment loss on its investment in its joint venture. The Group determined at each reporting date
whether there was any objective evidence that the investment in the joint venture was impaired. If this was
the case, the Group calculated the amount of impairment as the difference between the recoverable amount
of the joint venture and its carrying value and recognises the amount in the "share of profit / (loss) of a joint
venture” in the statement of profit or loss and other comprehensive income.
On 14 December 2017, the Company became the sole owner of the joint venture company.
Applicable to Parent Company Only
(xxiii) Investment in subsidiaries
Investment in subsidiaries is recorded at cost less any provision for impairment.
(e) Going Concern
The Group’s financial statements have been prepared and presented on a going concern basis.
46

This report adopts the going concern basis of accounting, which contemplates the realisation of assets and
the discharge of liabilities and commitments in the ordinary course of business.
In financial year 2018, the Group recorded a loss of $23,101,340 and cash outflows from operations of
$3,878,546. Prima facie, these circumstances represent a material uncertainty regarding the Group’s ability
to continue as a going concern.
In financial year 2018 the Company restructured the organisation including removing a secured interest
over the assets of the Company, converting all securities to ordinary shares and options over ordinary
shares and raising capital to undertake a material product upgrade for the Company’s lead product. The
capital will also be used to fund the go to market plan to sell the upgraded product which is to be launched
early in the 2019 financial year.
Management understands that its current commitment to fund the ongoing growth and commercialisation
objectives and to continue as a going concern may require funds to be raised. This requirement for funds is
dependent upon the revenue generated from the sale of the Company’s lead product MyBrainSolutions
which is to be upgraded and relaunched as Total Brain and the commercialisation of the Company’s iSPOT
database which the Company has engaged an investment bank to advise on the potential sale and
licensing options.
The Directors have a reasonable expectation that they will be able to raise sufficient funds in the equity
markets to provide adequate levels of working capital to fund the Company’s strategic goals. They believe
therefore that the Company continues to be a going concern and that it will be able to pay its debts as and
when they fall due for a period of at least 12 months from the date of this report. On this basis the Directors
believe that the going concern basis of presentation is appropriate. No adjustments have been made
relating to the recoverability and classification of recorded asset amounts and classification of liabilities that
might be necessary should the Company not have the ability to continue as a going concern. If for any
reason the Company is unable to continue as a going concern, it would impact on the Company’s ability to
realise assets at their recognised values and to extinguish liabilities in the normal course of business at the
amounts stated in the consolidated financial statements.
2. REVENUE AND OTHER INCOME
2018 2017
MBS – Corporate 1,341,690 1,243,020
MBS – Affinity 504,008 188,512
MBS – All Other 249,354 207,474
Clinical 478,421 581,167
Discovery 35,517 120,393
Treatment prediction research (iSPOT) - 28,755
Total revenues 2,608,990 2,369,321
Other revenues (1,358) 31,628
Interest received 8,155 10,612
Total other income 6,797 42,240
Total revenues and other income from ordinary activities 2,615,787 2,411,561
47

Note that comparatives have been adjusted to match current year disclosures. There has been no effect on
prior year revenue or profit.
3. EXPENSES
2018 2017
Cost of equipment and third party drug trial expense Note 122,207 171,437
Depreciation & Amortisation:
Plant and equipment 36,819 35,931
Intangibles 53,831 478,780
Total Depreciation and Amortisation 90,650 514,711
Operating lease costs (minimum lease payments) 148,619 232,971
Superannuation contributions 211,670 177,552
Bad debt expense 30,057 -
Net Foreign Currency Loss / (Gain) 14,855 50,139
R&D expenditure recognised as an expense 84,647 214,672
Impairment of Intangibles 9 8,487,143 6,762,465
Impairment of Goodwill 30 5,081,097 -
Total Impairment of Goodwill & Intangibles 13,568,240 6,762,465
48
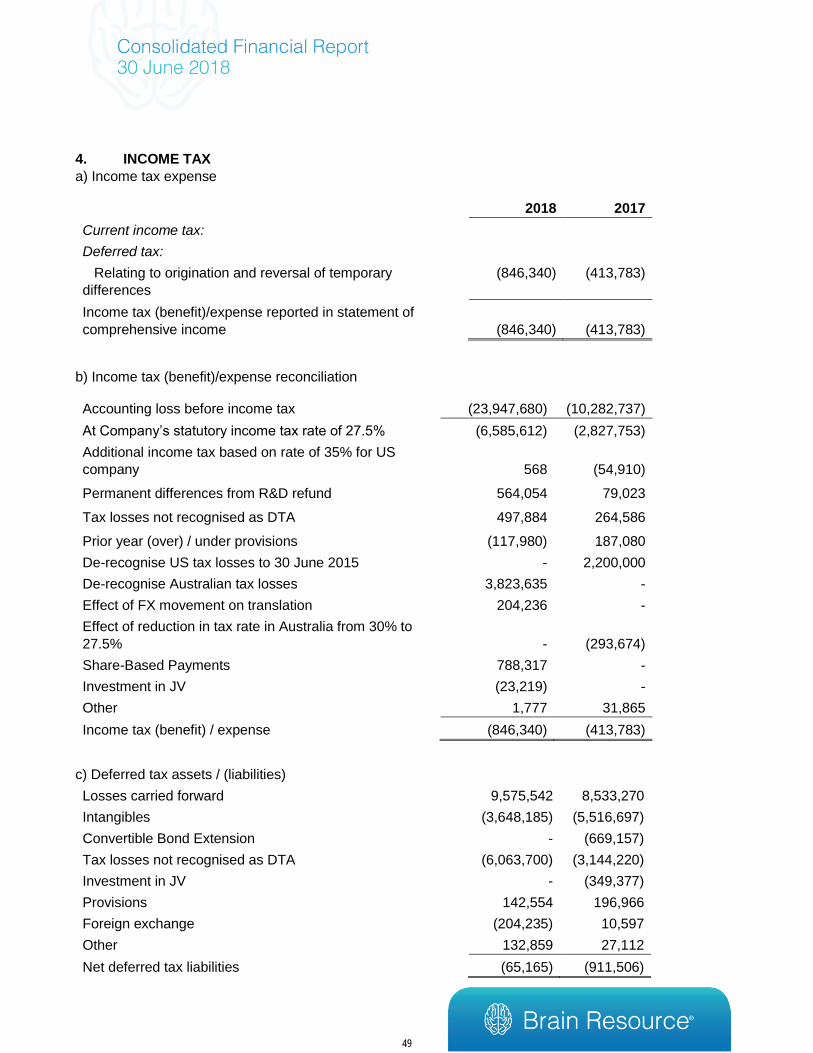
4. INCOME TAX
a) Income tax expense
2018 2017
Current income tax:
Deferred tax:
Relating to origination and reversal of temporary
differences
(846,340) (413,783)
Income tax (benefit)/expense reported in statement of
comprehensive income (846,340) (413,783)
b) Income tax (benefit)/expense reconciliation
Accounting loss before income tax (23,947,680) (10,282,737)
At Company’s statutory income tax rate of 27.5% (6,585,612) (2,827,753)
Additional income tax based on rate of 35% for US
company 568 (54,910)
Permanent differences from R&D refund 564,054 79,023
Tax losses not recognised as DTA 497,884 264,586
Prior year (over) / under provisions (117,980) 187,080
De-recognise US tax losses to 30 June 2015 - 2,200,000
De-recognise Australian tax losses 3,823,635 -
Effect of FX movement on translation 204,236 -
Effect of reduction in tax rate in Australia from 30% to
27.5% - (293,674)
Share-Based Payments 788,317 -
Investment in JV (23,219) -
Other 1,777 31,865
Income tax (benefit) / expense (846,340) (413,783)
c) Deferred tax assets / (liabilities)
Losses carried forward 9,575,542 8,533,270
Intangibles (3,648,185) (5,516,697)
Convertible Bond Extension - (669,157)
Tax losses not recognised as DTA (6,063,700) (3,144,220)
Investment in JV - (349,377)
Provisions 142,554 196,966
Foreign exchange (204,235) 10,597
Other 132,859 27,112
Net deferred tax liabilities (65,165) (911,506)
49

Reflected in the statement of financial position as follows:
Deferred tax assets - -
Deferred tax liabilities (65,165) (911,506)
Deferred tax liabilities, net (65,165) (911,506)
Reconciliation of deferred tax liabilities, net:
Opening balance as of 1 July (911,506) (1,325,289)
Losses carried forward 1,042,272 518,755
Tax losses not recognised as DTA (2,919,480) (264,586)
De-recognise US tax losses to 30 June 2015 - (2,200,000)
Effect of reduction in tax rate in Australia from 30% to 27.5% - 293,674
Intangibles 1,868,512 1,666,849
Foreign exchange (214,832) 48,045
Investment in JV 349,377 -
Convertible Bond Extension 669,157 -
Convertible Bonds Interest - 271,414
Other 51,334 79,632
Net deferred tax benefit/(expense) charged to Statement of
Comprehensive Income 846,340 413,783
Net deferred tax expense charged to equity - -
Closing balance as at 30 June (65,165) (911,506)
Brain Resource, Inc., incorporated in California USA has carry-forward unused tax losses of $11.2m as at 30
June 2018 (2017: $9.0m). The Company recognised deferred tax assets in respect of these tax losses as at
30 June 2018 of $nil (2017: $nil). The losses remain available to offset future income tax, but the directors
have chosen not to recognise a deferred tax asset in respect of them, until it is demonstrated that the
realisation of the deferred tax is more likely than not.
The Australian based companies have carry-forward unused tax losses of $21.6m as of 30 June 2018 (2017:
$19.6m). The Company concluded that $3.5m of the deferred tax asset relating to carry-forward unused tax
losses in Australia is recoverable, within the requisite timeframes, based on budget estimates for future
taxable income as approved by the Company’s Board of Directors.
No franking credits are available for subsequent years (2017: nil). Brain Resource Limited and its subsidiaries
have not formed a tax consolidated Group for income tax purposes.
50

5. AUDITOR’S REMUNERATION
The auditor of Brain Resource Limited is Grant Thornton (2017: Ernst & Young). Amounts received or due
and receivable by Grant Thornton (2017: Ernst & Young (Australia)) for:
2018 2017
Half year review 25,000 70,190
Full year audit 85,000 130,000
Other Services (Independent Expert Report) 35,000 -
145,000 200,190
6. TRADE AND OTHER RECEIVABLES
2018 2017
Trade Receivables 634,836 347,341
Provision for doubtful debts (19,002) -
Advances 360 138
Government grant receivable for R&D tax incentives 525,000 125,000
Other receivables 176,012 710
1,317,206 473,189
(a) Allowance for impairment loss
Trade receivables are non-interest bearing and are generally on 30-60 day terms. Trade receivables with an
initial carrying value of $30,057 (2017: $0) were impaired and fully provided for.
(b) Trade Receivables Ageing
Receivables past due but not considered impaired are: $158,383 (2017: $143,542). Each of these amounts
have been reviewed and the Company is satisfied that payment will be received in full. Other balances within
trade and other receivables do not contain impaired assets and are not past due. It is expected that these
other balances will be received when due. At 30 June, the ageing analysis of trade receivables is as follows:
Total 0-30
days
31-60
days
61-90 days
PDNI*
61-90
days
CI*
+90
days
PDNI*
+90
days CI*
2018 Consolidated 634,836 457,451 68,352 46,076 - 43,955 19,002
2017 Consolidated 347,341 204,340 7,042 39,134 - 96,825 -
*Past due not impaired (PDNI) and Considered Impaired (CI).
There were related receivables of $102,553 (2017: $0). Refer Note 17 for more information.
Due to the short term nature of these receivables, their carrying value is assumed to approximate their fair
value. The maximum exposure to credit risk is the fair value of receivables.
51
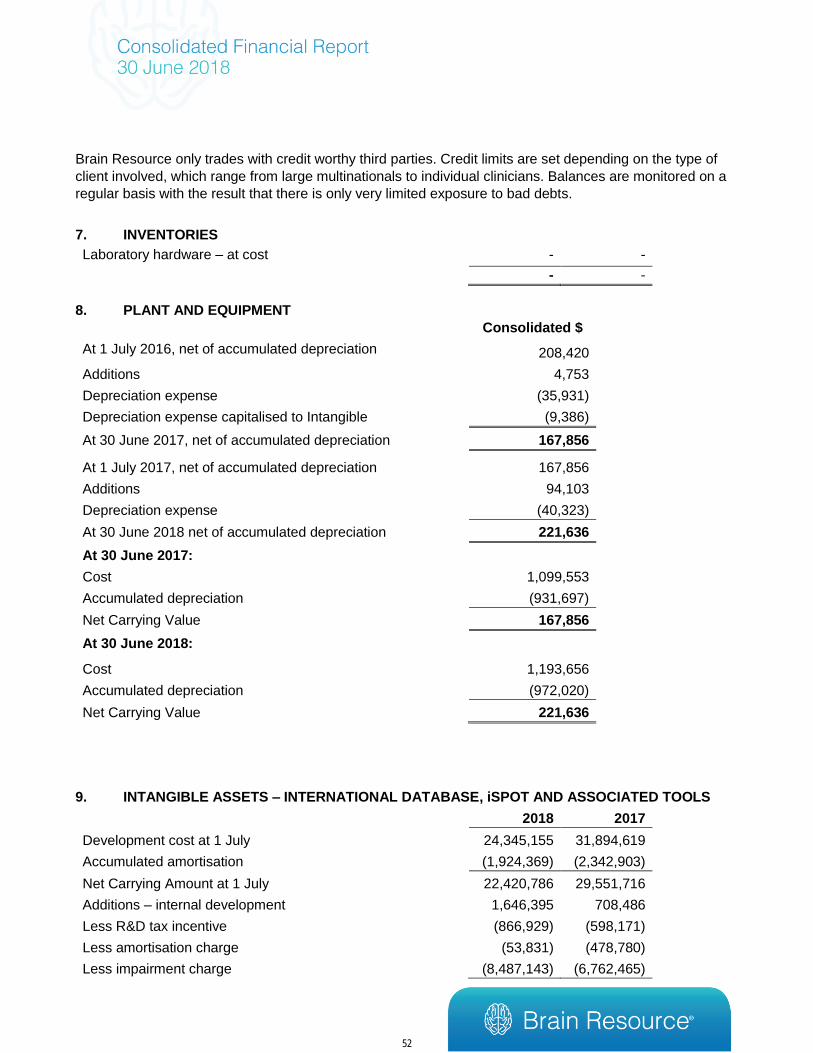
Brain Resource only trades with credit worthy third parties. Credit limits are set depending on the type of
client involved, which range from large multinationals to individual clinicians. Balances are monitored on a
regular basis with the result that there is only very limited exposure to bad debts.
7. INVENTORIES
Laboratory hardware – at cost - -
- -
8. PLANT AND EQUIPMENT
Consolidated $
At 1 July 2016, net of accumulated depreciation 208,420
Additions 4,753
Depreciation expense (35,931)
Depreciation expense capitalised to Intangible (9,386)
At 30 June 2017, net of accumulated depreciation 167,856
At 1 July 2017, net of accumulated depreciation 167,856
Additions 94,103
Depreciation expense (40,323)
At 30 June 2018 net of accumulated depreciation 221,636
At 30 June 2017:
Cost 1,099,553
Accumulated depreciation (931,697)
Net Carrying Value 167,856
At 30 June 2018:
Cost 1,193,656
Accumulated depreciation (972,020)
Net Carrying Value 221,636
9. INTANGIBLE ASSETS – INTERNATIONAL DATABASE, iSPOT AND ASSOCIATED TOOLS
2018 2017
Development cost at 1 July 24,345,155 31,894,619
Accumulated amortisation (1,924,369) (2,342,903)
Net Carrying Amount at 1 July 22,420,786 29,551,716
Additions – internal development 1,646,395 708,486
Less R&D tax incentive (866,929) (598,171)
Less amortisation charge (53,831) (478,780)
Less impairment charge (8,487,143) (6,762,465)
52

Net Carrying amount at 30 June 14,659,278 22,420,786
Made up of:
Development Cost 25,124,621 24,343,155
Accumulated amortisation (1,978,200) (1,924,369)
Provision for impairment (8,487,143) -
14,659,278 22,420,786
The intangible assets are tested for impairment as a single Cash Generating Unit (CGU), as the individual
assets do not currently generate largely independent cash flows.
In the 2018 financial year, the intangible assets have been tested for impairment and the recoverable
amount is the higher of value in use or fair value less costs of disposal. Fair value is determined by the
Directors and management based on an assessment of the price that would be received to sell the
intangibles of Brain Resource, including the Brain Resource International Database (BRID) and iSPOT in
an orderly transaction between market participants at the measurement date.
The approach and key assumptions used in the assessment of fair value is predominantly based on
references to the market capitalisation of the Company as at the reporting date and the Consolidated
Group’s other assets and liabilities. This assessment has been further validated using alternate valuation
techniques including:
• A revenue discounted cash flow approach – MBS Corporate, MBS Affinity and MBS All Other revenue generated by the business in the current year, projected to grow at the same annual rate (28%) as compared to the prior year and using a discount rate of 50%.
• A revenue multiple approach – utilising a revenue multiple (average of 8 times revenue) as per the internet software industry comparatives for listed companies. As the elements of the BRID collected through the iSPOT studies did not produce any revenue in the current year (and did not meet the revenue targets included in the prior year valuation), management determined not to include any such revenues.
Upon review of its assets, it has been determined, that the intangible assets are impaired by $8,487,143.
As the valuation is based on a combination of observable market data and unobservable inputs, the
valuation has been considered to be level 2 in the fair value hierarchy. The impaired assets, have been
written down to their fair value of $14,659,278.
The company is actively exploring alternative revenue streams for its differentiated ISPOT depression +
ADHD assets. It should be noted that where, in future periods, the Company generates revenue from those
assets thereby increasing the valuation of the intangible assets, the impairment loss can be reversed.
In the prior financial year, the recoverable amount of the intangible assets were determined based on the
value in use approach.
53

10. OTHER ASSETS
Current
2018 2017
Prepayments 28,783 25,620
Non-Current
Deposits 11,800 14,766
11. PAYABLES
2018 2017
Trade Creditors 318,626 93,384
Unearned income 29,398 -
Other creditors 141,452 446,533
Employee Entitlements - 148,740
489,476 688,657
Terms and Conditions - Trade creditors and other creditors are non-interest bearing and are normally settled
on 30-day terms.
Fair value - Due to the short-term nature of these payables, their carrying value is assumed to approximate
fair value.
The $148,740 of employee entitlements owing as at 30 June 2017 was owed to the executive director, E.
Gordon. The other creditors owing as at 30 June 2017 of $446,533 included $368,317 owing to D. Segal. D.
Segal resigned as a director on 13 October 2016.
12. EMPLOYEE BENEFITS
2018 2017
Current employee benefits 488,495 698,914
Non-Current Employee benefits 29,884 17,089
Out of the total liability, 24% relate to balances owing to the executive directors (2017: 62%).
13. CONTRIBUTED EQUITY
(a) Share Capital
2018 2017
Ordinary shares authorised and fully paid (see note b) 60,328,245 33,141,063
Transaction costs accounted for as a deduction from equity (2,247,724) (1,363,276)
Convertible Bond – Equity Component (see note f) - 5,738,666
Ordinary shares fully paid – closing balance 58,080,521 37,516,453
(b) Shares Issued
During the current and prior year, no shares were issued as a consequence of option exercises.
Number of ordinary shares – opening balance 166,015,204 149,495,954
Issued during the year 365,244,664 16,519,250
54

Number of ordinary shares - closing balance 531,259,868 166,015,204
Note: During FY2018, 1,125,000 shares were issued to Matthew Morgan and Evian Gordan at 8 cents per
share and 175,000,000 shares were placed at 8 cents to the holder of the convertible bond (refer note 28
for more information), 168,286,348 were placed at 6 cents to sophisticated and institutional investors and
20,833,316 were issued at 6 cents as part of a share purchase plan to enable small shareholders to invest
at the same price as investors in the large placements, with funds to be used for working capital.
The relevant accounting standards require the value of the share capital raised in exchange for the
conversion of the convertible bond to be valued at fair value. The share price on the day that the
175,000,000 shares were issued in exchange for the convertible bond was 9 cents, with the resulting
impact on the statement of comprehensive income being $1.75m.
Note: During FY17, 11,395,000 share were privately placed at 8 cents per shares and 5,123,750 shares
were issued as part of a share purchase plan offered to all shareholders and 500 shares were issued at 20
cents upon conversion of options with the funds to be used for working capital.
55
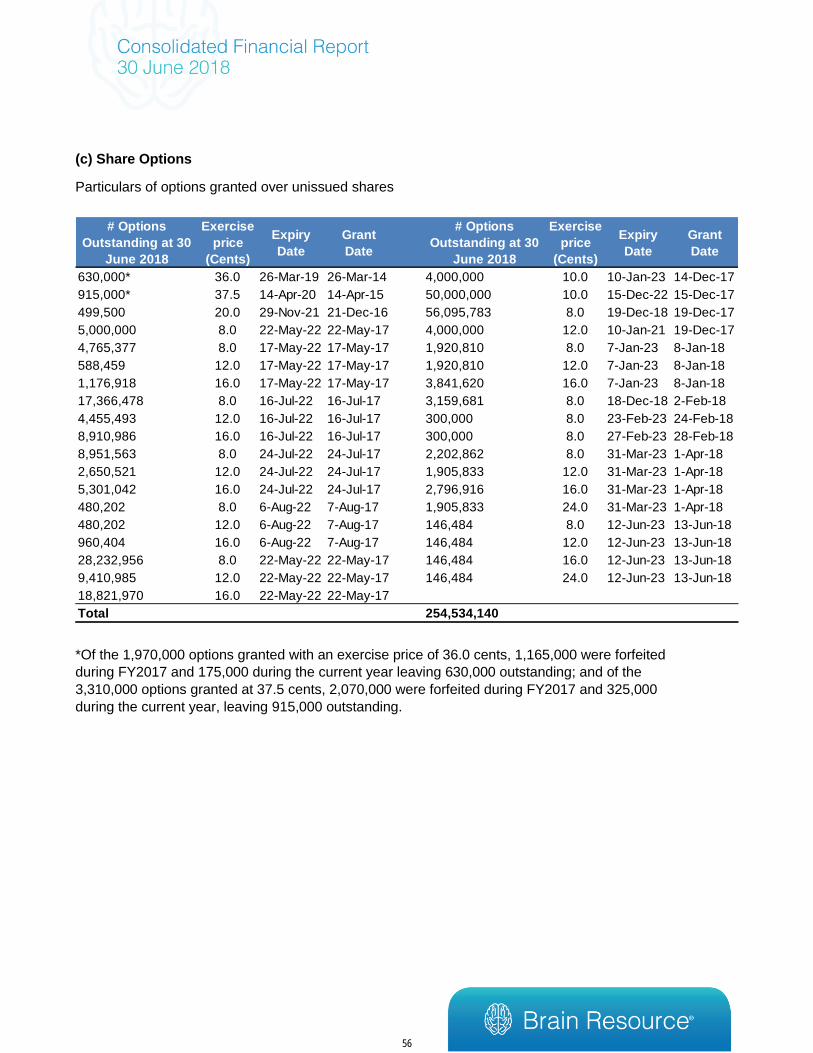
(c) Share Options
Particulars of options granted over unissued shares
*Of the 1,970,000 options granted with an exercise price of 36.0 cents, 1,165,000 were forfeited
during FY2017 and 175,000 during the current year leaving 630,000 outstanding; and of the
3,310,000 options granted at 37.5 cents, 2,070,000 were forfeited during FY2017 and 325,000
during the current year, leaving 915,000 outstanding.
# Options
Outstanding at 30
June 2018
Exercise
price
(Cents)
Expiry
Date
Grant
Date
# Options
Outstanding at 30
June 2018
Exercise
price
(Cents)
Expiry
Date
Grant
Date
630,000* 36.0 26-Mar-19 26-Mar-14 4,000,000 10.0 10-Jan-23 14-Dec-17
915,000* 37.5 14-Apr-20 14-Apr-15 50,000,000 10.0 15-Dec-22 15-Dec-17
499,500 20.0 29-Nov-21 21-Dec-16 56,095,783 8.0 19-Dec-18 19-Dec-17
5,000,000 8.0 22-May-22 22-May-17 4,000,000 12.0 10-Jan-21 19-Dec-17
4,765,377 8.0 17-May-22 17-May-17 1,920,810 8.0 7-Jan-23 8-Jan-18
588,459 12.0 17-May-22 17-May-17 1,920,810 12.0 7-Jan-23 8-Jan-18
1,176,918 16.0 17-May-22 17-May-17 3,841,620 16.0 7-Jan-23 8-Jan-18
17,366,478 8.0 16-Jul-22 16-Jul-17 3,159,681 8.0 18-Dec-18 2-Feb-18
4,455,493 12.0 16-Jul-22 16-Jul-17 300,000 8.0 23-Feb-23 24-Feb-18
8,910,986 16.0 16-Jul-22 16-Jul-17 300,000 8.0 27-Feb-23 28-Feb-18
8,951,563 8.0 24-Jul-22 24-Jul-17 2,202,862 8.0 31-Mar-23 1-Apr-18
2,650,521 12.0 24-Jul-22 24-Jul-17 1,905,833 12.0 31-Mar-23 1-Apr-18
5,301,042 16.0 24-Jul-22 24-Jul-17 2,796,916 16.0 31-Mar-23 1-Apr-18
480,202 8.0 6-Aug-22 7-Aug-17 1,905,833 24.0 31-Mar-23 1-Apr-18
480,202 12.0 6-Aug-22 7-Aug-17 146,484 8.0 12-Jun-23 13-Jun-18
960,404 16.0 6-Aug-22 7-Aug-17 146,484 12.0 12-Jun-23 13-Jun-18
28,232,956 8.0 22-May-22 22-May-17 146,484 16.0 12-Jun-23 13-Jun-18
9,410,985 12.0 22-May-22 22-May-17 146,484 24.0 12-Jun-23 13-Jun-18
18,821,970 16.0 22-May-22 22-May-17
Total 254,534,140
56

Note: a summary of all options granted is as follows:
* Employee Share Option Plan
** Of the 49,391,327 options granted during 2017, only 5,500,000 were issued, leaving 43,891,827
unissued. (Note that the Accounting Standard AASB2: Share Based Payments defines ‘grant date’ as
“…when the entity and the counterparty have a share understanding of the terms and conditions of the
agreement…” The Company’s ESOP was amended on 14 July 2017, and all of these options have now
been issued and are subject to the terms of the ESOP.)
The 43,891,827 reclassified options relate to Mr Gagnon’s options package. On 22 May 2017, 5,000,000
vested options were issued to Mr Louis Gagnon (Tranche 1) exercisable for 5 years at $0.08 per share.
Mr Gagnon agreed not to exercise any portion of the vested options until the earliest to occur of: (a) the
convertible bond was no longer outstanding or modified in such a manner that the conversion rights
pursuant to the bond could not be triggered by Mr Gagnon's exercise of the option, (b) the holder(s) of
the convertible bond waived the conversion right in respect of Mr Gagnon’s exercise of any options,
(c) the Company directly or indirectly granted or issued any new equity at a price below AUD $0.194, (d)
if a recapitalisation was not consummated by October 31, 2017, then immediately prior to the sale of all
of the Company's assets (or a sale of all of the outstanding shares or merger transaction ultimately
resulting in a liquidity event) or change of control, or (e) April 30, 2018.
Also, Mr Gagnon was eligible to receive additional 5 year options. The total number of options equalled
up to 8% of the fully diluted share capital of the company.
Eligibility for the additional grant of options depended upon consummation of a recapitalisation of the
company, with recapitalisation being defined as an equity financing of the company of an estimated
amount of AUD $13,000,000 together with recapitalisation of the company’s existing convertible debt,
with an anticipated closing date before 31 October 2017. Based on the assumption that the
recapitalisation occurred at a capital raising price of $0.085 and a convertible bond conversion price of
$0.085, Mr Gagnon would have been entitled to an additional 43,891,827 options as follows:
19,445,913 options with a strike price of $0.08 vesting at the recapitalisation date (Tranche 2);
ESOP* Non-ESOP Total
Options outstanding as at 1 July 2016 8,380,000 - 8,380,000
Granted - 49,391,827 49,391,827
Forfeited -3,235,000 - -3,235,000
Exercised - -500 -500
Expired -3,100,000 - -3,100,000
Options outstanding as at 30 June 2017 2,045,000 49,391,327 51,436,327
Reclassification** 48,891,827 -48,891,827 -
Granted 86,004,250 117,593,563 203,597,813
Forfeited -500,000 - -500,000
Exercised - - -
Expired - - -
Options outstanding as at 30 June 2018 136,441,077 118,093,063 254,534,140
Options exercisable as at 30 June 2017 1,787,000 - 1,787,000
Options exercisable as at 30 June 2018 75,522,719 115,315,283 190,838,002
57

8,148,638 options with a strike price of $0.12, vesting 12 months after grant date (being 22 May 2018)
(Tranche 3);
8,148,638 options with a strike price of $0.16, vesting 24 months after grant date (being 22 May 2019)
(Tranche 4);
8,148,638 options with a strike price of $0.16, vesting 36 months after grant date (being 22 May 2020)
(Tranche 5).
Subject to meeting the various conditions above, and subject to the agreement whereby Mr Gagnon had
agreed not to exercise until the earlier of a series of events (referred to above), Mr Gagnon may exercise
vested options at any time prior to the fifth anniversary of 22 May 2017 but such exercise period shall be
shortened to 90 days following separation.
Now the recapitalisation of the company has occurred, the number of options to be issued has been
adjusted to reflect the finalised terms and conditions of the conversion of the convertible bond and the
recapitalisation, such that the total number of options equalled 8% of the fully diluted share capital of the
company.
With the previously estimated number of options bracketed, Mr Gagnon was entitled to an additional
56,465,911 options as follows:
28,232,956 (previously 19,445,913) options with a strike price of $0.08 vesting at the recapitalisation date
(Tranche 2);
9,410,985 (previously 8,148,638) options with a strike price of $0.12, vesting 12 months after grant date
(being 22 May 2018) (Tranche 3);
9,410,985 (previously 8,148,638) options with a strike price of $0.16, vesting 24 months after grant date
(being 22 May 2019) (Tranche 4);
9,410,985 (previously 8,148,638) options with a strike price of $0.16, vesting 36 months after grant date
(being 22 May 2020) (Tranche 5).
• The weighted average remaining contractual life for the share options outstanding at 30 June 2018
is 3.27 years (2017: 4.79 years).
• The value of options granted, yet to be expensed at 30 June 2018 was $108,064 (2017: $302,727).
• The weighted average fair value of share options granted during 2018 was $0.0157. This was
estimated at the date of the grant using the Black Scholes model, taking into account the terms and
conditions upon which the options were granted, as set out in the following table:
58

Note 1: In determining the expense relating to Mr Morgan’s options, the directors considered that
there is a 100% likelihood of the vesting condition for tranche 1 (2,000,000 options vested on
14/12/17), 100% for tranche 2 (1,000,000 options vesting on 14/12/18) and 80% for tranche
3 (1,000,000 options vesting on 14/12/19).
Note 2: The fair value of the 5,000,000 options granted and vesting on 22 May 2017 was not adjusted
for the restriction in relation to exercising them agreed to by Mr Gagnon as described above.
Also as noted above, the fair value of the remaining 56,465,911 options was performed
assuming a 5 year period starting on 22 May 2017 and ending 22 May 2022- this value was
not adjusted for the term of the agreement that requires recapitalisation to occur before the
options are issued to Mr Gagnon.
In determining the expense relating to Mr Gagnon’s options, the directors considered that
there is a 100% likelihood of the vesting condition for Tranche 2 being met, 100% for Tranche
3, 80% for Tranche 4 and 75% for Tranche 5.
Note 3: In determining the expense relating to Mr Vasilev’s options, the directors considered that
there is a 100% likelihood of the vesting condition for Tranche 1 being met (1,500,000 options
vested on 14 December 2017), 100% for Tranche 2 (3,265,377 vested on 14 December
2017), 100% for Tranche 3 (588,459 vested on 17 May 2018), 80% for Tranche 4 (588,459
vesting on 17 May 2019) and 75% for Tranche 5 (588,459 vesting on 17 May 2020).
Note 4: In determining the expense relating to Mr Mund’s options, the directors considered that there
is a 100% likelihood of the vesting condition for Tranche 1 being met (2,000,000 options
vested on 14 December 2017), 100% for Tranche 2 (15,366,478 vested on 14 December
2017), 100% for Tranche 3 (4,455,493 vesting on 16 July 2018), 80% for Tranche 4
Details# of
options
Grant
Date
Prevailing
Share PriceTerm Dividends
Interest
RateVolatility
Other
Notes
Grant to Mr M Morgan 4,000,000 14/12/17 $0.10 5 Years None 2.56% 36.90% Note 1
Grant to Mr L Gagnon* 61,465,911 22/5/17 $0.07 5 Years None 2.39% 30.00% Note 2
Grant to Mr E Vasilev 6,530,753 17/5/17 $0.07 5 Years None 2.72% 30.00% Note 3
Grant to Mr M Mund 30,732,956 16/7/17 $0.06 5 Years None 2.72% 30.00% Note 4
Grant on conversion of
convertible bond50,000,000 14/12/17 $0.09 5 Years None 2.39% 30.00%
Grant of option to
corporate advisors4,000,000 14/12/17 $0.09 1 Year None 2.39% 30.00%
Grant under ESOP 16,903,126 24/7/17 $0.08 5 Years None 2.68% 30.50% Note 5
Grant under ESOP 1,920,810 8/1/18 $0.06 5 Years None 1.81% 37.40% Note 5
Grant under ESOP 7,683,238 8/1/18 $0.06 5 Years None 1.81% 37.40% Note 5
Grant under ESOP 300,000 24/2/18 $0.06 5 Years None 1.78% 37.40% Note 5
Grant under ESOP 300,000 28/2/18 $0.06 5 Years None 1.79% 29.70% Note 5
Grant under ESOP 8,811,440 1/4/18 $0.05 5 Years None 2.03% 37.40% Note 5
Grant under ESOP 585,938 13/6/18 $0.04 5 Years None 2.06% 31.50% Note 5
59
(4,455,493 vesting on 16 July 2019) and 75% for Tranche 5 (4,455,493 vesting on 16 July
2020).
Note 5: In determining the expense relating to options issued under the ESOP, the directors
considered that there is a 100% likelihood of the vesting condition for options vesting on grant
being met, 90% for tranches vesting 1 year from grant, 80% for tranches vesting 2 years from
grant, 70% for tranches vesting 3 years from grant and 60% for options vesting 4 years from
grant.
• The expense recognised for equity-settled share-based payment transactions during the year was
$2,866,607 (2017: $106,282) made up of a) $1,660,550 in respect to the cost of options issued on
14 December 2017, b) $1,121,343 in respect of expenses for employee’s options, c) $28,440 in
respect of the SPP bonus share issue and c) $56,314 in respect of ESOP (the total of a), b) and c)
being $1,206,097).
• The weighted average exercise price for the share options issued during 2018 was $0.10, exercisable
at 30 June 2018 is $0.09 (2017: $0.37), outstanding at 30 June 2018 is $0.11 (2017: $0.12) and no
options expired during the financial year.
• The Brain Resource Limited employee share scheme was established to grant options over the
ordinary shares to directors, executives, and certain members of staff of the consolidated entity. On
14 July 2017, the scheme was amended such that the definition of Employee was expanded to
include any other person determined by the Board from time-to-time to be an employee for the
purposes of the Plan. The reason for this change was to provide a clear ability for options to be issued
under the Plan to contractors. The purpose of the Plan is to reward the directors, the executive
directors, employees and relevant contractors for their contribution to the Company, and to provide
them with an incentive to contribute to the future growth of the Company, thereby increasing
shareholder value. The options are issued for a term of 5 years and generally vest over four years
(25% on each of the first, second, third and fourth anniversary of the date of grant). The options
cannot be transferred and will not be quoted on the ASX. The issue / exercise price is at the discretion
of management but cannot be less than 80% of the weighted average market price of fully paid shares
sold in the ordinary course of trading on the ASX during the month before the Offer Date. All options
that were issued to directors, executives, employees and contractors are issued under the terms of
the Plan, with the exception of those issued to Mr Morgan.
• Option holders do not have any right, by virtue of the option, to participate in any share issue of the
Company or any related body corporate or in the interest issue of any other registered scheme.
(d) Terms and Conditions of Contributed Equity
Ordinary shares have the right to receive dividends as declared and, in the event of winding up the company,
to participate in the proceeds from the sale of all surplus assets in proportion to the number of and amounts
paid up on shares held. Ordinary shares entitle their holder to one vote, either in person or by proxy, at a
meeting of the company.
(e) Capital Management
When managing capital, management's objective is to ensure the entity continues as a going concern as well
as to maintain optimal returns to shareholders and benefits for other stakeholders. In this regard,
management constantly monitors capital requirements and market conditions to ensure that a capital
structure is maintained that provides the lowest cost of capital available.
60

(f) Convertible Bond
2018 2017
Convertible bonds issued – Face value - 10,000,000
Less: Allocation to Debt - (6,539,427)
Equity component - 3,460,573
Deferred tax - (1,038,173)
Previous allocation to Equity - 3,316,266
Net Convertible Bond Equity - 5,738,666
The terms and conditions for the now converted Convertible Bond are disclosed in Note 28 of this report.
Note that the Convertible Bond was converted to equity on 14 December 2017, whereby the bondholder (or
their related parties) purchased 125,000,000 shares at $0.08 and were also issued with 50,000,000 5 year
options with a strike price of $0.10.
The relevant accounting standards require the value of the share capital raised in exchange for the
conversion of the convertible bond to be valued at fair value. The share price on the day that the
175,000,000 shares were issued in exchange for the convertible bond was 9 cents, with the resulting
impact on the statement of comprehensive income being $1.75m.
14. ACCUMULATED LOSSES AND RESERVES
Accumulated Losses:
2018 2017
Balance at the beginning of year 22,834,351 12,965,397
Loss for the year 23,101,340 9,868,954
Transfer of equity component of convertible bond (note 28) (5,738,666) -
Balance at the end of year 40,197,025 22,834,351
Reserves:
Balance at the beginning of year 664,939 558,658
Cost of share based payments 2,838,167 106,281
Movement in foreign currency translation reserve 395,053 -
Balance at the end of year 3,898,159 664,939
Nature and Purpose of Reserves: Employee equity benefits reserve - used to record the value of equity
benefits provided to employees and directors as part of their remuneration; Foreign Currency Translation
Reserve – used to record exchange differences.
15. EARNINGS PER SHARE
Basic loss per share was 6.38 cents per share (2017: 6.44). The net loss used in the calculation of EPS was
$23,101,340 (2017: loss of $9,868,954). The weighted average number of ordinary shares on issue used in
the calculation of basic earnings per share is 362,265,256 (2017: 153,110,193). All Options on issue (being
190,838,002 exercisable and 63,696,138 non-exercisable as at 30 June 2018) were non-dilutive, however
they will be potentially dilutive in future years.
The Convertible bonds as described in Note 28 were considered to be potential ordinary shares but are not
dilutive in the current year as they were converted in the current year (2017: were not dilutive). The weighted
61

average number of shares used to determine the diluted earnings per share was 362,265,256 (2017:
153,110,193).
16. KEY MANAGEMENT PERSONNEL REMUNERATION
Compensation of Key Management personnel of the Group 2018 2017
Short-term employee benefits 1,337,753 565,612
Post-employment benefits 12,894 22,108
Share-based payment 889,216 138,105
Total compensation paid to key management personnel 2,239,863 725,825
The amounts disclosed in the table are the amounts recognised as an expense during the reporting period
related to key management personnel.
17. RELATED PARTY DISCLOSURES
(a) Directors
The following persons held the position of director of Brain Resource Limited during all or part of the last
two financial years:
Evian Gordon Appointed 8 August 2000 Matthew Morgan Appointed 1 March 2016
Stephen Koslow Appointed 1 March 2016 Louis Gagnon Appointed 27 December 2017
Ajay Arora Appointed 8 May 2018 Dan Segal Resigned 13 October 2016
(b) Ultimate parent
The consolidated financial statements include the financial statements of Brain Resource Limited and its
subsidiaries. Brain Resource Limited is the ultimate parent company and directly owns 100% of each of the
subsidiaries ordinary shares apart from MyBrainSolutions, Inc. and Brain Resource Europe which are 100%
owned by BRC Operations Pty Ltd. Note also that PoweringUpMBS Pty Ltd was 50% owned by Brain Resource
Limited up until 14 December 2017 at which point it became wholly owned. (refer to note 29 for more information).
There are no sales to or purchases from related parties. There are no amounts owing to/by related parties other
than as disclosed in Note 17(b)(iii) and Note 30.
% Investment % Investment Incorporation (i)
2018 2017
BRC Operations Pty Limited 100% 100% Australia
BRC IP Pty Limited 100% 100% Australia
BRC Distribution Pty Limited 100% 100% Australia
BRC International Pty Limited 100% 100% Australia
BRC Development Pty Limited 100% 100% Australia
PoweringUpMBS Pty Ltd 100% 50% Australia
Brain Resource, Inc. 100% 100% USA
MyBrainSolutions, Inc. 100% 100% USA
Brain Resource Europe Limited 100% 100% Ireland
Name
62

(i) The Group operates in one industry; developing and commercialising brain health products delivered
through the My Brain Solutions platform, which is predominately based in Australia and the United
States.
(ii) With the exception of the increase in ownership of PoweringUPMBS Pty Ltd from 50% to 100%, there
have not been any changes to the ownership of the subsidiaries during the year.
(iii) Loans to directors – In June 2018, the Company entered a short-term interest-free loan agreement
with Mr Gagnon for $US59,954 and other employees for $US14,546. Mr Gagnon and the employees
subsequently purchased shares in BRC. The Company has agreed with Mr Gagnon and the
employees that the loans will be repaid in the first quarter of 2018.
18. AGREEMENTS WITH ACADEMIC INSTITUTIONS
The Group is or has been party to numerous agreements with academic institutions.
19. FINANCIAL REPORTING BY SEGMENT
The Group develops and commercialises brain health products, primarily delivered to a range of users
through the one MyBrainSolutions platform. The Group’s Operating Segment has been determined based
on internal management reporting structure and the nature of its assets. It reflects the business level at which
financial information is provided to management for decision making. On this basis it is concluded that the
Group operates in one industry, and is predominantly in Australia and United States.
20. CONTINGENT LIABILITIES
The Group is not aware of any contingent liabilities at the end of the year up to the date of this report.
21. STATEMENT OF CASH FLOWS
Reconciliation of net cash inflow/(outflow) from operating activities to operating (loss) after income tax:
2018 2017
Operating loss after tax (23,101,340) (9,868,953)
Depreciation and amortisation 90,650 514,711
Bad and doubtful debts 30,057 -
Unrealised foreign exchange (gains)/losses 14,855 51,790
Impairment charge 13,568,240 6,762,465
R&D tax incentive 466,929 598,169
Share based payments expense 2,866,607 106,281
Share of loss in joint venture 42,238 103,104
Finance costs 516,941 987,081
Loss on conversion of convertible bond 3,166,358 -
Non-cash payment to supplier 90,386 -
(Increase)/decrease in inventories - 10,156
Increase/(decrease) in trade creditors 225,242 (198,941)
(Increase)/decrease in receivables (341,464) 228,186
Increase/(decrease) in deferred tax assets - 2,231,917
Increase/(decrease) in deferred tax liability (846,341) (2,645,700)
(Increase)/decrease in other assets (197) 25,568
Increase/(decrease) in other payables (470,083) (167,968)
Increase/(decrease) in provisions (197,624) (272,061)
63

Net cash inflow/(outflow) from operating activities (3,878,546) (1,534,195)
For the purpose of the Cash Flow Statement, cash & cash equivalents include cash on hand, at bank,
deposits and bank bills used as part of the cash management function. Cash balance comprises:
Cash & cash equivalents * 6,615,972 1,570,197
* Included in the balance as at 30 June 2018 is a $25,000 term deposit, over which the Company has granted
a guarantee in respect of its Sydney premises.
22. EXPENDITURE COMMITMENTS
a) Capital expenditure commitments
Estimated capital expenditure contracted for at balance date, but not provided for, payable not later than
one year amounted to $nil (2017: $nil).
b) Operating lease expenditure commitments -
Minimum lease payments – Office Premises:
- not later than one year amount - $53,689 (2017: $43,500)
- later than one year but not later than five years - $54,782 (2017: $nil)
Minimum lease payments – Server Hosting:
- not later than one year amount - $58,280 (2017: $216,000)
- later than one year but not later than five years - $nil (2017: $72,000)
23. SUBSEQUENT EVENTS
There are no significant events that have occurred subsequent to 30 June 2018 that may affect either the
Group’s operations or results of those operations or the Group’s state of affairs.
24. NET FAIR VALUE OF FINANCIAL ASSETS AND LIABILITIES
The carrying amount of financial assets and liabilities represents the fair value. The following methods and
assumptions are used to determine the net fair values of financial assets and liabilities.
Recognised financial instruments
Cash, cash equivalents and short-term investments: The carrying amount approximates fair value because
of their short-term to maturity.
Trade receivables and trade creditors: The carrying amount approximates fair value.
Short-term borrowings: The carrying amount approximates fair value because of their short-term to maturity.
Convertible bonds: The fair value of the convertible bond (which was converted on 14 December 2017) was
estimated using an interest rate for an instrument with similar debt terms but without the conversion option.
This estimate was based on an interest rate of 15% for the $10,000,000 Convertible Bonds.
Long-term loans receivable: The fair values of long-term loans receivable are estimated based on an
assessment of recoverability of the loan.
25. EMPLOYEE SHARE BASED PAYMENT PLAN
As discussed in Note 13(c), while all option issues follow the terms of the Employee Share Option Plan, the
following options were issued by the Plan.
64

26. RISK EXPOSURES AND RESPONSES
Primary responsibility for identification and control of financial risks rests with the overall Board. Risk matters
are discussed at each Board meeting. The Audit Committee includes risk management and the arrangements
are reviewed by the Board of Directors.
The Group's principal financial instruments comprise cash and short-term deposits. The Group manages its
exposure to key financial risks, including interest rate and currency risk in accordance with the Group's
financial risk management policy. The objective of the policy is to support the delivery of the Group's financial
targets whilst protecting future financial security.
Interest rate and Cash Deposit Risk
Interest rates applicable to cash financial assets were around 0.4% (2017: 0.4%) with maturities of less than
1 year. All other balances are non-interest-bearing.
The Group's exposure to market interest rates relates primarily to the short term deposits. The Board has
formed the view that these funds be held in either bank deposits or AAA short term bonds. Currently holdings
are in cash deposits with the National Australia Bank and Citibank. Based on an average cash balance,
constant currency weightings and an average interest rate, a +/-10% increase in interest rates would have
equated to a change in the after tax result of around -/+ 0% (2017: -/+0%).
DateNumber of
options
Exercise
priceDate
Number of
options
Exercise
price
- granted 26 March 2014 1,140,000 36 cents - granted 14 December 2017 9,410,985 12 cents
- granted 14 April 2015 1,375,000 37.5 cents - granted 14 December 2017 18,821,970 16 cents
- granted 24 May 2017 5,000,000 8 cents - granted 14 December 2017 28,232,956 8 cents
- granted 1 July 2017 588,459 12 cents - granted 8 January 2018 1,920,810 8 cents
- granted 1 July 2017 1,176,918 16 cents - granted 8 January 2018 1,920,810 12 cents
- granted 1 July 2017 4,765,377 8 cents - granted 8 January 2018 3,841,620 16 cents
- granted 16 July 2017 2,000,000 8 cents - granted 2 February 2018 381,901 8 cents
- granted 16 July 2017 4,455,493 12 cents - granted 24 February 2018 300,000 8 cents
- granted 16 July 2017 8,910,986 16 cents - granted 28 February 2018 300,000 8 cents
- granted 16 July 201715,366,47
88 cents - granted 1 April 2018 2,202,862 8 cents
- granted 24 July 2017 500,000 8 cents - granted 1 April 2018 1,905,833 12 cents
- granted 24 July 2017 2,650,521 12 cents - granted 1 April 2018 2,796,916 16 cents
- granted 24 July 2017 5,301,042 16 cents - granted 1 April 2018 1,905,833 24 cents
- granted 24 July 2017 8,451,563 8 cents - granted 13 June 2018 146,484 8 cents
- granted 7 August 2017 480,202 8 cents - granted 13 June 2018 146,484 12 cents
- granted 7 August 2017 480,202 12 cents - granted 13 June 2018 146,484 16 cents
- granted 7 August 2017 960,404 16 cents - granted 13 June 2018 146,484 24 cents
Total Granted 138,131,077
Exercisable at 30 June 2018 79,522,719
65
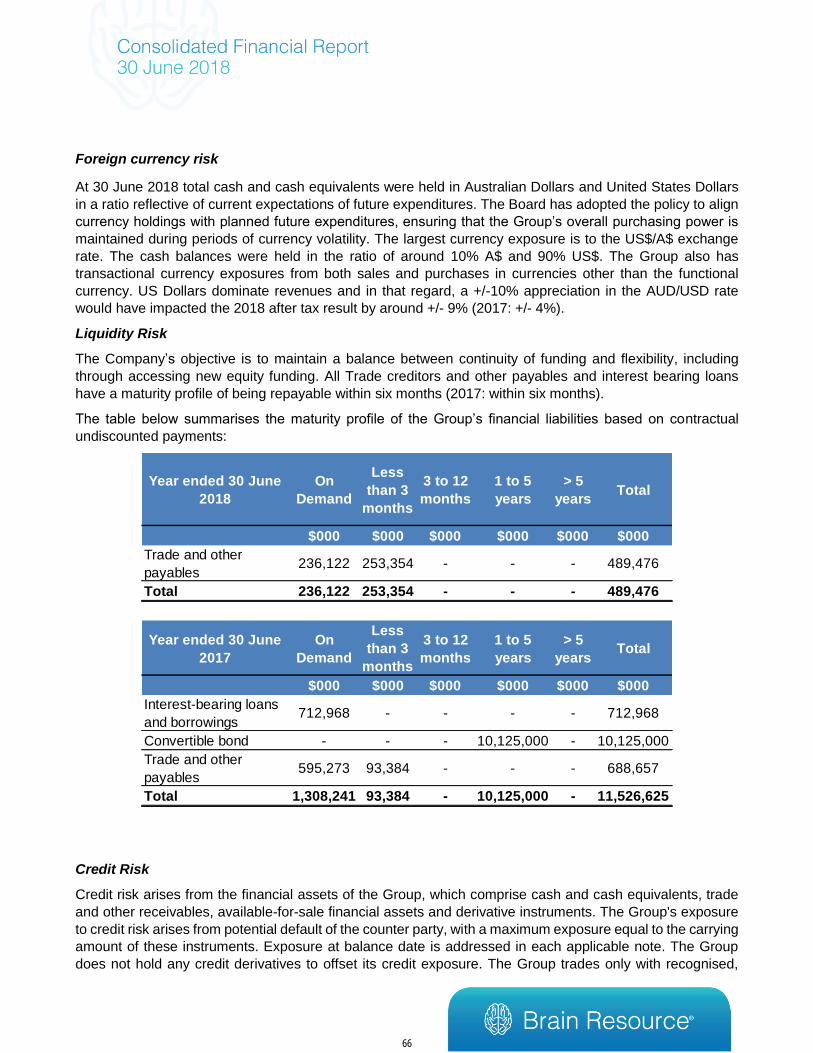
Foreign currency risk
At 30 June 2018 total cash and cash equivalents were held in Australian Dollars and United States Dollars
in a ratio reflective of current expectations of future expenditures. The Board has adopted the policy to align
currency holdings with planned future expenditures, ensuring that the Group’s overall purchasing power is
maintained during periods of currency volatility. The largest currency exposure is to the US$/A$ exchange
rate. The cash balances were held in the ratio of around 10% A$ and 90% US$. The Group also has
transactional currency exposures from both sales and purchases in currencies other than the functional
currency. US Dollars dominate revenues and in that regard, a +/-10% appreciation in the AUD/USD rate
would have impacted the 2018 after tax result by around +/- 9% (2017: +/- 4%).
Liquidity Risk
The Company’s objective is to maintain a balance between continuity of funding and flexibility, including
through accessing new equity funding. All Trade creditors and other payables and interest bearing loans
have a maturity profile of being repayable within six months (2017: within six months).
The table below summarises the maturity profile of the Group’s financial liabilities based on contractual
undiscounted payments:
Credit Risk
Credit risk arises from the financial assets of the Group, which comprise cash and cash equivalents, trade
and other receivables, available-for-sale financial assets and derivative instruments. The Group's exposure
to credit risk arises from potential default of the counter party, with a maximum exposure equal to the carrying
amount of these instruments. Exposure at balance date is addressed in each applicable note. The Group
does not hold any credit derivatives to offset its credit exposure. The Group trades only with recognised,
Year ended 30 June
2018
On
Demand
Less
than 3
months
3 to 12
months
1 to 5
years
> 5
yearsTotal
$000 $000 $000 $000 $000 $000
Trade and other
payables236,122 253,354 - - - 489,476
Total 236,122 253,354 - - - 489,476
Year ended 30 June
2017
On
Demand
Less
than 3
months
3 to 12
months
1 to 5
years
> 5
yearsTotal
$000 $000 $000 $000 $000 $000
Interest-bearing loans
and borrowings712,968 - - - - 712,968
Convertible bond - - - 10,125,000 - 10,125,000
Trade and other
payables595,273 93,384 - - - 688,657
Total 1,308,241 93,384 - 10,125,000 - 11,526,625
66

creditworthy third parties, and as such collateral is not requested nor is it the Group's policy to securitise its
trade and other receivables. Risk limits are in place and receivable balances are regularly monitored with the
result that the Group's exposure to bad debts is not significant.
27. PARENT ENTITY INFORMATION
Information relating to Brain Resource Limited, the parent
entity 2018 2017
Current assets 1,197 1,507
Total assets 21,974,397 24,052,373
Current liabilities - -
Total liabilities 192,742 8,602,373
Issued capital 58,080,520 37,516,453
Retained earnings (39,801,971)
(22,731,392)
Share-based payment reserve 3,503,106 664,939
Total Shareholder equity 21,781,655 15,450,000
Loss of the parent entity (31,609,245)
(10,507,027)
Total comprehensive loss of the parent entity (31,609,245)
(10,507,027)
Contingencies
The parent company has not entered into any guarantees in relation to the debts of its subsidiaries. As at 30
June 2018, the parent company does not hold any contingent liabilities or contractual commitments for the
acquisition of property, plant or equipment (2017: $nil)
28. CONVERTIBLE BONDS (CB)
2018 2017
Non-Current - Convertible bonds – Carrying Amount - 7,566,701
Non-Current - Convertible bonds – Fair Value - 7,566,701
(a) Terms and Risk exposures: On 14 June 2011, Brain Resource Limited agreed to issue $10,000,000 of
zero coupon unsecured Convertible bonds (100 bonds with a face value of $100,000 each), convertible
at the option of the bond holder into ordinary shares at any time prior to 14 June 2016 at an adjusted
conversion price of $0.25 per share.
(b) On 9 June 2016, Brain Resource Limited and the Bond holders agreed to extend the Convertible Bonds
maturity date by 4 years to 14 June 2020 and amend certain other terms of the Convertible Bonds. Details
of these changes, including the effect on the Company and the changes to the terms and conditions of
the Convertible Bonds, were set out in a Notice of Extraordinary General Meeting of Shareholders
(including an Explanatory Statement and an Independent Expert Report) issued by the Company on 27
April 2016 (“Notice of Meeting”) and were approved by shareholders at the Extraordinary General Meeting
held on 1 June 2016.
(c) A summary of the changes were:
67

• The final maturity date of the CBs was extended from 14 June 2016 to 14 June 2020.
• The CBs remained interest-free for the first two years of the extension (that is for two years until 14
June 2018). They then carried a coupon requiring payment of interest as follows:
o interest was 5% per annum for the second last year of the CBs (i.e. from 15 June 2018 to 14
June 2019); and (ii) interest was 7.5% per annum for the last year of the CBs (i.e. from 15
June 2019 to the maturity date of 14 June 2020).
o Interest was payable annually in arrears in cash. However, CB Holders were entitled to make
a ‘payment in kind’ election and instead capitalise the interest such that it was added to the
outstanding principal of the bonds.
o On conversion of the CBs during any year to which interest applies, CB Holders were entitled
to convert accrued interest at the same time (and at the same conversion price) as the
converted principal. Alternatively, accrued interest on the converted principal was payable in
cash.
• The CBs were secured by way of a senior, secured first-priority ranking over all of the assets of the
BRC Group. Specifically (i) each wholly-owned subsidiary of the Company guarantees the
Company’s obligations under the CBs, either by confirming the existing guarantee provided by the
subsidiary at the time of issue of the CBs, or entering into a new deed poll of guarantee; and (ii) the
Company and each wholly-owned subsidiary were to enter into a general security deed granting first-
ranking security over all of their assets in support of the Company’s obligations under the CBs as
issuer and of each subsidiary’s guarantee obligations.
o Each CB Holder was able to enforce the guarantees and security in the event of default by
the Company in discharging its obligations under the CBs. The Company had the obligation
to ensure that any new subsidiaries of the Company acceded to the security package, and
grant equivalent guarantees and security.
o The security was affected via the establishment of a security trust, with the security granted
in favour of the security trustee on behalf of CB Holders from time-to-time.
• The CBs already included extensive provisions under which the conversion price of the CBs could
be adjusted from time-to-time. As noted above, as a result of these provisions the conversion price
had recently been reduced. A new express obligation was included in the terms of the CBs under
which, any time the conversion price was to be reduced in the future: (i) the Company was obliged
to seek further shareholder approvals, so as to ensure that CBs Holders were lawfully able to convert
their CBs in full (the reduced conversion price meaning the number of shares to be issued would
increase); and (ii) the CBs Holders were entitled to immediately redeem their CBs should such
approvals not be obtained.
o In practice, the Company has to-date sought (and obtained) these approvals each time the
conversion price has been adjusted downwards.
o There were a number of other minor consequential changes to the terms of the CBs to reflect
the introduction of the coupon and the security package summarised above, and to delete
redundant references to future issues of CBs.
See the Cleansing Notice dated 9 June 2016 for further detail. Other than as set out in the Notice of
Meeting referred to above, there was no change in the effect of the offer of the Convertible Bonds on
the Company from that set out in the Cleansing Notices dated 14 June 2011 and 2 November 2011.
(d) The fair value of the liability portion of the convertible bond was estimated using an interest rate for an
instrument with similar debt terms but without the conversion option. This estimate was based on an
interest rate of 15% for the $10,000,000 Convertible Bonds.
68

(e) The Convertible Bond was converted on 14 December 2017 on the terms included in the Notice of
Extraordinary General Meeting announced on 15 November 2017. As at 14 December 2017, just before
the bond was converted, the Company was carrying a liability of $8,083,642 in respect of the bond. The
Company agreed to convert the bond in exchange for the issuance of 125,000,000 shares placed at $0.08.
The company’s share price on 14 December 2017 was $0.09. The difference between the carrying value
of the bond liability ($8,083,642) and the non-cash assets transferred (the issue of 125,000,000 ordinary
shares at their fair value of $0.09, being $11,250,000) of $3,166,358 was recognised as an expense in
the statement of profit or loss and comprehensive income.
The conversion was part of the overall re-capitalisation of the group, whereby the Company announced
on 25 October 2017 that it had secured a $10,000,000 investment by way of a placement of ordinary
shares to fund the Company’s aggressive growth plans in the USA. The fundraising was conditional on
shareholder approval of a capital restructure whereby the convertible bond (CB) holders (CB Holders) in
Company and the Exchangeable Convertible Preference Share (ECPS) holders (ECPS Holders) in
PoweringUpMBS Pty Ltd were to convert and exchange all of their rights and interest in the CB’s and
ECPS’s into ordinary shares in the Parent Company (Brain Resource Limited) and the Company would
also issue options to entities nominated by the CB Holders and ECPS Holders. The value of the options
issued were $1,660,510.
29. INVESTMENT IN JOINT VENTURE
Up until 14 December 2017, the Company had a 50% equity interest in a joint venture company,
PoweringUpMBS Pty Ltd (“PUP”, formerly known as BRC Focus Pty Ltd), established to develop a new
Attention Deficit Hyperactivity Disorder product. PUP is a private entity that is not listed on any public
exchange.
PUP had issued 4 million Exchangeable Convertible Preference Shares (ECPS) to Malta Trading Platform
Limited (an investment vehicle controlled by Och-Ziff Capital Management Group LLC) at a subscription price
of $4 million and Brain Resource owned 4 million ordinary shares in PUP and has contributed a perpetual
licence to its relevant platform content for exclusive use in the ADHD parent market.
The value of this equity interest in the joint venture was effectively based on the price paid by Malta.
The ECPS issue terms included that Malta could elect to convert the ECPS into ordinary PUP shares at a
conversion price of $1 per ECPS or exchange into ordinary Brain Resource Limited shares at an exchange
price of 20 cents. Any unconverted ECPS would automatically convert into ordinary PUP shares at $1 per
ECPS after 10 years. There were no other redemption terms other than those included within default events
and a range of anti-dilution adjustments as disclosed in our Cleansing Notice issued on 14 December 2011
and also the 2011 Notice of Annual General Meeting. The following is a broad summary of the rights and
liabilities which were attached to the ECPS:
• Conversion Rights: ECPS could be converted at any time into fully paid ordinary shares in PUP at a
conversion price of $1.00 per ordinary share with adjustments for dilutive events, including subdivision,
consolidation and reclassification, bonus issues and capital distributions.
• Exchange Rights: ECPS could be exchanged in the Company’s ordinary shares at an exchange price
of $0.20 per ordinary share in the Company with adjustments for dilutive events, including subdivision,
consolidation and reclassification, bonus issues and capital distributions. Note this exchange price was
amended in accordance with the terms of the ECPS post the most recent share placement by Brain
Resource Limited described elsewhere in the 30 June 2016 report.
69

• Ranking: The ECPS were a separate class of shares in PUP and ranked in priority to ordinary shares
in PUP in the event of a liquidation of PUP.
• Voting: ECPS carried the same rights to receive notices of general meetings and to attend general
meetings and the same voting rights as ordinary shares in PUP.
• Dividends: ECPS carried the same dividend rights as ordinary shares.
• Cancellation: Each ECPS was to be cancelled upon conversion or exchange of the ECPS.
• Default Events: The terms of the ECPS defined a broad range of events of default in relation to PUP
or the Company, including default in making payments in respect of the ECPS, default under the
Subscription and Shareholders Agreement or the terms of issue of the ECPS, detailed indebtedness
default events, insolvency events, change of control of the Company, the Company’s ordinary shares
cease to be quoted on ASX or trading is suspended for 20 consecutive days or more, litigation is
commenced against the Company or any of its subsidiaries which is likely to have a material adverse
effect and other analogous events.
• Effects of Event of Default: If an event of default occurred then an ECPS holder could require that the
ECPS held by it be redeemed by PUP or purchased by the Company at a put option price of the higher
of fair market value or 150% of the issue price of each ECPS.
• Negative Undertakings: The terms of the ECPS required approval of ECPS holders (by way of an
ordinary resolution) before PUP can undertake a detailed list of material matters unless approved by
Malta while it holds any interest in PUP.
• Pre-emptive rights: ECPS carried pre-emptive rights with respect to new issues of marketable
securities in PUP (excluding issues under an employee share and option plan approved by the board
of PUP).
• Meetings: The terms of the ECPS specified how meetings of ECPS holders could be convened and
held and allowed ECPS holders to approve amendment to the terms of the ECPS by extraordinary
resolution of ECPS holders.
Brain Resource had joint control, as defined under AASB 11, and accordingly the investment was accounted
for as a joint venture using Equity Accounting.
On 14 December 2017, the Company applied for an additional 4,000,000 $1 ordinary shares in
PoweringUpMBS Pty Ltd. At the same time, the owner of all the other shares in PoweringUpMBS Pty Ltd,
such shares being exchangeable convertible preference shares, redeemed them for $4,500,000 in exchange
for ordinary shares and options in Brain Resource Limited. At this point , PoweringUpMBS Pty Ltd became
a 100% wholly-owned subsidiary of Brain Resource Limited. Refer to Note 30 for more information.
The following table illustrates summarised financial information of the Company’s investment:
The joint venture’s statement of financial position:
14 Dec 17 30 Jun 17
Current Assets 18,654 731,569
Non-Current Assets 2,437,836 1,809,363
Current Liabilities - -
Non-Current Liabilities - -
Equity 2,456,490 2,540,932
Proportion of the Group’s ownership: 50% 50%
Carrying amount of investment at 14 Dec 17 / 30 Jun 17 1,228,245 1,270,466
70
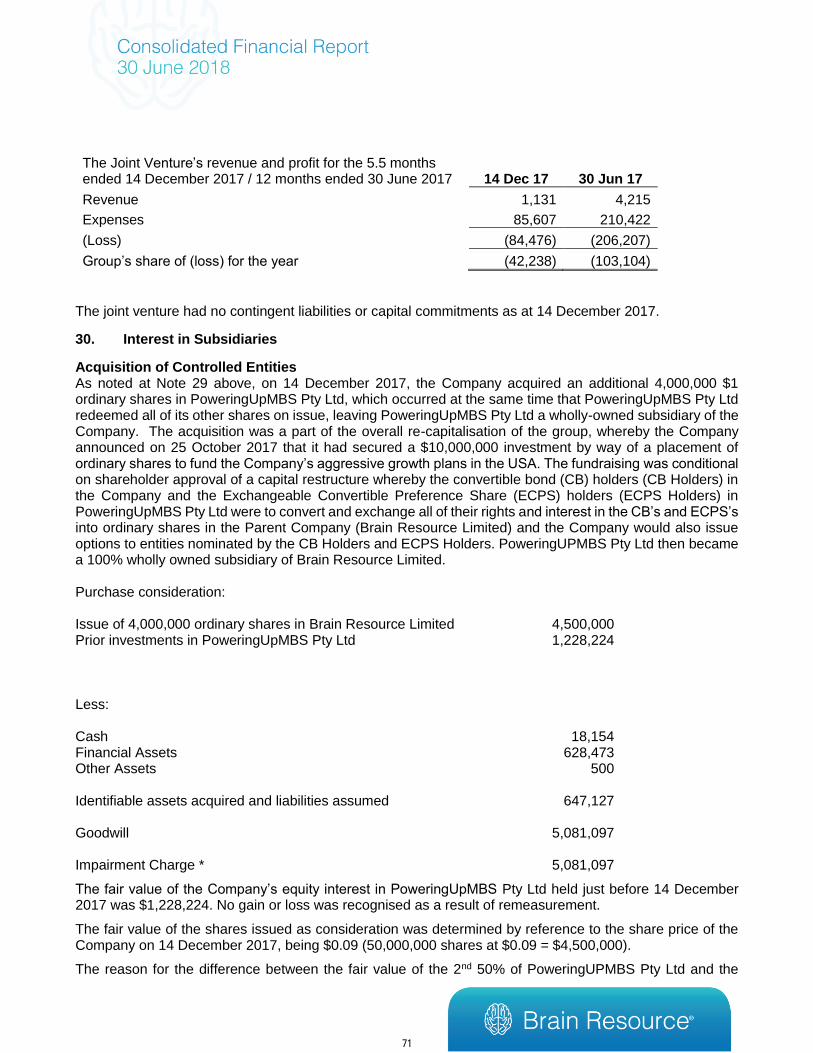
The Joint Venture’s revenue and profit for the 5.5 months ended 14 December 2017 / 12 months ended 30 June 2017 14 Dec 17 30 Jun 17
Revenue 1,131 4,215
Expenses 85,607 210,422
(Loss) (84,476) (206,207)
Group’s share of (loss) for the year (42,238) (103,104)
The joint venture had no contingent liabilities or capital commitments as at 14 December 2017.
30. Interest in Subsidiaries
Acquisition of Controlled Entities As noted at Note 29 above, on 14 December 2017, the Company acquired an additional 4,000,000 $1 ordinary shares in PoweringUpMBS Pty Ltd, which occurred at the same time that PoweringUpMBS Pty Ltd redeemed all of its other shares on issue, leaving PoweringUpMBS Pty Ltd a wholly-owned subsidiary of the Company. The acquisition was a part of the overall re-capitalisation of the group, whereby the Company announced on 25 October 2017 that it had secured a $10,000,000 investment by way of a placement of ordinary shares to fund the Company’s aggressive growth plans in the USA. The fundraising was conditional on shareholder approval of a capital restructure whereby the convertible bond (CB) holders (CB Holders) in the Company and the Exchangeable Convertible Preference Share (ECPS) holders (ECPS Holders) in PoweringUpMBS Pty Ltd were to convert and exchange all of their rights and interest in the CB’s and ECPS’s into ordinary shares in the Parent Company (Brain Resource Limited) and the Company would also issue options to entities nominated by the CB Holders and ECPS Holders. PoweringUPMBS Pty Ltd then became a 100% wholly owned subsidiary of Brain Resource Limited. Purchase consideration: Issue of 4,000,000 ordinary shares in Brain Resource Limited 4,500,000 Prior investments in PoweringUpMBS Pty Ltd 1,228,224 Less: Cash 18,154 Financial Assets 628,473 Other Assets 500 Identifiable assets acquired and liabilities assumed 647,127 Goodwill 5,081,097 Impairment Charge * 5,081,097
The fair value of the Company’s equity interest in PoweringUpMBS Pty Ltd held just before 14 December 2017 was $1,228,224. No gain or loss was recognised as a result of remeasurement.
The fair value of the shares issued as consideration was determined by reference to the share price of the Company on 14 December 2017, being $0.09 (50,000,000 shares at $0.09 = $4,500,000).
The reason for the difference between the fair value of the 2nd 50% of PoweringUPMBS Pty Ltd and the
71

consideration paid was that the ECPS holders had the right to exchange for ordinary shares at their principal value ie $4,000,000 in either Brain Resource Limited or PoweringUpMBS Pty Ltd. Brain Resource Limited effectively was required to ‘pay’ that amount to affect the transaction in accordance with the rights of the ECPS holders.
The amount of revenue and profit of PoweringUpMBS Pty Ltd included in the Consolidated Statement and Profit and Loss and Other Comprehensive Income for the 12 months ended 30 June 2018 was $124 and $124 respectively.
The amount of revenue and loss of the consolidated Group that would have been included in the Consolidated Statement and Profit and Loss and Other Comprehensive Income if the acquisition of PoweringUpMBS Pty Ltd had occurred on 1 Jul 2017 was $2,616,918 and $23,185,774 respectively.
* The Company made the decision that as part of the recapitalisation of the business to focus on selected core assets and deprioritise non-core assets. As such the Company has taken the view that the value of the assets in PoweringUPMBS Pty Ltd, which are involved in ongoing commercialisation efforts, but which are yet to deliver material outcomes for the Company, are to be impaired now at the time of recapitalisation to reflect management and resourcing priorities.
This decision arose over the March 2018 quarter after new management were able to review the current status of the commercialisation efforts and the resources required. Furthermore, the intangible assets in PoweringUPMBS Pty Ltd rely on the use of database assets which are also held on the statement of financial position of the group.
31. INTEREST-BEARING LOANS
2018 2017
Interest-bearing loans - 712,968
The loan was repayable on demand to PoweringUpMBS Pty Ltd, a joint venture in which the Company had
a 50% interest up until 14 December 2017 when it became a wholly-owned subsidiary. The interest rate
applicable to this loan equates to the interest income derived on these funds in the hands of the Group.
72

73

Directors’ Declaration
In accordance with a resolution of the Directors of Brain Resource Limited, I state that:
In the opinion of the Directors:
(a) the financial statements and notes of the Company and the consolidated entity are in accordance
with the Corporations Act 2001, including:
(i) giving a true and fair view of the Company’s and consolidated entity’s financial position as at
30 June 2018 and of their performance for the year ended on that date; and
(ii) complying with Accounting Standards (including the Australian Accounting Interpretations) and
the Corporations Regulations 2001; and
(iii) complying with International Financial Reporting Standards as issued by the International
Accounting Standards Board (as stated in Note 1(b)); and
(b) there are reasonable grounds to believe that the Company will be able to pay its debts as and when
they become due and payable.
(c) this declaration has been made after receiving the declarations required to be made to the Directors
in accordance with section 295A of the Corporations Act 2001 for the financial year ended 30 June
2018.
Signed on behalf of the Board by:
Dr Evian Gordon
Chairman of Directors
74
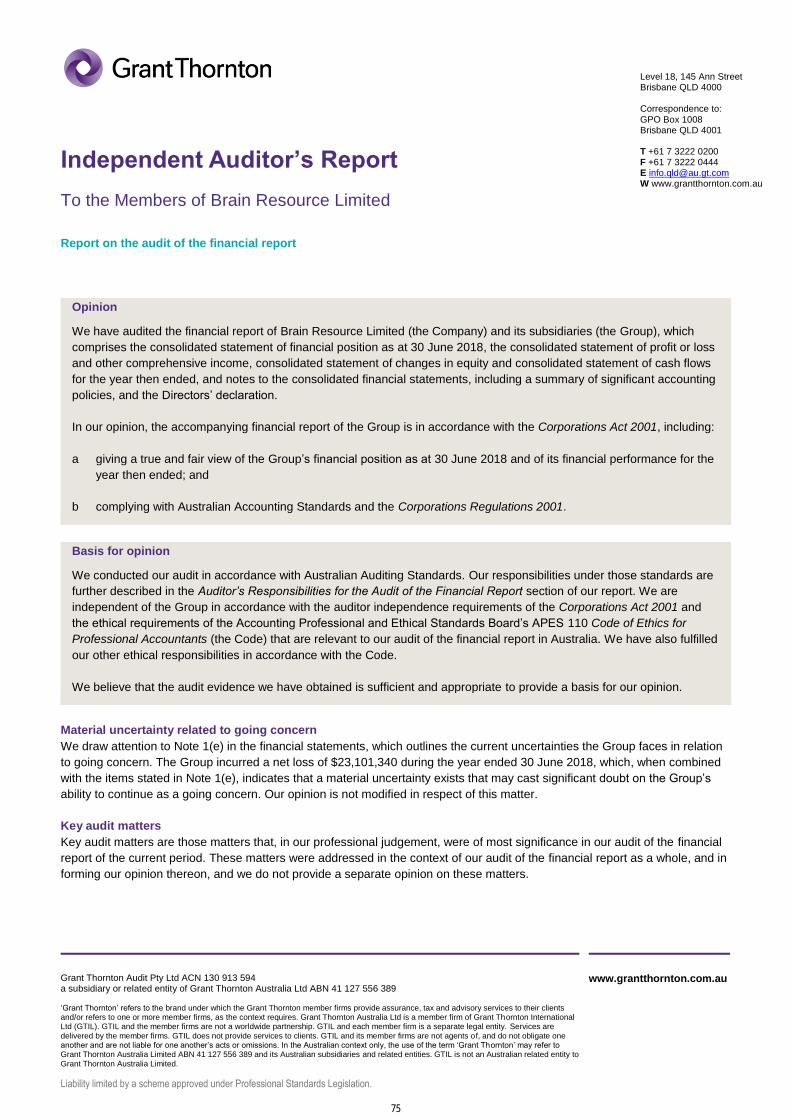
Grant Thornton Audit Pty Ltd ACN 130 913 594 a subsidiary or related entity of Grant Thornton Australia Ltd ABN 41 127 556 389
‘Grant Thornton’ refers to the brand under which the Grant Thornton member firms provide assurance, tax and advisory services to their clients and/or refers to one or more member firms, as the context requires. Grant Thornton Australia Ltd is a member firm of Grant Thornton International Ltd (GTIL). GTIL and the member firms are not a worldwide partnership. GTIL and each member firm is a separate legal entity. Services are
delivered by the member firms. GTIL does not provide services to clients. GTIL and its member firms are not agents of, and do not obligate one another and are not liable for one another’s acts or omissions. In the Australian context only, the use of the term ‘Grant Thornton’ may refer to Grant Thornton Australia Limited ABN 41 127 556 389 and its Australian subsidiaries and related entities. GTIL is not an Australian related entity to
Grant Thornton Australia Limited.
Liability limited by a scheme approved under Professional Standards Legislation.
www.grantthornton.com.au
Level 18, 145 Ann Street Brisbane QLD 4000 Correspondence to:
GPO Box 1008 Brisbane QLD 4001 T +61 7 3222 0200 F +61 7 3222 0444 E [email protected] W www.grantthornton.com.au
Independent Auditor’s Report
To the Members of Brain Resource Limited
Report on the audit of the financial report
Opinion
We have audited the financial report of Brain Resource Limited (the Company) and its subsidiaries (the Group), which
comprises the consolidated statement of financial position as at 30 June 2018, the consolidated statement of profit or loss
and other comprehensive income, consolidated statement of changes in equity and consolidated statement of cash flows
for the year then ended, and notes to the consolidated financial statements, including a summary of significant accounting
policies, and the Directors’ declaration.
In our opinion, the accompanying financial report of the Group is in accordance with the Corporations Act 2001, including:
a giving a true and fair view of the Group’s financial position as at 30 June 2018 and of its financial performance for the
year then ended; and
b complying with Australian Accounting Standards and the Corporations Regulations 2001.
Basis for opinion
We conducted our audit in accordance with Australian Auditing Standards. Our responsibilities under those standards are
further described in the Auditor’s Responsibilities for the Audit of the Financial Report section of our report. We are
independent of the Group in accordance with the auditor independence requirements of the Corporations Act 2001 and
the ethical requirements of the Accounting Professional and Ethical Standards Board’s APES 110 Code of Ethics for
Professional Accountants (the Code) that are relevant to our audit of the financial report in Australia. We have also fulfilled
our other ethical responsibilities in accordance with the Code.
We believe that the audit evidence we have obtained is sufficient and appropriate to provide a basis for our opinion.
Material uncertainty related to going concern
We draw attention to Note 1(e) in the financial statements, which outlines the current uncertainties the Group faces in relation
to going concern. The Group incurred a net loss of $23,101,340 during the year ended 30 June 2018, which, when combined
with the items stated in Note 1(e), indicates that a material uncertainty exists that may cast significant doubt on the Group’s
ability to continue as a going concern. Our opinion is not modified in respect of this matter.
Key audit matters
Key audit matters are those matters that, in our professional judgement, were of most significance in our audit of the financial
report of the current period. These matters were addressed in the context of our audit of the financial report as a whole, and in
forming our opinion thereon, and we do not provide a separate opinion on these matters.
75

In addition to the matter described in the Material Uncertainty Related to Going Concern section, we have determined the matters described below to be the key audit matters to be communicated in our report.
Key audit matter How our audit addressed the key audit matter
Group restructure including conversion of convertible bond, issue of share based payments to Och-Ziff (Note 28 Convertible Bonds) and acquisition of PoweringUpMBS including conversion of Exchangeable Convertible Preference Shares (ECPS) (Note 29)
During the year a restructure was completed which
extinguished the debt in the group, removing the variability of
conversion price in the convertible bond, and removing the
security interest held over the group’s assets.
The simplified group structure resulted in a single class of
equity securities on issue.
This restructure included various transactions settled via
equity instruments in the parent entity, Brain Resources
Limited. The key transactions were as follows:
1) Conversion of the Convertible Bond held by Och-Ziff
Group into 125,000,000 ordinary shares. This has been
accounted for as an extinguishment of an existing
instrument under AASB 132 Financial Instruments:
Presentation.
2) Acquisition of the remaining 50% of the joint venture
PoweringUpMBS Pty Ltd, resulting in it becoming a 100%
owned subsidiary of Brain Resources Limited. This was
completed via conversion of the 4,000,000 ECPS in
PoweringUpMBS held by Och-Ziff Group, in exchange for
the issue of 50,000,000 ordinary shares in Brain
Resource Limited. This has been accounted for as a step
acquisition in line with AASB 3 Business Combinations.
3) The Group issued 50,000,000 share options to Och-Ziff
Group as part of the restructure transaction, with further
options issued to KMP, which have been accounted for in
line with AASB 2 Share Based Payments.
Under AASB 3 Business Combinations, an entity must
appropriately recognise and measure the identifiable assets
and liabilities assumed as part of any business combination
and determine what information to disclose to enable users of
the financial statements to evaluate the nature and financial
effects of the business combination. This will include any
calculated gain or loss recognised under AASB 132 Financial
Instruments: Presentation, upon extinguishment of the
convertible bond and ECPS.
Significant judgement was required by management in
determining the fair value of the assets and liabilities acquired
with further complexity involved in establishing the fair value of
the consideration granted, particularly in establishing the value
of the share based payments issued as part of the
recapitalisation.
This area is a key audit matter due to the complexity of the
interlinked transactions and the significant judgements and
estimates required in determining the appropriate accounting
treatment, including determining the fair values of net assets
acquired and estimating fair value of the consideration
granted.
Our procedures included, amongst others:
• Obtaining an understanding of the transaction
through review of the related contract documents;
• Reviewing and assessing management’s accounting
entries with reference to the acquisition agreements
to ensure compliance with the relevant standards;
• Reviewing and assessing management's
identification of identifiable intangible assets and
valuation of assets and liabilities acquired;
• Recalculating the fair value of the purchase
consideration for each of the transactions and the
resulting effect on the financial statements;
• Evaluating the work of management’s experts,
including consultation with our internal valuation
specialist;
• Evaluating the treatment of the share based
payments arrangements entered into by the Group
against the requirements of AASB 2 Share based
payments;
• Evaluating the inputs used in the calculation of the
value of the options, and the mathematical accuracy
and appropriateness of the model used; and
• Assessing the adequacy of the disclosures relating to
these transactions in the financial report.
76

Key audit matter How our audit addressed the key audit matter
Intangibles impairment (Note 9)
The Group has internally generated intangible assets primarily
consisting of research databases and technology platforms,
totalling $23,146,421 prior to impairment at 30 June 2018.
AASB 136 Impairment of Assets requires that an entity shall
assess at least annually whether there is any indication that
an asset may be impaired. If any indication exists, the entity
shall estimate the recoverable amount of the asset.
Irrespective of whether indicators exist, where the intangible
assets are not yet available for use or have an indefinite useful
life, an impairment test is required annually.
This area is a key audit matter due to the inherent subjectivity
involved in Management’s judgements in estimating the
recoverable amount as part of evaluating potential impairment.
Our procedures included, amongst others:
• Obtaining Management’s impairment model and
assessing the methodology used by Management
against the requirements of Australian Accounting
Standard AASB 136 Impairment of Assets;
• Assessing Management’s determination of the
Group’s cash generating units (CGUs) based on our
understanding of the business;
• Considering the appropriateness of use of the Value
in Use (VIU) or Fair Value Less Costs to Sell
(FVLCTS) approach to determine fair value, and
Management’s decision to utilise the FVLCTS
approach;
• Evaluating the appropriateness of key assumptions
and inputs used by Management in determining fair
value;
• Considering the appropriateness of, and cross
checking the calculation of the value of the assets as
calculated by Management using alternate valuation
techniques; and
• Evaluating the adequacy of the disclosures relating
to intangible assets, impairment and fair value in the
financial report.
Information other than the financial report and auditor’s report thereon
The Directors are responsible for the other information. The other information comprises the information included in the
Group’s annual report for the year ended 30 June 2018, but does not include the financial report and our auditor’s report
thereon.
Our opinion on the financial report does not cover the other information and accordingly we do not express any form of
assurance conclusion thereon.
In connection with our audit of the financial report, our responsibility is to read the other information and, in doing so, consider
whether the other information is materially inconsistent with the financial report or our knowledge obtained in the audit or
otherwise appears to be materially misstated.
If, based on the work we have performed, we conclude that there is a material misstatement of this other information, we are
required to report that fact. We have nothing to report in this regard
Responsibilities of the Directors for the financial report
The Directors of the Company are responsible for the preparation of the financial report that gives a true and fair view in
accordance with Australian Accounting Standards and the Corporations Act 2001 and for such internal control as the Directors
determine is necessary to enable the preparation of the financial report that gives a true and fair view and is free from material
misstatement, whether due to fraud or error.
In preparing the financial report, the Directors are responsible for assessing the Group’s ability to continue as a going concern,
disclosing, as applicable, matters related to going concern and using the going concern basis of accounting unless the
Directors either intend to liquidate the Group or to cease operations, or have no realistic alternative but to do so.
Auditor’s responsibilities for the audit of the financial report
Our objectives are to obtain reasonable assurance about whether the financial report as a whole is free from material
misstatement, whether due to fraud or error, and to issue an auditor’s report that includes our opinion. Reasonable assurance
is a high level of assurance, but is not a guarantee that an audit conducted in accordance with the Australian Auditing
Standards will always detect a material misstatement when it exists. Misstatements can arise from fraud or error and are
considered material if, individually or in the aggregate, they could reasonably be expected to influence the economic decisions
of users taken on the basis of this financial report.
77

A further description of our responsibilities for the audit of the financial report is located at the Auditing and Assurance
Standards Board website at: http://www.auasb.gov.au/auditors_responsibilities/ar1.pdf. This description forms part of our
auditor’s report.
Report on the remuneration report
Opinion on the remuneration report
We have audited the Remuneration Report included in pages 20 to 28 of the directors’ report for the year ended 30 June
2018.
In our opinion, the Remuneration Report of Brain Resource Limited, for the year ended 30 June 2018, complies with
section 300A of the Corporations Act 2001.
Responsibilities
The Directors of the Company are responsible for the preparation and presentation of the Remuneration Report in accordance
with section 300A of the Corporations Act 2001. Our responsibility is to express an opinion on the Remuneration Report,
based on our audit conducted in accordance with Australian Auditing Standards.
Grant Thornton Audit Pty Ltd
Chartered Accountants
CDJ Smith
Partner – Audit & Assurance
Brisbane, 30 September 2018
78

Grant Thornton Audit Pty Ltd ACN 130 913 594 a subsidiary or related entity of Grant Thornton Australia Ltd ABN 41 127 556 389 ‘Grant Thornton’ refers to the brand under which the Grant Thornton member firms provide assurance, tax and advisory services to their clients and/or refers to one or more member firms, as the context requires. Grant Thornton Australia Ltd is a member firm of Grant Thornton International
Ltd (GTIL). GTIL and the member firms are not a worldwide partnership. GTIL and each member firm is a separate legal entity. Services are delivered by the member firms. GTIL does not provide services to clients. GTIL and its member firms are not agents of, and do not obligate one another and are not liable for one another’s acts or omissions. In the Australian context only, the use of the term ‘Grant Thornton’ may refer to
Grant Thornton Australia Limited ABN 41 127 556 389 and its Australian subsidiaries and related entities. GTIL is not an Australian related entity to Grant Thornton Australia Limited.
Liability limited by a scheme approved under Professional Standards Legislation.
www.grantthornton.com.au
Level 18, 145 Ann Street Brisbane QLD 4000 Correspondence to: GPO Box 1008 Brisbane QLD 4001 T +61 7 3222 0200 F +61 7 3222 0444 E [email protected] W www.grantthornton.com.au
Auditor’s Independence Declaration
To the Directors of Brain Resource Limited
In accordance with the requirements of section 307C of the Corporations Act 2001, as lead auditor for the audit of Brain Resource Limited for the year ended 30 June 2018, I declare that, to the best of my knowledge and belief, there have been:
a no contraventions of the auditor independence requirements of the Corporations Act 2001 in relation to the audit; and
b no contraventions of any applicable code of professional conduct in relation to the audit.
Grant Thornton Audit Pty Ltd Chartered Accountants
CDJ Smith
Partner - Audit & Assurance
Brisbane, 30 September 2018
79
80

INFORMATION RELATING TO SHAREHOLDERS AS AT 26 SEPTEMBER 2018 Substantial Shareholders Number of
Shares Percentage
HSBC CUSTODY NOMINEES (AUSTRALIA) LIMITED 146,914,757 27.7% HSBC CUSTODY NOMINEES (AUSTRALIA) LIMITED-GSCO ECA 56,439,634 10.6%
Distribution of Shareholders Number of ordinary shares held
Number of Holders
Ordinary Shares
Percentage
1 - 1,000 21 2,335 0.0 1,001 - 5,000 11 36,538 0.0 5,001 - 10,000 64 598,783 0.1 10,001 - 100,000 246 11,104,068 2.1 100,001 - and over 265 519,518,144 97.8
607 531,259,868 100.0
At the prevailing market price of 4.3 cents per share, there were 101 shareholders with less than a marketable parcel of $500. Statement of Shareholdings as at 26 September 2018 The names of the 20 largest holders of fully paid ordinary shares are listed below:
# Shareholder # Shares % Holding
1 HSBC Custody Nominees (Australia) Ltd. 146,914,757 27.7%
2 HSBC Custody Nominees (Australia) Ltd.-GSCO 56,439,634 10.6%
3 Buttonwood Nominees Pty Ltd. 19,010,630 3.6%
4 Stuttgart Pty Ltd. 17,604,735 3.3%
5 Morgan Stanley Australia Securities (Nominee) 16,606,440 3.1%
6 CS Third Nominees Pty Ltd. 12,956,480 2.4%
7 Dr. Evian Gordon 11,240,248 2.1%
8 Gleneagle Securities (Aus) Pty Ltd. 11,000,000 2.1%
9 UBS Nominees Pty Ltd. 10,250,000 1.9%
10 DBPC Group Finance Pty Ltd. 10,250,000 1.9%
11 JP Morgan Nominees Aaustralia Ltd. 9,542,586 1.8%
12 Red Star Developments Pty Ltd. 6,655,429 1.3%
13 Spinite Pty Ltd. 5,500,000 1.0%
14 Mr. Dan Segal 4,731,250 0.9%
15 Mr. Louis Gagnon 4,159,225 0.8%
16 HSBC Custody Nominees (Australia) Ltd.-A/C 2 3,753,393 0.7%
17 Ceyx Holdings Pty Ltd. 3,500,000 0.7%
18 Arch 2000 Management Pty Ltd. 3,300,000 0.6%
19 Segal Super Pty Ltd. 3,270,000 0.6%
20 Mr. David Yett 3,190,394 0.6%
Top 20 Holdings 359,875,201 67.7%
Other Holdings 171,384,667 32.3%
Fully Paid Ordinary Shares quoted on ASX 531,259,868 100.0%
81
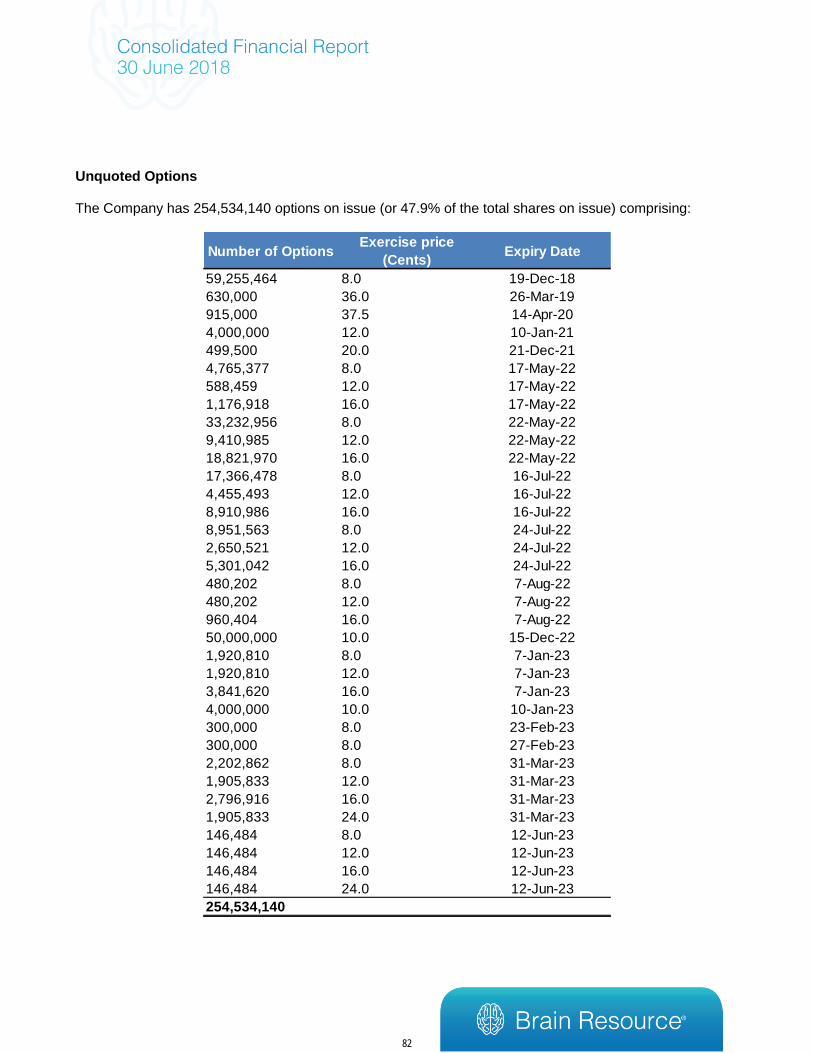
Unquoted Options The Company has 254,534,140 options on issue (or 47.9% of the total shares on issue) comprising:
Number of OptionsExercise price
(Cents)Expiry Date
59,255,464 8.0 19-Dec-18
630,000 36.0 26-Mar-19
915,000 37.5 14-Apr-20
4,000,000 12.0 10-Jan-21
499,500 20.0 21-Dec-21
4,765,377 8.0 17-May-22
588,459 12.0 17-May-22
1,176,918 16.0 17-May-22
33,232,956 8.0 22-May-22
9,410,985 12.0 22-May-22
18,821,970 16.0 22-May-22
17,366,478 8.0 16-Jul-22
4,455,493 12.0 16-Jul-22
8,910,986 16.0 16-Jul-22
8,951,563 8.0 24-Jul-22
2,650,521 12.0 24-Jul-22
5,301,042 16.0 24-Jul-22
480,202 8.0 7-Aug-22
480,202 12.0 7-Aug-22
960,404 16.0 7-Aug-22
50,000,000 10.0 15-Dec-22
1,920,810 8.0 7-Jan-23
1,920,810 12.0 7-Jan-23
3,841,620 16.0 7-Jan-23
4,000,000 10.0 10-Jan-23
300,000 8.0 23-Feb-23
300,000 8.0 27-Feb-23
2,202,862 8.0 31-Mar-23
1,905,833 12.0 31-Mar-23
2,796,916 16.0 31-Mar-23
1,905,833 24.0 31-Mar-23
146,484 8.0 12-Jun-23
146,484 12.0 12-Jun-23
146,484 16.0 12-Jun-23
146,484 24.0 12-Jun-23
254,534,140
82
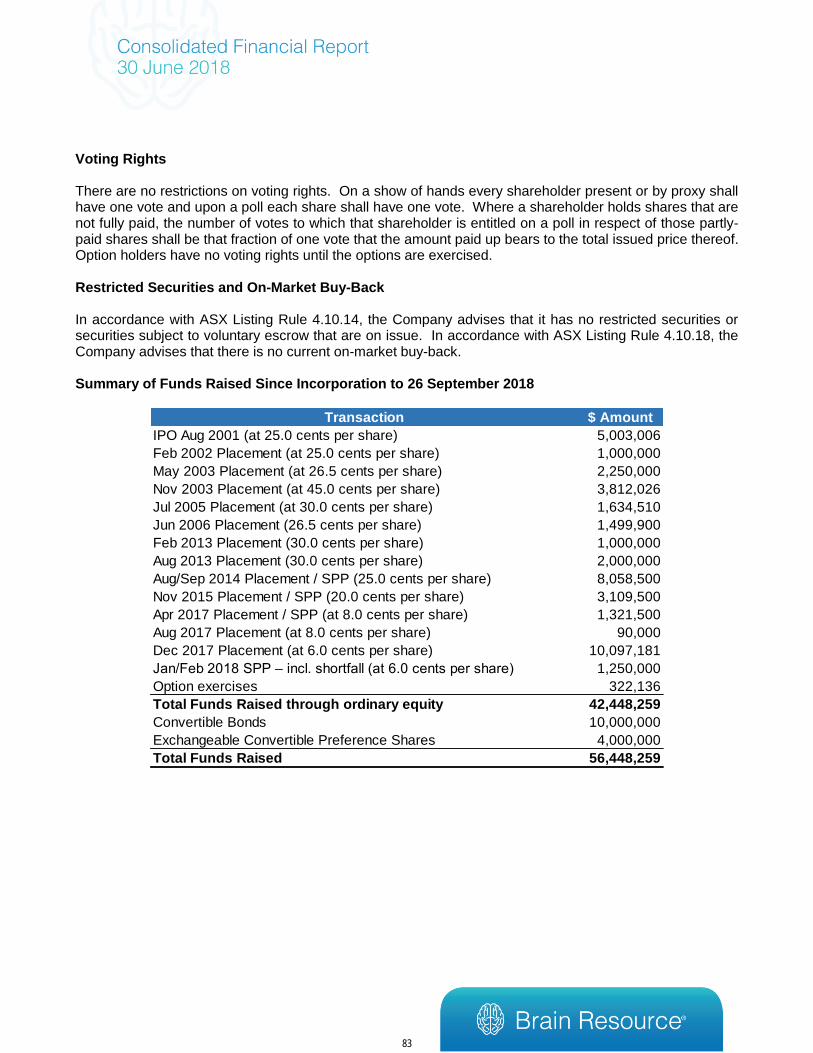
Voting Rights There are no restrictions on voting rights. On a show of hands every shareholder present or by proxy shall have one vote and upon a poll each share shall have one vote. Where a shareholder holds shares that are not fully paid, the number of votes to which that shareholder is entitled on a poll in respect of those partly-paid shares shall be that fraction of one vote that the amount paid up bears to the total issued price thereof. Option holders have no voting rights until the options are exercised. Restricted Securities and On-Market Buy-Back In accordance with ASX Listing Rule 4.10.14, the Company advises that it has no restricted securities or securities subject to voluntary escrow that are on issue. In accordance with ASX Listing Rule 4.10.18, the Company advises that there is no current on-market buy-back. Summary of Funds Raised Since Incorporation to 26 September 2018
Transaction $ Amount
IPO Aug 2001 (at 25.0 cents per share) 5,003,006
Feb 2002 Placement (at 25.0 cents per share) 1,000,000
May 2003 Placement (at 26.5 cents per share) 2,250,000
Nov 2003 Placement (at 45.0 cents per share) 3,812,026
Jul 2005 Placement (at 30.0 cents per share) 1,634,510
Jun 2006 Placement (26.5 cents per share) 1,499,900
Feb 2013 Placement (30.0 cents per share) 1,000,000
Aug 2013 Placement (30.0 cents per share) 2,000,000
Aug/Sep 2014 Placement / SPP (25.0 cents per share) 8,058,500
Nov 2015 Placement / SPP (20.0 cents per share) 3,109,500
Apr 2017 Placement / SPP (at 8.0 cents per share) 1,321,500
Aug 2017 Placement (at 8.0 cents per share) 90,000
Dec 2017 Placement (at 6.0 cents per share) 10,097,181
Jan/Feb 2018 SPP – incl. shortfall (at 6.0 cents per share) 1,250,000
Option exercises 322,136
Total Funds Raised through ordinary equity 42,448,259
Convertible Bonds 10,000,000
Exchangeable Convertible Preference Shares 4,000,000
Total Funds Raised 56,448,259
83


