Download - Brooklyn Market Report Q3 2016

The Corcoran Report
3Q16 BROOKLYN

Contents
The following members of the The Corcoran Group made significant contributions to this report:
Michele Beaulieu I Adam Eckstein I Kristy Hoffman I Ryan Schleis I Brie Train I Andrew Wachtfogel
3/7 Market Wide2 Sales3 Inventory4 Prices5 Market Share
12/13 Williamsburg & Greenpoint14/15 Brooklyn Heights, Cobble Hill, Dumbo & Downtown16/17 Park Slope & Gowanus18/19 Fort Greene, Clinton Hill & Prospect Heights20/21 Carroll Gardens, Boerum Hill & Red Hook22/23 Bedford-Stuyvesant, Crown Heights, Lefferts Gardens & Bushwick24/25 Kensington, Windsor Terrace, Ditmas Park, Flatbush & Prospect Park South26/27 South Brooklyn
Neighborhoods12/27
Resale Co-ops8Resale Condos9New Developments 10
Methodology28
Luxury & Townhouse11
Third Quarter 2016
3 Overview
2016 Overview
Sales activity realigned with the five-year
average this quarter under conditions of
rising prices. Buyers have greater options
with more listings on the market, however
the additional inventory has been largely
at the high end. Transactions are also
taking longer to complete, verified by a
higher days on market figure.
Closed sales in Brooklyn during Third
Quarter 2016 registered level with the
quarterly average over the past five years.
Closings were down 19% year-over-year,
but Third Quarter 2015 had the second
highest sales total of the last eight years.
Resale closings were down by double-digit
percentages versus last year, but were
still above the five-year average. New
development fared better than resales,
down just 5% year-over-year, as multiple
properties reached occupancy this quarter.
While there were 7% more listings
this quarter versus a year ago, not all
segments of the market had expanded
inventory. Specifically, the resale co-op
market continued to have constricted
inventory, and was the main driver of the
sharp decline in listings under $350,000
this quarter. New development listings
increased by 40% year-over-year,
which helped contribute to a 24% rise in
inventory over $2,000,000.
With the assistance of new development
sales, new price records were set again this
quarter. The median price of all Brooklyn
Brooklyn 3Q16 3Q15 % Chg (yr) 2Q16 % Chg (qtr)
Overview
Closed Sales 1,162 1,434 -19% 1,248 -7%
Contracts Signed 741 792 -6% 884 -16%
Inventory 2,236 2,096 7% 2,322 -4%
Months of Supply 5.3 4.7 13% 5.3 1%
Average Days on Market 67 58 16% 65 3%
Prices
Median Price $675K $570K 18% $599K 13%
Average Price $926K $728K 27% $756K 22%
Median PPSF $908 $877 4% $904 0%
Average PPSF $950 $845 12% $887 7%
Median Price by Bedroom
Studio $455K $405K 12% $450K 1%
1 Bedroom $610K $585K 4% $630K -3%
2 Bedroom $995K $990K 1% $997K 0%
3+ Bedroom $1.850M $1.745M 6% $1.540M 20%
apartment sales was $675,000, the
highest figure seen in over eight years.
Average price per square foot grew 13%
3Q Corcoran Report
CLOSED SALES
0
300
600
900
1,200
1,500
1,800
Nu
mb
er o
f C
lose
d S
ales
1Q10
2Q
10
3Q
10
4Q
10
1Q11
2Q
11
3Q
11
4Q
11
1Q12
2Q
12
3Q
12
4Q
12
1Q13
2Q
13
3Q
13
4Q
13
1Q14
2Q
14
3Q
14
4Q
14
1Q15
2Q
15
3Q
15
4Q
15
1Q16
2Q
16
3Q
16
The Corcoran Group I p 3
year-over-year to $951 per square foot,
and surpassed the previous high set just
last quarter.
3Q 2016BROOKLYN CORCORAN REPORT
Market WideSalesThere were 1,162 closings in Brooklyn this
quarter, 19% lower than last year but level
with the trailing five-year average. The
year-over-year decline was exaggerated
by a strong Third Quarter 2015, the second
strongest quarter for closed sales since
Second Quarter 2010. A decrease in lower
priced listings likely contributed to the
drop in sales, since higher priced inventory
typically takes longer to absorb.
Sales of all property types were lower than
Third Quarter 2015, and resale co-ops had
the largest annual decline. Likely caused
by constricted co-op inventory in recent
quarters, sales in this segment were 27%
below last year and 9% below last quarter.
Resale condo closed sales were down 13%
year-over-year but 6% higher than last
quarter; this was the only property type
to have a quarterly sales increase. New
development sales were only down 5%
from the same time last year, but were 33%
lower than last quarter when several mid-
sized properties commenced closings.
Reported signed contract activity declined
as well, but by a more modest 6% year-over-
year. Last year, several new developments
helped bolster contract activity such as 550
Vanderbilt, the first condominium offering
at Pacific Park and the best-selling new
development project of 2015. Third Quarter
had 16% fewer contracts signed compared
to Second Quarter 2016.
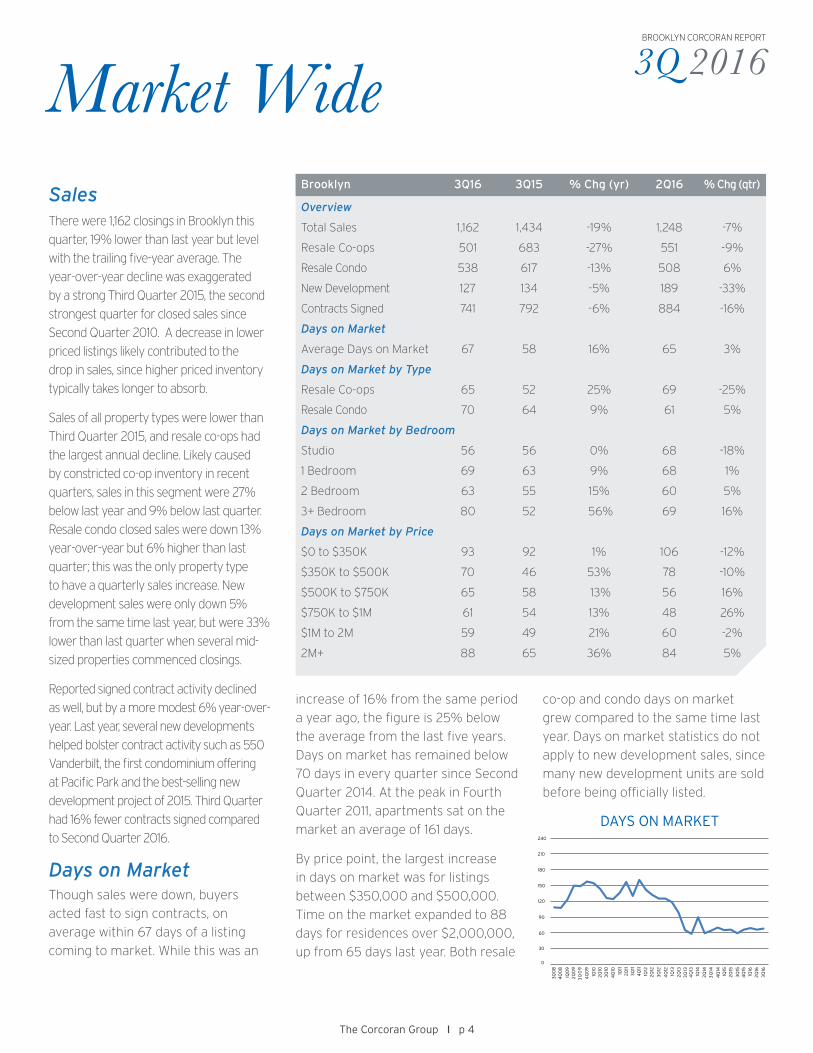
Days on Market Though sales were down, buyers
acted fast to sign contracts, on
average within 67 days of a listing
coming to market. While this was an
increase of 16% from the same period
a year ago, the figure is 25% below
the average from the last five years.
Days on market has remained below
70 days in every quarter since Second
Quarter 2014. At the peak in Fourth
Quarter 2011, apartments sat on the
market an average of 161 days.
By price point, the largest increase
in days on market was for listings
between $350,000 and $500,000.
Time on the market expanded to 88
days for residences over $2,000,000,
up from 65 days last year. Both resale
The Corcoran Group I p 4
Brooklyn 3Q16 3Q15 % Chg (yr) 2Q16 % Chg (qtr)
Overview
Total Sales 1,162 1,434 -19% 1,248 -7%
Resale Co-ops 501 683 -27% 551 -9%
Resale Condo 538 617 -13% 508 6%
New Development 127 134 -5% 189 -33%
Contracts Signed 741 792 -6% 884 -16%
Days on Market
Average Days on Market 67 58 16% 65 3%
Days on Market by Type
Resale Co-ops 65 52 25% 69 -25%
Resale Condo 70 64 9% 61 5%
Days on Market by Bedroom
Studio 56 56 0% 68 -18%
1 Bedroom 69 63 9% 68 1%
2 Bedroom 63 55 15% 60 5%
3+ Bedroom 80 52 56% 69 16%
Days on Market by Price
$0 to $350K 93 92 1% 106 -12%
$350K to $500K 70 46 53% 78 -10%
$500K to $750K 65 58 13% 56 16%
$750K to $1M 61 54 13% 48 26%
$1M to 2M 59 49 21% 60 -2%
2M+ 88 65 36% 84 5%
co-op and condo days on market
grew compared to the same time last
year. Days on market statistics do not
apply to new development sales, since
many new development units are sold
before being officially listed.
0
30
60
90
120
150
180
210
240
3Q
08
4Q
08
1Q0
92
Q0
93
Q0
9
4Q
09
1Q10
2Q
103
Q10
4Q
10
1Q11
2Q
113
Q11
4Q
11
1Q12
2Q
12
3Q
12
4Q
12
1Q13
2Q
133
Q13
4Q
13
1Q14
2Q
14
3Q
14
4Q
141Q
152
Q15
3Q
154
Q15
1Q16
2Q
16
3Q
16
DAYS ON MARKET
3Q 2016BROOKLYN CORCORAN REPORT
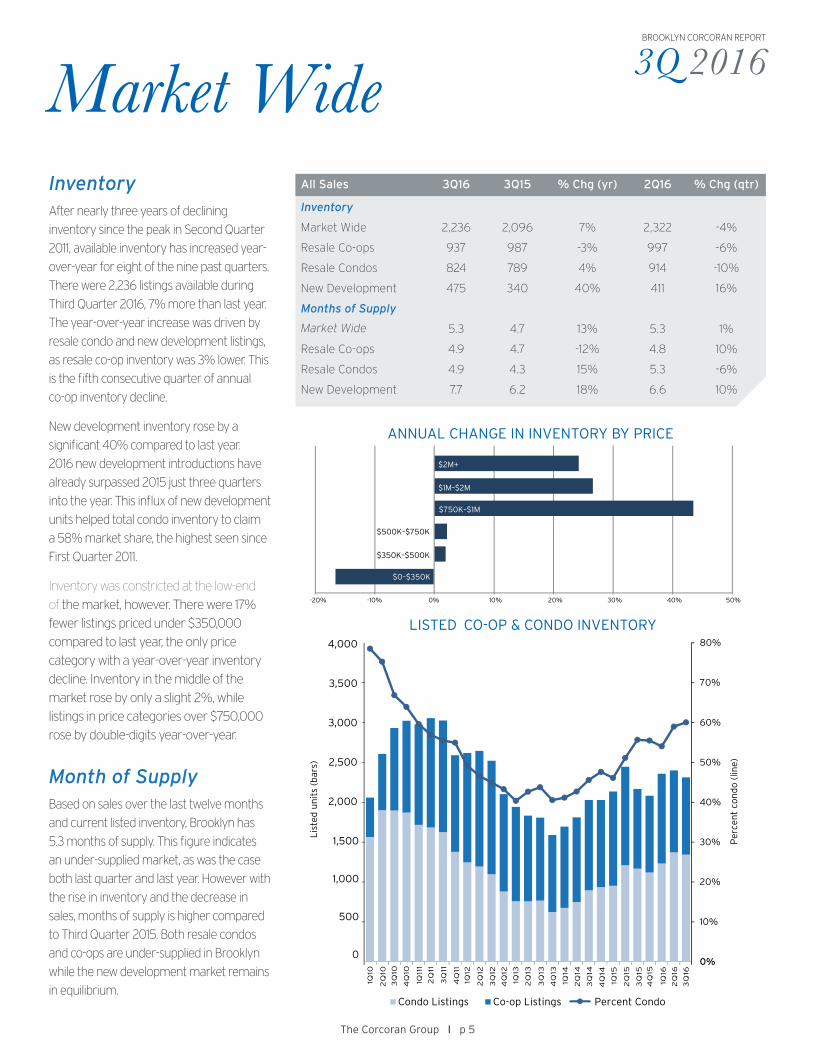
Market WideInventoryAfter nearly three years of declining
inventory since the peak in Second Quarter
2011, available inventory has increased year-
over-year for eight of the nine past quarters.
There were 2,236 listings available during
Third Quarter 2016, 7% more than last year.
The year-over-year increase was driven by
resale condo and new development listings,
as resale co-op inventory was 3% lower. This
is the fifth consecutive quarter of annual
co-op inventory decline.
New development inventory rose by a
significant 40% compared to last year.
2016 new development introductions have
already surpassed 2015 just three quarters
into the year. This influx of new development
units helped total condo inventory to claim
a 58% market share, the highest seen since
First Quarter 2011.
Inventory was constricted at the low-end
of the market, however. There were 17%
fewer listings priced under $350,000
compared to last year, the only price
category with a year-over-year inventory
decline. Inventory in the middle of the
market rose by only a slight 2%, while
listings in price categories over $750,000
rose by double-digits year-over-year.
Month of SupplyBased on sales over the last twelve months
and current listed inventory, Brooklyn has
5.3 months of supply. This figure indicates
an under-supplied market, as was the case
both last quarter and last year. However with
the rise in inventory and the decrease in
sales, months of supply is higher compared
to Third Quarter 2015. Both resale condos
and co-ops are under-supplied in Brooklyn
while the new development market remains
in equilibrium.
The Corcoran Group I p 5
All Sales 3Q16 3Q15 % Chg (yr) 2Q16 % Chg (qtr)
Inventory
Market Wide 2,236 2,096 7% 2,322 -4%
Resale Co-ops 937 987 -3% 997 -6%
Resale Condos 824 789 4% 914 -10%
New Development 475 340 40% 411 16%
Months of Supply
Market Wide 5.3 4.7 13% 5.3 1%
Resale Co-ops 4.9 4.7 -12% 4.8 10%
Resale Condos 4.9 4.3 15% 5.3 -6%
New Development 7.7 6.2 18% 6.6 10%
0%
10%
20%
30%
40%
50%
60%
70%
80%
Per
cen
t co
ndo
(lin
e)
Lis
ted
un
its
(bar
s)
2Q
11
3Q
11
4Q
11
1Q12
2Q
12
3Q
12
4Q
12
1Q13
2Q
13
3Q
13
1Q14
2Q
14
3Q
14
4Q
14
1Q15
2Q
15
3Q
15
4Q
15
1Q16
2Q
16
4Q
13
1Q10
2Q
10
3Q
10
4Q
10
1Q11
1
1,500
1,000
500
0
2,000
2,500
3,000
3,500
4,000
Condo Listings Co-op Listings Percent Condo
3Q
16
-20% 30% 40%
$0–$350K
$350K–$500K
$500K–$750K
$750K–$1M
$1M–$2M
$2M+
50%-10% 0% 20%10%
LISTED CO-OP & CONDO INVENTORY
ANNUAL CHANGE IN INVENTORY BY PRICE
3Q 2016BROOKLYN CORCORAN REPORT
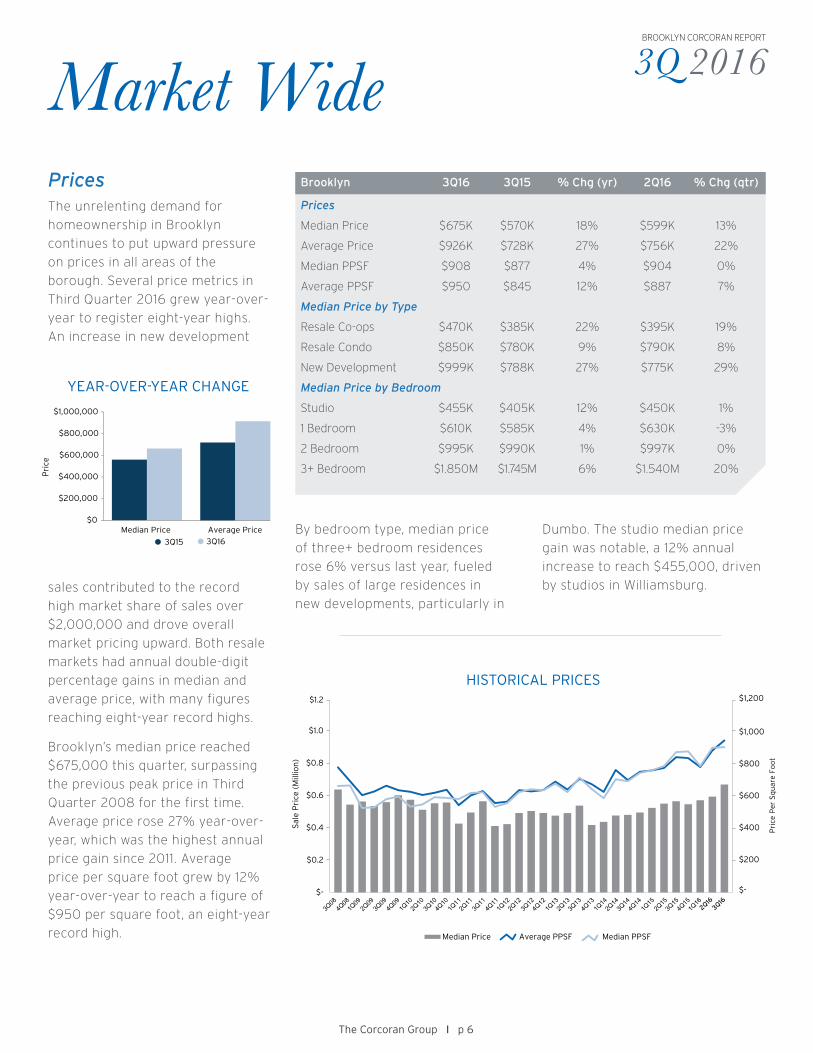
Market WidePricesThe unrelenting demand for
homeownership in Brooklyn
continues to put upward pressure
on prices in all areas of the
borough. Several price metrics in
Third Quarter 2016 grew year-over-
year to register eight-year highs.
An increase in new development
$-
$200
$400
$600
$800
$1,000
$1,200
$-
$0.2
$0.4
$0.6
$0.8
$1.0
$1.2
Pri
ce P
er S
qu
are
Foo
t
Sal
e P
rice
(M
illio
n)
Median Price Average PPSF Median PPSF
2Q163Q16
HISTORICAL PRICES
The Corcoran Group I p 6
Brooklyn 3Q16 3Q15 % Chg (yr) 2Q16 % Chg (qtr)
Prices
Median Price $675K $570K 18% $599K 13%
Average Price $926K $728K 27% $756K 22%
Median PPSF $908 $877 4% $904 0%
Average PPSF $950 $845 12% $887 7%
Median Price by Type
Resale Co-ops $470K $385K 22% $395K 19%
Resale Condo $850K $780K 9% $790K 8%
New Development $999K $788K 27% $775K 29%
Median Price by Bedroom
Studio $455K $405K 12% $450K 1%
1 Bedroom $610K $585K 4% $630K -3%
2 Bedroom $995K $990K 1% $997K 0%
3+ Bedroom $1.850M $1.745M 6% $1.540M 20%
sales contributed to the record
high market share of sales over
$2,000,000 and drove overall
market pricing upward. Both resale
markets had annual double-digit
percentage gains in median and
average price, with many figures
reaching eight-year record highs.
Brooklyn’s median price reached
$675,000 this quarter, surpassing
the previous peak price in Third
Quarter 2008 for the first time.
Average price rose 27% year-over-
year, which was the highest annual
price gain since 2011. Average
price per square foot grew by 12%
year-over-year to reach a figure of
$950 per square foot, an eight-year
record high.
YEAR-OVER-YEAR CHANGE
$0
$200,000
$400,000
$600,000
$800,000
$1,000,000
Pri
ce
Median Price Average Price
3Q15 3Q16By bedroom type, median price
of three+ bedroom residences
rose 6% versus last year, fueled
by sales of large residences in
new developments, particularly in
Dumbo. The studio median price
gain was notable, a 12% annual
increase to reach $455,000, driven
by studios in Williamsburg.
$-
$200
$400
$600
$800
$1,000
$1,200
$-
$0.2
$0.4
$0.6
$0.8
$1.0
$1.2
Pri
ce P
er S
qu
are
Foo
t
Sal
e P
rice
(M
illio
n)
Median Price Average PPSF Median PPSF

3Q 2016BROOKLYN CORCORAN REPORT
Market WideMarket ShareComparing the market share of sales to active listings yields notable differences that can affect buyer’s searches and seller’s sales
efforts, as supply and demand may or may not match. Here we compare market share of sales and inventory by various measures.
The Corcoran Group I p 7
Williamsburg/Greenpoint
Brooklyn Heights/Cobble Hill/Dumbo/Downtown
Fort Greene/Clinton Hill/Prospect Heights
Carroll Gardens/Boerum
Hill/Red Hook Bedford–Stuyvesant/Crown Heights/Lefferts Gardens/Bushwick
Park Slope/Gowanus
NEIGHBORHOOD
PROPERTY TYPE
Price PointNotable shifts in market share occurred
at both the high-end and low-end of the
market compared to last year. The most
notable changes were for residences
under $350,000, which lost 8% of their
market share. Sales over $1,000,000
claimed an additional 9% market share.
BEDROOMS
19%
15%
22%
15%
22%
7%
1Q16 Price Point Comparison
0-350K
350K-500k
500K-750K
750K-1MM
1MM-2MM
2MM+
27%
16%
23%
14%
17%
3%
0-350K
350K-500k
500K-750K
750K-1MM
1MM-2MM
2MM+
24%
14%
19%
17%
18%
8%
Inventory Price Point Comparison
0-350K
350K-500k
500K-750K
750K-1MM
1MM-2MM
2MM+
PRICE POINT
5%
35%
40%
19%
4Q15 Bedroom Comparison
Studio
1 Bed
2 Bed
3+ Beds
8%
39%41%
12%
Studio
1 Bed
2 Bed
3+ Beds
7%
34%
40%
18%
Studio
1 Bed
2 Bed
3+ Beds
11%
20%
9%
10%8%
8%
8%
26%
4Q15 Neighborhood Sales Comparison
Zone 1
Zone 2
Zone 3
Zone 4
Zone 5
Zone 6
Zone 7
Zone 8
13%
14%
9%
11%6%7%
7%
34%
4Q14 Neighborhood Sales Comparison
Zone 1
Zone 2
Zone 3
Zone 4
Zone 5
Zone 6
Zone 7
Zone 8
16%
9%
8%
7%4%
7%9%
41%
Inventory Neighborhood Sales Comparison
Zone 1
Zone 2
Zone 3
Zone 4
Zone 5
Zone 6
Zone 7
Zone 8
Under $0-$350K $350K-$500K $750K-$1M$500K-$750K $2M+$1M-$2M
Studio 1 Bedroom 3+ Bedroom2 Bedroom
Resale Condo Resale Co-op New Dev
BedroomsMarket share for both studios and one
bedrooms shrank this quarter versus last
year. Three+ bedrooms captured 19% of
sales this quarter, compared to 12% last
year. Market share of sales and inventory
were equal for two bedrooms, but
differed slightly for all other types.
Property TypeResale condos captured a larger share
of sales this quarter while resale co-ops
lost market share. New development
sales claimed 10% of buyers, slightly
more than last year but far below
the 21% market share of listed new
development inventory.
NeighborhoodMost neighborhoods had moderate
year-over-year shifts in market share,
with changes ranging between 1% and
2%. The neighborhood encompassing
Brooklyn Heights, Cobble Hill, Dumbo
and Downtown Brooklyn claimed 20%
of sales, up from 14% last year.
46%
43%
10%
4Q15 Property Type Comparison
Resale Condo
Resale Co-op
New Development
43%
48%
9%
37%
42%
21%
2Q16
2Q16
Kensington/Windsor Terrace/Ditmas Park/Flatbush/ Prospect Park South
South Brooklyn
INVENTORY
19%
15%
22%
15%
22%
7%
1Q16 Price Point Comparison
0-350K
350K-500k
500K-750K
750K-1MM
1MM-2MM
2MM+
27%
16%
23%
14%
17%
3%
0-350K
350K-500k
500K-750K
750K-1MM
1MM-2MM
2MM+
24%
14%
19%
17%
18%
8%
Inventory Price Point Comparison
0-350K
350K-500k
500K-750K
750K-1MM
1MM-2MM
2MM+
19%
15%
22%
15%
22%
7%
1Q16 Price Point Comparison
0-350K
350K-500k
500K-750K
750K-1MM
1MM-2MM
2MM+
27%
16%
23%
14%
17%
3%
0-350K
350K-500k
500K-750K
750K-1MM
1MM-2MM
2MM+
24%
14%
19%
17%
18%
8%
Inventory Price Point Comparison
0-350K
350K-500k
500K-750K
750K-1MM
1MM-2MM
2MM+
INVENTORY2Q152Q165%
35%
40%
19%
4Q15 Bedroom Comparison
Studio
1 Bed
2 Bed
3+ Beds
8%
39%41%
12%
Studio
1 Bed
2 Bed
3+ Beds
7%
34%
40%
18%
Studio
1 Bed
2 Bed
3+ Beds
5%
35%
40%
19%
4Q15 Bedroom Comparison
Studio
1 Bed
2 Bed
3+ Beds
8%
39%41%
12%
Studio
1 Bed
2 Bed
3+ Beds
7%
34%
40%
18%
Studio
1 Bed
2 Bed
3+ Beds
INVENTORY2Q152Q16
46%
43%
10%
4Q15 Property Type Comparison
Resale Condo
Resale Co-op
New Development
43%
48%
9%
37%
42%
21%
46%
43%
10%
4Q15 Property Type Comparison
Resale Condo
Resale Co-op
New Development
43%
48%
9%
37%
42%
21%
INVENTORY
11%
20%
9%
10%8%
8%
8%
26%
4Q15 Neighborhood Sales Comparison
Zone 1
Zone 2
Zone 3
Zone 4
Zone 5
Zone 6
Zone 7
Zone 8
13%
14%
9%
11%6%7%
7%
34%
4Q14 Neighborhood Sales Comparison
Zone 1
Zone 2
Zone 3
Zone 4
Zone 5
Zone 6
Zone 7
Zone 8
16%
9%
8%
7%4%
7%9%
41%
Inventory Neighborhood Sales Comparison
Zone 1
Zone 2
Zone 3
Zone 4
Zone 5
Zone 6
Zone 7
Zone 8
2Q15
2Q15
3Q 2016BROOKLYN CORCORAN REPORT
Resale Co-opsResale co-op closings were 27%
lower year-over-year and 9% lower
than Second Quarter. The large
decline in sales was skewed partially
due to last year’s near record high
quarter for resale co-op activity,
but was also the result of declining
inventory. Inventory has declined
year-over-year in the resale co-op
market for the past five quarters.
Sales were adequate enough to
keep the resale co-op market under-
supplied at 4.9 months of supply.
Resale co-op buyers signed contracts
within an average of 65 days of a
unit being listed up, from 52 days a
year ago.
$0
$200
$400
$600
$800
$-
$0.2
$0.4
$0.6
$0.8
Pri
ce P
er S
qu
are
Foo
t
Sal
e P
rice
(M
illio
n)
Median Price Average PPSF Median PPSF
2Q16
3Q16
RESALE CO-OP HISTORICAL PRICES
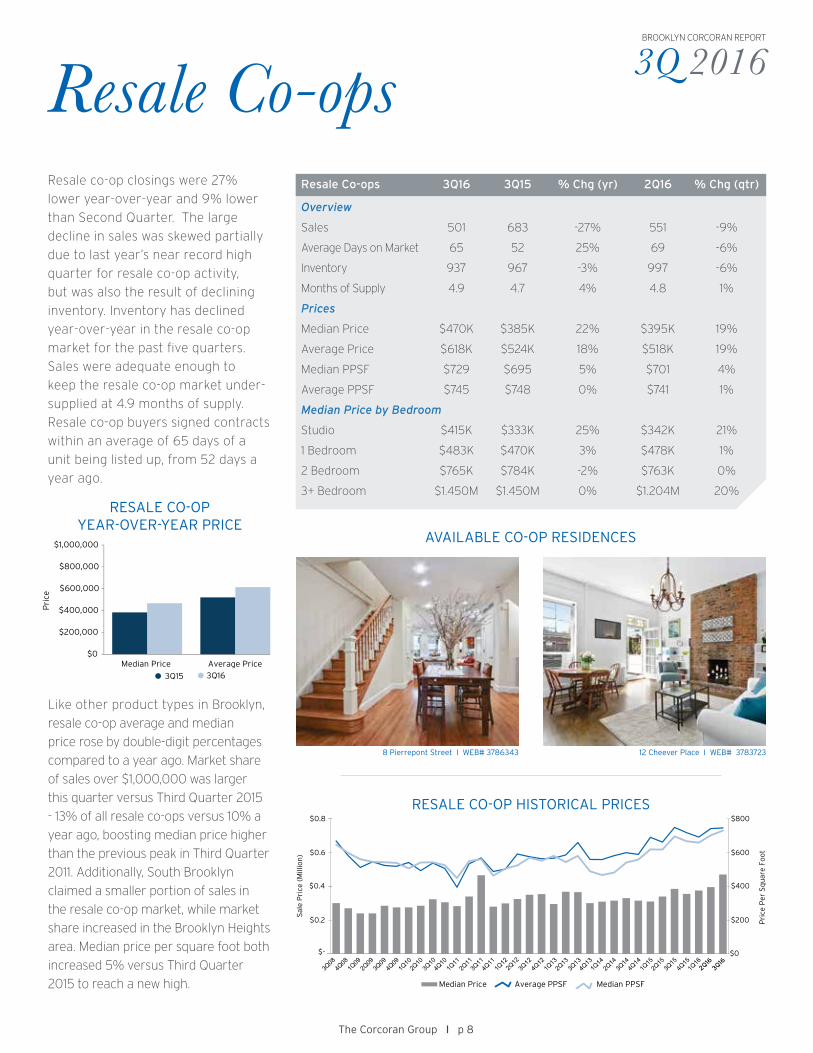
8 Pierrepont Street I WEB# 3786343 12 Cheever Place I WEB# 3783723
The Corcoran Group I p 8
Resale Co-ops 3Q16 3Q15 % Chg (yr) 2Q16 % Chg (qtr)
Overview
Sales 501 683 -27% 551 -9%
Average Days on Market 65 52 25% 69 -6%
Inventory 937 967 -3% 997 -6%
Months of Supply 4.9 4.7 4% 4.8 1%
Prices
Median Price $470K $385K 22% $395K 19%
Average Price $618K $524K 18% $518K 19%
Median PPSF $729 $695 5% $701 4%
Average PPSF $745 $748 0% $741 1%
Median Price by Bedroom
Studio $415K $333K 25% $342K 21%
1 Bedroom $483K $470K 3% $478K 1%
2 Bedroom $765K $784K -2% $763K 0%
3+ Bedroom $1.450M $1.450M 0% $1.204M 20%
Like other product types in Brooklyn,
resale co-op average and median
price rose by double-digit percentages
compared to a year ago. Market share
of sales over $1,000,000 was larger
this quarter versus Third Quarter 2015
- 13% of all resale co-ops versus 10% a
year ago, boosting median price higher
than the previous peak in Third Quarter
2011. Additionally, South Brooklyn
claimed a smaller portion of sales in
the resale co-op market, while market
share increased in the Brooklyn Heights
area. Median price per square foot both
increased 5% versus Third Quarter
2015 to reach a new high.
RESALE CO-OPYEAR-OVER-YEAR PRICE
$0
$200,000
$400,000
$600,000
$800,000
$1,000,000
Pri
ce
Median Price Average Price
3Q15 3Q16
AVAILABLE CO-OP RESIDENCES
3Q 2016BROOKLYN CORCORAN REPORT
Resale CondosClosed sale activity in the resale
market was 13% below last year’s
record high level, however, sales this
quarter were 20% above the trailing-
five year average. The resale condo
market continues to be strong despite
an increase in new development
introductions in recent quarters.
Strong sales coupled with just a 4%
rise in resale condo inventory led to an
under-supplied market at 5.0 months
of supply.
RESALE CONDOS HISTORICAL PRICES
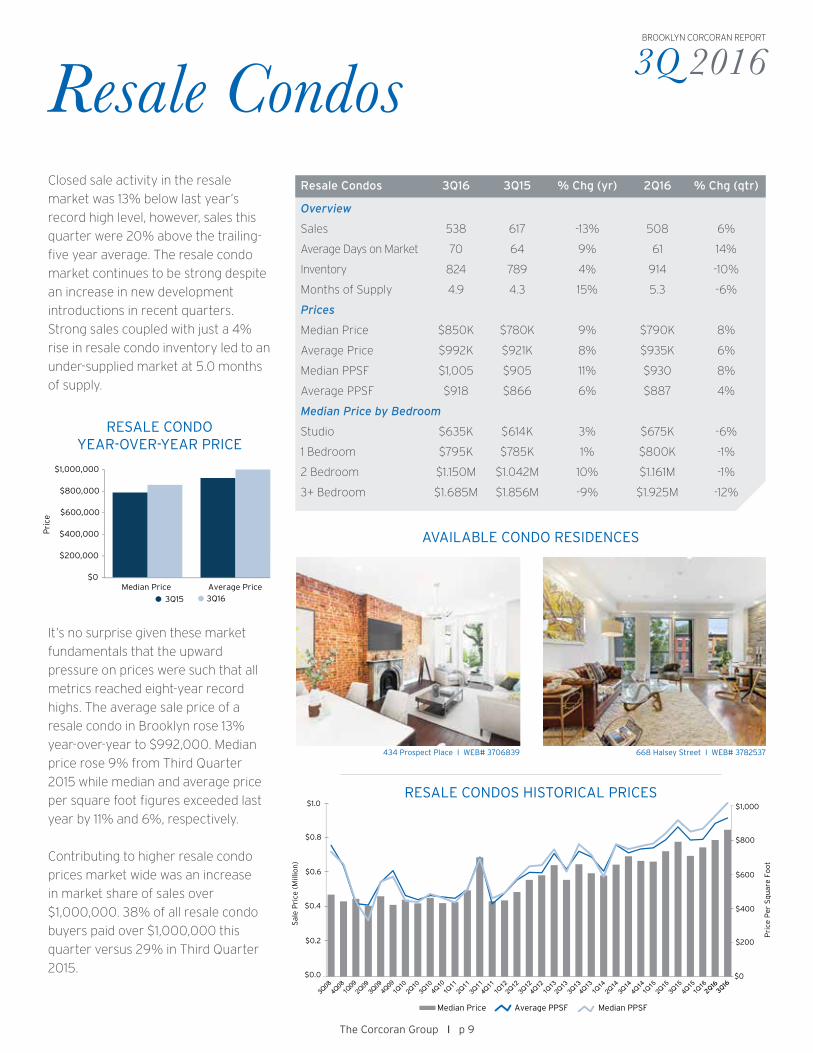
434 Prospect Place I WEB# 3706839 668 Halsey Street I WEB# 3782537
The Corcoran Group I p 9
Resale Condos 3Q16 3Q15 % Chg (yr) 2Q16 % Chg (qtr)
Overview
Sales 538 617 -13% 508 6%
Average Days on Market 70 64 9% 61 14%
Inventory 824 789 4% 914 -10%
Months of Supply 4.9 4.3 15% 5.3 -6%
Prices
Median Price $850K $780K 9% $790K 8%
Average Price $992K $921K 8% $935K 6%
Median PPSF $1,005 $905 11% $930 8%
Average PPSF $918 $866 6% $887 4%
Median Price by Bedroom
Studio $635K $614K 3% $675K -6%
1 Bedroom $795K $785K 1% $800K -1%
2 Bedroom $1.150M $1.042M 10% $1.161M -1%
3+ Bedroom $1.685M $1.856M -9% $1.925M -12%
It’s no surprise given these market
fundamentals that the upward
pressure on prices were such that all
metrics reached eight-year record
highs. The average sale price of a
resale condo in Brooklyn rose 13%
year-over-year to $992,000. Median
price rose 9% from Third Quarter
2015 while median and average price
per square foot figures exceeded last
year by 11% and 6%, respectively.
Contributing to higher resale condo
prices market wide was an increase
in market share of sales over
$1,000,000. 38% of all resale condo
buyers paid over $1,000,000 this
quarter versus 29% in Third Quarter
2015. $0
$200
$400
$600
$800
$0.0
$0.2
$0.4
$0.6
$0.8
Pri
ce P
er S
qu
are
Foo
t
Sal
e P
rice
(M
illio
n)
Median Price Average PPSF Median PPSF
$1,000 $1.0
2Q163Q16
$0
$200,000
$400,000
$600,000
$800,000
$1,000,000
Pri
ce
Median Price Average Price
3Q15 3Q16
RESALE CONDOYEAR-OVER-YEAR PRICE
AVAILABLE CONDO RESIDENCES

3Q 2016BROOKLYN CORCORAN REPORT
New DevelopmentsThere was a slight dip in new
development closings compared
to last year and following a robust
Second Quarter, sales of new product
were lower than last quarter. Several
new developments were ready for
occupancy toward the end of Third
Quarter 2016 and are expected to
continue to close through the end of
the year.
The Corcoran Group I p 10
New Developments 3Q16 3Q15 % Chg (yr) 2Q16 % Chg (qtr)
Sales 127 134 -5% 189 -33%
Inventory 475 340 40% 411 16%
Months of Supply 7.7 6.2 25% 6.6 17%
Prices
Median Price $999K $788K 27% $775K 29%
Average Price $1.713M $1.011M 69% $966K 77%
Median PPSF $986 $1,065 -7% $1,011 -2%
Average PPSF $1,202 $1,132 6% $857 40%
Median Price by Bedroom
Studio $588K $426K 38% $599K -2%
1 Bedroom $528K $570K -7% $670K -21%
2 Bedroom $1.200M $1.465M -18% $1.185M 1%
3+ Bedroom $3.300M $2.087M 58% $1.368M 141%
Listed inventory in new developments
increased versus both last quarter and
last year. New development inventory
was 40% higher than Third Quarter
2015. Fueling the rise in inventory
were large-scale new development
introductions such as Austin Nichols
House, which is the largest project to
launch for sale in Brooklyn since 2008.
Year-over-year price increases this
quarter were substantial, credited
to closings at One John Street, The
Brooklyn Trust Company, and the
penthouse collection at 388 Bridge.
New development price metrics
during Third Quarter 2016 broke price
barriers not seen before. For example,
average price was above $1,500,000
for the first time in eight years.
Average price per square foot rose 6%
versus last year and exceeded $1,200
for the first time.
NEW DEVELOPMENT HISTORICAL PRICES
$0
$200
$400
$600
$800
$-
$0.2
$0.4
$0.6
$0.8
Pri
ce P
er S
qu
are
Foo
t
Sal
e P
rice
(M
illio
n)
Median Price Average PPSF Median PPSF
$1,000 $1.0
$1.2 $1,200
2Q16
3Q16
550 Vanderbilt The Standish
$0
$400,000
$800,000
$1,200,000
$1,600,000
$2,000,000
Pri
ce
Median Price Average Price
3Q15 3Q16
NEW DEVELOPMENTYEAR-OVER-YEAR PRICE
AVAILABLE NEW DEVELOPMENT RESIDENCES
3Q 2016BROOKLYN CORCORAN REPORT
Luxury
Single-family townhouse sales in
Brooklyn overall had price declines.
The number of lower priced single-
family townhouse sales in South
Brooklyn surged, driving overall
median and average sale price
down this quarter. Median price was
$1,230,000, down 5% from last year
and 15% from last quarter. Average
price dropped 9% versus Third
Quarter 2015. The area with the
largest median and average price gain
from Third Quarter 2015 was Carroll
Gardens, Boerum Hill and Red Hook,
mainly from several new construction
TownhouseTownhouse 3Q16 3Q15 % Chg (yr) 2Q16 % Chg (qtr)
Single-Family
Median Price $1.230M $1.300M -5% $1.448M -15%
Average Price $1.640M $1.800M -9% $1.614M 2%
Multi-Family
Median Price $1.483M $1.440M 3% $1.350M 10%
Average Price $1.783M $1.860M -4% $1.587M 12%
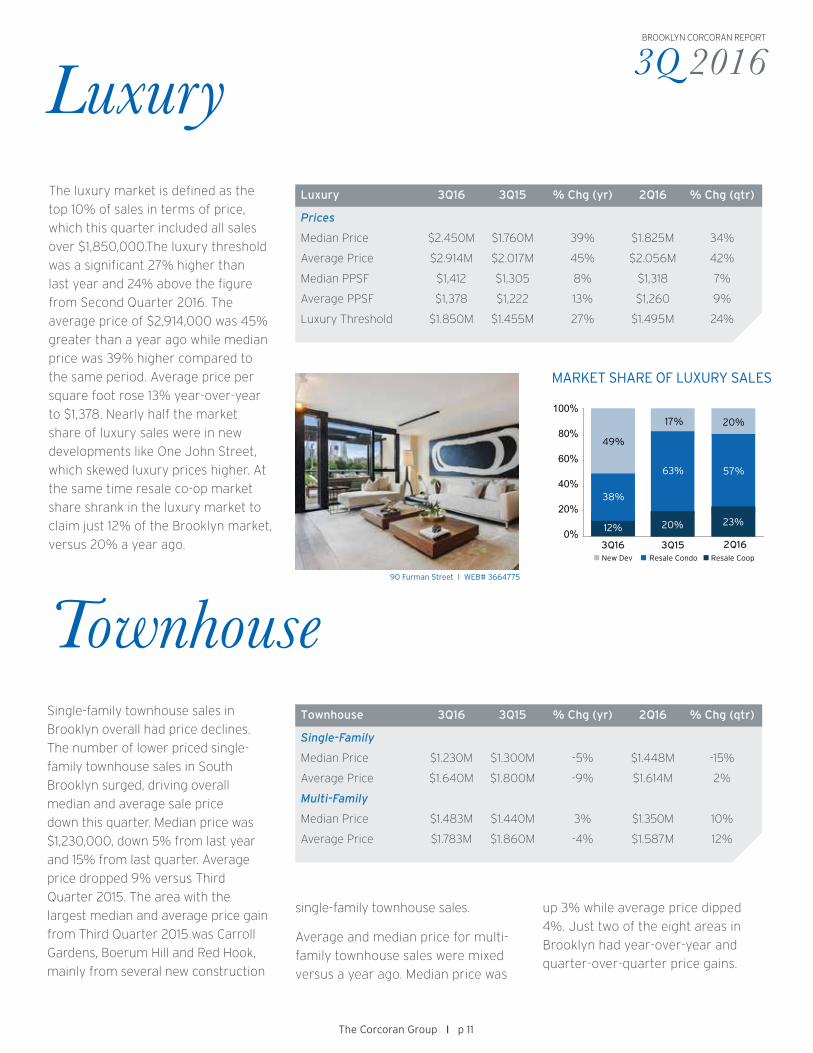
The luxury market is defined as the
top 10% of sales in terms of price,
which this quarter included all sales
over $1,850,000.The luxury threshold
was a significant 27% higher than
last year and 24% above the figure
from Second Quarter 2016. The
average price of $2,914,000 was 45%
greater than a year ago while median
price was 39% higher compared to
the same period. Average price per
square foot rose 13% year-over-year
to $1,378. Nearly half the market
share of luxury sales were in new
developments like One John Street,
which skewed luxury prices higher. At
the same time resale co-op market
share shrank in the luxury market to
claim just 12% of the Brooklyn market,
versus 20% a year ago.
Luxury 3Q16 3Q15 % Chg (yr) 2Q16 % Chg (qtr)
Prices
Median Price $2.450M $1.760M 39% $1.825M 34%
Average Price $2.914M $2.017M 45% $2.056M 42%
Median PPSF $1,412 $1,305 8% $1,318 7%
Average PPSF $1,378 $1,222 13% $1,260 9%
Luxury Threshold $1.850M $1.455M 27% $1.495M 24%
The Corcoran Group I p 11
single-family townhouse sales.
Average and median price for multi-
family townhouse sales were mixed
versus a year ago. Median price was
0%
20%
40%
60%
80%
100% 20%17%
49%
New Dev
12%23%
Resale Condo Resale Coop
57%
38%
20%
63%
3Q16 3Q15 2Q16
MARKET SHARE OF LUXURY SALES
up 3% while average price dipped
4%. Just two of the eight areas in
Brooklyn had year-over-year and
quarter-over-quarter price gains.
90 Furman Street I WEB# 3664775
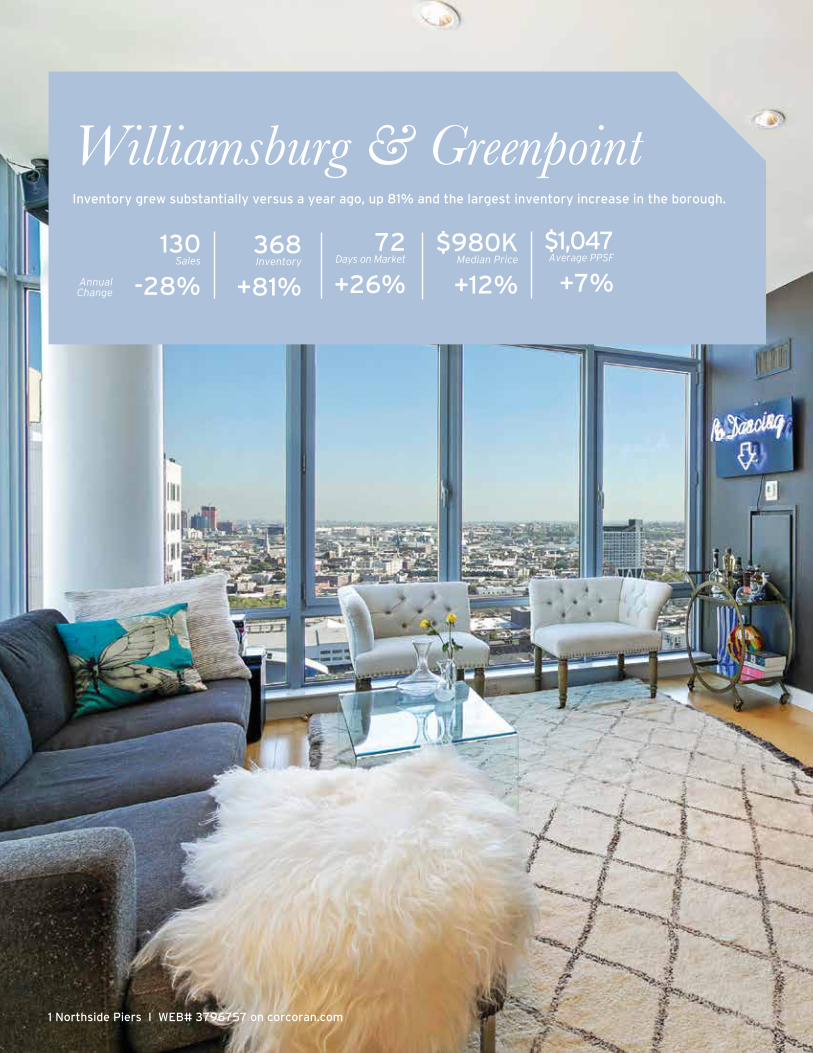
1 Northside Piers I WEB# 3796757 on corcoran.com
Williamsburg & Greenpoint130
Sales
-28%
72 Days on Market
+26%
$980K Median Price
+12%
$1,047 Average PPSF
+7%Annual Change
Inventory grew substantially versus a year ago, up 81% and the largest inventory increase in the borough.
368Inventory
+81%
3Q 2016BROOKLYN CORCORAN REPORT
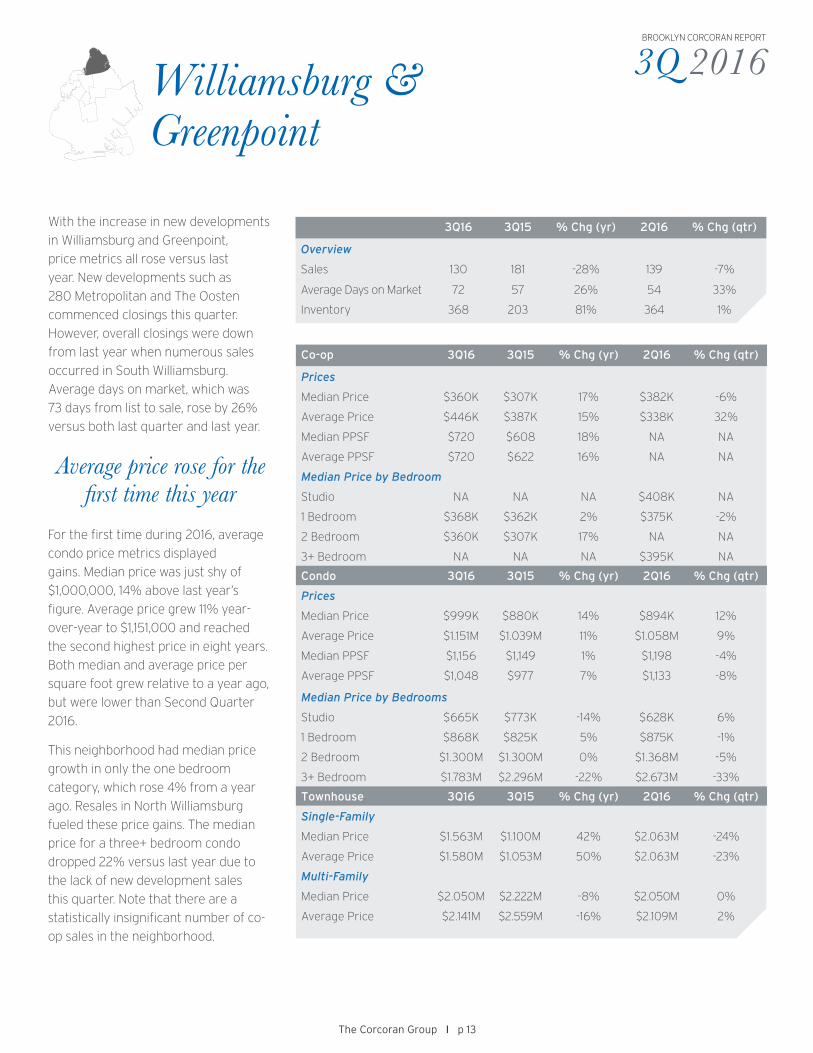
With the increase in new developments
in Williamsburg and Greenpoint,
price metrics all rose versus last
year. New developments such as
280 Metropolitan and The Oosten
commenced closings this quarter.
However, overall closings were down
from last year when numerous sales
occurred in South Williamsburg.
Average days on market, which was
73 days from list to sale, rose by 26%
versus both last quarter and last year.
Williamsburg & Greenpoint
3Q16 3Q15 % Chg (yr) 2Q16 % Chg (qtr)
Overview
Sales 130 181 -28% 139 -7%
Average Days on Market 72 57 26% 54 33%
Inventory 368 203 81% 364 1%
Co-op 3Q16 3Q15 % Chg (yr) 2Q16 % Chg (qtr)
Prices
Median Price $360K $307K 17% $382K -6%
Average Price $446K $387K 15% $338K 32%
Median PPSF $720 $608 18% NA NA
Average PPSF $720 $622 16% NA NA
Median Price by Bedroom
Studio NA NA NA $408K NA
1 Bedroom $368K $362K 2% $375K -2%
2 Bedroom $360K $307K 17% NA NA
3+ Bedroom NA NA NA $395K NA
Condo 3Q16 3Q15 % Chg (yr) 2Q16 % Chg (qtr)
Prices
Median Price $999K $880K 14% $894K 12%
Average Price $1.151M $1.039M 11% $1.058M 9%
Median PPSF $1,156 $1,149 1% $1,198 -4%
Average PPSF $1,048 $977 7% $1,133 -8%
Median Price by Bedrooms
Studio $665K $773K -14% $628K 6%
1 Bedroom $868K $825K 5% $875K -1%
2 Bedroom $1.300M $1.300M 0% $1.368M -5%
3+ Bedroom $1.783M $2.296M -22% $2.673M -33%
Townhouse 3Q16 3Q15 % Chg (yr) 2Q16 % Chg (qtr)
Single-Family
Median Price $1.563M $1.100M 42% $2.063M -24%
Average Price $1.580M $1.053M 50% $2.063M -23%
Multi-Family
Median Price $2.050M $2.222M -8% $2.050M 0%
Average Price $2.141M $2.559M -16% $2.109M 2%
Average price rose for the first time this year
The Corcoran Group I p 13
For the first time during 2016, average
condo price metrics displayed
gains. Median price was just shy of
$1,000,000, 14% above last year’s
figure. Average price grew 11% year-
over-year to $1,151,000 and reached
the second highest price in eight years.
Both median and average price per
square foot grew relative to a year ago,
but were lower than Second Quarter
2016.
This neighborhood had median price
growth in only the one bedroom
category, which rose 4% from a year
ago. Resales in North Williamsburg
fueled these price gains. The median
price for a three+ bedroom condo
dropped 22% versus last year due to
the lack of new development sales
this quarter. Note that there are a
statistically insignificant number of co-
op sales in the neighborhood.
360 Furman Street I WEB# 3798380 on corcoran.com
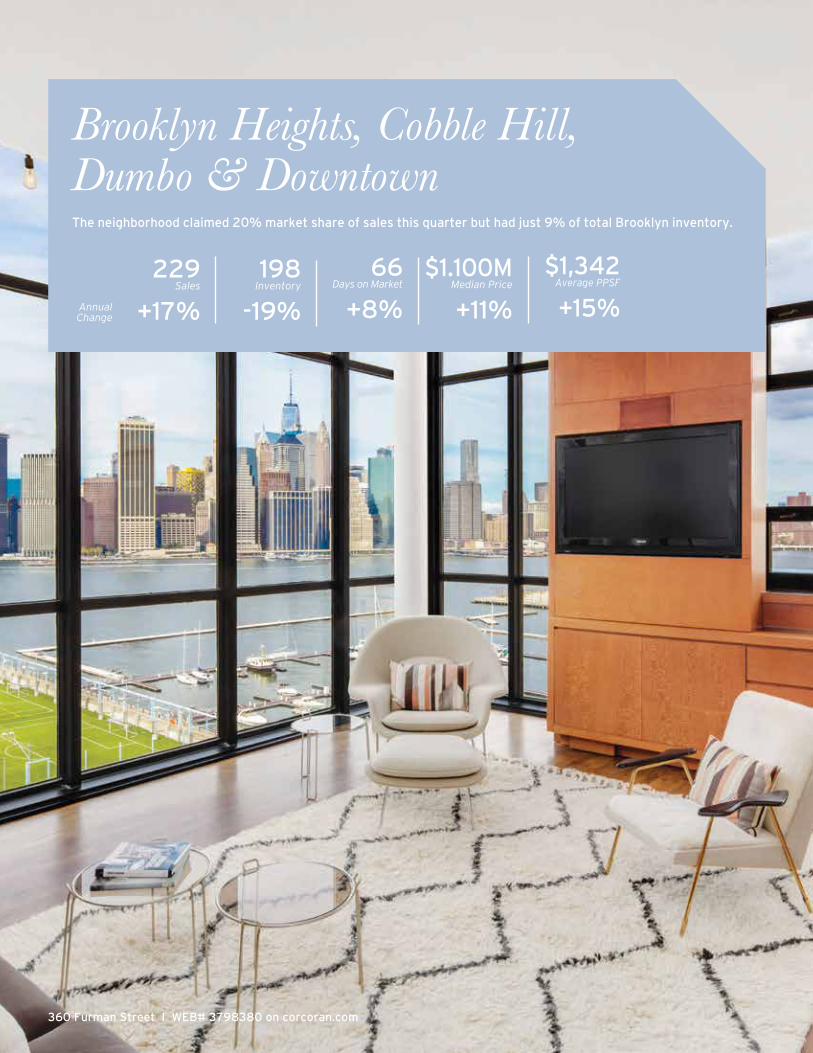
229Sales
+17%
66 Days on Market
+8%
$1.100M Median Price
+11%
$1,342 Average PPSF
+15%Annual Change
Brooklyn Heights, Cobble Hill, Dumbo & DowntownThe neighborhood claimed 20% market share of sales this quarter but had just 9% of total Brooklyn inventory.
198Inventory
-19%
3Q 2016BROOKLYN CORCORAN REPORT
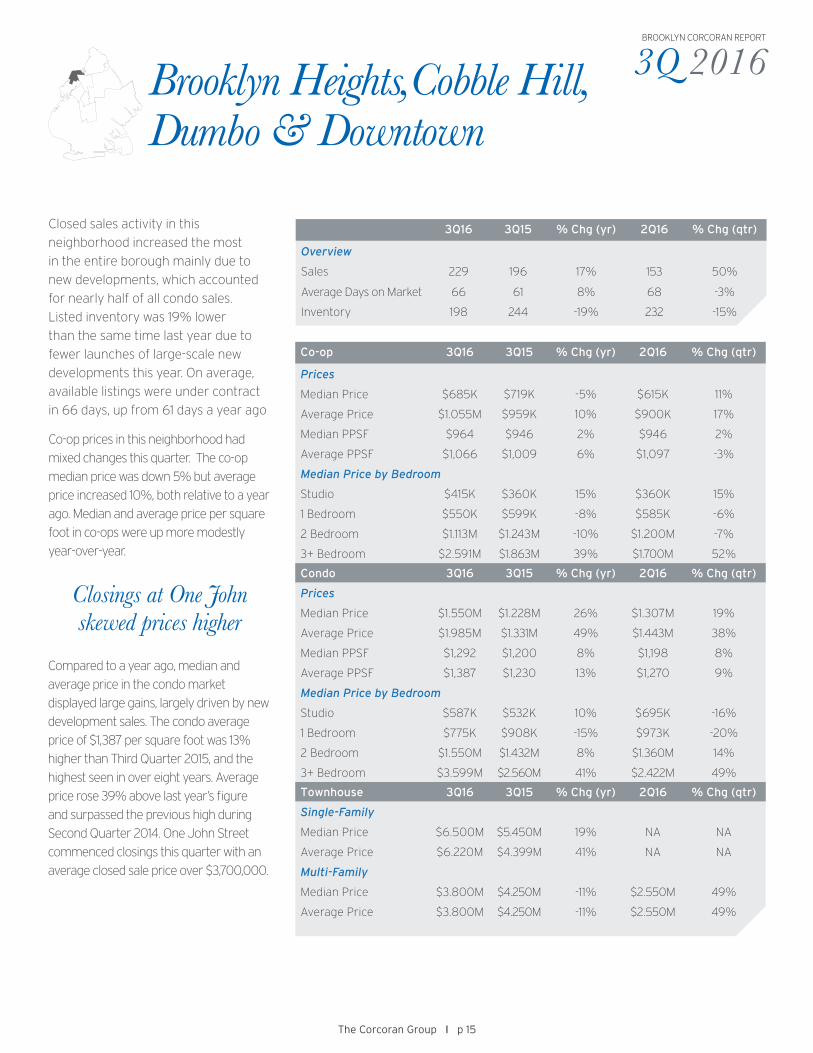
Closed sales activity in this
neighborhood increased the most
in the entire borough mainly due to
new developments, which accounted
for nearly half of all condo sales.
Listed inventory was 19% lower
than the same time last year due to
fewer launches of large-scale new
developments this year. On average,
available listings were under contract
in 66 days, up from 61 days a year ago
Co-op prices in this neighborhood had
mixed changes this quarter. The co-op
median price was down 5% but average
price increased 10%, both relative to a year
ago. Median and average price per square
foot in co-ops were up more modestly
year-over-year.
3Q16 3Q15 % Chg (yr) 2Q16 % Chg (qtr)
Overview
Sales 229 196 17% 153 50%
Average Days on Market 66 61 8% 68 -3%
Inventory 198 244 -19% 232 -15%
Co-op 3Q16 3Q15 % Chg (yr) 2Q16 % Chg (qtr)
Prices
Median Price $685K $719K -5% $615K 11%
Average Price $1.055M $959K 10% $900K 17%
Median PPSF $964 $946 2% $946 2%
Average PPSF $1,066 $1,009 6% $1,097 -3%
Median Price by Bedroom
Studio $415K $360K 15% $360K 15%
1 Bedroom $550K $599K -8% $585K -6%
2 Bedroom $1.113M $1.243M -10% $1.200M -7%
3+ Bedroom $2.591M $1.863M 39% $1.700M 52%
Condo 3Q16 3Q15 % Chg (yr) 2Q16 % Chg (qtr)
Prices
Median Price $1.550M $1.228M 26% $1.307M 19%
Average Price $1.985M $1.331M 49% $1.443M 38%
Median PPSF $1,292 $1,200 8% $1,198 8%
Average PPSF $1,387 $1,230 13% $1,270 9%
Median Price by Bedroom
Studio $587K $532K 10% $695K -16%
1 Bedroom $775K $908K -15% $973K -20%
2 Bedroom $1.550M $1.432M 8% $1.360M 14%
3+ Bedroom $3.599M $2.560M 41% $2.422M 49%
Townhouse 3Q16 3Q15 % Chg (yr) 2Q16 % Chg (qtr)
Single-Family
Median Price $6.500M $5.450M 19% NA NA
Average Price $6.220M $4.399M 41% NA NA
Multi-Family
Median Price $3.800M $4.250M -11% $2.550M 49%
Average Price $3.800M $4.250M -11% $2.550M 49%
Brooklyn Heights,Cobble Hill,Dumbo & Downtown
The Corcoran Group I p 15
Closings at One John skewed prices higher
Compared to a year ago, median and
average price in the condo market
displayed large gains, largely driven by new
development sales. The condo average
price of $1,387 per square foot was 13%
higher than Third Quarter 2015, and the
highest seen in over eight years. Average
price rose 39% above last year’s figure
and surpassed the previous high during
Second Quarter 2014. One John Street
commenced closings this quarter with an
average closed sale price over $3,700,000.

701 Union Street I WEB# 3794337 on corcoran.com
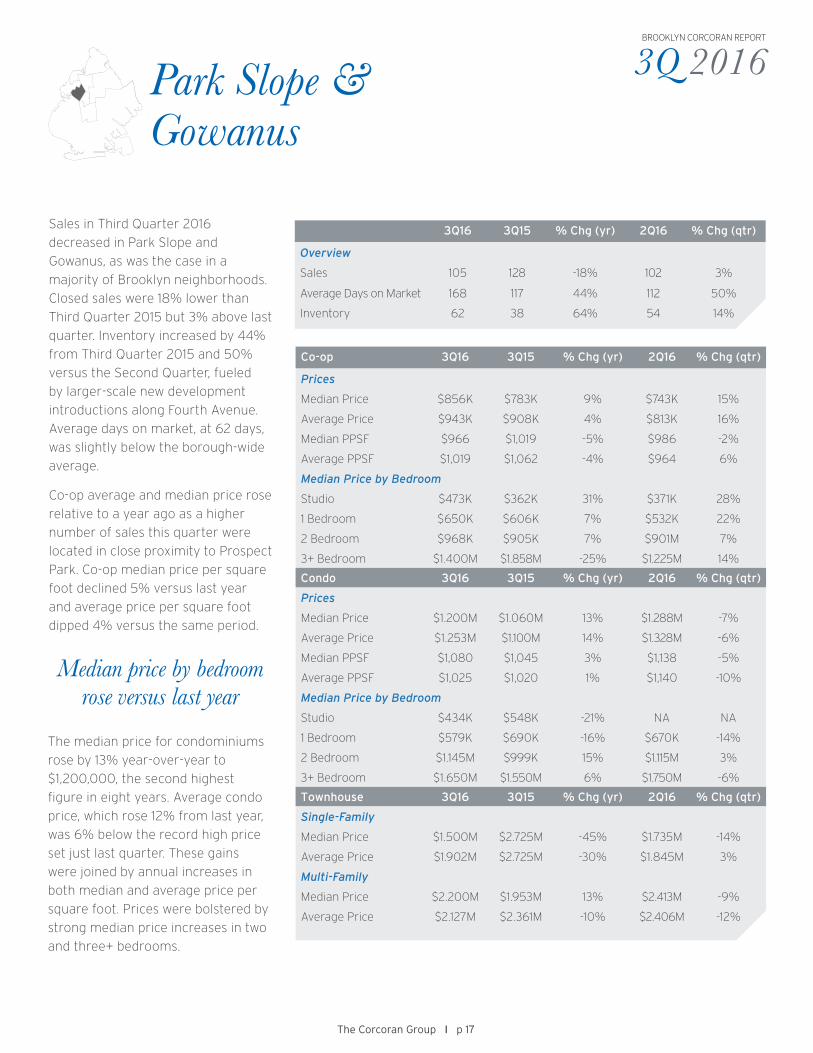
Park Slope & Gowanus105
Sales
-18%
62 Days on Market
+64%
$1.050M Median Price
+15%
$1,024 Average PPSF
0%Annual Change
Closed sales were down 20% year-over-year but were level with Second Quarter 2016.
168Inventory
+44%
3Q 2016BROOKLYN CORCORAN REPORT
Sales in Third Quarter 2016
decreased in Park Slope and
Gowanus, as was the case in a
majority of Brooklyn neighborhoods.
Closed sales were 18% lower than
Third Quarter 2015 but 3% above last
quarter. Inventory increased by 44%
from Third Quarter 2015 and 50%
versus the Second Quarter, fueled
by larger-scale new development
introductions along Fourth Avenue.
Average days on market, at 62 days,
was slightly below the borough-wide
average.
Co-op average and median price rose
relative to a year ago as a higher
number of sales this quarter were
located in close proximity to Prospect
Park. Co-op median price per square
foot declined 5% versus last year
and average price per square foot
dipped 4% versus the same period.
3Q16 3Q15 % Chg (yr) 2Q16 % Chg (qtr)
Overview
Sales 105 128 -18% 102 3%
Average Days on Market 168 117 44% 112 50%
Inventory 62 38 64% 54 14%
Co-op 3Q16 3Q15 % Chg (yr) 2Q16 % Chg (qtr)
Prices
Median Price $856K $783K 9% $743K 15%
Average Price $943K $908K 4% $813K 16%
Median PPSF $966 $1,019 -5% $986 -2%
Average PPSF $1,019 $1,062 -4% $964 6%
Median Price by Bedroom
Studio $473K $362K 31% $371K 28%
1 Bedroom $650K $606K 7% $532K 22%
2 Bedroom $968K $905K 7% $901M 7%
3+ Bedroom $1.400M $1.858M -25% $1.225M 14%
Condo 3Q16 3Q15 % Chg (yr) 2Q16 % Chg (qtr)
Prices
Median Price $1.200M $1.060M 13% $1.288M -7%
Average Price $1.253M $1.100M 14% $1.328M -6%
Median PPSF $1,080 $1,045 3% $1,138 -5%
Average PPSF $1,025 $1,020 1% $1,140 -10%
Median Price by Bedroom
Studio $434K $548K -21% NA NA
1 Bedroom $579K $690K -16% $670K -14%
2 Bedroom $1.145M $999K 15% $1.115M 3%
3+ Bedroom $1.650M $1.550M 6% $1.750M -6%
Townhouse 3Q16 3Q15 % Chg (yr) 2Q16 % Chg (qtr)
Single-Family
Median Price $1.500M $2.725M -45% $1.735M -14%
Average Price $1.902M $2.725M -30% $1.845M 3%
Multi-Family
Median Price $2.200M $1.953M 13% $2.413M -9%
Average Price $2.127M $2.361M -10% $2.406M -12%
Park Slope & Gowanus
The Corcoran Group I p 17
The median price for condominiums
rose by 13% year-over-year to
$1,200,000, the second highest
figure in eight years. Average condo
price, which rose 12% from last year,
was 6% below the record high price
set just last quarter. These gains
were joined by annual increases in
both median and average price per
square foot. Prices were bolstered by
strong median price increases in two
and three+ bedrooms.
Median price by bedroom rose versus last year
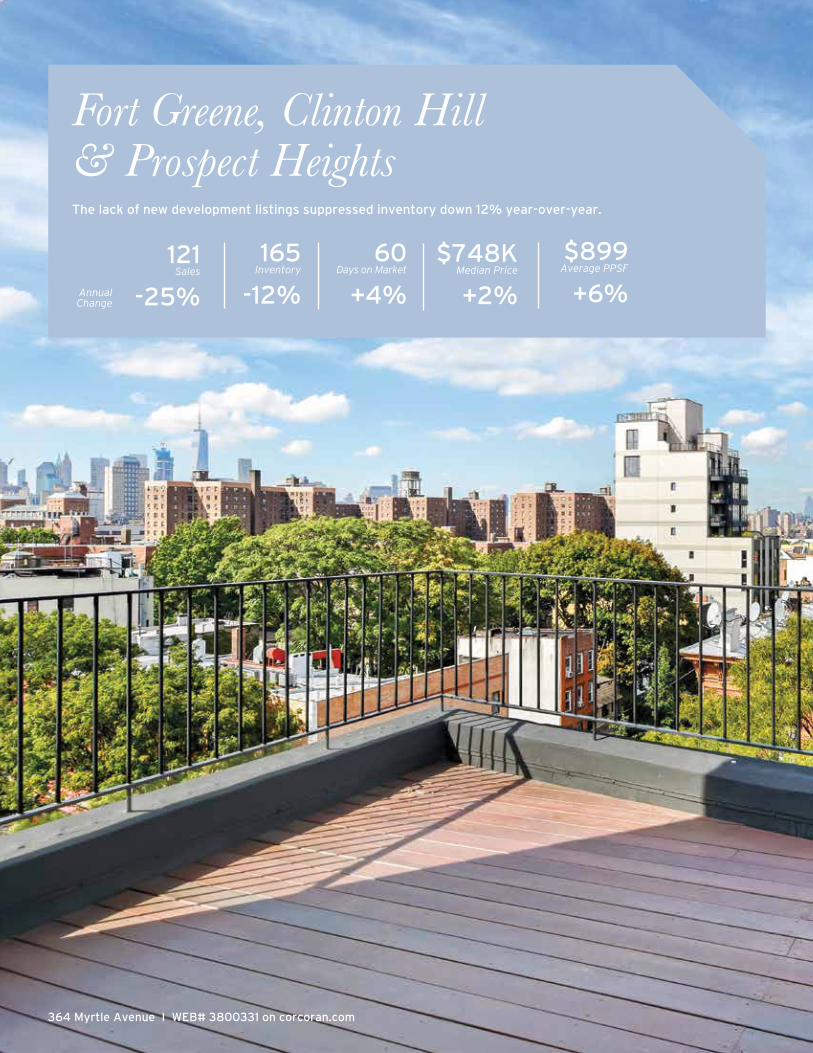
364 Myrtle Avenue I WEB# 3800331 on corcoran.com
121Sales
-25%
60 Days on Market
+4%
$748K Median Price
+2%
$899 Average PPSF
+6%Annual Change
Fort Greene, Clinton Hill & Prospect HeightsThe lack of new development listings suppressed inventory down 12% year-over-year.
165Inventory
-12%
3Q 2016BROOKLYN CORCORAN REPORT
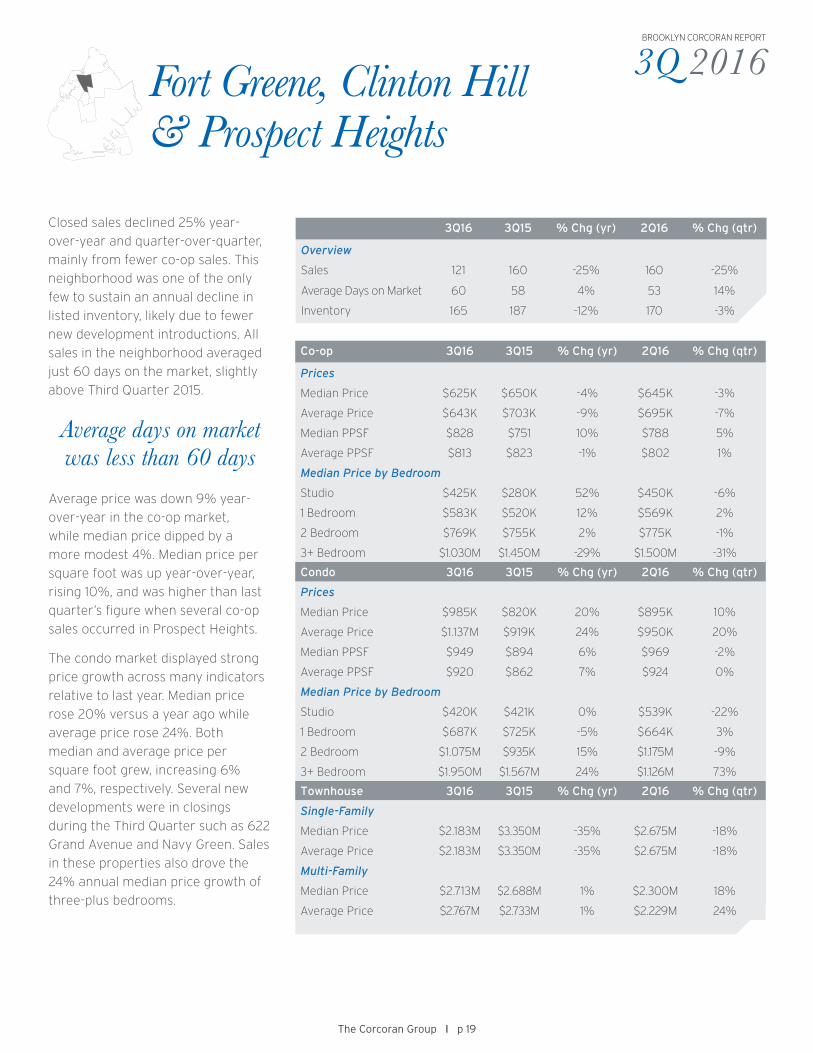
Closed sales declined 25% year-
over-year and quarter-over-quarter,
mainly from fewer co-op sales. This
neighborhood was one of the only
few to sustain an annual decline in
listed inventory, likely due to fewer
new development introductions. All
sales in the neighborhood averaged
just 60 days on the market, slightly
above Third Quarter 2015.
3Q16 3Q15 % Chg (yr) 2Q16 % Chg (qtr)
Overview
Sales 121 160 -25% 160 -25%
Average Days on Market 60 58 4% 53 14%
Inventory 165 187 -12% 170 -3%
Co-op 3Q16 3Q15 % Chg (yr) 2Q16 % Chg (qtr)
Prices
Median Price $625K $650K -4% $645K -3%
Average Price $643K $703K -9% $695K -7%
Median PPSF $828 $751 10% $788 5%
Average PPSF $813 $823 -1% $802 1%
Median Price by Bedroom
Studio $425K $280K 52% $450K -6%
1 Bedroom $583K $520K 12% $569K 2%
2 Bedroom $769K $755K 2% $775K -1%
3+ Bedroom $1.030M $1.450M -29% $1.500M -31%
Condo 3Q16 3Q15 % Chg (yr) 2Q16 % Chg (qtr)
Prices
Median Price $985K $820K 20% $895K 10%
Average Price $1.137M $919K 24% $950K 20%
Median PPSF $949 $894 6% $969 -2%
Average PPSF $920 $862 7% $924 0%
Median Price by Bedroom
Studio $420K $421K 0% $539K -22%
1 Bedroom $687K $725K -5% $664K 3%
2 Bedroom $1.075M $935K 15% $1.175M -9%
3+ Bedroom $1.950M $1.567M 24% $1.126M 73%
Townhouse 3Q16 3Q15 % Chg (yr) 2Q16 % Chg (qtr)
Single-Family
Median Price $2.183M $3.350M -35% $2.675M -18%
Average Price $2.183M $3.350M -35% $2.675M -18%
Multi-Family
Median Price $2.713M $2.688M 1% $2.300M 18%
Average Price $2.767M $2.733M 1% $2.229M 24%
The Corcoran Group I p 19
Fort Greene, Clinton Hill & Prospect Heights
Average price was down 9% year-
over-year in the co-op market,
while median price dipped by a
more modest 4%. Median price per
square foot was up year-over-year,
rising 10%, and was higher than last
quarter’s figure when several co-op
sales occurred in Prospect Heights.
The condo market displayed strong
price growth across many indicators
relative to last year. Median price
rose 20% versus a year ago while
average price rose 24%. Both
median and average price per
square foot grew, increasing 6%
and 7%, respectively. Several new
developments were in closings
during the Third Quarter such as 622
Grand Avenue and Navy Green. Sales
in these properties also drove the
24% annual median price growth of
three-plus bedrooms.
Average days on market was less than 60 days
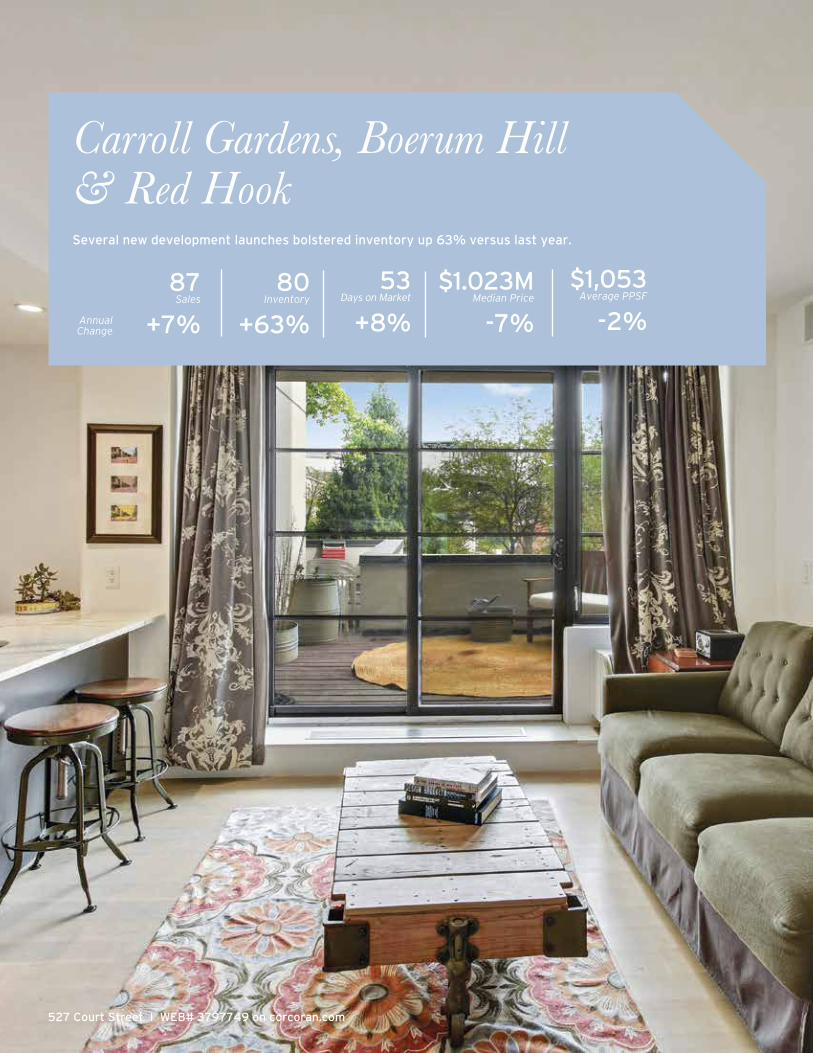
87Sales
+7%
53 Days on Market
+8%
$1.023M Median Price
-7%
$1,053 Average PPSF
-2%Annual Change
Carroll Gardens, Boerum Hill & Red Hook
527 Court Street I WEB# 3797749 on corcoran.com
Several new development launches bolstered inventory up 63% versus last year.
80Inventory
+63%
3Q 2016BROOKLYN CORCORAN REPORT
Co-op 3Q16 3Q15 % Chg (yr) 2Q16 % Chg (qtr)
Prices
Median Price $950K $892K 6% $985K -4%
Average Price $962K $929K 4% $975K -1%
Median PPSF $1,050 $930 13% $1,017 3%
Average PPSF $1,059 $1,000 6% $1,035 2%
Median Price by Bedroom
Studio $432K $440K -2% $399K 8%
1 Bedroom $550K $687K -20% $583K -6%
2 Bedroom $998K $1.019M -2% $1.095M -9%
3+ Bedroom $1.443M $1.463M -1% $1.925M -25%
Condo 3Q16 3Q15 % Chg (yr) 2Q16 % Chg (qtr)
Prices
Median Price $1.150M $1.333M -14% $1.150M 0%
Average Price $1.214M $1.399M -13% $1.245M -2%
Median PPSF $1,058 $1,080 -2% $1,016 4%
Average PPSF $1,051 $1,096 -4% $994 6%
Median Price by Bedroom
Studio NA NA NA NA NA
1 Bedroom $735K $892K -18% $800K -8%
2 Bedroom $1.180M $1.308M -10% $1.191M -1%
3+ Bedroom $1.798M $1.998M -10% $1.394M 29%
Townhouse 3Q16 3Q15 % Chg (yr) 2Q16 % Chg (qtr)
Single-Family
Median Price $3.150M $2.350M 34% $2.278M 38%
Average Price $2.827M $2.521M 12% $2.739M 3%
Multi-Family
Median Price $3.200M $3.450M -7% $3.100M 3%
Average Price $2.836M $3.444M -18% $2.805M 1%
The Corcoran Group I p 21
Carroll Gardens,Boerum Hill & Red Hook
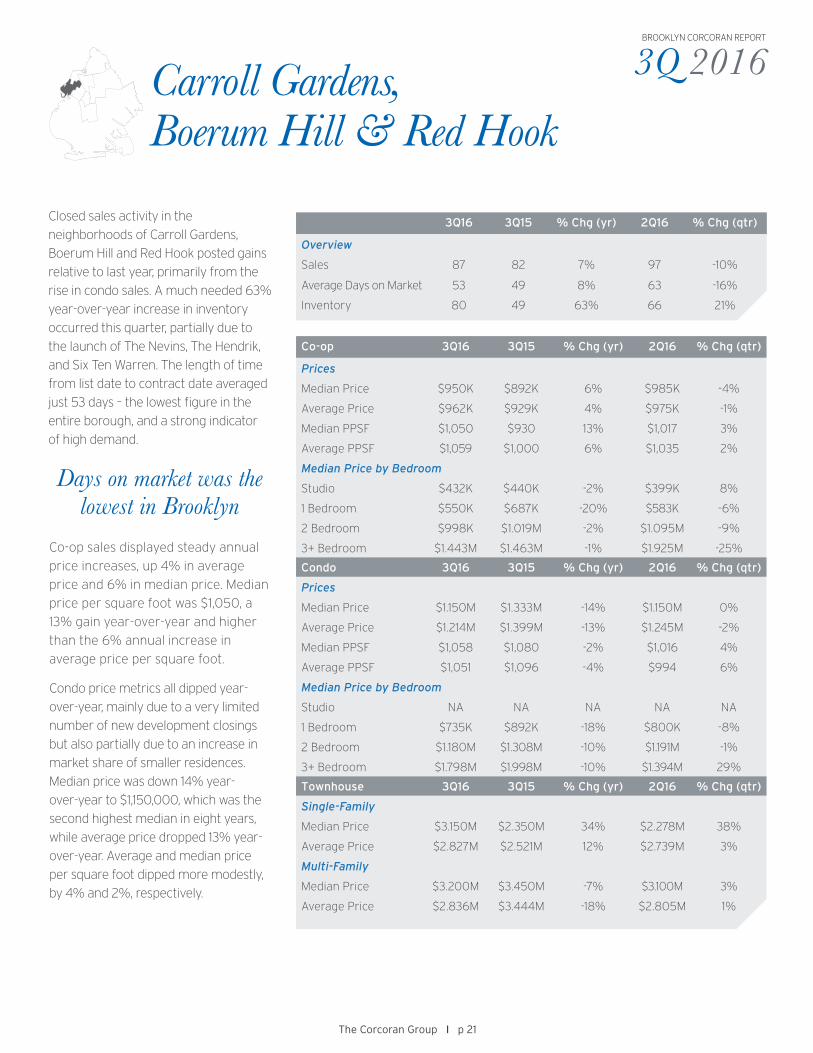
3Q16 3Q15 % Chg (yr) 2Q16 % Chg (qtr)
Overview
Sales 87 82 7% 97 -10%
Average Days on Market 53 49 8% 63 -16%
Inventory 80 49 63% 66 21%
Days on market was the lowest in Brooklyn
Closed sales activity in the
neighborhoods of Carroll Gardens,
Boerum Hill and Red Hook posted gains
relative to last year, primarily from the
rise in condo sales. A much needed 63%
year-over-year increase in inventory
occurred this quarter, partially due to
the launch of The Nevins, The Hendrik,
and Six Ten Warren. The length of time
from list date to contract date averaged
just 53 days – the lowest figure in the
entire borough, and a strong indicator
of high demand.
Co-op sales displayed steady annual
price increases, up 4% in average
price and 6% in median price. Median
price per square foot was $1,050, a
13% gain year-over-year and higher
than the 6% annual increase in
average price per square foot.
Condo price metrics all dipped year-
over-year, mainly due to a very limited
number of new development closings
but also partially due to an increase in
market share of smaller residences.
Median price was down 14% year-
over-year to $1,150,000, which was the
second highest median in eight years,
while average price dropped 13% year-
over-year. Average and median price
per square foot dipped more modestly,
by 4% and 2%, respectively.

814 Dean Street I WEB# 3528826 on corcoran.com
98Sales
+4%
70 Days on Market
-1%
$625K Median Price
+19%
$631 Average PPSF
-6%Annual Change
Bedford-Stuyvesant, Crown Heights,Lefferts Gardens & BushwickSales were up 4% year-over-year, one of just three other neighborhoods with increased sales.
157Inventory
+23%

3Q 2016BROOKLYN CORCORAN REPORT
Closed sales increased 4% versus
last year with steady activity in both
condo and co-op markets. Available
inventory increased 23% year-over-
year, but this neighborhood’s market
share of listings remained level with
Third Quarter 2015. The length of
time it took for available listings to
enter contract shrunk by 1% versus
last year, and 19% from last quarter,
to 70 days.
Bedford-Stuyvesant, Crown Heights, Lefferts Gardens & Bushwick
3Q16 3Q15 % Chg (yr) 2Q16 % Chg (qtr)
Overview
Sales 98 94 4% 91 7%
Average Days on Market 70 71 -1% 86 -19%
Inventory 157 128 23% 153 3%
Co-op 3Q16 3Q15 % Chg (yr) 2Q16 % Chg (qtr)
Prices
Median Price $610K $332K 84% $445K 37%
Average Price $567K $374K 52% $481K 18%
Median PPSF $535 $578 -7% $477 12%
Average PPSF $507 $591 -14% $577 -12%
Median Price by Bedroom
Studio NA $166K NA $170K NA
1 Bedroom $389K $378K 3% $370K 5%
2 Bedroom $625K $540K 16% $654K -4%
3+ Bedroom $370K $665K -44% NA NA
Condo 3Q16 3Q15 % Chg (yr) 2Q16 % Chg (qtr)
Prices
Median Price $650K $534K 22% $580K 12%
Average Price $680K $578K 18% $656K 4%
Median PPSF $671 $836 -20% $709 -5%
Average PPSF $638 $680 -6% $652 -2%
Median Price by Bedroom
Studio $650K $425K 53% NA NA
1 Bedroom $617K $520K 19% $592K 4%
2 Bedroom $958K $784K 22% $820K 17%
3+ Bedroom $999K NA NA $860K 16%
Townhouse 3Q16 3Q15 % Chg (yr) 2Q16 % Chg (qtr)
Single-Family
Median Price $1.360M $1.797M -24% $1.250M 9%
Average Price $1.362M $1.663M -18% $1.486M -8%
Multi-Family
Median Price $1.350M $1.250M 8% $1.250M 8%
Average Price $1.412M $1.351M 5% $1.284M 10%
The Corcoran Group I p 23
Condo prices reached eight-year record highs
A significant year-over-year increase
occurred for median and average
co-op prices, which were up 84% and
52%, respectively, versus last year.
Large increases such as these are due
to the limited quantity of co-op sales
during many quarters in this area.
The performance of the condo
market was similar to other areas
in Brooklyn year-over-year, where
eight-year median record high prices
were reached. Median price jumped
22% from last year and 12% from
last quarter. Average price reached
$680,000, 18% higher than last year
and the highest figure since Fourth
Quarter 2014. Median sale price for
one and two bedroom units each
rose compared to last quarter and
last year.
82 Stratford Road I WEB# 3800803 on corcoran.com
94Sales
-6%
58 Days on Market
-3%
$558K Median Price
+25%
$621Average PPSF
+8%Annual Change
Kensington,Windsor Terrace, Ditmas Park, Flatbush & Prospect Park SouthMedian price rose 25% versus Third Quarter 2015, the highest annual increase in Brooklyn.
194Inventory
7%

3Q 2016BROOKLYN CORCORAN REPORT
During Third Quarter 2016 sales
decreased 6% year-over-year, a
decline exaggerated by the unusually
high number of co-op sales during
Third Quarter 2015. Inventory rose 7%
from last year, in-line with the increase
seen market wide. Days on market
constricted slightly to 58 days, the
second lowest figure in the borough.
Co-op sales displayed a strong
double-digit annual median price
increase, up 20% to $483,000. In
fact, this neighborhood had the
second largest co-op median price
increase in the borough. Co-ops
located along Ocean Parkway
contributed to a strong quarter for
this product type. A 9% year-over-
year gain in average price occurred
while median and average price per
square foot also rose versus both last
quarter and last year.
Kensington, Windsor Terrace, Ditmas Park, Flatbush & Prospect Park South
3Q16 3Q15 % Chg (yr) 2Q16 % Chg (qtr)
Overview
Sales 94 100 -6% 77 22%
Average Days on Market 58 59 -3% 69 -16%
Inventory 194 182 7% 211 -8%
Co-op 3Q16 3Q15 % Chg (yr) 2Q16 % Chg (qtr)
Prices
Median Price $483K $404K 20% $455K 6%
Average Price $517K $473K 9% $468K 10%
Median PPSF $549 $514 7% $542 1%
Average PPSF $579 $552 5% $551 5%
Median Price by Bedroom
Studio $227K $252K -10% $275K -18%
1 Bedroom $428K $383K 12% $425K 1%
2 Bedroom $633K $678K -7% $583K 8%
3+ Bedroom $788K $1.287M -39% $553K 43%
Condo 3Q16 3Q15 % Chg (yr) 2Q16 % Chg (qtr)
Prices
Median Price $580K $683K -15% $583K 0%
Average Price $633K $676K -6% $564K 12%
Median PPSF $724 $732 -1% $673 8%
Average PPSF $718 $606 19% $585 23%
Median Price by Bedroom
Studio NA NA NA NA NA
1 Bedroom $540K $602K -10% $396K 37%
2 Bedroom $580K $799K -27% $603K -4%
3+ Bedroom $650K NA NA $699K -7%
Townhouse 3Q16 3Q15 % Chg (yr) 2Q16 % Chg (qtr)
Single-Family
Median Price $1.411M NA NA $1.304M 8%
Average Price $1.624M NA NA $1.625M 0%
Multi-Family
Median Price $1.323M $1.440M -8% $1.027M 29%
Average Price $1.323M $1.563M -15% $1.032M 28%
The Corcoran Group I p 25
Median price of one bedroom co-ops rose
significantlyAverage and median condo price
were both lower than Third Quarter
2015, driven by a greater number of
sales of smaller residences. Average
price per square foot, which rose 19%
year-over-year to $718, surpassed
the previous high set during First
Quarter 2016. This figure was
skewed higher by closings at Bedford
Gardens, a new development pre-war
conversion on Bedford Avenue.
368 90th Street I WEB# 3717740 on corcoran.com
South Brooklyn298
Sales
-40%
98 Days on Market
+26%
$320K Median Price
+9%
$498 Average PPSF
+15%Annual Change
Market share of sales in South Brooklyn slipped to just 26% of sales, down from 34% a year ago.
906Inventory
-8%
3Q 2016BROOKLYN CORCORAN REPORT
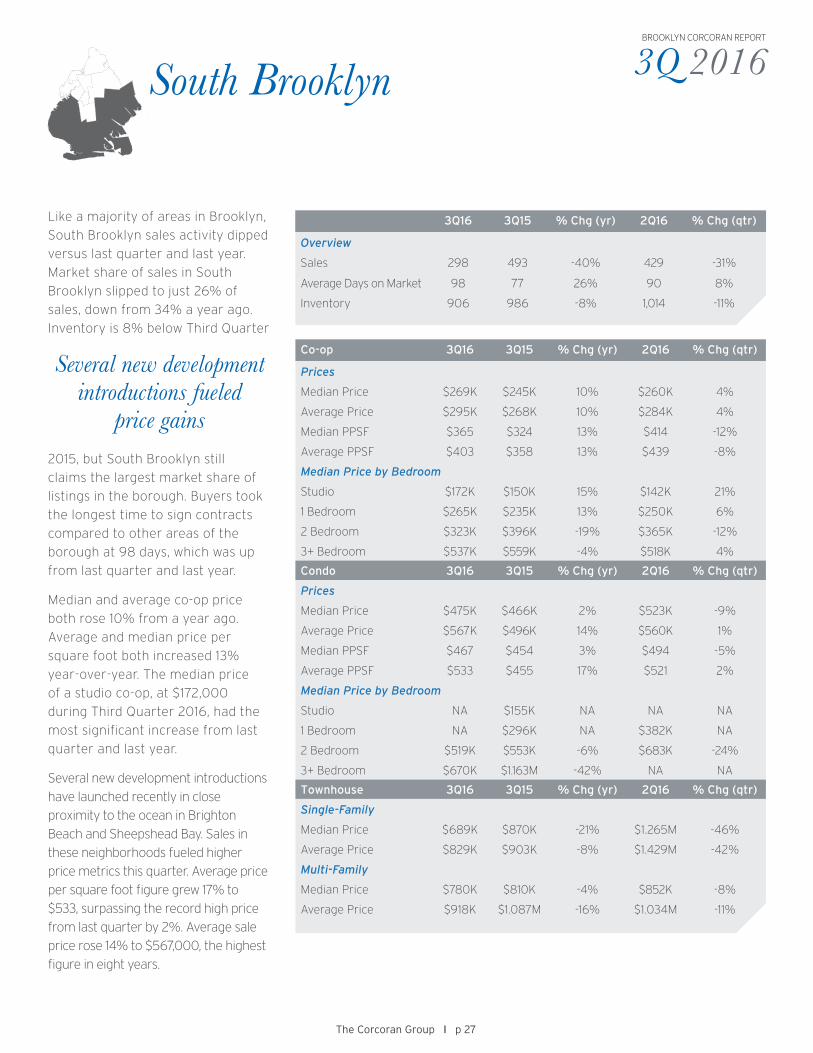
Like a majority of areas in Brooklyn,
South Brooklyn sales activity dipped
versus last quarter and last year.
Market share of sales in South
Brooklyn slipped to just 26% of
sales, down from 34% a year ago.
Inventory is 8% below Third Quarter
South Brooklyn
3Q16 3Q15 % Chg (yr) 2Q16 % Chg (qtr)
Overview
Sales 298 493 -40% 429 -31%
Average Days on Market 98 77 26% 90 8%
Inventory 906 986 -8% 1,014 -11%
Co-op 3Q16 3Q15 % Chg (yr) 2Q16 % Chg (qtr)
Prices
Median Price $269K $245K 10% $260K 4%
Average Price $295K $268K 10% $284K 4%
Median PPSF $365 $324 13% $414 -12%
Average PPSF $403 $358 13% $439 -8%
Median Price by Bedroom
Studio $172K $150K 15% $142K 21%
1 Bedroom $265K $235K 13% $250K 6%
2 Bedroom $323K $396K -19% $365K -12%
3+ Bedroom $537K $559K -4% $518K 4%
Condo 3Q16 3Q15 % Chg (yr) 2Q16 % Chg (qtr)
Prices
Median Price $475K $466K 2% $523K -9%
Average Price $567K $496K 14% $560K 1%
Median PPSF $467 $454 3% $494 -5%
Average PPSF $533 $455 17% $521 2%
Median Price by Bedroom
Studio NA $155K NA NA NA
1 Bedroom NA $296K NA $382K NA
2 Bedroom $519K $553K -6% $683K -24%
3+ Bedroom $670K $1.163M -42% NA NA
Townhouse 3Q16 3Q15 % Chg (yr) 2Q16 % Chg (qtr)
Single-Family
Median Price $689K $870K -21% $1.265M -46%
Average Price $829K $903K -8% $1.429M -42%
Multi-Family
Median Price $780K $810K -4% $852K -8%
Average Price $918K $1.087M -16% $1.034M -11%
The Corcoran Group I p 27
2015, but South Brooklyn still
claims the largest market share of
listings in the borough. Buyers took
the longest time to sign contracts
compared to other areas of the
borough at 98 days, which was up
from last quarter and last year.
Median and average co-op price
both rose 10% from a year ago.
Average and median price per
square foot both increased 13%
year-over-year. The median price
of a studio co-op, at $172,000
during Third Quarter 2016, had the
most significant increase from last
quarter and last year.
Several new development introductions
have launched recently in close
proximity to the ocean in Brighton
Beach and Sheepshead Bay. Sales in
these neighborhoods fueled higher
price metrics this quarter. Average price
per square foot figure grew 17% to
$533, surpassing the record high price
from last quarter by 2%. Average sale
price rose 14% to $567,000, the highest
figure in eight years.
Several new development introductions fueled
price gains

3Q 2016BROOKLYN CORCORAN REPORT
Methodology
Metrics Closed Sales figures for the current
quarter are based on known closings
recorded at the time the report is
prepared and projected through the end
of the quarter taking into account typical
seasonality and public
reporting timing.
Contracts Signed figures for the current
quarter are based on reported signed
contracts at the time the report is
prepared and projected through the end
of the quarter taking into account typical
seasonality.
Days on market averages how long a
unit takes to sell and is calculated by
subtracting contract date from list date.
Units on the market longer than three
years and shorter than one day are
considered outliers and removed from
the data to prevent significant skewing.
New developments are excluded because
many available, unsold units are held off
the market for long periods of time.
Average Price per Square Foot is the
average price divided by the average
square footage. In prior Corcoran Reports
this was calculated as an average of all
prices per square foot, which gives a
number less skewed by high price sales
and more similar to a median price per
square foot. The two metrics are now
separated to give more insight to market
dynamics.
Median Price and Price per Square Foot
are the middle or midpoint price where
half of sales fall below and half fall above
this number.
Inventory is a count of all currently
listed units and is measured two weeks
before the end of the quarter. It does not
include unsold yet unlisted units in new
developments (“shadow” inventory).
Source – Sales counts and figures in this report are based on publicly reported closed sales information via The Automated
City Register Information System (ACRIS) and compiled using PropertyShark, an independent research firm, as well as
from Corcoran’s proprietary listings database.
Real estate agents affiliated with The Corcoran Group are independent contractors and are not employees of The Corcoran Group. The Corcoran Group is a licensed real estate broker located at 660 Madison Ave, NY, NY 10065. All material presented herein is intended for information purposes only and has been compiled from sources deemed reliable. Though information is believed to be correct, it is presented subject to errors, omissions, changes or withdrawal notice
The Corcoran Group I p 28
Months of Supply is an estimate of how
long it would take to sell all currently listed
units based on the average closed sales
per month over the last twelve months.
Six to nine months is considered supply-
demand equilibrium.
Previous Quarter statistics for
sales and prices are revised in the
subsequent report once data is
available for the full quarter period.
Average unit sales per square foot (SF):
Above $2,500 SF $2,000 - $2,500 SF $1,500 - $2,000 SF $1,250 - $1,500 SF $1,000 - $1,250 SF $750 - $1,000 SF $500 - $750 SF Below $500 SF No SF Available
Number of unit sales per building:
Above 20 Units 10 to 20 Units 3 to 9 Units 1 to 2 Units


