Building Graduate Communities: A Policy Imperative for Knowledge-based Societies
University of Alberta and China Scholarship Council Conference “Quality and Relevance: Canada-China Forum
on Graduate Education and Research”,26 and 27th of August 2010.
Louis Maheu, FRSC, Emeritus professor,Department of Sociology, University of Montreal, Canada
2
Focus on 5 DimensionsRelevant to Today Graduate Education
Socially Distributed Knowledge Production (SDKP) System’s Requirements
S&T Recent Innovation Policies Characteristics
Canadian Assets / Challengesfor Building Graduate Communities
Canadian Strategy: ‘Building vs Buying’Graduate Communities?
Conclusion: Key Challenges for Building Graduate Communities in a SDKP Context

3
Socially Distributed Knowledge Production System (SDKP)
4 Fundamental Characteristics: KP within more complex world of partners / clusters / webs
= Fundamental RD and University position revisited
Emergence of Contextualized RD: Up / Downstreamof complex problem solutions
Research open to ‘linked’ disciplines
KP Quality control: peers and partners
M. Gibbons et al.1994: ‘The new Production of Knowledge; The Dynamics of science and research in contemporary societies’, London, Sage
4
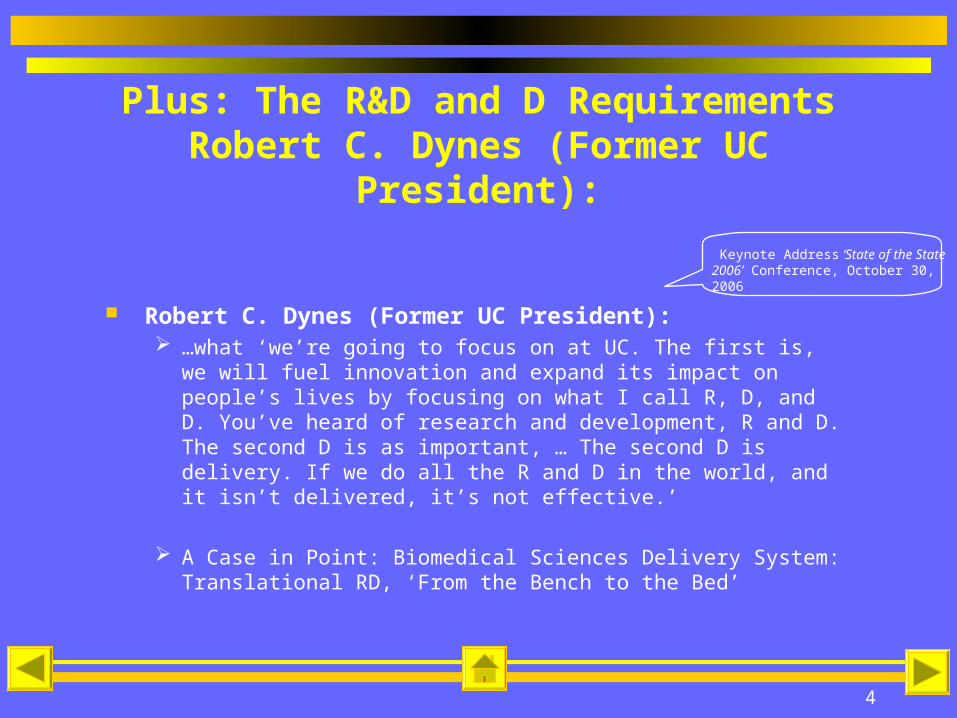
Plus: The R&D and D RequirementsRobert C. Dynes (Former UC President):
Robert C. Dynes (Former UC President): …what ‘we’re going to focus on at UC. The first is, we will fuel
innovation and expand its impact on people’s lives by focusing on what I call R, D, and D. You’ve heard of research and development, R and D. The second D is as important, … The second D is delivery. If we do all the R and D in the world, and it isn’t delivered, it’s not effective.’
A Case in Point: Biomedical Sciences Delivery System: Translational RD, ‘From the Bench to the Bed’
Keynote Address ‘State of the State 2006’ Conference, October 30, 2006

5
3 Characteristics of RecentScience & Technology Innovation Policies
People matter morethan technical / fiscal measures
Competencies: Level: Graduate Education Disciplinary… Plus: Professional Development
and Interdisciplinary Skills
Clusters: Beyond Academic / Organizational Boundaries Beyond National Boundaries:
Regional / International Clusters

6
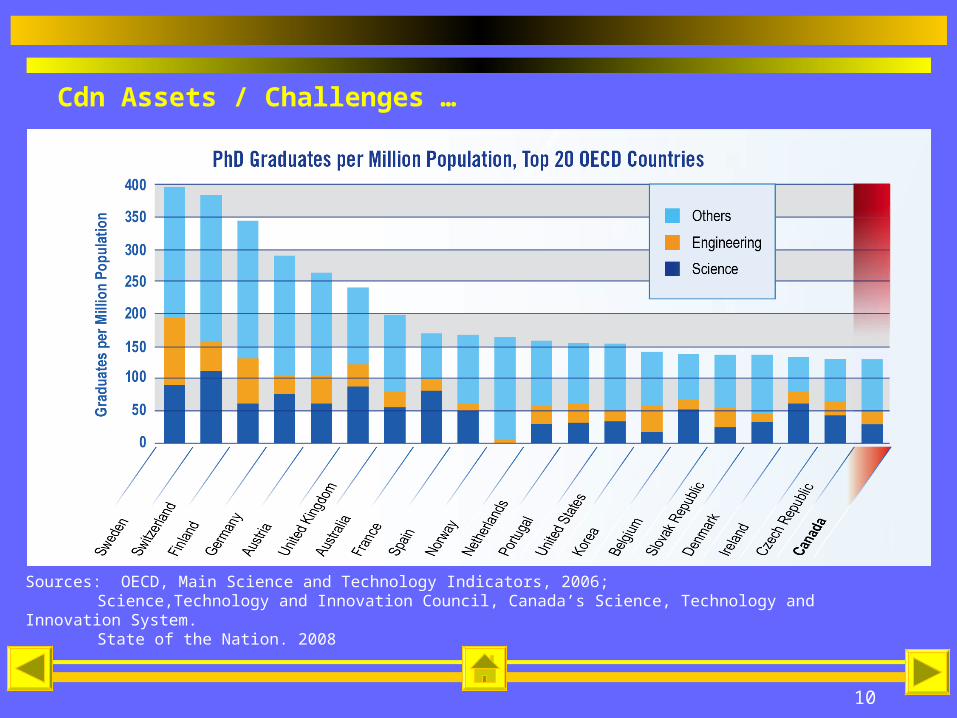
Cdn Assets / Challenges for Building Graduate Communities
Sources: OECD, Main Science and Technology Indicators, 2006;Science,Technology and Innovation Council, Canada’s Science, Technology and Innovation System. State ofthe Nation. 2008

7
Higher Education Performance of R&D, 2006
Sources: OECD, Main Science and Technology Indicators, 2006; Science,Technology and Innovation Council, Canada’s Science, Technology and Innovation System. State of the Nation. 2008
Higher Edu. Expend. On R&D as % of GDP: 1981-2004
Source: Council of Canadian Academies,the State of Science & Technology in Canada. 2006

8
Source: Statistics Canada data as reported in CAGS (Canadian Association for Graduate Studies)Statistical Report for the years 1980; 1988; 1990-2001 and 1995-2006.
1 Statscan taxonomy changes for fields of study: this estimated figure includes, for 1998, 878 degrees awarded in maths and computersciences, in engineering and architecture, in natural resources and half of the 1 010 degrees awarded in physical and life sciences
2 Estimated figure including, for 2006, 246 degrees awarded in maths and computer sciences, 735 in engineering and architecture,144 in natural resources and half of the 1 161 degrees awarded in physical and life sciences.
Cdn Assets / Challenges …
1968 1978 1988 1998 2006
EnrolmentsMsc 23 816 46 448 55 518 71 295 95 682
PhD 9 604 13 017 18 068 26 505 36 765
1968 1978 1988 1998 2006Degrees awarded(% Natural Sc-Eng)
Msc 4 216 12 390 15 373 22 026 34 107
PhD 1 069 1 780 2 340 3 976 4 449
(49%) (33%) (32%) (est: 35%)1 (est: 38%)2
Canadian Graduate Studies Statistics: 1968/1978/1988/1998/2006

9
0,0 0,5 1,0 1,5 2,0 2,5 3,0 3,5 4,0
29. Greece
27. Mexico
26. Norway
25. Turkey (2000)
24. Hungary
23. Italy (2001)
22. Poland
21. Japan
20. Canada (2000)
19. Slovak Republic
18. Spain
17. Korea
16. Denmark (2001)
15. Portugal (2000)
14. New Zealand
13. Czech Republic
12. United States
11. Netherlands
10. Ireland
9. Australia
8. Belgium
7. Austria
6. Finland (2001)
5. Germany
4. France (2001)
3. United Kingdom
2. Switzerland
1. Sweden
0,0 0,5 1,0 1,5 2,0 2,5 3,0 3,5 4,0
28. Mexico (2001)
27. Poland
26. Slovak Republic
25. Greece (2001)
24. Turkey (2002)
23. Portugal (2002)
22. Hungary
21. Spain
20. Ireland (2002)
19. New Zealand
18. Italy (2002)
17. Czech Republic
16. Australia (2002)
15. Norway
14. Netherlands (2002)
13. United Kingdom
12. Canada
11. France
10. Austria
9. Belgium
8. Denmark (2002)
7. Germany
6. Switzerland (2000)
5. United States
4. Korea
3. Japan
2. Finland
1. Sweden
0,0 0,5 1,0 1,5 2,0 2,5 3,0 3,5 4,0
28. Mexico
27. Turkey (2000)
26. Italy (2001)
25. Greece
24. Hungary
23. Japan
22. Czech Republic
21. Ireland
20. Poland
19. Slovak Republic
18. Canada (2000)
17. Denmark (2001)
16. Korea
15. New Zealand
14. Portugal (2000)
13. Spain
12. Belgium
11. Norway
10. Australia
9. Netherlands
8. United States
7. France (2001)
6. United Kingdom
5. Austria
4. Finland (2001)
3. Germany
2. Switzerland
1. Sweden
Evidence-based Impact of S&T / Innovation Policies: The Case of Doctoral Education
$$$ R&D as % of GDP(2003 or latest available year)
All doctorates Doctorates in science and engineering
R & D Intensity
Graduation rateat doctorate level, 2002
Graduation rateat doctorate level, 2002
10
Cdn Assets / Challenges …
Sources: OECD, Main Science and Technology Indicators, 2006;Science,Technology and Innovation Council, Canada’s Science, Technology and Innovation System.State of the Nation. 2008
11
Cdn Assets / Challenges …
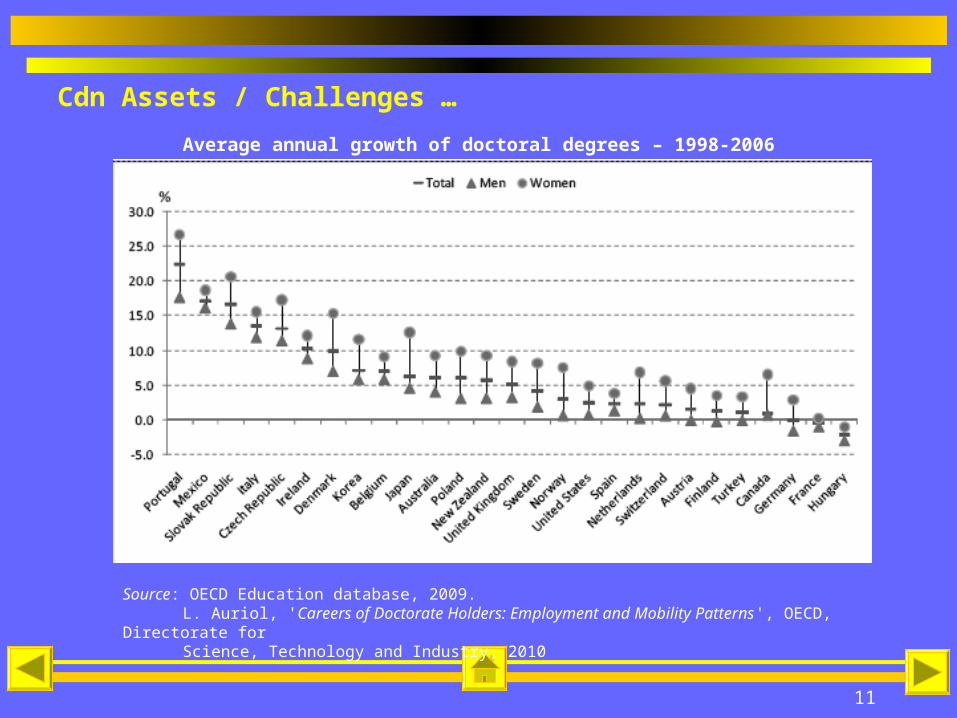
Source: OECD Education database, 2009.L. Auriol, 'Careers of Doctorate Holders: Employment and Mobility Patterns ', OECD, Directorate forScience, Technology and Industry, 2010
Average annual growth of doctoral degrees – 1998-2006

12
Canadian Strategy: ‘Building vs Buying’ Graduate Communities?
Source: Database on Immigrants in OECD countries, 2009L. Auriol, 'Careers of Doctorate Holders: Employment and Mobility Patterns ', OECD, Directorate for Science, Technology and Industry, 2010
Share of foreign-born among doctoral and tertiary-level graduatesin OECD countries, circa 2000

13
Number of Doctorate Holders (2006) by Place of Birth and Place of Doctorate Award
Born in Canada
Foreign born
Total
TOTAL 84565 92190 176755PhD received in Canada 63735 32660 96395PhD received in foreign country 20830 59530 80360
Source of data: Census of Population 2006.OECD, 2007 OECD/UIS/Eurostat data collection on Careers of doctorate holders.
PhD received inCanada PhD received in
foreign country
Born in Canada
Foreign born
32660
5953063735
20830
0
10000
20000
30000
40000
50000
60000
70000
Born in CanadaForeign born
75.4%
35.4%
64.6%
24.6% (92190=52.2%)
(84565=47.8%)
14
Cdn Strategy: ‘Building vs Buying’ Graduate Communities? …
'...century evidence of broadly declining migration rates between Canada and the USA even among those with high level skills.’
Canadian-born living in the USA: about 20% beginnning of the 20th Century vs about 2% beginning of the 21st Century
Canada's position in northbound/southbound migration flows: a net importer of skills
J.F. Helliwell. 2006. 'Highly Skilled Workers: Build, Share, or Buy?', Ottawa, Government of Canada, Skills Research Initiative

15
Key Challenges to survive / perform wellin a SDKP context
Priority to the Building Strategy for Graduate Communities (Including Retention of International Graduates)
Invest in People with Accurate Graduate Training Levels and Relevant Competencies : Priority to PhD Graduates
Strenghten Incentives for Both Fundamental and Decontextualized RD
Stimulate Partnerships Within / Beyond Academia and National / International Clusters
More $$ for Innovative Training Programs and Graduate Student International and Between Organizations Mobility


