Download - Building Resilience. Creating Opportunities


Building Resilience. Creating Opportunities.
HALF YEARLY REPORT JUNE 2021 1
CONTENT
Corporate Information
Directors' Report
Statement of Financial Position
Profit and Loss Account
Statement of Comprehensive Income
Statement of Changes in Equity
Cash Flow Statement
Notes to the Financial Statements
Consolidated Financial Statements
of NBP and its Subsidiary Companies
02
03
21
22
23
24
25
26
57
Auditiors’ Review Report 19
HALF YEARLY REPORT JUNE 2021
National Bank of Pakistan
2
CORPORATE INFORMATION
Board of Directors
Chairman Mr. Zubyr Soomro
Mr. Farid Malik, CFA
Mr. Tawfiq Asghar Hussain
Mr. Imam Bakhsh Baloch
Ms. Sadaffe Abid
Mr. Asif Jooma
Mr. Ahsan Ali Chughtai
Mr. Arif UsmaniPresident & CEO
Directors
Audit Committee
Chairman Mr. Tawfiq Asghar Hussain
Mr. Imam Bakhsh Baloch
Mr. Asif Jooma
Auditors
A.F. Ferguson & Co.
Chartered Accountants
Yousuf Adil
Chartered Accountants
Legal Advisors
Mandviwalla & Zafar
Advocates & Legal Consultants
Registered & Head Office
NBP Building
I.I. Chundrigar Road, Karachi, Pakistan.
Registrar & Share Registration Office
CDC Share Registrar Services Limited
CDC House, 99-B, Block-B,
S.M.C.H.S., Main Shara-e-Faisal
Karachi-74400, Pakistan.
111-111-500
Website
www.nbp.com.pk
Chief Financial Officer
Mr. Abdul Wahid Sethi
Company Secretary
Syed Muhammad Ali Zamin
Phone: 92-21-99220100 (30 lines),
92-21-99062000 (60 lines),
Phone Banking: 111-627-627

Building Resilience. Creating Opportunities.
HALF YEARLY REPORT JUNE 2021 3
Directors’ Report to the ShareholdersStandalone Financial Statements
We have pleasure in presenting to you, on behalf of the Board, our report on the standalone financial
statements of the Bank for the half-year ended June 30, 2021.
Globally, the past few months have brought positive news on the global economy, suggesting a vigorous
recovery from the COVID-19 crisis. In Pakistan, the economic recovery has maintained an upward
trajectory not only for FY2021 but also setting an optimistic baseline scenario for FY2022 as well. LSM
production has surpassed its pre-COVID level during Jul-May FY2021. Budget-2022 targets inclusive
and sustainable economic growth through pro-poor initiatives and social safety nets (Ehsaas
Programme’s vertical and horizontal expansion). Various measures for economic revival have been
introduced such as the relief for the automobile industry, an SME Support Program, higher Federal
PSDP 2021-22 and subsidies under Naya Pakistan Housing Scheme.
Dear Shareholders,
As a result of these developments, GDP growth is projected to rise from 3.9% in FY21 to 4-5 percent
this year, and average inflation to moderate to 7-9 percent this year from its recent highs. The
government’s measures combined with pressures for adherence to Covid-19 SoPs by the general public
will be helpful in continuation of the economic recovery along with decelerating inflationary pressures
and preserving acceptable external balances.
Macroeconomic Environment
Our Response to the Covid-19
The Board and the management of the Bank remain fully cognizant of the health and financial impact of
the pandemic on the Bank, its employees, its customers and the communities it serves. From the very
onset of the pandemic, your Bank has remained particularly focused on continuity of banking services to
the Bank’s customers while ensuring the health and safety of its frontline workforce. Constant efforts
have been made to keep the maximum number of branches operational while ensuring SoPs are
adhered to and necessary safety measures are effectively placed in all business premises of the Bank.
In continuation of our efforts towards vaccination of all NBP employees at their doorsteps, the Bank has
arranged vaccination drives for all NBP employees and their family members at the Head Office.
Average inflation stood within the projected range of 8-9%. Fiscal consolidation efforts are also on track
as the fiscal deficit was reduced to 4.6% of GDP (PKR 2,197 Bn) during Jul-May, FY2021, from 5.8% of
GDP (PKR 2,418 Bn) last year. The current account deficit that declined by 58.4% and reached USD 1.9
Bn (-0.6% of GDP, the lowest in 10 years) during FY2021, started to widen in the second half of FY21,
and is expected to remain within a sustainable range of 2-3% of GDP in FY22. With the widening of the
current account deficit, the PKR has depreciated by around 4% during the last couple of months. While
SBP’s Roshan Digital Account initiative has generated financial inflows of USD 1.8 Bn, workers’
remittances rose to USD 29.4 Bn (USD 23.1 Bn last year) for FY’21. SBP’s FX reserves rose by USD
5.2 Bn during FY21 to end at over USD 17 Bn or around 3 months of imports, which is a 4½ year high.
Monetary policy has remained accommodating as the State Bank of Pakistan has maintained the policy
rate at 7.0% to support the economy. While the banking sector’s profitability remained high for the half-
year ended June 30, 2021, asset quality has however emerged as a growing concern and banking
earnings have been reinforced by lower provisioning levels.
HALF YEARLY REPORT JUNE 2021
National Bank of Pakistan
4
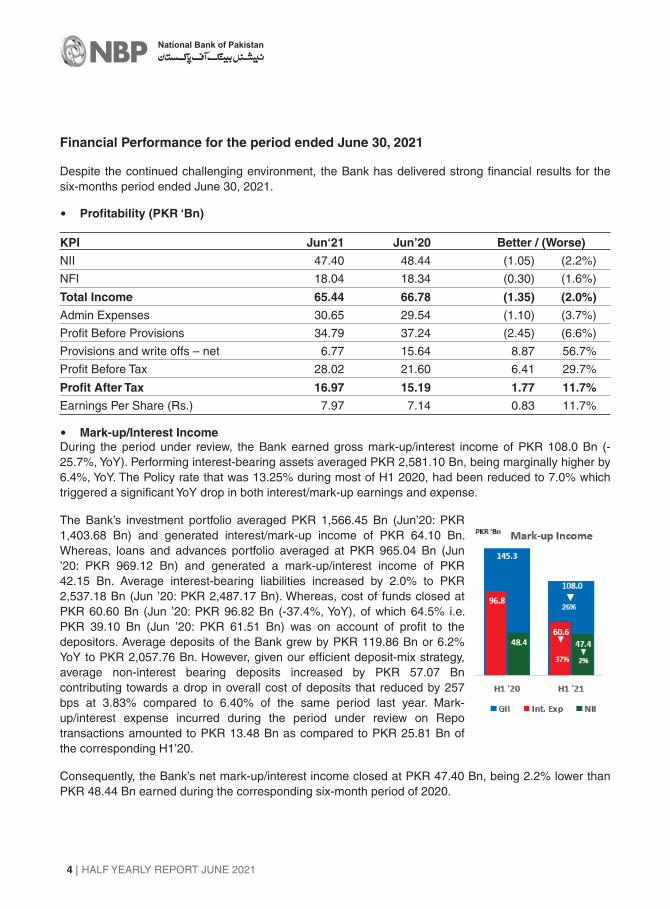
Financial Performance for the period ended June 30, 2021
Despite the continued challenging environment, the Bank has delivered strong financial results for the
six-months period ended June 30, 2021.
� Profitability (PKR ‘Bn)
KPI Jun‘21 Jun’20 Better / (Worse)
Total Income 65.44 66.78 (1.35) (2.0%)
Admin Expenses 30.65 29.54 (1.10) (3.7%)
Profit Before Provisions 34.79 37.24 (2.45) (6.6%)
Profit Before Tax 28.02 21.60 6.41 29.7%
During the period under review, the Bank earned gross mark-up/interest income of PKR 108.0 Bn (-
25.7%, YoY). Performing interest-bearing assets averaged PKR 2,581.10 Bn, being marginally higher by
6.4%, YoY. The Policy rate that was 13.25% during most of H1 2020, had been reduced to 7.0% which
triggered a significant YoY drop in both interest/mark-up earnings and expense.
� Mark-up/Interest Income
The Bank’s investment portfolio averaged PKR 1,566.45 Bn (Jun’20: PKR
1,403.68 Bn) and generated interest/mark-up income of PKR 64.10 Bn.
Whereas, loans and advances portfolio averaged at PKR 965.04 Bn (Jun
’20: PKR 969.12 Bn) and generated a mark-up/interest income of PKR
42.15 Bn. Average interest-bearing liabilities increased by 2.0% to PKR
2,537.18 Bn (Jun ’20: PKR 2,487.17 Bn). Whereas, cost of funds closed at
PKR 60.60 Bn (Jun ’20: PKR 96.82 Bn (-37.4%, YoY), of which 64.5% i.e.
PKR 39.10 Bn (Jun ’20: PKR 61.51 Bn) was on account of profit to the
depositors. Average deposits of the Bank grew by PKR 119.86 Bn or 6.2%
YoY to PKR 2,057.76 Bn. However, given our efficient deposit-mix strategy,
average non-interest bearing deposits increased by PKR 57.07 Bn
contributing towards a drop in overall cost of deposits that reduced by 257
bps at 3.83% compared to 6.40% of the same period last year. Mark-
up/interest expense incurred during the period under review on Repo
transactions amounted to PKR 13.48 Bn as compared to PKR 25.81 Bn of
the corresponding H1’20.
Consequently, the Bank’s net mark-up/interest income closed at PKR 47.40 Bn, being 2.2% lower than
PKR 48.44 Bn earned during the corresponding six-month period of 2020.
NII 47.40 48.44 (1.05) (2.2%)
NFI 18.04 18.34 (0.30) (1.6%)
Profit After Tax 16.97 15.19 1.77 11.7%
Earnings Per Share (Rs.) 7.97 7.14 0.83 11.7%
Provisions and write offs – net 6.77 15.64 8.87 56.7%
Building Resilience. Creating Opportunities.
HALF YEARLY REPORT JUNE 2021 5
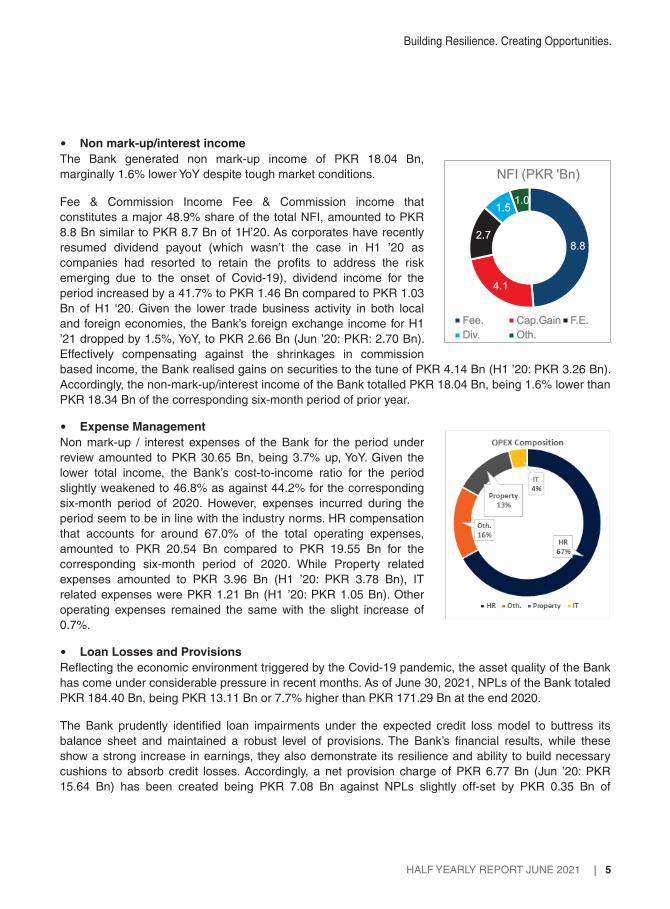
Fee & Commission Income Fee & Commission income that
constitutes a major 48.9% share of the total NFI, amounted to PKR
8.8 Bn similar to PKR 8.7 Bn of 1H’20. As corporates have recently
resumed dividend payout (which wasn’t the case in H1 ’20 as
companies had resorted to retain the profits to address the risk
emerging due to the onset of Covid-19), dividend income for the
period increased by a 41.7% to PKR 1.46 Bn compared to PKR 1.03
Bn of H1 ‘20. Given the lower trade business activity in both local
and foreign economies, the Bank’s foreign exchange income for H1
’21 dropped by 1.5%, YoY, to PKR 2.66 Bn (Jun ’20: PKR: 2.70 Bn).
Effectively compensating against the shrinkages in commission
based income, the Bank realised gains on securities to the tune of PKR 4.14 Bn (H1 ’20: PKR 3.26 Bn).
Accordingly, the non-mark-up/interest income of the Bank totalled PKR 18.04 Bn, being 1.6% lower than
PKR 18.34 Bn of the corresponding six-month period of prior year.
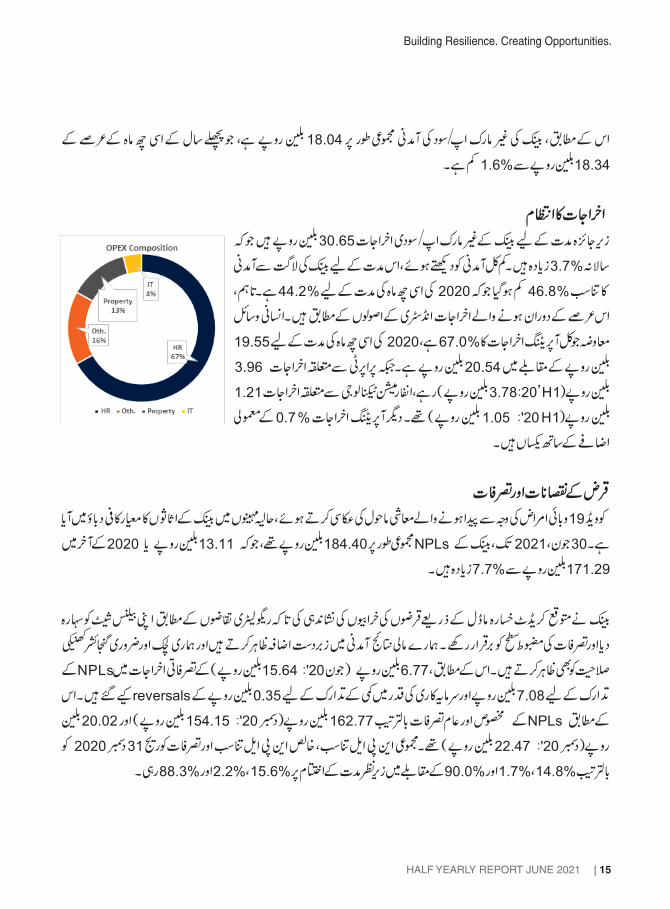
Non mark-up / interest expenses of the Bank for the period under
review amounted to PKR 30.65 Bn, being 3.7% up, YoY. Given the
lower total income, the Bank’s cost-to-income ratio for the period
slightly weakened to 46.8% as against 44.2% for the corresponding
six-month period of 2020. However, expenses incurred during the
period seem to be in line with the industry norms. HR compensation
that accounts for around 67.0% of the total operating expenses,
amounted to PKR 20.54 Bn compared to PKR 19.55 Bn for the
corresponding six-month period of 2020. While Property related
expenses amounted to PKR 3.96 Bn (H1 ’20: PKR 3.78 Bn), IT
related expenses were PKR 1.21 Bn (H1 ’20: PKR 1.05 Bn). Other
operating expenses remained the same with the slight increase of
0.7%.
� Expense Management
Reflecting the economic environment triggered by the Covid-19 pandemic, the asset quality of the Bank
has come under considerable pressure in recent months. As of June 30, 2021, NPLs of the Bank totaled
PKR 184.40 Bn, being PKR 13.11 Bn or 7.7% higher than PKR 171.29 Bn at the end 2020.
� Non mark-up/interest income
The Bank prudently identified loan impairments under the expected credit loss model to buttress its
balance sheet and maintained a robust level of provisions. The Bank’s financial results, while these
show a strong increase in earnings, they also demonstrate its resilience and ability to build necessary
cushions to absorb credit losses. Accordingly, a net provision charge of PKR 6.77 Bn (Jun ’20: PKR
15.64 Bn) has been created being PKR 7.08 Bn against NPLs slightly off-set by PKR 0.35 Bn of
� Loan Losses and Provisions
The Bank generated non mark-up income of PKR 18.04 Bn,
marginally 1.6% lower YoY despite tough market conditions.
8.8
4.1
2.7
1.51.0
NFI (PKR 'Bn)
Fee. Cap.Gain. F.E.
Div. Oth.

HALF YEARLY REPORT JUNE 2021
National Bank of Pakistan
6
Appropriation:
� Appropriation of Profit:
Profit available for appropriations 133.34
As of June 30, 2021 total assets of the Bank amounted to PKR 3,616.89 Bn which is 20.2% above the
year-end 2020 level of PKR 3,008.53 Bn. On the liability side, the Bank’s balance sheet is driven by its
wide market outreach and branch banking network where the focus remains on low-cost deposit
mobilization.
� Loans and Advances
Profit for the six-months ended June 30, 2021 after carry forward of accumulated profit of 2020 is
proposed to be appropriated as follows:
Financial Position as at June 30, 2021
The Bank has delivered an impressive 11.7% growth in profit after-tax that closed at PKR 16.97 Bn as
against PKR 15.19 Bn for the corresponding six-month period of 2020. The effective tax rate rose to
39.4% vs 29.7% for the corresponding period last year. It was due to, the impact of the
additional 2.5% tax imposed (in the Federal Budget) on the entire income on Federal Government
Securities for banks with ADR below the defined limits. This tax was previously imposed on the
incremental component of income.
interalia,
(PKR ‘Bn)
reversal against diminution in the value of investments. Consequently, the specific and general
provisions held stood at PKR 162.77 Bn (Dec’20: PKR 154.15 Bn) and PKR 20.02 Bn (Dec ’20: PKR
22.47 Bn), respectively. Gross NPL Ratio, Net NPL Ratio and provision coverage stood at 15.6%, 2.2%
and 88.3% at the end of period under review as compared to 14.8%, 1.7% and 90.0% as of Dec 31,
2020, respectively.
Un-appropriated profit brought forward 116.02
Transfer from surplus on revaluation of fixed assets 0.12
� Profit After-Taxation
Profit after tax for the six-months ended June 30, 2021 16.97
Other comprehensive income - net of tax 0.23
Transfer to Statutory Reserve (1.70)
Given the limited loan demand in the private sector, gross advances of the Bank grew marginally by
1.7% to PKR 1,179.73 Bn from PKR 1,159.87 Bn as at December 31, 2020. The Bank’s net advances
recorded a marginal growth of 1.4% to PKR 996.95 Bn from PKR 983.25 Bn at the end 2020. The Bank
is pursuing a more risk-prudent strategy for loan growth with a focus on small ticket loans to high quality
borrowers in the SME sector.
Un-appropriated profit carried forward 131.64

Building Resilience. Creating Opportunities.
HALF YEARLY REPORT JUNE 2021 7
� Capital Strength and Adequacy
As of June 30, 2021, total deposits of the Bank were PKR 2,679.74 Bn
being 10.8% higher against year-end, 2020 level of PKR 2,418.97 Bn.
The vast majority of the Bank’s funding comes from its core customer
deposit base which has continued to grow during H1 ‘2021. Customer
deposits pool-in 84.2% (PKR 2,255.23 Bn) of the Bank’s total deposits.
Compared to Dec 31, 2020 level, customer deposits have increased by
PKR 234.59 Bn or 11.6%. Non-remunerative current deposits are
significant at 27.6% of the total customer deposits; whereas
remunerative, but low cost current accounts deposits comprised 23.5%.
On a positive note, the Bank’s CASA ratio also improved to 85.9% (2020:
83.8%).
The liquidity position of the Bank is supported by the presence of sizeable liquid assets in relation to
deposits and borrowings. Furthermore, adequate liquidity is available through Liquidity Coverage Ratio
and Net Stable Funding Ratio over the regulatory requirements as the same amounted to 158% and
282% at Jun’21, respectively vis-à-vis regulatory requirement of 100% for each.
Pursuant to an effective risk and liquidity management strategy, the Bank is maintaining a diversified
investment portfolio across zero risk weighted instruments, high dividend yielding equities and other
interest-bearing financial instruments. As of June 30, 2021, investments at cost amounted to PKR
1,820.06 Bn (Dec’20: PKR 1,437.37 Bn), whereas the carrying value amounted to PKR 1,849.47 Bn
(Dec’20:PKR 1,463.40 Bn). This portfolio-mix gives the Bank flexibility to capitalise on short-term price
movement by frequently churning the short-term portfolio.
� Deposits & Funding
� Investments
The Bank is currently required to maintain CET-1 Ratio at 6.0% and Total Capital Adequacy Ratio at
13.5%. At June 30, 2021 the Bank’s eligible common equity Tier-1 amounted to PKR 190.5 Bn, 10.2%
up against PKR 172.9 Bn at the year-end 2020. At the end June 2021, the total Risk Weighted Assets
“RWAs” amounted to PKR 1,141.34 Bn (Dec ‘20: PKR 1,153.10 Bn). Higher profitability, coupled with
reduction in the capital conservation buffer and the total RWAs has improved the Bank’s tier-1 capital
ratio to 16.69% (Dec ’20: 14.99%) and total capital adequacy ratio to 22.18% (Dec ’20:19.78%). Both
the ratios are well compliant with the regulatory requirements. Net Assets at the end June ’21 stood at
PKR 285.54 Bn i.e. 6.7% or PKR 18.0 Bn. This translates into break-up value per share at Rs. 134.2,
depicting a 38% growth from Rs. 97.2 at the end of 2018.
Closure of foreign Subsidiaries and BranchesNecessary steps are underway to consolidate the Bank’s international footprint and implement it’s
decision on the closure of two (02) overseas subsidiaries along with three (03) overseas branches.
Further the Bank’s operations in Afghanistan and Bangladesh are being limited only to the branches in
the capital city Kabul and Dhaka, respectively.
58%28%
14%
Deposits
Current Savings Term

HALF YEARLY REPORT JUNE 2021
National Bank of Pakistan
8
Contingency Regarding the Pension Case
Internal Control & ComplianceThe Bank remains committed to ensure compliance with all the applicable laws, rules, regulations, and
codes in the spirit of good governance. To this end, the bank has supported investments in new
technological platforms for effective AML/CFT/CPF controls, data accuracy and authenticity, and internal
controls over financial reporting.
The international franchise of the Bank is being strategically streamlined to facilitate an enhanced level
of compliance. In 2016 the Bank and its New York branch entered into a written agreement with the
Federal Reserve Bank of New York and New York State Department of Financial Services (US
regulators). This agreement, inter-alia, requires the Bank to address certain compliance and risk
management matters relating to anti-money laundering and the US bank secrecy law requirements. This
agreement also requires implementation of the requisite systems and controls and the allocation of
adequate resources to ensure full compliance with such requirements. The Bank continues to undertake
necessary remedial actions to address the regulatory weaknesses highlighted in the 2016 written
agreement and those identified in subsequent examinations by the US regulators. However, the Bank
remains vulnerable until it completes the required remedial actions and the same are endorsed by the
US Regulators. These weaknesses as repeatedly pointed out by the regulators are the result of
inadequate standards followed over the last decade. Changing the culture related to that will take time
but our efforts are bearing fruit.
Status of the case is the same as disclosed in Note # 25.3.3.1 to the Annual Financial Statements for
the year ended December 31, 2020. The management‘s estimate of overall increase in pension liability,
based on the independent actuarial firm report for the half year ended June 30, 2021 amounted to PKR
73.4 Bn, excluding any penal interest / profit payment (if any) due to delayed payment. Further, the
pension expense for the year 2021 onward will also increase by PKR 7.4 Bn due to this decision. Based
on the opinion of legal counsel, no provision for any additional pension liability has been made in these
unconsolidated condensed interim financial statements for the above mentioned amount as the Bank
remains confident on the merits of its position in the matter. However, external auditors of the Bank have
inserted an emphasis of matter para in their review report on Financial Statements.
In exercise of powers conferred under Section 11(3) (a) of the Banks (Nationalization) Act, 1974, the
Federal Government has appointed Mr. Ahsan Ali Chughtai as an Independent Director on National
Bank of Pakistan (NBP)'s Board for a term of three (03) years effective June 21, 2021. Mr. Muhammad
Suhail Rajput resigned from the NBP Board on May 27, 2021.
Changes in the Board of Directors
Credit RatingsNBP is rated as ‘AAA’ by both the recognised credit rating agencies in Pakistan. In June 2021, M/s VIS
Credit Rating Company re-affirmed the Bank’s standalone credit rating as “AAA”, the highest credit
rating awarded by the company for a bank in Pakistan. Similarly, M/s PACRA Credit Rating Company
also assigned the Bank long-term entity rating as 'AAA' (Triple AAA) and short-term credit rating as
'A1+' (A-one Plus).

Building Resilience. Creating Opportunities.
HALF YEARLY REPORT JUNE 2021 9
Future Outlook
Your Bank will continue to play its role towards economic recovery in the country, while also maintaining
a strong & resilient balance sheet to deliver performance for its shareholders. The Bank’s business
strategy will remain focused on financing and supporting underserved sectors including SME,
Microfinance, Agriculture Finance and the PM’s Low-Cost Housing initiative as well as Islamic financing
on a priority basis.
We appreciate the continued efforts & dedication of our employees towards ensuring the continuity of
uninterrupted service to the Nation during these difficult times. We pay special respect and tribute to all
those NBP staff members who lost their lives in the line of duty during the Covid-19. May Allah grant
them the highest place in Jannah.
Acknowledgement & Appreciation
We would like to acknowledge the Government of Pakistan, the State Bank of Pakistan, the SECP and
other regulatory bodies for their continued support in enabling the Bank to achieve its potential towards
the socio-economic development of Pakistan.
For and on behalf of the Board of Directors
With the global economic recovery projected for 2021, economic momentum in Pakistan is also
expected to improve albeit below the pre pandemic levels. However, some volatility may be expected
amidst the recent geo-political changes in the region. While policy responses are expected to soften the
blow dealt to businesses by the pandemic outbreak, these may not fully offset the effects. The State
Bank of Pakistan has recently revised its projection for Pakistan’s economic growth to around 5.0%.
Karachi
Dated: August 26, 2021
Arif Usmani Zubyr Soomro
President & CEO Chairman
HALF YEARLY REPORT JUNE 2021
National Bank of Pakistan
10
Building Resilience. Creating Opportunities.
HALF YEARLY REPORT JUNE 2021 11
HALF YEARLY REPORT JUNE 2021
National Bank of Pakistan
12

Building Resilience. Creating Opportunities.
HALF YEARLY REPORT JUNE 2021 13
58%28%
14%
Deposits
Current Savings Term

HALF YEARLY REPORT JUNE 2021
National Bank of Pakistan
14
Building Resilience. Creating Opportunities.
HALF YEARLY REPORT JUNE 2021 15

HALF YEARLY REPORT JUNE 2021
National Bank of Pakistan
16
8.8
4.1
2.7
1.51.0
NFI (PKR 'Bn)
Fee. Cap.Gain. F.E.
Div. Oth.
3.26

Building Resilience. Creating Opportunities.
HALF YEARLY REPORT JUNE 2021 17

HALF YEARLY REPORT JUNE 2021
National Bank of Pakistan
18

Building Resilience. Creating Opportunities.
HALF YEARLY REPORT JUNE 2021 19
Independent auditors’ review report to the members of
National Bank of Pakistan
Report on review of unconsolidated condensed interim financial statements
Conclusion
Introduction
Based on our review, nothing has come to our attention that causes us to believe that the accompanying
unconsolidated condensed interim financial statements are not prepared, in all material respects, in
accordance with accounting and reporting standards as applicable in Pakistan for interim financial
reporting.
We have reviewed the accompanying unconsolidated condensed interim statement of financial position
of National Bank of Pakistan (the Bank) as at June 30, 2021 and the related unconsolidated condensed
interim profit and loss account, unconsolidated condensed interim statement of comprehensive income,
unconsolidated condensed interim cash flow statement, unconsolidated condensed interim statement of
changes in equity and notes to the unconsolidated condensed interim financial statements for the half
year then ended (here-in-after referred to as the “unconsolidated condensed interim financial
statements”). Management is responsible for the preparation and presentation of these interim financial
statements in accordance with accounting and reporting standards as applicable in Pakistan for interim
financial reporting. Our responsibility is to express a conclusion on these unconsolidated condensed
interim financial statements based on our review.
We conducted our review in accordance with International Standard on Review Engagements 2410,
"Review of Interim Financial Information Performed by the Independent Auditor of the Entity". A review
of interim financial statements consists of making inquiries, primarily of persons responsible for financial
and accounting matters, and applying analytical and other review procedures. A review is substantially
less in scope than an audit conducted in accordance with International Standards on Auditing and
consequently does not enable us to obtain assurance that we would become aware of all significant
matters that might be identified in an audit. Accordingly, we do not express an audit opinion.
Scope of Review
Chartered Accountants Chartered Accountants
Karachi - 74000
Yousuf Adil A.F. Ferguson & Co.
Cavish Court, KCHSU State Life Building No. 1-CShahrah-e-Faisal I.I Chundrigar RoadKarachi, Pakistan P.O. Box 4716
Deloitte Touche Tohmatsu LimitedIndependent Correspondent Firm to Member firm of PwC network

HALF YEARLY REPORT JUNE 2021
National Bank of Pakistan
20
We draw attention to note 22.3.3.1 to the unconsolidated condensed interim financial statements which
explains the contingency in relation to the pension obligations of the Bank. Based on the opinion of the
legal counsel, the Bank is confident about the favorable outcome of this matter and hence, no provision
against any additional pension obligation is made in the unconsolidated condensed interim financial
statements. Our conclusion is not modified in respect of this matter.
The engagement partners on the engagement resulting in this independent auditor’s review report are
Nadeem Yousuf Adil (Yousuf Adil, Chartered Accountants) and Shahbaz Akbar (A. F. Ferguson & Co.).
Yousuf Adil A.F. Ferguson & Co.
The financial statements of the Bank for the year ended December 31, 2020 and half year ended June
30, 2020 were audited and reviewed by Yousuf Adil, Chartered Accountants and Grant Thornton Anjum
Rahman, Chartered Accountants, who had expressed an unmodified opinion / conclusion on those
statements vide their reports dated February 25, 2021 and September 2, 2020 respectively.
Emphasis of Matter
Other Matter
The figures for the quarters ended June 30, 2021 and June 30, 2020 in the unconsolidated condensed
interim profit and loss account and unconsolidated condensed interim statement of comprehensive
income and figures for half year ended December 31, 2020 in unconsolidated condensed interim
statement of changes in equity have not been subject to review and therefore, we do not express a
conclusion thereon.
Chartered Accountants Chartered Accountants
Place: Karachi Place: Karachi
Date: August 27, 2021 Date: August 27, 2021
Chartered Accountants Chartered AccountantsYousuf Adil A.F. Ferguson & Co.
Deloitte Touche Tohmatsu LimitedIndependent Correspondent Firm to Member firm of PwC network
Building Resilience. Creating Opportunities.
HALF YEARLY REPORT JUNE 2021 21
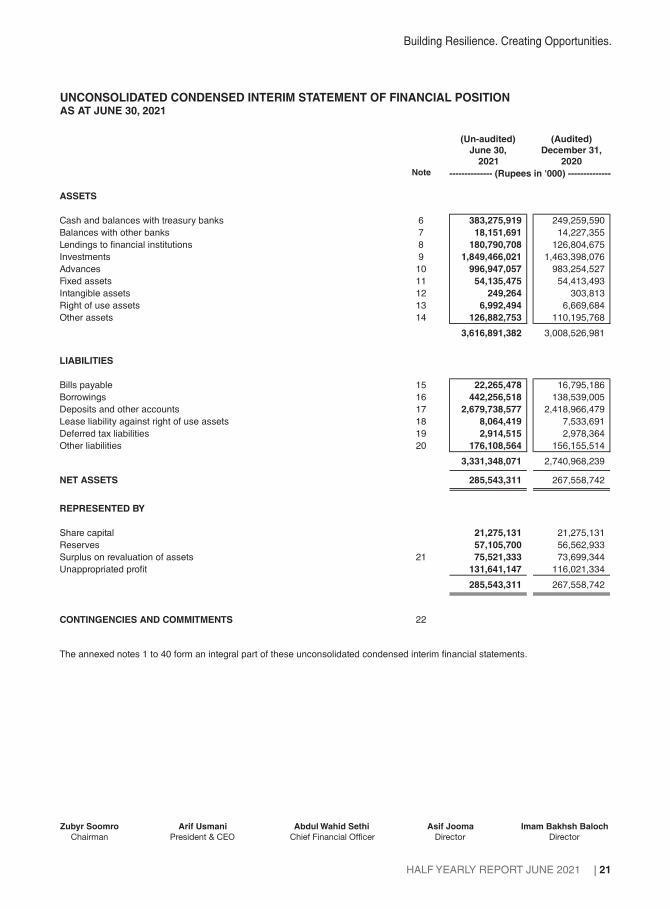
UNCONSOLIDATED CONDENSED INTERIM STATEMENT OF FINANCIAL POSITIONAS AT JUNE 30, 2021
Zubyr Soomro
Chairman
Arif Usmani
President & CEO
Abdul Wahid Sethi
Chief Financial Officer
Asif Jooma
Director
Imam Bakhsh Baloch
Director
(Un-audited)
June 30,
2021
(Audited)
December 31,
2020Note -------------- (Rupees in '000) --------------
ASSETS
Cash and balances with treasury banks 6 383,275,919 249,259,590
Balances with other banks 7 18,151,691 14,227,355
Lendings to financial institutions 8 180,790,708 126,804,675
Investments 9 1,849,466,021 1,463,398,076
Advances 10 996,947,057 983,254,527
Fixed assets 11 54,135,475 54,413,493
Intangible assets 12 249,264 303,813
Right of use assets 13 6,992,494 6,669,684
Other assets 14 126,882,753 110,195,768
3,616,891,382 3,008,526,981
LIABILITIES
Bills payable 15 22,265,478 16,795,186
Borrowings 16 442,256,518 138,539,005
Deposits and other accounts 17 2,679,738,577 2,418,966,479
Lease liability against right of use assets 18 8,064,419 7,533,691
Deferred tax liabilities 19 2,914,515 2,978,364
Other liabilities 20 176,108,564 156,155,514
3,331,348,071 2,740,968,239
NET ASSETS 285,543,311 267,558,742
REPRESENTED BY
Share capital 21,275,131 21,275,131
Reserves 57,105,700 56,562,933
Surplus on revaluation of assets 21 75,521,333 73,699,344
Unappropriated profit 131,641,147 116,021,334
285,543,311 267,558,742
CONTINGENCIES AND COMMITMENTS 22
The annexed notes 1 to 40 form an integral part of these unconsolidated condensed interim financial statements.
HALF YEARLY REPORT JUNE 2021
National Bank of Pakistan
22
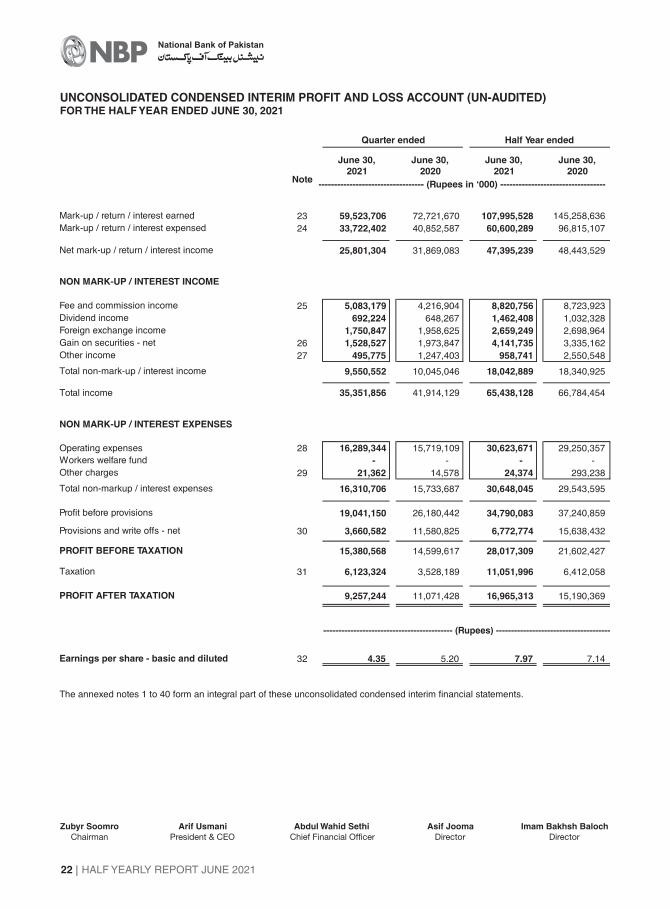
UNCONSOLIDATED CONDENSED INTERIM PROFIT AND LOSS ACCOUNT (UN-AUDITED)FOR THE HALF YEAR ENDED JUNE 30, 2021
Zubyr Soomro
Chairman
Arif Usmani
President & CEO
Abdul Wahid Sethi
Chief Financial Officer
Asif Jooma
Director
Imam Bakhsh Baloch
Director
June 30,2021
June 30,2020
June 30,2021
June 30,2020
Note
23
24
25
26
27
Total income
NON MARK-UP / INTEREST EXPENSES
Operating expenses 28
29
30
31
32
59,523,706
33,722,402
25,801,304
5,083,179
692,224
1,750,847
1,528,527
495,775
9,550,552
35,351,856
16,289,344
-
21,362
16,310,706
19,041,150
3,660,582
15,380,568
6,123,324
9,257,244
4.35
72,721,670
40,852,587
31,869,083
4,216,904
648,267
1,958,625
1,973,847
1,247,403
10,045,046
41,914,129
15,719,109
-
14,578
15,733,687
26,180,442
11,580,825
14,599,617
3,528,189
11,071,428
5.20
107,995,528
60,600,289
47,395,239
8,820,756
1,462,408
2,659,249
4,141,735
958,741
18,042,889
65,438,128
30,623,671
-
24,374
30,648,045
34,790,083
6,772,774
28,017,309
11,051,996
16,965,313
7.97
145,258,636
96,815,107
48,443,529
8,723,923
1,032,328
2,698,964
3,335,162
2,550,548
18,340,925
66,784,454
29,250,357
-
293,238
29,543,595
37,240,859
15,638,432
21,602,427
6,412,058
15,190,369
7.14
Mark-up / return / interest earned
------------------------------------------- (Rupees) --------------------------------------
Mark-up / return / interest expensed
Net mark-up / return / interest income
Other charges
Total non-mark-up / interest income
Other income
NON MARK-UP / INTEREST INCOME
Gain on securities - net
PROFIT BEFORE TAXATION
Earnings per share - basic and diluted
Fee and commission income
Total non-markup / interest expenses
---------------------------------- (Rupees in ‘000) ----------------------------------
Dividend income
Provisions and write offs - net
Quarter ended Half Year ended
PROFIT AFTER TAXATION
Workers welfare fund
The annexed notes 1 to 40 form an integral part of these unconsolidated condensed interim financial statements.
Profit before provisions
Foreign exchange income
Taxation

Building Resilience. Creating Opportunities.
HALF YEARLY REPORT JUNE 2021 23
UNCONSOLIDATED CONDENSED INTERIM STATEMENT OF COMPREHENSIVE INCOME (UN-AUDITED)
Profit after taxation for the period 9,257,244 11,071,428 16,965,313 15,190,369
Other comprehensive income
Items that may be reclassified to profit and loss account in
subsequent periods:
Exchange gain / (loss) on translation of net assets of foreign branches 1,162,903 (426,528) (1,153,764) 6,111
Movement in surplus on revaluation of investments - net of tax 5,230,861 11,326,723 1,969,638 11,303,388
6,393,764 10,900,195 815,874 11,309,499
Items that will not be reclassified to profit and loss account in
subsequent periods:
Remeasurement gain / (loss) on defined benefit
obligations - net of tax 106,567 (524,237) 230,872 (657,612)
Movement in surplus on revaluation of fixed assets -
net of tax (27,490) 575,049 (27,490) 575,049
Movement in surplus on revaluation of non-banking
assets - net of tax - -
79,077 50,813 203,382 (82,562)
Total comprehensive income 15,730,085 22,022,436 17,984,569 26,417,306
The annexed notes 1 to 40 form an integral part of these unconsolidated condensed interim financial statements.
June 30,2021
June 30,2020
June 30,2021
June 30,2020
------------------------------ (Rupees in ‘000) --------------------------
Quarter ended Half Year ended
FOR THE HALF YEAR ENDED JUNE 30, 2021
Zubyr Soomro
Chairman
Arif Usmani
President & CEO
Abdul Wahid Sethi
Chief Financial Officer
Asif Jooma
Director
Imam Bakhsh Baloch
Director
1 1

HALF YEARLY REPORT JUNE 2021
National Bank of Pakistan
24
UNCONSOLIDATED CONDENSED INTERIM STATEMENT OF CHANGES IN EQUITY (UN-AUDITED)FOR THE HALF YEAR ENDED JUNE 30, 2021
Exc
han
ge
tran
slat
ion
Sta
tuto
ry
rese
rve
Mer
ger
rese
rve
Gen
eral
loan
loss
res
erve
Rev
enu
e
gen
eral
rese
rve
To
tal
Inve
stm
ents
Fixe
d /
no
n-
ban
kin
g
asse
ts
To
tal
Bal
ance
as
atJa
nu
ary
01, 2
020
21,2
75,1
3110
,371
,792
33,0
71,8
1034
3,80
28,
000,
000
521,
338
52,3
08,7
4225
,659
,252
44,5
84,8
0870
,244
,060
88,7
85,9
0023
2,61
3,83
3
Prof
it af
ter
taxa
tion
for
the
half
year
end
ed J
une
30, 2
020
--
--
--
--
--
15,1
90,3
6915
,190
,369
Oth
er c
ompr
ehen
sive
inco
me
/ (lo
ss)
- ne
t of t
ax-
6,11
1-
--
-6,
111
11,3
03,3
8857
5,05
011
,878
,438
(657
,612
)11
,226
,937
Tran
sfer
to s
tatu
tory
rese
rve
--
1,51
9,03
7-
--
1,51
9,03
7-
--
(1,5
19,0
37)
-Tr
ansf
er fr
om s
urpl
us o
nre
valu
atio
nof
asse
ts to
una
ppro
pria
ted
prof
it -
net o
f tax
--
--
--
--
(113
,787
)(1
13,7
87)
113,
787
-
Tra
nsa
ctio
ns
wit
h o
wn
ers,
rec
ord
edd
irec
tly
in e
quit
y
Cas
hdi
vide
nd p
aid
for
the
year
end
edD
ecem
ber
31, 2
019
(Rs.
Nil
per
shar
e)-
--
--
--
--
--
-
Bal
ance
as
at J
uly
01, 2
020
21,2
75,1
3110
,377
,903
34,5
90,8
4734
3,80
28,
000,
000
521,
338
53,8
33,8
9036
,962
,640
45,0
46,0
7182
,008
,711
101,
913,
407
259,
031,
139
Prof
it af
ter t
axat
ion
for t
he h
alf y
ear e
nded
Dec
embe
r31,
202
0-
--
--
--
--
-15
,368
,550
15,3
68,5
50O
ther
com
preh
ensi
ve in
com
e / (
loss
) -
net o
f tax
-1,
192,
188
--
--
1,19
2,18
8(8
,461
,370
)26
8,59
5(8
,192
,775
)15
9,64
0(6
,840
,947
)Tr
ansf
er to
sta
tuto
ry re
serv
e-
-1,
536,
855
--
-1,
536,
855
--
-(1
,536
,855
)-
Tran
sfer
from
sur
plus
on
reva
luat
ion
ofas
sets
to u
napp
ropr
iate
d pr
ofit
- ne
t of t
ax-
--
--
--
-(1
16,5
92)
(116
,592
)11
6,59
2-
Bal
ance
as
at J
anu
ary
01, 2
021
21,2
75,1
3111
,570
,091
36,1
27,7
0234
3,80
28,
000,
000
521,
338
56,5
62,9
3328
,501
,270
45,1
98,0
7473
,699
,344
116,
021,
334
267,
558,
742
Prof
it af
ter
taxa
tion
for
the
half
year
end
ed J
une
30, 2
021
--
--
--
--
--
16,9
65,3
1316
,965
,313
Oth
er c
ompr
ehen
sive
inco
me
/ (lo
ss)
- ne
t of t
ax-
(1,1
53,7
64)
--
--
(1,1
53,7
64)
1,96
9,63
8(2
7,49
0)1,
942,
148
230,
872
1,01
9,25
6Tr
ansf
er to
sta
tuto
ry re
serv
e-
-1,
696,
531
--
-1,
696,
531
--
-(1
,696
,531
)-
Tran
sfer
from
sur
plus
on
reva
luat
ion
ofas
sets
to u
napp
ropr
iate
d pr
ofit
- ne
t of t
ax-
--
--
--
-(1
20,1
59)
(120
,159
)12
0,15
9-
Tra
nsa
ctio
ns
wit
h o
wn
ers,
rec
ord
edd
irec
tly
in e
quit
y
Cas
hdi
vide
nd p
aid
for
the
year
end
edD
ecem
ber
31, 2
020
(Rs.
Nil
per
shar
e)-
--
--
--
--
--
-
Bal
ance
as
atJu
ne
30, 2
021
21,2
75,1
3110
,416
,327
37,8
24,2
3334
3,80
28,
000,
000
521,
338
57,1
05,7
0030
,470
,908
45,0
50,4
2575
,521
,333
131,
641,
147
285,
543,
311
The
ann
exed
not
es 1
to 4
0 fo
rm a
nin
tegr
alpa
rt o
f the
se u
ncon
solid
ated
con
dens
ed in
terim
fina
ncia
l sta
tem
ents
.
Un
app
rop
riat
ed
pro
fit
To
tal
----
----
----
----
----
----
----
----
----
----
----
----
----
----
----
----
----
----
----
----
----
----
----
----
----
----
---
(Ru
pe
es
in
'00
0)
----
----
----
----
----
----
----
----
----
----
----
----
----
----
----
----
----
----
----
----
----
----
----
----
----
----
---
Sh
are
cap
ital
Res
erve
sS
urp
lus
on
rev
alu
atio
n o
f as
sets
Zu
byr
So
om
ro
Chairm
an
Ari
f U
sm
an
i
Pre
sid
en
t &
CE
O
Ab
du
lWa
hid
Se
thi
Ch
ief
Fin
an
cia
l O
ffic
er
As
if J
oo
ma
Directo
r
Ima
m B
ak
hs
h B
alo
ch
Directo
r
Building Resilience. Creating Opportunities.
HALF YEARLY REPORT JUNE 2021 25
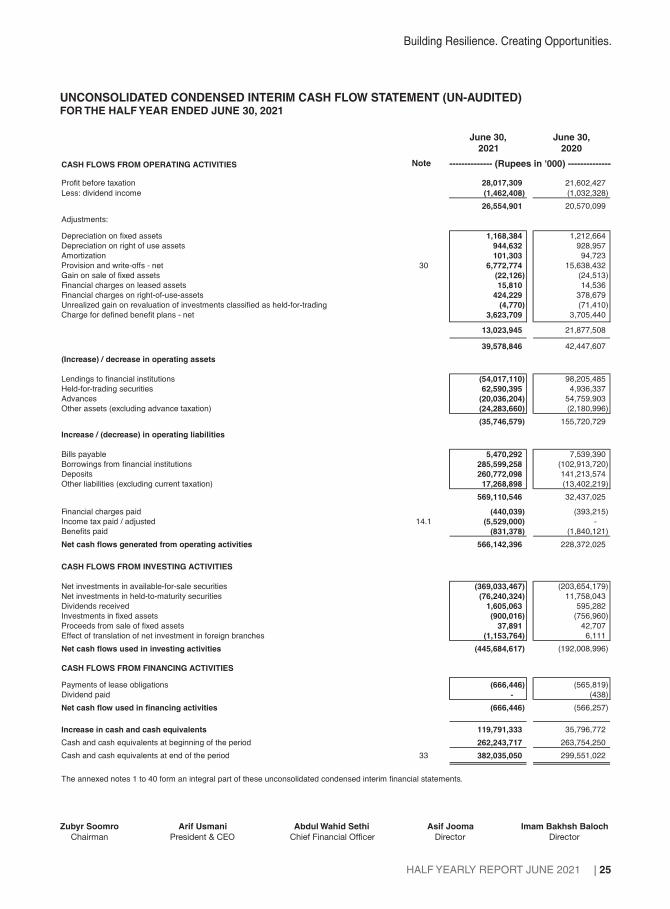
UNCONSOLIDATED CONDENSED INTERIM CASH FLOW STATEMENT (UN-AUDITED)FOR THE HALF YEAR ENDED JUNE 30, 2021
CASH FLOWS FROM OPERATING ACTIVITIES
Profit before taxation 21,602,427
Less: dividend income (1,032,328)
28,017,309
(1,462,408)
26,554,901 20,570,099
Adjustments:
Depreciation on fixed assets 1,168,384 1,212,664
Depreciation on right of use assets 944,632 928,957
Amortization 101,303 94,723
Provision and write-offs - net 30 6,772,774 15,638,432
Gain on sale of fixed assets (22,126) (24,513)
Financial charges on leased assets 15,810 14,536
Financial charges on right-of-use-assets 424,229 378,679
Unrealized gain on revaluation of investments classified as held-for-trading (4,770) (71,410)
Charge for defined benefit plans - net 3,623,709 3,705,440
13,023,945 21,877,508
39,578,846 42,447,607
(Increase) / decrease in operating assets
Lendings to financial institutions (54,017,110) 98,205,485
Held-for-trading securities 62,590,395 4,936,337
Advances (20,036,204) 54,759,903
Other assets (excluding advance taxation) (24,283,660) (2,180,996)
(35,746,579) 155,720,729
Increase / (decrease) in operating liabilities
Bills payable 5,470,292 7,539,390
Borrowings from financial institutions 285,599,258 (102,913,720)
Deposits 260,772,098 141,213,574
Other liabilities (excluding current taxation) 17,268,898 (13,402,219)
569,110,546 32,437,025
Financial charges paid (440,039) (393,215)
Income tax paid / adjusted 14.1 (5,529,000) -
Benefits paid (831,378) (1,840,121)
Net cash flows generated from operating activities 566,142,396 228,372,025
CASH FLOWS FROM INVESTING ACTIVITIES
Net investments in available-for-sale securities (369,033,467) (203,654,179)
Net investments in held-to-maturity securities (76,240,324) 11,758,043
Dividends received 1,605,063 595,282
Investments in fixed assets (900,016) (756,960)
Proceeds from sale of fixed assets 37,891 42,707
Effect of translation of net investment in foreign branches (1,153,764) 6,111
Net cash flows used in investing activities (445,684,617) (192,008,996)
CASH FLOWS FROM FINANCING ACTIVITIES
Payments of lease obligations (666,446) (565,819)
Dividend paid - (438)
Net cash flow used in financing activities (666,446) (566,257)
Increase in cash and cash equivalents 119,791,333 35,796,772
Cash and cash equivalents at beginning of the period 262,243,717 263,754,250
Cash and cash equivalents at end of the period 33 382,035,050 299,551,022
The annexed notes 1 to 40 form an integral part of these unconsolidated condensed interim financial statements.
June 30,
2021
June 30,
2020
Note -------------- (Rupees in '000) --------------
Zubyr Soomro
Chairman
Arif Usmani
President & CEO
Abdul Wahid Sethi
Chief Financial Officer
Asif Jooma
Director
Imam Bakhsh Baloch
Director

HALF YEARLY REPORT JUNE 2021
National Bank of Pakistan
26
NOTES TO THE UNCONSOLIDATED CONDENSED INTERIM FINANCIAL STATEMENTS (UN-AUDITED)FOR THE HALF YEAR ENDED JUNE 30, 2021
2.1.1 These unconsolidated condensed interim financial statements have been prepared in accordance with the accounting and
reporting standards as applicable in Pakistan for interim financial reporting. The accounting and reporting standards as
applicable in Pakistan for interim financial reporting comprise of:
2.1.2 The SBP vide BSD Circular letter No.10, dated August 26, 2002 has deferred the applicability of International Accounting
Standard 39, Financial Instruments (IAS 39): Recognition and Measurement and International Accounting Standard 40,
Investment Property for banking companies till further instructions. Moreover, SBP vide BPRD circular No.4, dated February
25, 2015 has deferred the applicability of Islamic Financial Accounting Standards IFAS 3, Profit and Loss Sharing on Deposits.
Further, according to the notification of the SECP issued vide SRO 411(I) /2008 dated April 28, 2008, International Financial
Reporting Standard IFRS 7, Financial Instruments: Disclosures has not been made applicable for banks. Accordingly, the
requirements of these standards have not been considered in the preparation of these unconsolidated condensed interim
financial statements. However, investments have been classified and valued in accordance with the requirements of various
circulars issued by the SBP.
2.1.4 The disclosures made in these unconsolidated condensed interim financial statements have been limited based on the format
prescribed by the SBP vide BPRD Circular No. 5, dated March 22, 2019 and International Accounting Standard IAS 34,
'Interim Financial Reporting' and do not include all the information required in the annual financial statements. Accordingly,
these unconsolidated condensed interim financial statements should be read in conjunction with the annual financial
statements of the Bank for the year ended December 31, 2020.
2. BASIS OF PRESENTATION
National Bank of Pakistan (the Bank) was incorporated in Pakistan under the National Bank of Pakistan Ordinance, 1949 and
is listed on Pakistan Stock Exchange (PSX). The registered and head office of the Bank is situated at I.I. Chundrigar Road,
Karachi. The Bank is engaged in providing commercial banking and related services in Pakistan and overseas. The Bank also
handles treasury transactions for the Government of Pakistan (GoP) as an agent to the State Bank of Pakistan (SBP). The
Bank operates 1,514 (December 31, 2020: 1,514) branches in Pakistan and 21 (December 31, 2020: 21) overseas branches
(including the Export Processing Zone branch, Karachi).
2.1 STATEMENT OF COMPLIANCE
2.1.5 These unconsolidated condensed interim financial statements are the separate financial statements of the Bank in which the
investments in subsidiaries, associates and joint ventures are stated at cost and have not been accounted for on the basis of
reported results and net assets of the investees.
- Provisions of and directives issued under the Banking Companies Ordinance, 1962 and the Companies Act, 2017; and
- Directives issued by the State Bank of Pakistan (SBP) and the Securities and Exchange Commission of Pakistan
(SECP).
Wherever the requirements of the Banking Companies Ordinance,1962, the Companies Act, 2017, or the directives issued by
the SBP and the SECP differ with the requirements of IAS 34 or IFAS, the requirements of the Banking Companies Ordinance,
1962, the Companies Act, 2017 and the said directives shall prevail.
- Islamic Financial Accounting Standards (IFAS) issued by the Institute of Chartered Accountants of Pakistan as are
notified under the Companies Act, 2017;
1. STATUS AND NATURE OF BUSINESS
- International Accounting Standard (IAS) 34, Interim Financial Reporting, issued by the International Accounting
Standards Board (IASB) as notified under the Companies Act, 2017;
2.1.3 The SECP vide SRO 56 (1) / 2016 dated January 28, 2016, has notified that the requirements of IFRS 10 (Consolidated
Financial Statements) and section 228 of the Companies Act, 2017 will not be applicable with respect to the investment in
mutual funds established under Trust structure.

Building Resilience. Creating Opportunities.
HALF YEARLY REPORT JUNE 2021 27
3. Application of new and revised International Financial Reporting Standards (IFRSs)
4. SIGNIFICANT ACCOUNTING POLICIES
5. CRITICAL ACCOUNTING ESTIMATES AND JUDGMENTS
3.1 Standards, interpretations of and amendments to accounting and reporting standards that are effective in the
current period
There are certain amendments to existing accounting and reporting standards that have become applicable to the Bank for
accounting periods beginning on or after January 01, 2021. These are either considered to be not relevant or do not have any
significant impact on these unconsolidated condensed interim financial statements.
Standards, interpretations of and ammendments to accounting and reporting standards that are not yet effective
As per the SBP's BPRD Circular Letter no. 24 dated July 05, 2021, the implementation of IFRS 9 to banks in Pakistan has
been deferred to accounting periods beginning on or after January 01, 2022. Meanwhile, banks are required to submit IFRS 9
compatible pro forma financial statements for the year ending December 31, 2021 and perform parallel run of IFRS 9 on
quarterly basis. Further, the SBP will provide a timeline by December 2021 for absorption of "Expected Credit Loss" (ECL), for
Capital Adequacy Ratio (CAR) purposes, after assessment / evaluation of pro forma financial statements. Currently, the Bank
is in the process of assessing the impact of application of IFRS 9 on the Bank's financial statements on the basis of draft
guidelines issued by the State Bank of Pakistan.
There are certain other new amendments that are mandatory for the Bank's accounting periods beginning on or after January
01, 2022, but are considered not to be relevant or will not have significant effect on the Bank's operations and are, therefore,
not detailed in these unconsolidated condensed interim financial statements.
The accounting policies adopted for presentation of these unconsolidated condensed interim financial statements are same
as those followed in presentation of the unconsolidated financial statements of the Bank for the year ended December 31,
2020.
The basis for accounting estimates adopted in the preparation of these unconsolidated condensed interim financial
statements is the same as that applied in the preparation of the unconsolidated financial statements for the year ended
December 31, 2020.
6. CASH AND BALANCES WITH TREASURY BANKS
In hand
Local currency 53,998,795 48,290,809
Foreign currencies 8,710,604 6,425,017
62,709,399 54,715,826
With State Bank of Pakistan in
Local currency current accounts 6.1 249,223,433 125,017,240
Foreign currency current accounts 6.2 10,201,205 10,209,399
Foreign currency deposit accounts 6.2 20,957,327 21,022,297
Foreign currency collection accounts 1,761,887 1,618,084
282,143,852 157,867,020
With other central banks in
Foreign currency current accounts 6.3 26,153,643 29,581,326
Foreign currency deposit accounts 6.3 3,305,698 4,789,170
29,459,341 34,370,496
Prize bonds 8,963,327 2,306,248
383,275,919 249,259,590
(Un-audited)
June 30,
2021
(Audited)
December 31,
2020Note -------------- (Rupees in '000) --------------

HALF YEARLY REPORT JUNE 2021
National Bank of Pakistan
28
6.3 These balances pertain to the foreign branches and are held with central banks of respective countries. These include
balances to meet the statutory and regulatory requirements in respect of liquidity and capital requirements of respective
countries. The deposit accounts carry interest at the rate of 0% to 6.3% per annum (December 31, 2020: 0.00% to 3.5% per
annum).
6.2 These represent mandatory reserves maintained in respect of foreign currency deposits under FE-25 scheme, as prescribed
by the SBP.
6.1 This includes statutory liquidity reserves maintained with the SBP under Section 22 of the Banking Companies Ordinance,
1962.
7. BALANCES WITH OTHER BANKS
In Pakistan
In deposit accounts 7.1 12,199 11,948
Outside Pakistan
In current accounts 10,788,973 8,336,597
In deposit accounts 7.2 7,350,519 5,878,810
18,139,492 14,215,407
18,151,691 14,227,355
8. LENDINGS TO FINANCIAL INSTITUTIONS
Call / clean money lendings 8.1 2,009,723 2,040,800
Repurchase agreement lendings (reverse repo) 8.2 178,780,985 124,763,875
Letters of placement 8.3 174,150 176,150
8.4 180,964,858 126,980,825
Less: provision held against lendings to financial institutions 8.5 (174,150) (176,150)
Lendings to financial institutions - net of provision 180,790,708 126,804,675
(Un-audited)
June 30,
2021
(Audited)
December 31,
2020Note -------------- (Rupees in '000) --------------
7.1 These include various deposits with banks and carry interest at rates ranging from 2% to 7% per annum (December 31, 2020:
2% to 8% per annum).
7.2 These include various deposits with correspondent banks outside Pakistan and carry interest at rates ranging from 0% to
1.9% per annum (December 31, 2020: 0.00% to 2.5% per annum).
(Un-audited)
June 30,
2021
(Audited)
December 31,
2020Note -------------- (Rupees in '000) --------------
8.2 These carry mark-up at rates ranging from 7.0% to 7.8% per annum (December 31, 2020: 6% to 7.29% per annum) with
maturities ranging from July 2, 2021 to July 15, 2021.
8.3 These are overdue placements and full provision has been made against these placements as at June 30, 2021.
8.1 This includes zero rate lending to a financial institution amounting to Rs. 9.7 million (December 31, 2020: Rs. 40.8 million)
which is guaranteed by the SBP.

Building Resilience. Creating Opportunities.
HALF YEARLY REPORT JUNE 2021 29
8.4 Particulars of lending
In local currency 180,964,858 126,980,825
180,964,858 126,980,825
8.5 Movement in provision held against lendings is as follows:
Opening balance 176,150 176,150
Reversal for the period (2,000) -
Closing balance 174,150 176,150
8.6 Securities held as collateral against lendings to financial institutions
Market Treasury Bills 16,651,280 - 16,651,280 91,230,121 - 91,230,121
Pakistan Investment Bonds 162,129,705 - 162,129,705 33,533,754 - 33,533,754
Total 178,780,985 - 178,780,985 124,763,875 - 124,763,875
8.7 Category of classification
Classified
Lending
Provision
held
Classified
Lending
Domestic
Loss 174,150 174,150 176,150 176,150
December 31, 2020 (Audited)June 30, 2021 (Un-audited)
----------------------------------------------------------- (Rupees in '000) -----------------------------------------------------------
June 30, 2021 (Un-audited) December 31, 2020 (Audited)
TotalHeld by
Bank
Further given
as collateralTotal
Held by
Bank
Further given as
collateral
------------------------------------- (Rupees in '000) -------------------------------------
8.6.1 Market value of the securities under repurchase agreement lendings amounts to Rs. 178,657 million (December 31, 2020:
Rs.125,094 million).
(Un-audited)
June 30,
2021
(Audited)
December 31,
2020
-------------- (Rupees in '000) --------------
Provision
held

HALF YEARLY REPORT JUNE 2021
National Bank of Pakistan
30
9. INVESTMENTS
9.1 Investments by type:
Held-for-trading securities
Market Treasury Bills
Pakistan Investment Bonds
Available-for-sale securities
Pakistan Investment Bonds
Market Treasury Bills
Ijarah Sukuks
Ordinary shares of listed companies (5,568,236)
Ordinary shares of unlisted companies (410,893)
Preference shares (539,708)
Investments in mutual funds (41,167)
Ordinary shares of a bank outside Pakistan
Term Finance Certificates / Musharika
Participation Term Certificate and Sukuk Bonds (5,196,406)
GoP Foreign Currency Bonds
Foreign Government Securities
Foreign Currency Debt Securities
(11,756,410)
Held-to-maturity securities
Pakistan Investment Bonds
Market Treasury Bills
Debentures, Bonds, Sukuks, Participation Term
Certificates and Term Finance Certificates (407,135)
Bai muajjal with Government of Pakistan
GoP Foreign Currency Bonds
Foreign Government Securities
Foreign Currency Debt Securities
(407,135)
Associates (3,821,853)
Joint Venture
-
-
-
-
-
-
-
-
-
-
-
-
-
-
-
-
-
Subsidiaries (1,838,262)
Total investments
31,227,096
2,839,316
34,066,412
465,084,119
909,862,752
8,001,105
31,930,641
1,886,982
1,724,308
619,646
463,294
53,847,835
11,495,889
785,847
-
1,485,702,418
193,074,385
49,136,078
415,931
12,258,184
2,742,447
31,421,133
608
289,048,766
4,970,863
2,362,433
3,906,750
1,820,057,642
-
-
-
-
-
-
(5,426,217)
(410,893)
(539,708)
(41,167)
-
(5,223,729)
-
-
(11,641,714)
-
-
(407,134)
-
-
-
-
(407,134)
(3,587,603)
-
(1,838,262)
(17,474,713)
7,126
(2,356)
4,770
1,504,752
395,550
53,894
18,826,703
-
105,000
1,579,311
23,109,746
875,748
384,899
42,719
-
46,878,322
-
-
-
-
-
-
-
-
-
-
-
46,883,092
31,234,222
2,836,960
34,071,182
466,588,871
910,258,302
8,054,999
45,331,127
1,476,089
1,289,600
2,157,790
23,573,040
-
49,499,854
11,880,788
828,566
-
1,520,939,026
193,074,385
49,136,078
8,797
12,258,184
2,742,447
31,421,133
608
288,641,632
1,383,260
2,362,433
2,068,488
1,849,466,021
96,157,306
496,805
96,654,111
470,136,168
529,397,138
6,000,000
33,237,574
1,865,982
1,445,308
619,646
463,295
60,199,753
10,429,632
2,795,017
79,438
1,116,668,951
168,422,981
-
414,973
11,641,133
-
32,328,738
618
212,808,443
4,970,863
2,362,433
3,906,750
1,437,371,550 (17,823,660)
3,529
(1,455)
2,074
2,776,564
690,816
15,600
20,238,444
-
194,250
1,421,691
17,189,483
856,659
411,243
52,159
1,202
43,848,111
-
-
-
-
-
-
-
-
-
-
43,850,185
96,160,835
495,350
96,656,185
472,912,732
530,087,954
6,015,600
47,907,782
1,455,089
1,099,850
2,000,170
17,652,778
55,860,006
10,840,875
2,847,176
80,640
1,148,760,652
168,422,981
-
7,838
11,641,133
-
32,328,738
618
212,401,308
1,149,010
2,362,433
2,068,488
1,463,398,076
Surplus /
(deficit)
Carrying
value
December 31, 2020 (Audited)June 30, 2021 (Un-audited)
Provision for
diminution
Cost /
amortized cost
Surplus /
(deficit)
Carrying
value
Cost /
amortized cost
Provision for
diminution
----------------------------------------------------------- (Rupees in '000) -----------------------------------------------------------

Building Resilience. Creating Opportunities.
HALF YEARLY REPORT JUNE 2021 31
9.1.1 Investments given as collateral
Pakistan Investment Bonds 17,500,000 2,300,000
Market Treasury Bills 251,186,265 3,000,000
268,686,265 5,300,000
9.2 Provision for diminution in value of investments
9.2.1 Opening balance 17,823,660 17,950,047
Charge for the period 592,843 1,164,846
Reversals for the period (941,790) (1,291,233)
(348,947) (126,387)
Closing balance 17,474,713 17,823,660
9.2.2 Particulars of provision against debt securities
Category of classification
NPL Provision NPL Provision
Domestic
Doubtful - - 119,133 59,567
Loss 5,639,627 5,630,863 5,552,738 5,543,973
5,639,627 5,630,863 5,671,871 5,603,540
------------------------------------- (Rupees in '000) ------------------------------------
June 30, 2021 (Un-audited) December 31, 2020 (Audited)
(Un-audited)
June 30,
2021
(Audited)
December 31,
2020
-------------- (Rupees in '000) --------------
10. ADVANCES
Note
Loans, cash credits, running finances, etc. 930,999,824 931,976,385 170,855,759 160,045,212 1,101,855,583 1,092,021,597
Islamic financing and related assets 37,290,296 37,546,863 602,837 602,913 37,893,133 38,149,776
Net Investment in finance lease 10.1 52,894 58,239 - - 52,894 58,239
Bills discounted and purchased 26,987,853 18,998,127 12,945,291 10,646,008 39,933,144 29,644,135
Advances - gross 10.2 995,330,867 988,579,614 184,403,887 171,294,133 1,179,734,754 1,159,873,747
Provision against advances
- Specific - - 162,765,550 154,145,472 162,765,550 154,145,472
- General 20,022,147 22,473,748 - - 20,022,147 22,473,748
10.4 20,022,147 22,473,748 162,765,550 154,145,472 182,787,697 176,619,220
Advances - net of provision 975,308,720 966,105,866 21,638,337 17,148,661 996,947,057 983,254,527
Performing Non performing Total
(Audited)
December 31,
2020
(Un-audited)
June 30,
2021
(Audited)
December 31,
2020
(Un-audited)
June 30,
2021
(Audited)
December 31,
2020
(Un-audited)
June 30,
2021
9.3 The market value of securities classified as held-to-maturity as at June 30, 2021 amounted to Rs. 295,667 million (December
31, 2020: Rs. 218,678 million).
-------------------------------------------------------------- (Rupees in '000) --------------------------------------------------------------
HALF YEARLY REPORT JUNE 2021
National Bank of Pakistan
32
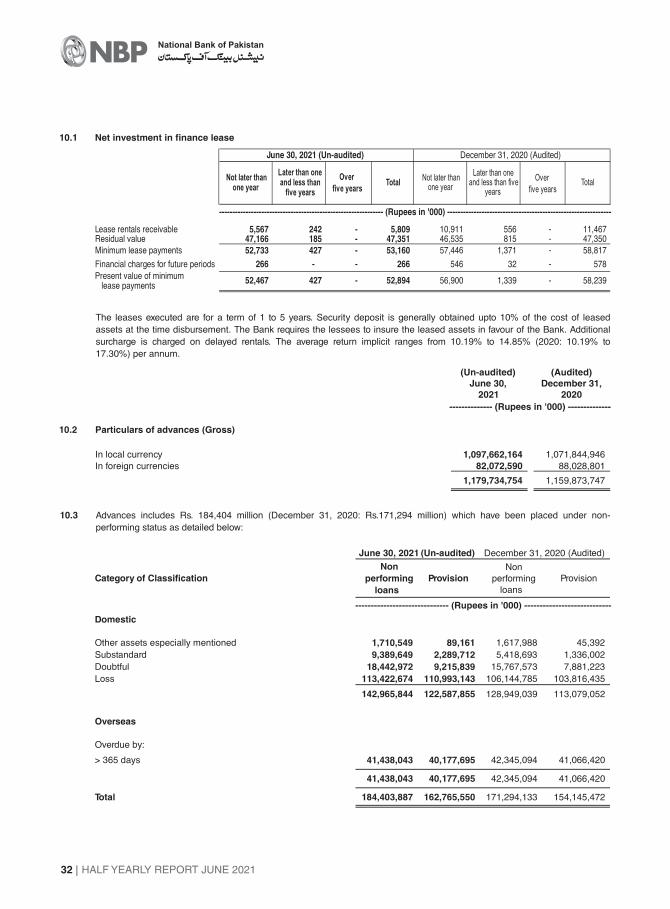
10.3 Advances includes Rs. 184,404 million (December 31, 2020: Rs.171,294 million) which have been placed under non-
performing status as detailed below:
10.1 Net investment in finance lease
Lease rentals receivable 5,567 242 - 5,809 10,911 556 - 11,467Residual value 47,166 185 - 47,351 46,535 815 - 47,350
Minimum lease payments 52,733 427 - 53,160 57,446 1,371 - 58,817
Financial charges for future periods 266 - - 266 546 32 - 578
Present value of minimumlease payments
10.2 Particulars of advances (Gross)
In local currency 1,097,662,164 1,071,844,946
In foreign currencies 82,072,590 88,028,801
1,179,734,754 1,159,873,747
Later than oneand less than
five yearsTotal
Not later thanone year
Later than oneand less than five
years
Over
five yearsTotal
Not later thanone year
June 30, 2021 (Un-audited) December 31, 2020 (Audited)
-42752,467 58,239-1,33956,90052,894
Over
five years
Category of Classification
Non
loans
performing Provision
Non
loans
performing Provision
Domestic
Other assets especially mentioned 1,710,549 89,161 1,617,988 45,392
Substandard 9,389,649 2,289,712 5,418,693 1,336,002
Doubtful 18,442,972 9,215,839 15,767,573 7,881,223
Loss 113,422,674 110,993,143 106,144,785 103,816,435
142,965,844 122,587,855 128,949,039 113,079,052
Overseas
Overdue by:
> 365 days 41,438,043 40,177,695 42,345,094 41,066,420
41,438,043 40,177,695 42,345,094 41,066,420
Total 184,403,887 162,765,550 171,294,133 154,145,472
June 30, 2021 (Un-audited) December 31, 2020 (Audited)
The leases executed are for a term of 1 to 5 years. Security deposit is generally obtained upto 10% of the cost of leased
assets at the time disbursement. The Bank requires the lessees to insure the leased assets in favour of the Bank. Additional
surcharge is charged on delayed rentals. The average return implicit ranges from 10.19% to 14.85% (2020: 10.19% to
17.30%) per annum.
(Un-audited)
June 30,
2021
(Audited)
December 31,
2020
-------------- (Rupees in '000) --------------
-------------------------------------------------------------- (Rupees in '000) --------------------------------------------------------------
------------------------------ (Rupees in '000) ----------------------------

Building Resilience. Creating Opportunities.
HALF YEARLY REPORT JUNE 2021 33
10.4 Particulars of provision against advances
Specific General Total Specific General Total
Note
Opening balance 154,145,472 22,473,748 176,619,220 134,170,016 9,005,950 143,175,966
Exchange adjustments (729,477) (5,687) (735,164) 1,468,169 15,535 1,483,704
Charge for the period / year 3,958,462 5,446,914 9,405,376 18,982,569 13,707,207 32,689,776
Reversals (2,093,668) (232,870) (2,326,538) (3,047,958) (321,795) (3,369,753)
1,864,794 5,214,044 7,078,838 15,934,611 13,385,412 29,320,023
Amounts written off (118,247) - (118,247) (89,494) - (89,494)
Amounts charged off -
agriculture financing 10.4.4 (56,950) - (56,950) (193,807) - (193,807)
Transfer from other assets 2,855,977 66,851 2,922,828
Transfer 7,659,958 (7,659,958) - - - -
Closing balance 162,765,550 20,022,147 182,787,697 154,145,472 22,473,748 176,619,220
10.4.1 Particulars of provision against advances
Specific General Total Specific General Total
In local currency 122,587,855 19,750,492 142,338,347 113,079,052 22,274,089 135,353,141
In foreign currencies 40,177,695 271,655 40,449,350 41,066,420 199,659 41,266,079
162,765,550 20,022,147 182,787,697 154,145,472 22,473,748 176,619,220
December 31, 2020 (Audited)June 30, 2021 (Un-audited)
June 30, 2021 (Un-audited) December 31, 2020 (Audited)
As at June 30, 2021, 77 (December 31, 2020: 77) corporate borrowers, having aggregate outstanding exposure of Rs. 33,328
million (December 31, 2020: 145,851), have availed regulatory relief extended by SBP amounted to Rs. 23,830 million
(December 31, 2020: Rs. 27,357 million).
10.4.2 The Bank maintains general reserve in accordance with the applicable requirements of the Prudential Regulations for
Consumer Financing and Prudential Regulations for Small and Medium Enterprise Financing issued by the SBP.
The bank has also maintained general provision of Rs. 14,201 million (December 31, 2020: Rs. 17,078 million) in respect of
its underperforming portfolio on prudent basis.
10.4.3 The SBP has allowed specific relaxation to the Bank for non-classification of overdue loans of certain Public Sector Entities
(PSEs) which are guaranteed by Government of Pakistan as non-performing loans up till December 31, 2021.
10.4.4 These represent non-performing advances for agriculture finance which have been classified as loss and fully provided for
more than 3 years. These non-performing advances have been charged off by extinguishing them against the provision held in
accordance with Prudential Regulations for Agriculture Financing issued by the SBP. This charge off does not, in any way,
prejudice the Bank's right of recovery from these customers.
10.4.5 State Bank of Pakistan (‘SBP’), vide its BPRD circular letter No. 13 of 2020, has provided regulatory relief to dampen the
effects of Covid-19 and allowed banks to offer deferral of principal component of installments to its borrowers for one year,
provided that the borrower will continue to service the mark-up amount as per agreed terms & conditions.
-------------------------------------------------------------- (Rupees in '000) --------------------------------------------------------------
-------------------------------------------------------------- (Rupees in '000) --------------------------------------------------------------
- --

HALF YEARLY REPORT JUNE 2021
National Bank of Pakistan
34
11.3 Disposal of fixed assets
The net book value of fixed assets disposed off during the period is as follows:
Furniture and fixture 1,264 1,519
Vehicles 14,501 16,675
15,765 18,194
12. INTANGIBLE ASSETS
Computer Software 249,264 303,813
11. FIXED ASSETS
Capital work-in-progress 11.1 2,271,909 2,154,184
Property and equipment 51,863,566 52,259,309
54,135,475 54,413,493
11.1 Capital work-in-progress
Civil works 2,137,505 2,040,456
Equipment 10,825 10,825
Advances to suppliers and contractors 58,733 58,733
Software implementation in progress 64,846 44,170
2,271,909 2,154,184
11.2 Additions to fixed assets
The following additions have been made to fixed assets during the period:
Capital work-in-progress 279,595 63,802
Property and equipment
Building on leasehold land 29,966 39,182
Furniture and fixture 331,216 251,960
Computer and peripheral equipment 150,929 58,211
Electrical, office equipment 209,551 89,896
Vehicles 17,090 167,732
738,752 606,981
1,018,347 670,783
(Un-audited)
June 30,
2021
(Audited)
December 31,
2020Note -------------- (Rupees in '000) --------------
(Un-audited)
June 30,
2021
June 30,
2020
-------------- (Rupees in '000) --------------
(Un-audited)
June 30,
2021
(Audited)
December 31,
2020
-------------- (Rupees in '000) --------------
(Un-audited)

Building Resilience. Creating Opportunities.
HALF YEARLY REPORT JUNE 2021 35
(Un-audited) (Un-audited)
June 30, June 30,
2021 2020
-------------- (Rupees in '000) --------------
12.1 Additions to intangible assets
The following additions have been made to intangible assets during the period:
Directly purchased 43,539 86,177
13. RIGHT OF USE ASSETS
6,669,684 7,221,266
1,268,626 1,331,535
Derecognition during the period / year (1,184) -
(944,632) (1,883,117)
6,992,494 6,669,684
Additions during the period / year
Balance as at January 01
Depreciation charged for the period / year
Balance as at
(Un-audited)
June 30,
2021
(Audited)
December 31,
2020Note -------------- (Rupees in '000) --------------
14. OTHER ASSETS
Income / return / mark-up accrued in local currency 39,311,352 39,642,348
Income / return / mark-up accrued in foreign currency 2,442,308 2,274,912
Advances, deposits, advance rent and other prepayments 4,930,048 2,918,231
Income tax refunds receivable & Advance taxation (payments less provisions) 14.1 18,284,894 27,183,199
Compensation for delayed tax refunds 18,438,303 17,556,551
Non-banking assets acquired in satisfaction of claims 1,248,103 1,255,834
Assets acquired from Corporate and Industrial Restructuring Corporation (CIRC) 208,423 208,423
Commission receivable on Government treasury transactions 8,868,216 4,612,174
Stationery and stamps on hand 536,768 499,511
Barter trade balances 195,399 195,399
Receivable on account of Government transactions 323,172 323,172
Receivable from Government under VHS scheme 418,834 418,834
Receivable against sale of shares 61,498 88,996
Acceptances 33,943,496 15,741,754
Others 6,836,606 6,437,628
136,047,420 119,356,966
Less: Provision held against other assets 14.2 11,877,162 11,873,693
Other assets (net of provision) 124,170,258 107,483,273
Surplus on revaluation of non-banking assets acquired in
satisfaction of claims 2,712,495 2,712,495
Other assets - total 126,882,753 110,195,768
14.1 During the period Rs. 2,629 million were adjusted against income tax refunds towards payment of advance tax liability.
HALF YEARLY REPORT JUNE 2021
National Bank of Pakistan
36
(Un-audited)
June 30,
2021
(Audited)
December 31,
2020
-------------- (Rupees in '000) --------------
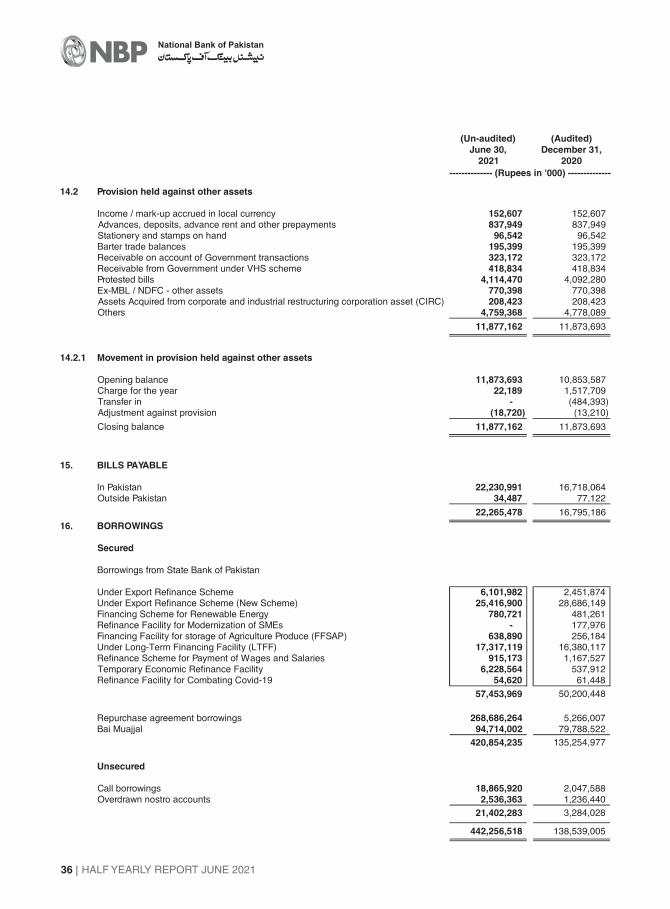
14.2 Provision held against other assets
Income / mark-up accrued in local currency 152,607 152,607Advances, deposits, advance rent and other prepayments 837,949 837,949Stationery and stamps on hand 96,542 96,542Barter trade balances 195,399 195,399Receivable on account of Government transactions 323,172 323,172Receivable from Government under VHS scheme 418,834 418,834Protested bills 4,114,470 4,092,280Ex-MBL / NDFC - other assets 770,398 770,398Assets Acquired from corporate and industrial restructuring corporation asset (CIRC) 208,423 208,423Others 4,759,368 4,778,089
11,877,162 11,873,693
14.2.1 Movement in provision held against other assets
Opening balance 11,873,693 10,853,587Charge for the year 22,189 1,517,709Transfer in - (484,393)Adjustment against provision (18,720) (13,210)
Closing balance 11,877,162 11,873,693
15. BILLS PAYABLE
In Pakistan 22,230,991 16,718,064Outside Pakistan 34,487 77,122
22,265,478 16,795,186
16. BORROWINGS
Secured
Borrowings from State Bank of Pakistan
Under Export Refinance Scheme 6,101,982 2,451,874Under Export Refinance Scheme (New Scheme) 25,416,900 28,686,149Financing Scheme for Renewable Energy 780,721 481,261Refinance Facility for Modernization of SMEs - 177,976Financing Facility for storage of Agriculture Produce (FFSAP) 638,890 256,184Under Long-Term Financing Facility (LTFF) 17,317,119 16,380,117Refinance Scheme for Payment of Wages and Salaries 915,173 1,167,527Temporary Economic Refinance Facility 6,228,564 537,912Refinance Facility for Combating Covid-19 54,620 61,448
57,453,969 50,200,448
Repurchase agreement borrowings 268,686,264 5,266,007Bai Muajjal 94,714,002 79,788,522
420,854,235 135,254,977
Unsecured
Call borrowings 18,865,920 2,047,588Overdrawn nostro accounts 2,536,363 1,236,440
21,402,283 3,284,028
442,256,518 138,539,005
Building Resilience. Creating Opportunities.
HALF YEARLY REPORT JUNE 2021 37
-
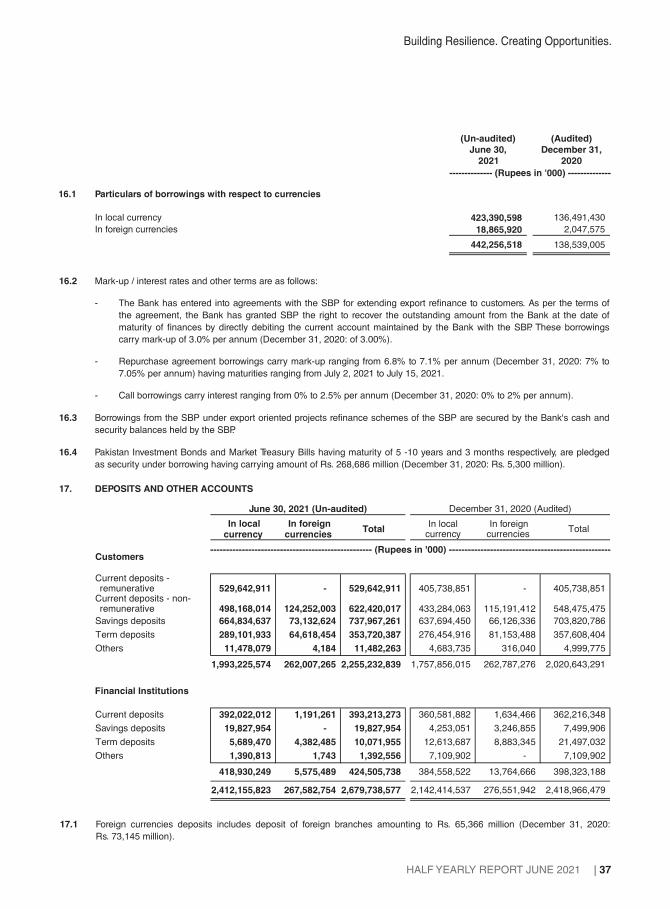
16.1 Particulars of borrowings with respect to currencies
In local currency 423,390,598 136,491,430
In foreign currencies 18,865,920 2,047,575
442,256,518 138,539,005
(Un-audited)
June 30,
2021
(Audited)
December 31,
2020
-------------- (Rupees in '000) --------------
16.2 Mark-up / interest rates and other terms are as follows:
- The Bank has entered into agreements with the SBP for extending export refinance to customers. As per the terms of
the agreement, the Bank has granted SBP the right to recover the outstanding amount from the Bank at the date of
maturity of finances by directly debiting the current account maintained by the Bank with the SBP. These borrowings
carry mark-up of 3.0% per annum (December 31, 2020: of 3.00%).
- Repurchase agreement borrowings carry mark-up ranging from 6.8% to 7.1% per annum (December 31, 2020: 7% to
7.05% per annum) having maturities ranging from July 2, 2021 to July 15, 2021.
16.3 Borrowings from the SBP under export oriented projects refinance schemes of the SBP are secured by the Bank's cash and
security balances held by the SBP.
16.4 Pakistan Investment Bonds and Market Treasury Bills having maturity of 5 -10 years and 3 months respectively, are pledged
as security under borrowing having carrying amount of Rs. 268,686 million (December 31, 2020: Rs. 5,300 million).
- Call borrowings carry interest ranging from 0% to 2.5% per annum (December 31, 2020: 0% to 2% per annum).
17. DEPOSITS AND OTHER ACCOUNTS
In localcurrency
In foreigncurrencies
TotalIn local
currencyIn foreign
currenciesTotal
Customers
529,642,911 - 529,642,911 405,738,851 - 405,738,851
498,168,014 124,252,003 622,420,017 433,284,063 115,191,412 548,475,475
Savings deposits 664,834,637 73,132,624 737,967,261 637,694,450 66,126,336 703,820,786
Term deposits 289,101,933 64,618,454 353,720,387 276,454,916 81,153,488 357,608,404
Others 11,478,079 4,184 11,482,263 4,683,735 316,040 4,999,775
1,993,225,574 262,007,265 2,255,232,839 1,757,856,015 262,787,276 2,020,643,291
Financial Institutions
Current deposits 392,022,012 1,191,261 393,213,273 360,581,882 1,634,466 362,216,348
Savings deposits 19,827,954 - 19,827,954 4,253,051 3,246,855 7,499,906
Term deposits 5,689,470 4,382,485 10,071,955 12,613,687 8,883,345 21,497,032
Others 1,390,813 1,743 1,392,556 7,109,902 - 7,109,902
418,930,249 5,575,489 424,505,738 384,558,522 13,764,666 398,323,188
2,412,155,823 267,582,754 2,679,738,577 2,142,414,537 276,551,942 2,418,966,479
--------------------------------------------------- (Rupees in '000) ---------------------------------------------------
Current deposits -remunerative
Current deposits - non-remunerative
June 30, 2021 (Un-audited) December 31, 2020 (Audited)
17.1 Foreign currencies deposits includes deposit of foreign branches amounting to Rs. 65,366 million (December 31, 2020:
Rs. 73,145 million).
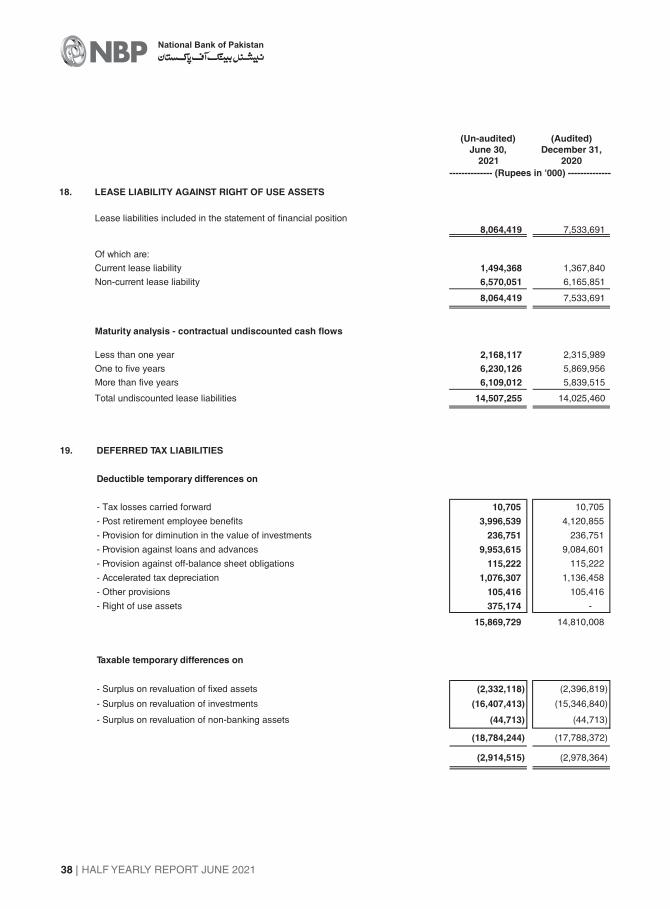
HALF YEARLY REPORT JUNE 2021
National Bank of Pakistan
38
18. LEASE LIABILITY AGAINST RIGHT OF USE ASSETS
Lease liabilities included in the statement of financial position
8,064,419 7,533,691
Of which are:
Current lease liability 1,494,368 1,367,840
Non-current lease liability 6,570,051 6,165,851
8,064,419 7,533,691
(0)
Maturity analysis - contractual undiscounted cash flows
Less than one year 2,168,117 2,315,989
One to five years 6,230,126 5,869,956
More than five years 6,109,012 5,839,515
Total undiscounted lease liabilities 14,507,255 14,025,460
(Un-audited)
June 30,
2021
(Audited)
December 31,
2020
-------------- (Rupees in '000) --------------
19. DEFERRED TAX LIABILITIES
Deductible temporary differences on
- Tax losses carried forward 10,705 10,705
- Post retirement employee benefits 3,996,539 4,120,855
- Provision for diminution in the value of investments 236,751 236,751
- Provision against loans and advances 9,953,615 9,084,601
- Provision against off-balance sheet obligations 115,222 115,222
- Accelerated tax depreciation 1,076,307 1,136,458
- Other provisions 105,416 105,416
- Right of use assets 375,174 -
15,869,729 14,810,008
Taxable temporary differences on
- Surplus on revaluation of fixed assets (2,332,118) (2,396,819)
- Surplus on revaluation of investments (16,407,413) (15,346,840)
- Surplus on revaluation of non-banking assets (44,713) (44,713)
(18,784,244) (17,788,372)
(2,914,515) (2,978,364)
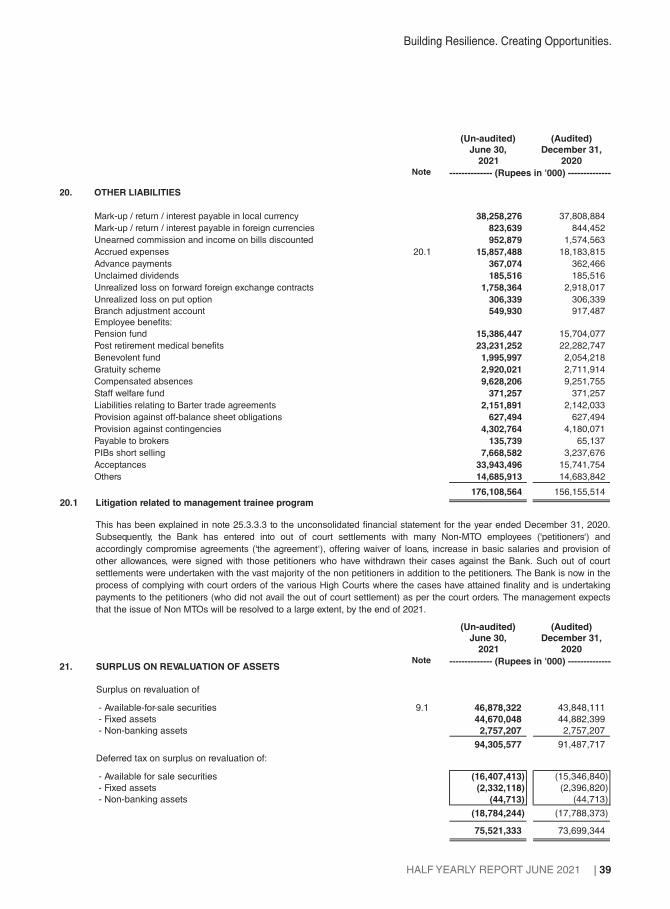
Building Resilience. Creating Opportunities.
HALF YEARLY REPORT JUNE 2021 39
(Un-audited)
June 30,
2021
(Audited)
December 31,
2020Note -------------- (Rupees in '000) --------------
20. OTHER LIABILITIES
Mark-up / return / interest payable in local currency 38,258,276 37,808,884
Mark-up / return / interest payable in foreign currencies 823,639 844,452
Unearned commission and income on bills discounted 952,879 1,574,563
Accrued expenses 20.1 15,857,488 18,183,815
Advance payments 367,074 362,466
Unclaimed dividends 185,516 185,516
Unrealized loss on forward foreign exchange contracts 1,758,364 2,918,017
Unrealized loss on put option 306,339 306,339
Branch adjustment account 549,930 917,487
Employee benefits:
Pension fund 15,386,447 15,704,077
Post retirement medical benefits 23,231,252 22,282,747
Benevolent fund 1,995,997 2,054,218
Gratuity scheme 2,920,021 2,711,914
Compensated absences 9,628,206 9,251,755
Staff welfare fund 371,257 371,257
Liabilities relating to Barter trade agreements 2,151,891 2,142,033
Provision against off-balance sheet obligations 627,494 627,494
Provision against contingencies 4,302,764 4,180,071
Payable to brokers 135,739 65,137
PIBs short selling 7,668,582 3,237,676
Acceptances 33,943,496 15,741,754
Others 14,685,913 14,683,842
176,108,564 156,155,514
20.1 Litigation related to management trainee program
This has been explained in note 25.3.3.3 to the unconsolidated financial statement for the year ended December 31, 2020.
Subsequently, the Bank has entered into out of court settlements with many Non-MTO employees ('petitioners‘) and
accordingly compromise agreements ('the agreement‘), offering waiver of loans, increase in basic salaries and provision of
other allowances, were signed with those petitioners who have withdrawn their cases against the Bank. Such out of court
settlements were undertaken with the vast majority of the non petitioners in addition to the petitioners. The Bank is now in the
process of complying with court orders of the various High Courts where the cases have attained finality and is undertaking
payments to the petitioners (who did not avail the out of court settlement) as per the court orders. The management expects
that the issue of Non MTOs will be resolved to a large extent, by the end of 2021.
21. SURPLUS ON REVALUATION OF ASSETS
Surplus on revaluation of
- Available-for-sale securities 9.1 46,878,322 43,848,111
- Fixed assets 44,670,048 44,882,399
- Non-banking assets 2,757,207 2,757,207
94,305,577 91,487,717
Deferred tax on surplus on revaluation of:
- Available for sale securities (16,407,413) (15,346,840)
- Fixed assets (2,332,118) (2,396,820)
- Non-banking assets (44,713) (44,713)
(18,784,244) (17,788,373)
75,521,333 73,699,344
-
(Un-audited)
June 30,
2021
(Audited)
December 31,
2020Note -------------- (Rupees in '000) --------------
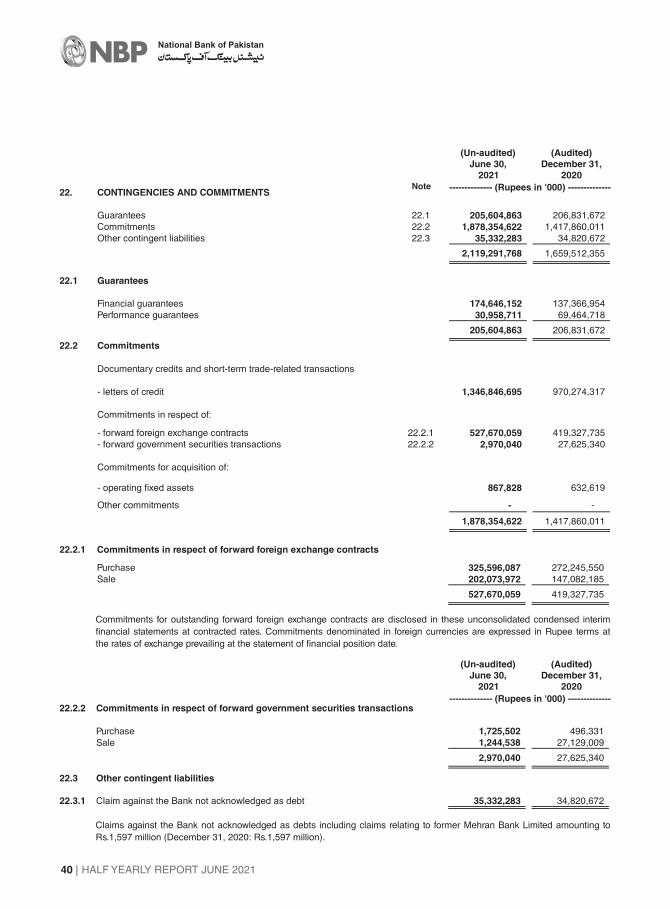
HALF YEARLY REPORT JUNE 2021
National Bank of Pakistan
40
22. CONTINGENCIES AND COMMITMENTS
Guarantees 22.1 205,604,863 206,831,672
Commitments 22.2 1,878,354,622 1,417,860,011
Other contingent liabilities 22.3 35,332,283 34,820,672
2,119,291,768 1,659,512,355
22.1 Guarantees
Financial guarantees 174,646,152 137,366,954
Performance guarantees 30,958,711 69,464,718
205,604,863 206,831,672
22.2 Commitments
Documentary credits and short-term trade-related transactions
- letters of credit 1,346,846,695 970,274,317
Commitments in respect of:
- forward foreign exchange contracts 22.2.1 527,670,059 419,327,735
- forward government securities transactions 22.2.2 2,970,040 27,625,340
Commitments for acquisition of:
- operating fixed assets 867,828 632,619
Other commitments - -
1,878,354,622 1,417,860,011
22.2.1 Commitments in respect of forward foreign exchange contracts
Purchase 325,596,087 272,245,550
Sale 202,073,972 147,082,185
527,670,059 419,327,735
22.2.2 Commitments in respect of forward government securities transactions
Purchase 1,725,502 496,331
Sale 1,244,538 27,129,009
2,970,040 27,625,340
22.3 Other contingent liabilities
22.3.1 Claim against the Bank not acknowledged as debt 35,332,283 34,820,672
(Un-audited)
June 30,
2021
(Audited)
December 31,
2020Note -------------- (Rupees in '000) --------------
Commitments for outstanding forward foreign exchange contracts are disclosed in these unconsolidated condensed interim
financial statements at contracted rates. Commitments denominated in foreign currencies are expressed in Rupee terms at
the rates of exchange prevailing at the statement of financial position date.
Claims against the Bank not acknowledged as debts including claims relating to former Mehran Bank Limited amounting to
Rs.1,597 million (December 31, 2020: Rs.1,597 million).
(Un-audited)
June 30,
2021
(Audited)
December 31,
2020
-------------- (Rupees in '000) --------------

Building Resilience. Creating Opportunities.
HALF YEARLY REPORT JUNE 2021 41
This has been explained in note 25.3.3.1 to the unconsolidated financial statements for the year ended December 31,2020.The management‘s estimate of overall increase in pension liability, based on the independent actuarial firm report forthe year ended December 31, 2020 amounted to Rs. 73.4 billion, excluding any penal interest / profit payment (if any) due todelayed payment. Further, the pension expense for year 2020 onward will also increase by Rs. 7.4 billion due to this decision.Based on the opinion of legal counsel, no provision for any additional pension liability has been made in theseunconsolidated condensed interim financial statements for the above mentioned amount as the Bank is confident about afavorable outcome on the matter.
b) "PRA through their Order in the appeal Ref: 90/2019 dated 6th February, 2021 re-initiated the proceeding and passedan Order bearing No. NBP/2016/IV/2021 dated 08-01-2021 u/s 52 of the Punjab Sales Tax on Services Act, 2012 (theAct) wherein the demand was reduced to Rs. 330,942,466/- along with penalty amounting to Rs. 16,547,124/- undersection 48 and default surcharge (to be calculated at the time of payment) under section 49 of the Act was raised.Against this Order, the Bank has filed an Appeal before the Commissioner (Appeals), PRA on various legal and factualgrounds, including alleged levy of Punjab Sales Taxes on Consolidated Pan Pakistan figure. The Bank's tax advisor isconfident that the ultimate outcome is expected to be in the Bank's favour.
d) The Additional Commissioner, PRA has passed an order bearing No. NBP/WH/INSURANCE/ADC-IV/2021 dated 08-01-2021 creating the Punjab sales tax liability on the non-withholding of Punjab Sales Tax on the insurance servicesreceived by the Bank for the tax periods January 2016-December 2016 and January 2017-December 2017 amountingto Rs. 254,734,973/- and Rs. 281,774,950/- respectively. The rectification application has been submitted under section79 of the Punjab Sales Tax on Services Act, 2012 for the apparent mistake of facts amounting to Rs. 198,113,458/- andRs. 231,089,190/- respectively. The net exposure after rectification would result in Rs. 56,621,515/- and Rs. 50,685,760/-respectively. The Bank is contesting the aforesaid order passed by Additional Commissioner, before the Commissioner(Appeals), PRA wherein apart from other Grounds, the main plea has been raised that Punjab Sales Tax should not bepressed from the Bank when the applicable Sindh Sales Tax on the insurance services has duly been paid in to SindhGovernment Treasury and any claim of Punjab Sales Tax on the same transaction can only be recouped from SindhRevenue Board as inter-provincial adjustment. Based on the legal and factual position, the Bank's tax advisor isconfident that the ultimate outcome of the proceeding will be decided in the Bank’s favor.
e) The Additional Commissioner, PRA passed an Order bearing No. NBP/2012-2016/IV/2021 dated 27-01-2021 u/s 52 ofthe Act regarding Non withholding of Punjab Sales Tax on Services of certain registered vendors for the Tax Periods fromJanuary-2012 to December-2016 wherein the demand of Rs. 20,520,783/- along with penalty amounting to Rs.20,520,783/- under section 48 and default surcharge (to be calculated at the time of payment) under section 49 of theAct was raised. Against this Order, the Bank filed an Appeal before the Commissioner (Appeals), PRA wherein apartfrom the time limitation matter pertaining to tax periods from January-2012 to June-2015, certain factual aspect includingnon-applicability of withholding sales tax on Punjab is being contested. The ultimate outcome is expected to be in theBank's favour.
22.3.3.2 Regularizing the temporary hires / workers deployed by Service provider companies under outsourcing
arrangements
22.3.2 Taxation
As at June 30, 2021, the status of tax contingencies disclosed in the annual unconsolidated financial statements for the yearended December 31, 2020 is same, other than the following significant developments and additions:
a) The taxation officer has passed assessment order for tax year 2020 on May 31, 2021. The Bank has filed appeal beforeCIR(A) which is pending for hearing. Stay has been granted against tax demand arising out of the assessment order.The Bank has shown the additional tax effect of Rs. 5.92 billion arising out of the impugned order as contingency basedon the tax consultants' expectation that the issues would be decided in Bank's favour.
As at June 30, 2021, the status of contingencies disclosed in the annual unconsolidated financial statements for the yearended December 31, 2020 is same, other than the following significant developments:
22.3.3.1 Pensionary benefits to retired employees
c) The Additional Commissioner, PRA has passed an Order bearing No. NBP/WH/2017-2018/ADC-IV/2021 dated 22-01-2021 u/s 52 of the Act regarding Non withholding of Punjab Sales Tax on Services of certain expenses confronted forthe Tax Periods from January-2017 to December-2018 wherein the demand of Rs. 1,263,372,788/- along with penaltyamounting to Rs. 1,263,372,788/- under section 48 and default surcharge (to be calculated at the time of payment)under section 49 of the Act was raised. Against this Order, the Bank has filed an Appeal before the Commissioner(Appeals), PRA on various legal and factual grounds, including alleged levy of Punjab Sales Taxes on Consolidated PanPakistan figure. The Bank's tax advisor is confident that the ultimate outcome is expected to be in the Bank's favour.
The current status of these contingencies is same as disclosed in the annual unconsolidated financial statements of the Bankfor the year ended December 31, 2020.
22.3.3 Contingencies in respect of employees benefits and related matters
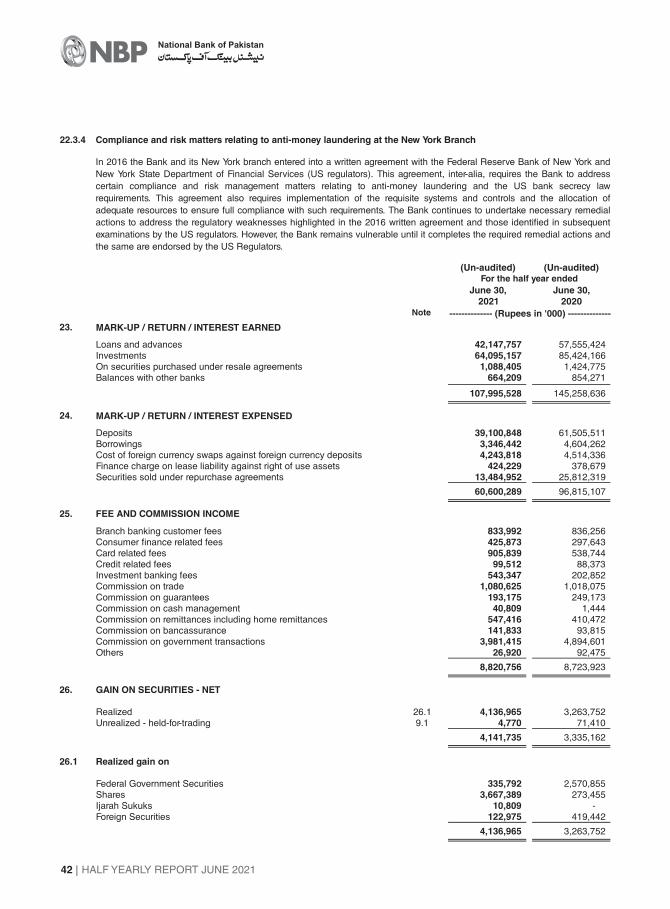
HALF YEARLY REPORT JUNE 2021
National Bank of Pakistan
42
22.3.4 Compliance and risk matters relating to anti-money laundering at the New York Branch
In 2016 the Bank and its New York branch entered into a written agreement with the Federal Reserve Bank of New York and
New York State Department of Financial Services (US regulators). This agreement, inter-alia, requires the Bank to address
certain compliance and risk management matters relating to anti-money laundering and the US bank secrecy law
requirements. This agreement also requires implementation of the requisite systems and controls and the allocation of
adequate resources to ensure full compliance with such requirements. The Bank continues to undertake necessary remedial
actions to address the regulatory weaknesses highlighted in the 2016 written agreement and those identified in subsequent
examinations by the US regulators. However, the Bank remains vulnerable until it completes the required remedial actions and
the same are endorsed by the US Regulators.
23. MARK-UP / RETURN / INTEREST EARNED
Loans and advances 42,147,757 57,555,424Investments 64,095,157 85,424,166On securities purchased under resale agreements 1,088,405 1,424,775Balances with other banks 664,209 854,271
107,995,528 145,258,636
24. MARK-UP / RETURN / INTEREST EXPENSED
Deposits 39,100,848 61,505,511Borrowings 3,346,442 4,604,262Cost of foreign currency swaps against foreign currency deposits 4,243,818 4,514,336Finance charge on lease liability against right of use assets 424,229 378,679Securities sold under repurchase agreements 13,484,952 25,812,319
60,600,289 96,815,107
25. FEE AND COMMISSION INCOME
Branch banking customer fees 833,992 836,256Consumer finance related fees 425,873 297,643Card related fees 905,839 538,744Credit related fees 99,512 88,373Investment banking fees 543,347 202,852Commission on trade 1,080,625 1,018,075Commission on guarantees 193,175 249,173Commission on cash management 40,809 1,444Commission on remittances including home remittances 547,416 410,472Commission on bancassurance 141,833 93,815Commission on government transactions 3,981,415 4,894,601Others 26,920 92,475
8,820,756 8,723,923
26. GAIN ON SECURITIES - NET
Realized 26.1 4,136,965 3,263,752Unrealized - held-for-trading 9.1 4,770 71,410
4,141,735 3,335,162
26.1 Realized gain on
Federal Government Securities 335,792 2,570,855Shares 3,667,389 273,455Ijarah Sukuks 10,809 -Foreign Securities 122,975 419,442
4,136,965 3,263,752
For the half year ended
(Un-audited)
June 30,
2021
June 30,
2020Note -------------- (Rupees in '000) --------------
(Un-audited)

Building Resilience. Creating Opportunities.
HALF YEARLY REPORT JUNE 2021 43
27. OTHER INCOME
Rent on property 26,560 14,456Gain on sale of fixed assets - net 22,126 24,513Compensation for delayed tax refunds 27.1 881,752 2,376,094Remittances expense reimbursed by SBP - 112,861Others 28,303 22,624
958,741 2,550,548
28. OPERATING EXPENSES
Total compensation expenses 20,536,243 19,545,965
Property expenses
Rent and taxes 388,909 199,619Insurance 17,066 17,066Utilities cost 562,805 553,492Security (including guards) 1,343,068 1,329,440Repair and maintenance (including janitorial charges) 419,562 476,991Depreciation 241,229 213,641Depreciation on non banking assets 7,731 7,892Depreciation on Ijarah assets 38,356 49,107Depreciation on right of use assets 944,632 928,957
3,963,358 3,776,205
Information technology expenses
Software maintenance 605,683 525,117Hardware maintenance 13,949 5,844Depreciation 136,773 101,315Amortization 101,303 94,723Network charges 231,151 195,914IT Manage Services 118,244 123,365
1,207,103 1,046,278
Other operating expenses
Directors' fees and reimbursement of other expenses 11,497 22,459Fees and allowances to Shariah Board 4,990 4,442Legal and professional charges 430,100 343,777Outsourced services costs 347,179 384,487Travelling and conveyance 281,474 210,024NIFT clearing charges 82,707 69,518Depreciation 744,295 840,709Training and development 20,672 28,803Postage and courier charges 106,902 124,413Communication 148,388 142,167Stationery and printing 680,107 505,524Marketing, advertisement and publicity 97,343 78,857Contributions for other Corporate and Social Responsibility 6,201 85,447Auditors' remuneration 101,402 120,847Entertainment 110,836 114,697Clearing, verification, license fee charges 155,375 168,659Brokerage 74,934 48,563Financial charges on leased assets 15,810 14,536Insurance 187,944 357,933Vehicle expenses 109,188 81,717Repairs and maintenance 227,965 213,961Deposit premium expense 785,553 687,318Others 186,105 233,051
4,916,967 4,881,909
30,623,671 29,250,357
27.1 This represents compensation on delayed refunds determined under Section 171 of Income Tax Ordinance 2001.
For the half year ended
(Un-audited)
June 30,
2021
June 30,
2020
-------------- (Rupees in '000) --------------
For the half year ended
(Un-audited)
June 30,
2021
June 30,
2020Note -------------- (Rupees in '000) --------------
(Un-audited)
(Un-audited)
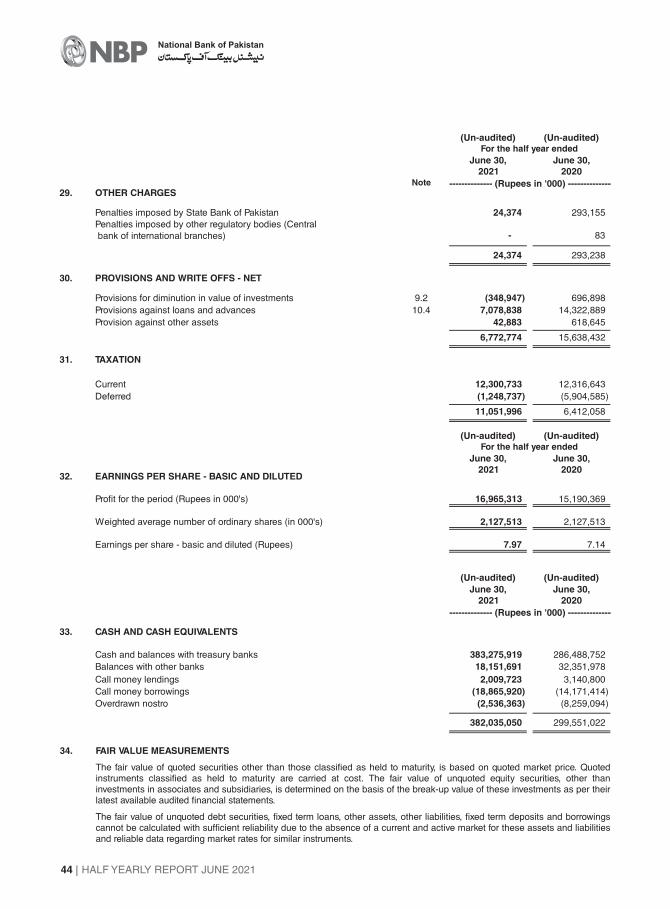
HALF YEARLY REPORT JUNE 2021
National Bank of Pakistan
44
29. OTHER CHARGES
Penalties imposed by State Bank of Pakistan 24,374 293,155
- 83
24,374 293,238
30. PROVISIONS AND WRITE OFFS - NET
Provisions for diminution in value of investments 9.2 (348,947) 696,898
Provisions against loans and advances 10.4 7,078,838 14,322,889
Provision against other assets 42,883 618,645
6,772,774 15,638,432
31. TAXATION
Current 12,300,733 12,316,643
Deferred (1,248,737) (5,904,585)
11,051,996 6,412,058
32. EARNINGS PER SHARE - BASIC AND DILUTED
Profit for the period (Rupees in 000's) 16,965,313 15,190,369
Weighted average number of ordinary shares (in 000's) 2,127,513 2,127,513
Earnings per share - basic and diluted (Rupees) 7.97 7.14
33. CASH AND CASH EQUIVALENTS
Cash and balances with treasury banks 383,275,919 286,488,752
Balances with other banks 18,151,691 32,351,978
Call money lendings 2,009,723 3,140,800
Call money borrowings (18,865,920) (14,171,414)
Overdrawn nostro (2,536,363) (8,259,094)
382,035,050 299,551,022
Penalties imposed by other regulatory bodies (Central
bank of international branches)
(Un-audited) (Un-audited)
June 30,
2021
June 30,
2020
-------------- (Rupees in '000) --------------
The fair value of unquoted debt securities, fixed term loans, other assets, other liabilities, fixed term deposits and borrowingscannot be calculated with sufficient reliability due to the absence of a current and active market for these assets and liabilitiesand reliable data regarding market rates for similar instruments.
34. FAIR VALUE MEASUREMENTS
The fair value of quoted securities other than those classified as held to maturity, is based on quoted market price. Quotedinstruments classified as held to maturity are carried at cost. The fair value of unquoted equity securities, other thaninvestments in associates and subsidiaries, is determined on the basis of the break-up value of these investments as per theirlatest available audited financial statements.
For the half year ended
(Un-audited)
June 30,
2021
June 30,
2020Note -------------- (Rupees in '000) --------------
(Un-audited)
For the half year ended
(Un-audited)
June 30,
2021
June 30,
2020
(Un-audited)

Building Resilience. Creating Opportunities.
HALF YEARLY REPORT JUNE 2021 45
Carrying value Level 1 Level 2 Level 3 Total
On balance sheet financial instruments
Investments
941,492,524 - 941,492,524 - 941,492,524
469,425,831 - 469,425,831 - 469,425,831
8,054,999 - 8,054,999 - 8,054,999
45,331,127 45,331,127 - - 45,331,127
1,010,600 1,010,600 - - 1,010,600
2,157,790 - 2,157,790 - 2,157,790
49,499,854 6,285,000 43,214,854 - 49,499,854
11,880,788 - 11,880,788 - 11,880,788
828,566 - 828,566 - 828,566
- - - - -
23,573,040 23,573,040 - - 23,573,040
1,553,255,119 76,199,767 1,477,055,352 - 1,553,255,119
Pakistan Investment Bonds 193,074,385 - 194,380,784 - 194,380,784
Market Treasury Bills 49,136,078 - 49,176,750 - 49,176,750
GoP Foreign Currency Bonds 2,742,447 - 2,777,878 - 2,777,878
Foreign Government Securities 31,421,133 - 36,656,970 - 36,656,970
Foreign Currency Debt Securities 608 - 609 - 609
Associates 1,383,260 903,020 502,916 - 1,405,936
277,757,911 903,020 283,495,907 - 284,398,927
1,831,013,030 77,102,787 1,760,551,259 - 1,837,654,046
Commitments
527,670,059 - (1,758,364) - (1,758,364)
Forward government securities transactions 2,970,040 - 1,390 - 1,390
June 30, 2021 (Un-audited)
Market Treasury Bills
Ordinary shares of a bank outside
Pakistan
Foreign Currency Debt Securities
Foreign Government Securities
GoP Foreign Currency Bonds
Term Finance Certificates / Musharika
and Sukuk Bonds
Investments in mutual funds
Preference shares
Ordinary shares of listed companies
Ijarah Sukuks
Pakistan Investment Bonds
Foreign exchange contracts purchase
and sale
Financial assets - disclosed but not
measured at fair value
Financial assets - measured at fair value
Off-balance sheet financial instruments -
measured at fair value
34.1 Fair value of financial assets
Level 1: Fair value measurements using quoted prices (unadjusted) in active markets for identical assets or liabilities.
Level 2: Fair value measurements using inputs other than quoted prices included within Level 1 that are observable for theassets or liability, either directly (i.e. as prices) or indirectly (i.e. derived from prices).
Level 3: Fair value measurements using input for the asset or liability that are not based on observable market data (i.e.unobservable inputs).
The Bank measures fair values using the following fair value hierarchy that reflects the significance of the inputs used inmaking the measurements:
The table below analyses financial instruments measured at the end of the reporting period by the level in the fair valuehierarchy into which the fair value measurement is categorized:
----------------------------------------------------- (Rupees in '000) -----------------------------------------------

HALF YEARLY REPORT JUNE 2021
National Bank of Pakistan
46
Carrying value Level 1 Level 2 Level 3 Total
On balance sheet financial instruments
Financial assets - measured at fair value
Investments
Market Treasury Bills 626,248,789 - 626,248,789 - 626,248,789
Pakistan Investment Bonds 473,408,082 - 473,408,082 - 473,408,082
Ijarah Sukuks 6,015,600 - 6,015,600 - 6,015,600
Ordinary shares of listed companies 47,907,782 47,907,782 - - 47,907,782
Preference shares 1,099,850 1,099,850 - - 1,099,850
Investments in mutual funds 2,000,170 - 2,000,170 - 2,000,170
55,860,007 4,280,000 51,580,007 - 55,860,007
GoP Foreign Currency Bonds 10,840,875 - 10,840,875 - 10,840,875
Foreign Government Securities 2,847,176 - 2,847,176 - 2,847,176
Foreign Currency Debt Securities 80,640 - 80,640 - 80,640
17,652,778 17,652,778 - - 17,652,778
1,243,961,749 70,940,410 1,173,021,339 - 1,243,961,749
168,422,981 - 171,507,188 - 171,507,188
32,328,738 - 37,064,275 - 37,064,275
618 - 618 - 618
Associates 1,149,010 670,335 478,688 - 1,149,023
201,901,347 670,335 209,050,769 - 209,721,104
1,445,863,096 71,610,745 1,382,072,108 - 1,453,682,853
419,327,735 - (2,918,017) - (2,918,017)
27,625,340 - 52,885 - 52,885
Ordinary shares of a bank outside
Pakistan
Foreign Currency Debt Securities
December 31, 2020 (Audited)
Forward government securities transactions
Foreign exchange contracts purchase
and sale
Foreign Government Securities
Pakistan Investment Bonds
Off-balance sheet financial instruments -
measured at fair value
Financial assets - disclosed but not
measured at fair value
Term Finance Certificates / Musharika
and Sukuk Bonds
----------------------------------------------------- (Rupees in '000) -----------------------------------------------
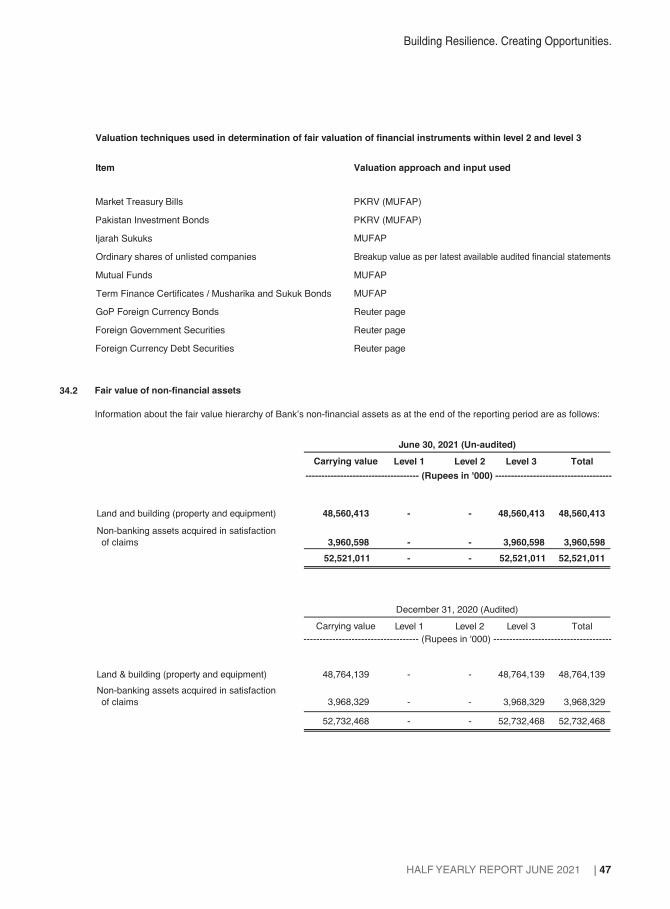
Building Resilience. Creating Opportunities.
HALF YEARLY REPORT JUNE 2021 47
Valuation techniques used in determination of fair valuation of financial instruments within level 2 and level 3
Market Treasury Bills PKRV (MUFAP)
Pakistan Investment Bonds PKRV (MUFAP)
Ijarah Sukuks MUFAP
Ordinary shares of unlisted companies Breakup value as per latest available audited financial statements
Mutual Funds MUFAP
MUFAP
GoP Foreign Currency Bonds Reuter page
Foreign Government Securities Reuter page
Foreign Currency Debt Securities Reuter page
34.2
Carrying value Level 1 Level 2 Level 3 Total
48,560,413 - - 48,560,413 48,560,413
3,960,598 - - 3,960,598 3,960,598
52,521,011 - - 52,521,011 52,521,011
Carrying value Level 1 Level 2 Level 3 Total
48,764,139 - - 48,764,139 48,764,139
3,968,329 - - 3,968,329 3,968,329
52,732,468 - - 52,732,468 52,732,468
Valuation approach and input usedItem
Non-banking assets acquired in satisfaction
of claims
Land & building (property and equipment)
June 30, 2021 (Un-audited)
December 31, 2020 (Audited)
Land and building (property and equipment)
Non-banking assets acquired in satisfaction
of claims
Term Finance Certificates / Musharika and Sukuk Bonds
Fair value of non-financial assets
Information about the fair value hierarchy of Bank’s non-financial assets as at the end of the reporting period are as follows:
------------------------------------ (Rupees in '000) -------------------------------------
------------------------------------ (Rupees in '000) -------------------------------------

HALF YEARLY REPORT JUNE 2021
National Bank of Pakistan
48
35
.S
EG
ME
NT
DE
TA
ILS
WIT
H R
ES
PE
CT
TO
BU
SIN
ES
SA
CT
IVIT
IES
Re
tail
Ban
kin
g
Gro
up
Inc
lus
ive
De
velo
pm
en
t
Gro
up
Co
rpo
rate
&
Inve
stm
en
t
Ba
nk
ing
Tre
as
ury
Inte
rna
tio
na
l,
Fin
an
cia
l
Ins
titu
tio
na
nd
Re
mit
tan
ce
He
ad
Off
ice
/
Oth
ers
Su
bto
tal
Elim
ina
tio
ns
To
tal
Pro
fit
an
dlo
ss
ac
co
un
t
(25
,87
5,4
88
)7
,98
8,8
28
13
,73
2,6
37
47
,45
1,7
61
1,5
30
,09
72
,56
7,4
04
47
,39
5,2
39
-4
7,3
95
,23
9
Inte
rse
gm
en
tre
ven
ue
- n
et
49
,77
9,1
22
(6,5
51
,10
0)
(12
,14
0,0
47
)(3
8,8
28
,88
2)
-7
,74
0,9
07
--
-
No
n m
ark
-up
/re
turn
/in
tere
stin
com
e6
,56
1,3
53
17
9,4
07
2,2
02
,38
27
,38
0,6
52
65
6,7
87
1,0
62
,30
81
8,0
42
,88
9-
18
,04
2,8
89
To
tal i
nco
me
30
,46
4,9
87
1,6
17
,13
53
,79
4,9
72
16
,00
3,5
31
2,1
86
,88
41
1,3
70
,61
96
5,4
38
,12
8-
65
,43
8,1
28
Se
gm
en
td
irect
exp
en
ses
14
,85
0,8
30
1,4
23
,74
35
30
,33
41
89
,56
52
,67
7,4
35
1,5
62
,33
22
1,2
34
,23
9-
21
,23
4,2
39
Inte
rse
gm
en
te
xpe
nse
allo
catio
n-
--
--
9,4
13
,80
69
,41
3,8
06
-9
,41
3,8
06
To
tal e
xpe
nse
s1
4,8
50
,83
01
,42
3,7
43
53
0,3
34
18
9,5
65
2,6
77
,43
51
0,9
76
,13
83
0,6
48
,04
5-
30
,64
8,0
45
Pro
visi
on
sa
nd
write
off
s -
ne
t5
13
,45
37
02
,33
25
,61
3,2
40
(14
2,0
19
)(6
4,9
10
)1
50
,67
86
,77
2,7
74
-6
,77
2,7
74
Pro
fit/(lo
ss)
be
fore
taxa
tion
15
,10
0,7
04
(50
8,9
40
)(2
,34
8,6
02
)1
5,9
55
,98
5(4
25
,64
1)
24
3,8
03
28
,01
7,3
09
-2
8,0
17
,30
9
Sta
tem
en
t o
f fi
na
nc
ialp
os
itio
n
18
3,8
01
,76
21
6,2
00
,89
72
53
,56
31
47
,23
1,3
65
46
,30
6,9
56
7,6
33
,06
74
01
,42
7,6
10
-4
01
,42
7,6
10
Inve
stm
ents
--
23
,69
9,7
17
1,7
29
,32
0,5
09
46
,87
3,5
42
49
,57
2,2
53
1,8
49
,46
6,0
21
-1
,84
9,4
66
,02
1
Ne
tin
ter
seg
me
ntle
nd
ing
1,9
17
,30
0,6
66
--
--
22
3,3
31
,58
82
,14
0,6
32
,25
4(2
,14
0,6
32
,25
4)
-
Len
din
gs
tofin
an
cia
l in
stitu
tion
s-
--
18
0,7
90
,70
8-
-1
80
,79
0,7
08
-1
80
,79
0,7
08
Ad
van
ces
- p
erf
orm
ing
18
0,9
78
,96
71
96
,13
2,4
04
53
3,5
92
,01
0-
40
,63
4,5
47
43
,99
2,9
39
99
5,3
30
,86
7-
99
5,3
30
,86
7
- n
on
-pe
rfo
rmin
g4
,17
6,7
40
19
,11
5,6
30
54
,69
0,0
53
-4
1,4
38
,04
36
4,9
83
,42
11
84
,40
3,8
87
-1
84
,40
3,8
87
Pro
visi
on
aga
inst
adva
nce
s(8
,84
0,0
17
)(1
7,2
73
,10
9)
(52
,71
3,1
23
)-
(40
,44
9,3
50
)(6
3,5
12
,09
8)
(18
2,7
87
,69
7)
-(1
82
,78
7,6
97
)
Ad
van
ces
- n
et
17
6,3
15
,69
01
97
,97
4,9
25
53
5,5
68
,94
0-
41
,62
3,2
40
45
,46
4,2
62
99
6,9
47
,05
7-
99
6,9
47
,05
7
Oth
ers
28
,31
9,8
10
2,5
39
,23
94
2,0
60
,28
72
89
,22
44
,27
1,9
63
11
0,7
79
,46
31
88
,25
9,9
86
-1
88
,25
9,9
86
To
talass
ets
2,3
05
,73
7,9
28
21
6,7
15
,06
16
01
,58
2,5
07
2,0
57
,63
1,8
06
13
9,0
75
,70
14
36
,78
0,6
33
5,7
57
,52
3,6
36
(2,1
40
,63
2,2
54
)3
,61
6,8
91
,38
2
Bo
rro
win
gs
-3
,93
0,8
49
53
,52
3,1
20
36
5,9
36
,62
91
8,8
65
,92
0-
44
2,2
56
,51
8-
44
2,2
56
,51
8
De
po
sits
an
d o
the
r a
cco
un
ts2
,25
6,8
66
,42
1-
27
1,5
60
,66
6-
65
,36
5,5
77
85
,94
5,9
13
2,6
79
,73
8,5
77
-2
,67
9,7
38
,57
7
Ne
tin
ter
seg
me
ntb
orr
ow
ing
-2
08
,52
8,4
87
23
9,3
39
,98
71
,63
4,7
62
,34
15
2,0
05
,98
85
,99
5,4
51
2,1
40
,63
2,2
54
(2,1
40
,63
2,2
54
)-
Oth
ers
48
,87
1,5
07
4,2
55
,72
53
6,9
14
,84
11
0,9
69
,31
22
,41
0,5
98
10
5,9
30
,99
32
09
,35
2,9
76
-2
09
,35
2,9
76
To
talliab
ilit
ies
2,3
05
,73
7,9
28
21
6,7
15
,06
16
01
,33
8,6
14
2,0
11
,66
8,2
82
13
8,6
48
,08
31
97
,87
2,3
57
5,4
71
,98
0,3
25
(2,1
40
,63
2,2
54
)3
,33
1,3
48
,07
1
Eq
uity
--
24
3,8
93
45
,96
3,5
24
42
7,6
18
23
8,9
08
,27
62
85
,54
3,3
11
-2
85
,54
3,3
11
To
tale
qu
ity
an
dlia
bilit
ies
2,3
05
,73
7,9
28
21
6,7
15
,06
16
01
,58
2,5
07
2,0
57
,63
1,8
06
13
9,0
75
,70
14
36
,78
0,6
33
5,7
57
,52
3,6
36
(2,1
40
,63
2,2
54
)3
,61
6,8
91
,38
2
Co
nti
ng
en
cie
sa
nd
co
mm
itm
en
ts-
68
,69
7,7
28
1,4
64
,61
4,9
71
52
7,6
70
,05
82
2,0
08
,50
63
6,3
00
,50
52
,11
9,2
91
,76
8-
2,1
19
,29
1,7
68
Ca
sh a
nd
ba
lan
ces
with
tre
asu
rya
nd
oth
er
ba
nks
Ha
lf y
ea
r e
nd
ed
Ju
ne
30
,2
02
1 (
Un
-au
dit
ed
)
----
----
----
----
----
----
----
----
----
----
----
----
----
----
----
----
----
----
----
----
----
----
----
--(R
up
ee
s in
'00
0)
----
----
----
----
- ---
----
----
----
----
----
----
----
----
----
----
----
----
----
----
----
----
----
----
-
Ju
ne
30
,2
02
1 (
Un
-au
dit
ed
)
----
----
----
----
----
----
----
----
----
----
----
----
----
----
----
----
----
----
----
----
----
----
----
--(R
up
ee
s in
'00
0)
----
----
----
----
- ---
----
----
----
----
----
----
----
----
----
----
----
----
----
----
----
----
----
----
-
Ne
tm
ark
-up /
retu
rn /
inte
rest
inco
me
/(e
xpe
nse
)
Re
tail
Ban
kin
g
Gro
up
Inc
lus
ive
De
velo
pm
en
t
Gro
up
Co
rpo
rate
&
Inve
stm
en
t
Ba
nk
ing
Tre
as
ury
Inte
rna
tio
na
l,
Fin
an
cia
l
Ins
titu
tio
na
nd
Re
mit
tan
ce
He
ad
Off
ice
/
Oth
ers
Su
bto
tal
Elim
ina
tio
ns
To
tal
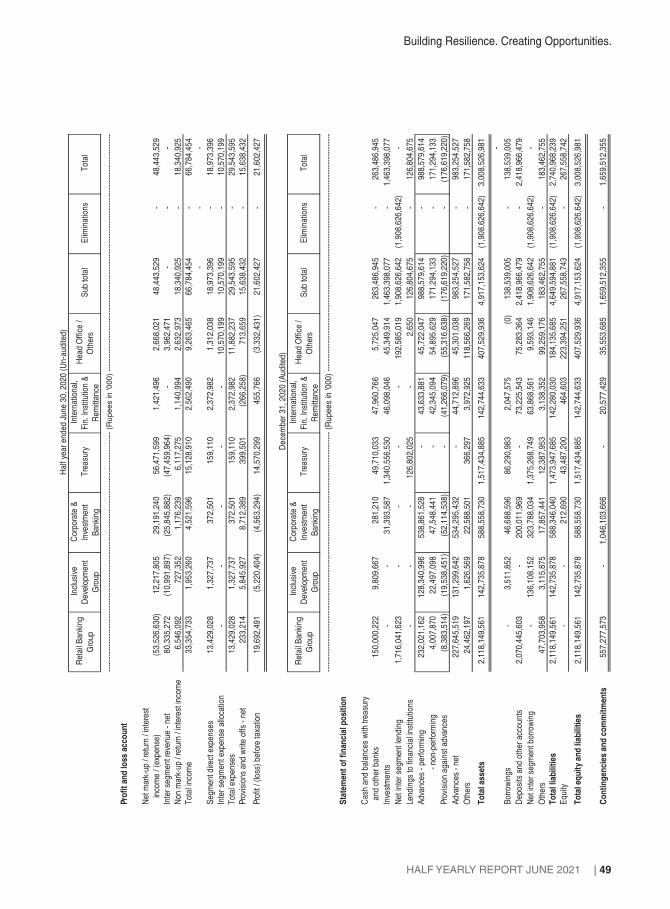
Building Resilience. Creating Opportunities.
HALF YEARLY REPORT JUNE 2021 49
Ret
ail B
anki
ng
Gro
up
Incl
usiv
e
De
velo
pme
nt
Gro
up
Cor
por
ate
&
Inve
stm
ent
Ban
kin
g
Tre
asu
ry
Inte
rnat
ion
al,
Fin
. Ins
titut
ion
&
Re
mitt
ance
Hea
d O
ffic
e /
Oth
ers
Sub
tota
lE
limin
atio
nsT
otal
Pro
fit
and
loss
acc
ou
nt
(53
,526
,63
0)12
,217
,80
529
,191
,24
056
,471
,59
91,
421,
496
2,66
8,02
148
,443
,52
9-
48,4
43,5
29
Inte
rse
gmen
t rev
enu
e -
net
80,3
35,2
72
(10
,991
,89
7)(2
5,8
45,8
82)
(47
,459
,96
4)-
3,96
2,47
1-
--
No
n m
ark-
up
/ re
turn
/in
tere
stin
com
e6,
546,
092
727,
352
1,17
6,23
96,
117,
275
1,14
0,99
42,
632,
973
18,3
40,9
25
-18
,340
,92
5
To
tal i
nco
me
33,3
54,7
33
1,95
3,26
04,
521,
596
15,1
28,9
10
2,56
2,49
09,
263,
465
66,7
84,4
54
-66
,784
,45
4
--
-
Seg
men
t dire
ctex
pen
ses
13,4
29,0
28
1,32
7,73
737
2,50
115
9,11
02,
372,
982
1,31
2,03
818
,973
,39
6-
18,9
73,3
96
Inte
rse
gmen
t exp
ens
e al
loca
tion
--
--
-10
,570
,19
910
,570
,19
9-
10,5
70,1
99
To
tal e
xpen
ses
13,4
29,0
28
1,32
7,73
737
2,50
115
9,11
02,
372,
982
11,8
82,2
37
29,5
43,5
95
-29
,543
,59
5
Prov
isio
nsa
nd w
rite
offs
-n
et23
3,21
45,
845,
927
8,71
2,38
939
9,50
1(2
66,
258)
713,
659
15,6
38,4
32
-15
,638
,43
2
Prof
it/ (
loss
)b
efor
e ta
xatio
n19
,692
,49
1(5
,22
0,40
4)
(4,5
63,
294
)14
,570
,29
945
5,76
6(3
,33
2,43
1)
21,6
02,4
27
-21
,602
,42
7
Ret
ail B
anki
ng
Gro
up
Incl
usiv
e
De
velo
pme
nt
Gro
up
Cor
por
ate
&
Inve
stm
ent
Ban
kin
g
Tre
asu
ry
Inte
rnat
ion
al,
Fin
. Ins
titut
ion
&
Re
mitt
ance
Hea
d O
ffic
e /
Oth
ers
Sub
tota
lE
limin
atio
nsT
otal
Sta
tem
ent
of
fin
anci
alp
osi
tio
n
150,
000,
222
9,80
9,66
728
1,21
049
,710
,03
347
,960
,76
65,
725,
047
263,
486,
945
-26
3,48
6,9
45
Inve
stm
ent
s-
-31
,393
,58
71,
340,
556
,530
46,0
98,0
46
45,3
49,9
14
1,46
3,39
8,0
77-
1,46
3,39
8,0
77
Ne
t in
ter
seg
men
t len
ding
1,71
6,04
1,6
23-
--
-19
2,58
5,0
191,
908,
626
,642
(1,9
08,
626
,642
)-
Lend
ings
tofin
anci
alin
stitu
tions
--
-12
6,80
2,0
25-
2,65
012
6,80
4,6
75-
126,
804,
675
Adv
anc
es
- pe
rfo
rmin
g23
2,02
1,1
6212
8,34
0,9
9653
8,86
1,5
28-
43,6
33,8
81
45,7
22,0
47
988,
579,
614
-98
8,57
9,6
14
Adv
anc
es
-no
n-p
erfo
rmin
g4,
007,
870
22,4
97,0
98
47,5
48,4
41
-42
,345
,09
454
,895
,62
917
1,29
4,1
33-
171,
294,
133
Prov
isio
na
gain
stad
van
ces
(8,3
83,
514
)(1
9,5
38,4
51)
(52
,114
,53
8)-
(41
,266
,07
9)(5
5,3
16,6
38)
(17
6,61
9,2
20)
-(1
76,
619,
220
)
Adv
anc
es
- ne
t22
7,64
5,5
1913
1,29
9,6
4253
4,29
5,4
32-
44,7
12,8
96
45,3
01,0
38
983,
254,
527
-98
3,25
4,5
27
Oth
ers
24,4
62,1
97
1,62
6,56
922
,588
,50
136
6,29
73,
972,
925
118,
566,
269
171,
582,
758
-17
1,58
2,7
58
To
tal a
sset
s2,
118,
149
,561
142,
735,
878
588,
558,
730
1,51
7,43
4,8
8514
2,74
4,6
3340
7,52
9,9
364,
917,
153
,624
(1,9
08,
626
,642
)3,
008,
526
,981 -
Bor
row
ing
s-
3,51
1,85
246
,688
,59
686
,290
,98
32,
047,
575
(0)
138,
539,
005
-13
8,53
9,0
05
De
posi
tsan
d ot
her
acco
unts
2,07
0,44
5,6
03-
200,
011,
969
-73
,225
,54
375
,283
,36
42,
418,
966
,479
-2,
418,
966
,479
Ne
t in
ter
seg
men
t bor
row
ing
-13
6,10
8,1
5232
3,78
8,0
341,
375,
268
,749
63,8
68,5
61
9,59
3,14
61,
908,
626
,642
(1,9
08,
626
,642
)-
Oth
ers
47,7
03,9
58
3,11
5,87
517
,857
,44
112
,387
,95
33,
138,
352
99,2
59,1
76
183,
462,
755
-18
3,46
2,7
55
To
tal l
iab
iliti
es2,
118,
149
,561
142,
735,
878
588,
346,
040
1,47
3,94
7,6
8514
2,28
0,0
3018
4,13
5,6
854,
649,
594
,881
(1,9
08,
626
,642
)2,
740,
968
,239
Equ
ity-
-21
2,69
043
,487
,20
046
4,60
322
3,39
4,2
5126
7,55
8,7
43-
267,
558,
742
To
tal e
qu
ity
and
liab
iliti
es2,
118,
149
,561
142,
735,
878
588,
558,
730
1,51
7,43
4,8
8514
2,74
4,6
3340
7,52
9,9
364,
917,
153
,624
(1,9
08,
626
,642
)3,
008,
526
,981
Co
nti
ng
enci
esan
dco
mm
itm
ents
557,
277,
573
-1,
046,
103
,666
-20
,577
,42
935
,553
,68
51,
659,
512
,355
-1,
659,
512
,355
Cas
h a
nd b
ala
nce
s w
ith tr
easu
ry
and
othe
r ba
nks
De
cem
ber
31,
202
0(A
udi
ted
)
----
----
----
----
----
----
----
----
----
----
----
----
----
----
----
----
----
----
----
----
----
----
----
--(R
up
ee
sin
'00
0)
----
----
----
----
- ---
----
----
----
----
----
----
----
----
----
----
----
----
----
----
----
----
----
----
-
----
----
----
----
----
----
----
----
----
----
----
----
----
----
----
----
----
----
----
----
----
----
----
--(R
up
ee
sin
'0
00
) --
----
----
----
--- -
----
----
----
----
----
----
----
----
----
----
----
----
----
----
----
----
----
----
---
Ha
lfye
ar
end
ed
June
30,
202
0 (U
n-a
udite
d)
Ne
t mar
k-u
p / r
etur
n / i
nte
rest
inco
me
/ (ex
pen
se)

HALF YEARLY REPORT JUNE 2021
National Bank of Pakistan
50
Dir
ecto
rs
Key
man
age-
men
t
pers
onne
l
Sub
sidi
arie
sA
ssoc
iate
sJo
int
vent
ure
Pen
sion
Fund
(Cur
rent
)
Pen
sion
Fund
(Fix
ed
Dep
osit
)
Pen
sion
Fun
d
(N.I.
D.A
A/c
)
Pro
vide
nt
Fund
Oth
erre
late
d
part
ies
Dire
ctor
s
Key
man
age-
men
t
pers
onne
l
Sub
sidi
arie
sA
ssoc
iate
sJo
int v
entu
reP
ensi
on F
und
(Cur
rent
)
Pen
sion
Fund
(Fi
xed
Dep
osit)
Pen
sion
Fun
d
(N.I.
D.A
A/c
)
Pro
vide
nt
Fund
Oth
erre
late
d
part
ies
Bala
nces
with
oth
er b
anks
In c
urre
nt a
ccou
nts
--
--
404,
658
--
--
--
--
-2,
951
--
--
-
--
--
404,
658
--
--
--
--
-2,
951
--
--
-
Adva
nces
Ope
ning
bala
nce
-23
3,26
735
9,56
52,
981,
029
--
--
-30
5,11
7-
228,
805
414,
565
3,04
6,66
2-
--
--
23, 3
86, 3
25Ad
ditio
n du
ring
the
year
-11
4,53
4-
--
--
--
33, 2
94, 4
15-
64, 8
50-
--
--
--
115,
824,
347
Repa
iddu
ring
the
year
-(2
5,91
5)(5
8,00
0)(1
5,62
5)-
--
--
(33,
351,
612)
-(3
1,84
0)(5
5,00
0)(6
5,63
3)-
--
--
(115
,673
,058
)T
rans
fer i
n / (
out)
- net
*-
(70,
438)
--
--
--
-(6
)-
(28,
548)
-(2
3,23
2,49
7)Cl
osin
g ba
lanc
e-
251,
448
301,
565
2,96
5,40
4-
--
--
247,
914
-23
3,26
735
9,56
52,
981,
029
--
--
-30
5,11
7
Pro
visi
ons
agai
nst l
oans
251,
565
2,83
7,28
728
4,56
52,
837,
287
Oth
erAs
sets
Inte
rest
/ m
ark-
upac
crue
d-
-24
2,80
81,
719,
988
--
--
--
--
233,
641
1,72
0,15
7-
--
--
-O
ther
rece
ivab
le-
-74
,683
--
--
--
--
-74
,785
--
--
--
--
317,
491
1,71
9,98
8-
--
--
--
-30
8,42
61,
720,
157
--
--
--
Borr
owin
gs
Ope
ning
bala
nce
--
--
9,11
1-
--
--
--
--
279,
814
--
--
-Bo
rrowi
ngs
durin
g th
e ye
ar-
--
-36
,026
--
--
--
--
--
--
--
-Se
ttled
dur
ing
the
year
--
--
--
--
--
--
--
(270
,703
)-
--
--
Clos
ing
bala
nce
--
--
45,1
37-
--
--
--
--
9,11
1-
--
--
Ope
ning
bala
nce
1,32
017
7,23
61,
553,
709
--
58,8
71-
1,36
9,64
413
,282
,016
227,
967
3,83
594
,715
1,52
2,79
2-
-73
-1,
235,
120
13,2
96,8
8340
,416
,083
Rece
ived
dur
ing
the
year
5,00
051
9,56
238
2,24
7-
-9,
434,
699
-1,
966,
589
848,
604
1,54
8,16
28,
672
713,
917
261,
901
--
47,0
37,9
83-
3,05
4,52
71,
941,
908
708,
790
With
draw
n du
ring
the
year
(3,6
03)
(502
,310
) (1,
238,
833)
--
(9,3
36,8
16)
-(3
,021
,741
)(8
51,0
98)
(449
,758
)(1
1,22
8)(6
20,5
73)
(230
,984
)-
-(4
6,97
9,18
5)-
(2,9
20,0
03)
(1,9
56,7
75)
(630
,132
)T
rans
fer i
n / (
out)
- net
*(1
2)(1
1,01
8)-
--
--
--
41(1
0,82
3)-
--
--
--
(40,
266,
774)
Clos
ing
bala
nce
2,70
518
3,47
069
7,12
3-
-15
6,75
4-
314,
492
13,2
79,5
221,
326,
371
1,32
017
7,23
61,
553,
709
--
58,8
71-
1,36
9,64
413
,282
,016
227,
967
Oth
er L
iabi
litie
s
Oth
er p
ayab
les
to s
ubsi
diar
ies
--
4,66
4-
--
--
--
--
4,30
8-
--
--
--
--
4,66
4-
--
--
--
--
4,30
8-
--
--
--
* Tr
ansf
er in
/(o
ut)
- ne
tdue
to re
tirem
ent/
appo
intm
ento
fdire
ctor
san
d ch
ange
sin
key
man
agem
ente
xecu
tives
.
Depo
sits
and
othe
r acc
ount
s
June
30, 2
021
(Un-
audi
ted)
Dec
embe
r31
, 202
0(A
udite
d)
36.
RE
LAT
ED
PA
RT
Y T
RA
NS
AC
TIO
NS
The
Bank
has
rela
ted
part
ytr
ansactions
with
its
pare
nt,
subsid
iaries,
associa
tes,
join
tve
ntu
res,
em
plo
yee
benefit
pla
ns
and
its
directo
rsan
dke
ym
anagem
ent
pers
onnel.
The
deta
ilsof
inve
stm
ent in
subsid
iary
com
panie
s, join
t ve
ntu
re a
nd a
ssocia
ted u
ndert
akin
g a
nd their p
rovis
ions a
re s
tate
d in n
ote
9 o
f th
e u
nconsolid
ate
d c
ond
ensed inte
rim
fin
ancia
l sta
tem
ent
of
the B
ank.
Deta
ils o
f tr
ansactions w
ith r
ela
ted p
art
ies d
uring the p
eriod, oth
er
than those w
hic
h h
ave
been d
isclo
sed e
lsew
here
in these u
nconsolid
ate
d fin
ancia
l sta
tem
ents
are
as follo
ws:
The
Banks
ente
rsin
totr
ansactions
with
rela
ted
part
ies
inth
eord
inary
cours
eof
busin
ess
and
on
substa
ntially
the
sam
ete
rms
as
for
com
para
ble
transactions
with
pers
on
of
sim
ilar
sta
ndin
g.
Contr
ibutions
toand
accru
als
inre
spect
of
sta
ffre
tire
ment
benefits
and
oth
er
benefit
pla
ns
are
made
inaccord
ance
with
the
actu
arialva
luations
/te
rms
of
the
contr
ibution
pla
n.
Rem
unera
tion
to the e
xecutive
s / o
ffic
ers
is d
ete
rmin
ed in a
cco
rdance w
ith the term
s o
f th
eir a
ppoin
tment.
----
----
----
----
----
----
----
----
----
----
----
----
----
----
----
----
----
----
----
----
----
----
----
----
----
----
----
----
----
----
----
--- -
----
----
----
----
----
----
--(R
up
ee
s in
'00
0)
----
----
----
----
----
----
----
----
----
----
----
----
----
----
----
----
----
----
----
----
----
----
----
----
----
----
----
----
----
----
----
----
----
----
----
----
----
----

Building Resilience. Creating Opportunities.
HALF YEARLY REPORT JUNE 2021 51
The
Bank
inth
eord
inary
cours
eof
busin
ess
ente
rsin
totr
ansaction
with
Gove
rnm
ent–
rela
ted
entities.
Such
transactions
inclu
de
lendin
gto
,deposits
from
and
pro
vis
ion
of
oth
er
bankin
gserv
ice
to G
ove
rnm
ent–
rela
ted e
ntities.
The
Bank
als
oearn
ed
com
mis
sio
non
handlin
gtr
easury
transactions
on
behalf
of
the
Gove
rnm
ent
of
Pakis
tan
am
ounting
toR
s.3,9
81
mill
ion
for
the
half
year
ended
June
30,
2021.
As
at
the
Sta
tem
ent
of
Fin
ancia
lP
ositio
ndate
the
loans
and
adva
nces,
deposits
and
contingencie
sre
lating
toG
ove
rnm
ent–
rela
ted
entities
am
ounte
dto
Rs.
385,0
39
mill
ion,
Rs.
1,1
00,9
76
mill
ion
and
Rs.
1,3
27,5
87 m
illio
n r
espective
ly a
nd incom
e e
arn
ed o
n a
dva
nces a
nd p
rofit paid
on d
eposits a
mounte
d to R
s. 1
5,7
98 m
illio
n a
nd R
s. 2
7,4
01 m
illio
n r
espective
ly.
The
Federa
lG
ove
rnm
ent
thro
ugh
Sta
teB
ank
of
Pakis
tan
hold
scontr
olli
ng
inte
rest
(75.6
0%
share
hold
ing)
inth
eB
ank
and
there
fore
entities
whic
hare
ow
ned
and
/or
contr
olle
dby
the
Federa
lG
ove
rnm
ent, o
r w
here
the F
edera
l G
ove
rnm
ent m
ay e
xerc
ise s
ignific
ant in
fluence, are
rela
ted p
art
ies o
f th
e B
ank.
36.1
Tran
sacti
on
s w
ith
Go
vern
men
t-re
late
d e
nti
tie
s
Key
man
age-
men
t
pers
onne
l
Subs
idia
ries
Asso
ciat
esJo
int v
entu
rePe
nsio
n
Fund
Prov
iden
t
Fund
Oth
ers
Key
man
age-
men
t
pers
onne
l
Subs
idia
ries
Asso
ciat
esJo
int v
entu
rePe
nsio
nFu
ndPr
ovid
ent
Fund
Oth
ers
Inco
me
Mar
k-up
/ re
turn
/ int
eres
t ear
ned
-9,
683
5,61
35
--
4,97
9-
821
10,9
669
--
12,8
20
Com
mis
sion
rece
ived
from
subs
idia
ries
-23
4-
--
--
-64
5-
--
--
Div
iden
d in
com
e-
--
--
--
-12
,016
--
--
-
Ren
t inc
ome
/ lig
htin
g an
d po
wer
and
bank
cha
rges
-12
,326
2,55
4-
--
--
19,4
892,
319
--
-9,
723
Expe
nse
Mar
k-up
/ re
turn
/ int
eres
t pai
d-
3,52
6-
3338
,037
724,
844
5,10
9-
19,2
03-
293
52,7
8472
1,26
82,
140
Expe
nses
pai
d to
com
pany
inw
hich
Dire
ctor
s of
the
bank
isin
tere
sted
as
CEO
and
dire
ctor
--
--
--
18,6
68-
--
--
-5,
632
Rem
uner
atio
nto
key
man
agem
ent
exec
utiv
es in
clud
ing
char
ge fo
rde
fined
ben
efit
plan
347,
228
--
--
--
220,
761
--
--
--
Com
mis
sion
paid
to s
ubsi
diar
ies
-3,
490
--
--
--
2,43
2-
--
--
Post
Ret
irem
ent B
enef
it pa
id to
Dire
ctor
cum
Ex-
empl
oyee
--
--
--
1,04
4-
--
--
-1,
044
June
30,
202
1 (U
n-au
dite
d)Ju
ne 3
0, 2
020
(Un-
audi
ted)
------
------
------
------
------
------
------
------
------
------
------
------
------
------
------
------
------
------
------
------
------
- -----
------
------
------
---- (
Rupe
es in
'000
) ----
------
------
------
------
------
------
------
------
------
------
------
------
------
-- ----
------
------
------
------
------
------
------
------
------
------
----
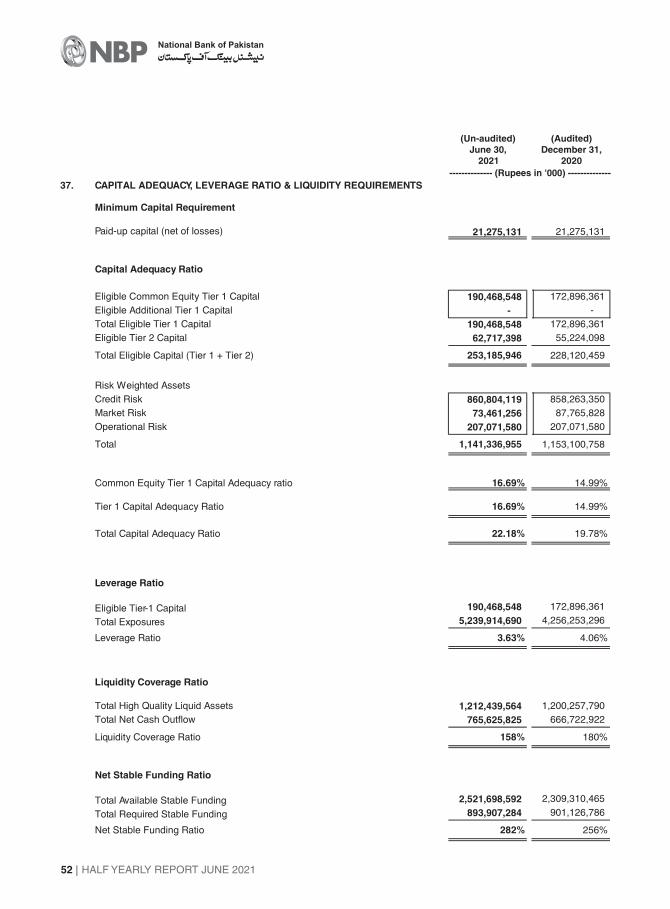
HALF YEARLY REPORT JUNE 2021
National Bank of Pakistan
52
37. CAPITAL ADEQUACY, LEVERAGE RATIO & LIQUIDITY REQUIREMENTS
Minimum Capital Requirement
Paid-up capital (net of losses) 21,275,131 21,275,131
Capital Adequacy Ratio
Eligible Common Equity Tier 1 Capital 190,468,548 172,896,361
Eligible Additional Tier 1 Capital - -
Total Eligible Tier 1 Capital 190,468,548 172,896,361
Eligible Tier 2 Capital 62,717,398 55,224,098
Total Eligible Capital (Tier 1 + Tier 2) 253,185,946 228,120,459
Risk Weighted Assets
Credit Risk 860,804,119 858,263,350
Market Risk 73,461,256 87,765,828
Operational Risk 207,071,580 207,071,580
Total 1,141,336,955 1,153,100,758
Common Equity Tier 1 Capital Adequacy ratio 16.69% 14.99%
Tier 1 Capital Adequacy Ratio 16.69% 14.99%
Total Capital Adequacy Ratio 22.18% 19.78%
Leverage Ratio
Eligible Tier-1 Capital 190,468,548 172,896,361
Total Exposures 5,239,914,690 4,256,253,296
Leverage Ratio 3.63% 4.06%
Liquidity Coverage Ratio
Total High Quality Liquid Assets 1,212,439,564 1,200,257,790
Total Net Cash Outflow 765,625,825 666,722,922
Liquidity Coverage Ratio 158% 180%
Net Stable Funding Ratio
Total Available Stable Funding 2,521,698,592 2,309,310,465
Total Required Stable Funding 893,907,284 901,126,786
Net Stable Funding Ratio 282% 256%
(Un-audited)
June 30,
2021
(Audited)
December 31,
2020
-------------- (Rupees in '000) --------------

Building Resilience. Creating Opportunities.
HALF YEARLY REPORT JUNE 2021 53
ASSETS
Cash and balances with treasury banks 7,620,868 5,713,009
Balances with other banks 12,199 11,948
Investments 38.1 46,097,726 42,109,641
Islamic financing and related assets - net 38.2 37,290,273 37,546,704
Fixed assets 128,184 148,884
Right of use assets 699,593 755,116
Other assets 2,218,185 2,676,118
Total Assets 94,067,028 88,961,420
LIABILITIES
Bills payable 443,326 339,103-
Deposits and other accounts 38.3 84,839,634 75,268,262
Lease liability against right of use assets 877,211 903,196
Due to head office 517,646 4,124,758
Other liabilities 1,401,129 2,198,144
88,078,946 82,833,463
NET ASSETS 5,988,082 6,127,957
REPRESENTED BY
Islamic Banking Fund 4,646,000 3,360,000
Surplus on revaluation of assets 685,749 659,569
Unappropriated / unremitted profit 38.4 656,333 2,108,388
5,988,082 6,127,957
- -
(Un-audited)
June 30,
2021
(Audited)
December 31,
2020Note -------------- (Rupees in '000) --------------
38. ISLAMIC BANKING BUSINESS
The Bank is operating 190 (December 31, 2020: 191) Islamic banking branches and no Islamic banking windows at the half
year ended June 30, 2021.
The statement of financial position of the Bank's Islamic banking branches as at June 30, 2021 is as follows:
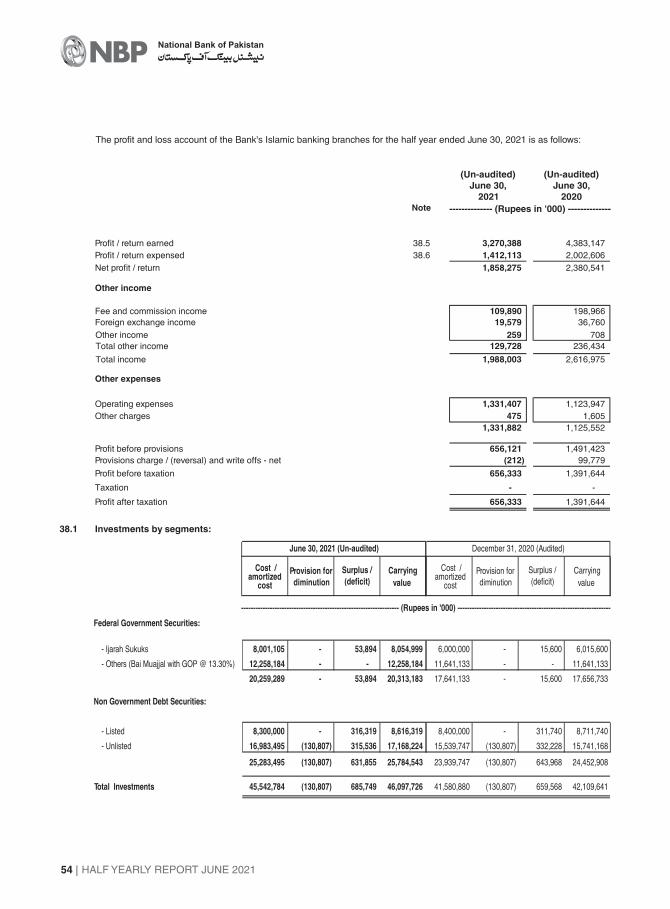
HALF YEARLY REPORT JUNE 2021
National Bank of Pakistan
54
The profit and loss account of the Bank's Islamic banking branches for the half year ended June 30, 2021 is as follows:
(Un-audited) (Un-audited)
June 30,
2021
June 30,
2020Note -------------- (Rupees in '000) --------------
Profit / return earned 38.5 3,270,388 4,383,147
Profit / return expensed 38.6 1,412,113 2,002,606
Net profit / return 1,858,275 2,380,541
Other income
Fee and commission income 109,890 198,966
Foreign exchange income 19,579 36,760
Other income 259 708
Total other income 129,728 236,434
Total income 1,988,003 2,616,975
Other expenses
Operating expenses 1,331,407 1,123,947
Other charges 475 1,605
1,331,882 1,125,552
Profit before provisions 656,121 1,491,423
Provisions charge / (reversal) and write offs - net (212) 99,779
Profit before taxation 656,333 1,391,644
Taxation - -
Profit after taxation 656,333 1,391,644
38.1 Investments by segments:
Federal Government Securities:
- Ijarah Sukuks
- Others (Bai Muajjal with GOP @ 13.30%)
Non Government Debt Securities:
- Listed
- Unlisted
Total Investments
June 30, 2021 (Un-audited) December 31, 2020 (Audited)
------------------------------------------------------------------ (Rupees in '000) ----------------------------------------------------------------
Provision for
diminution
Surplus /
(deficit)Carrying
value
Cost /amortized
cost
Provision for
diminution
Surplus /
(deficit)Carrying
value
Cost /amortized
cost
8,001,105
12,258,184
20,259,289
8,300,000
16,983,495
25,283,495
45,542,784
-
-
-
-
(130,807)
(130,807)
(130,807)
53,894
-
53,894
316,319
315,536
631,855
685,749
8,054,999
12,258,184
20,313,183
8,616,319
17,168,224
25,784,543
46,097,726
6,000,000
11,641,133
17,641,133
8,400,000
15,539,747
23,939,747
41,580,880
-
-
-
-
(130,807)
(130,807)
(130,807)
15,600
-
15,600
311,740
332,228
643,968
659,568
6,015,600
11,641,133
17,656,733
8,711,740
15,741,168
24,452,908
42,109,641
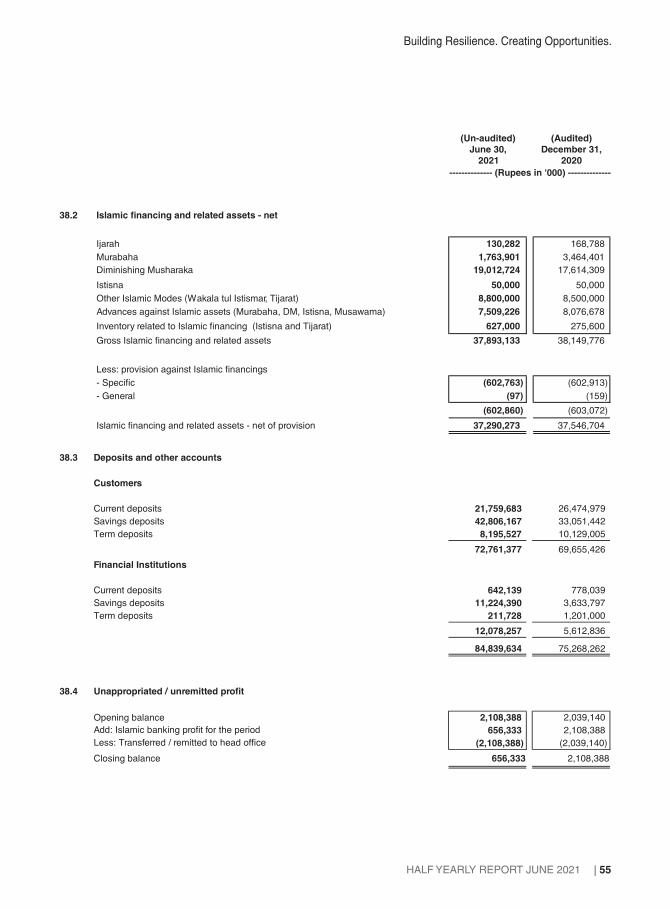
Building Resilience. Creating Opportunities.
HALF YEARLY REPORT JUNE 2021 55
38.2 Islamic financing and related assets - net
Ijarah 130,282 168,788
Murabaha 1,763,901 3,464,401
Diminishing Musharaka 19,012,724 17,614,309
Istisna 50,000 50,000
Other Islamic Modes (Wakala tul Istismar, Tijarat) 8,800,000 8,500,000
Advances against Islamic assets (Murabaha, DM, Istisna, Musawama) 7,509,226 8,076,678
Inventory related to Islamic financing (Istisna and Tijarat) 627,000 275,600
Gross Islamic financing and related assets 37,893,133 38,149,776
Less: provision against Islamic financings
- Specific (602,763) (602,913)
- General (97) (159)
(602,860) (603,072)
Islamic financing and related assets - net of provision 37,290,273 37,546,704
(Un-audited)
June 30,
2021
(Audited)
December 31,
2020
-------------- (Rupees in '000) --------------
38.3 Deposits and other accounts
Customers
Current deposits 21,759,683 26,474,979
Savings deposits 42,806,167 33,051,442
Term deposits 8,195,527 10,129,005
72,761,377 69,655,426
Financial Institutions
Current deposits 642,139 778,039
Savings deposits 11,224,390 3,633,797
Term deposits 211,728 1,201,000
12,078,257 5,612,836
84,839,634 75,268,262
38.4 Unappropriated / unremitted profit
Opening balance 2,108,388 2,039,140
656,333 2,108,388
(2,108,388) (2,039,140)
Closing balance 656,333 2,108,388
Less: Transferred / remitted to head office
Add: Islamic banking profit for the period
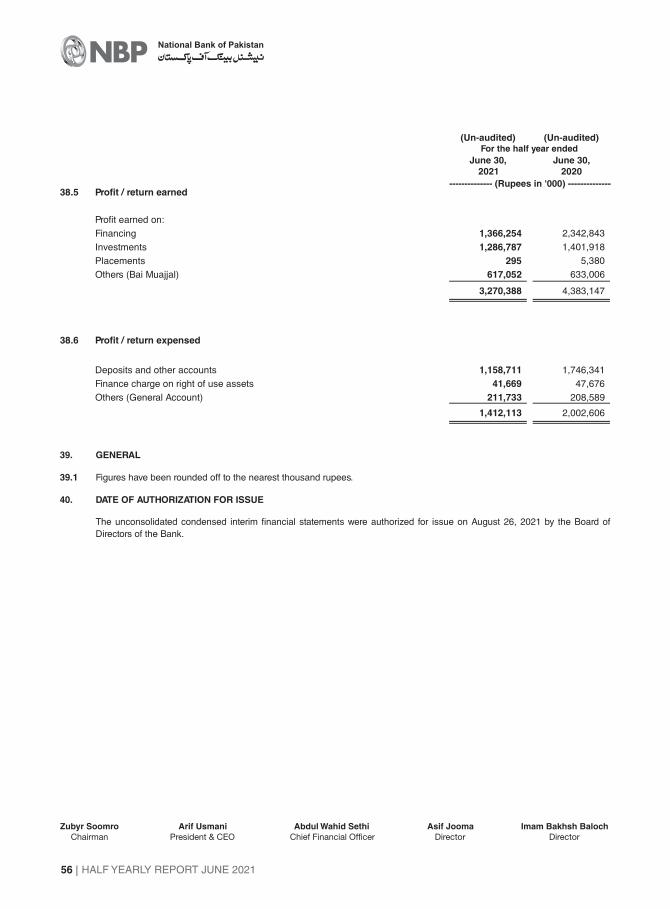
HALF YEARLY REPORT JUNE 2021
National Bank of Pakistan
56
38.5 Profit / return earned
Profit earned on:
Financing 1,366,254 2,342,843
Investments 1,286,787 1,401,918
Placements 295 5,380
Others (Bai Muajjal) 617,052 633,006
3,270,388 4,383,147
38.6 Profit / return expensed
Deposits and other accounts 1,158,711 1,746,341
Finance charge on right of use assets 41,669 47,676
Others (General Account) 211,733 208,589
1,412,113 2,002,606
For the half year ended
(Un-audited)
June 30,
2021
June 30,
2020
-------------- (Rupees in '000) --------------
40. DATE OF AUTHORIZATION FOR ISSUE
39. GENERAL
39.1 Figures have been rounded off to the nearest thousand rupees.
The unconsolidated condensed interim financial statements were authorized for issue on August 26, 2021 by the Board of
Directors of the Bank.
Zubyr Soomro
Chairman
Arif Usmani
President & CEO
Abdul Wahid Sethi
Chief Financial Officer
Asif Jooma
Director
Imam Bakhsh Baloch
Director
(Un-audited)

Building Resilience. Creating Opportunities.
HALF YEARLY REPORT JUNE 2021 57
Consolidated Financial
Statements of NBP
and its
Subsidiary Companies
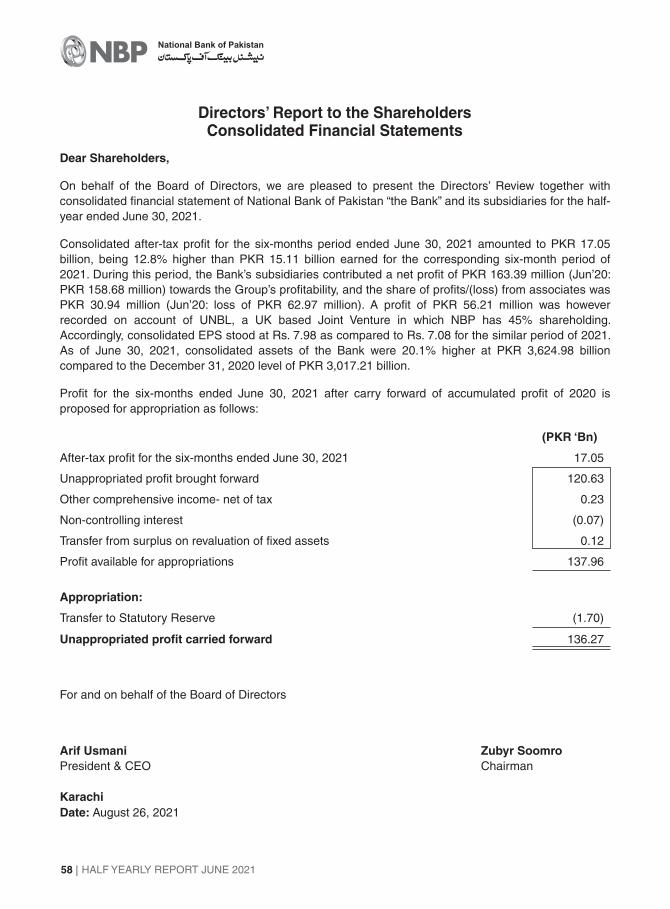
HALF YEARLY REPORT JUNE 2021
National Bank of Pakistan
58
Directors’ Report to the ShareholdersConsolidated Financial Statements
On behalf of the Board of Directors, we are pleased to present the Directors’ Review together with
consolidated financial statement of National Bank of Pakistan “the Bank” and its subsidiaries for the half-
year ended June 30, 2021.
Unappropriated profit brought forward 120.63
Appropriation:
Transfer to Statutory Reserve (1.70)
Other comprehensive income- net of tax 0.23
Transfer from surplus on revaluation of fixed assets 0.12
Profit for the six-months ended June 30, 2021 after carry forward of accumulated profit of 2020 is
proposed for appropriation as follows:
Unappropriated profit carried forward 136.27
Non-controlling interest (0.07)
(PKR ‘Bn)
Dear Shareholders,
After-tax profit for the six-months ended June 30, 2021 17.05
President & CEO Chairman
Consolidated after-tax profit for the six-months period ended June 30, 2021 amounted to PKR 17.05
billion, being 12.8% higher than PKR 15.11 billion earned for the corresponding six-month period of
2021. During this period, the Bank’s subsidiaries contributed a net profit of PKR 163.39 million (Jun’20:
PKR 158.68 million) towards the Group’s profitability, and the share of profits/(loss) from associates was
PKR 30.94 million (Jun’20: loss of PKR 62.97 million). A profit of PKR 56.21 million was however
recorded on account of UNBL, a UK based Joint Venture in which NBP has 45% shareholding.
Accordingly, consolidated EPS stood at Rs. 7.98 as compared to Rs. 7.08 for the similar period of 2021.
As of June 30, 2021, consolidated assets of the Bank were 20.1% higher at PKR 3,624.98 billion
compared to the December 31, 2020 level of PKR 3,017.21 billion.
Profit available for appropriations 137.96
Arif Usmani Zubyr Soomro
Karachi
Date: August 26, 2021
For and on behalf of the Board of Directors

Building Resilience. Creating Opportunities.
HALF YEARLY REPORT JUNE 2021 59
ريال�ريالٹ �ريالز� � �ز ڈا��اريالے � �����

HALF YEARLY REPORT JUNE 2021
National Bank of Pakistan
60
CONSOLIDATED CONDENSED INTERIM STATEMENT OF FINANCIAL POSITIONAS AT JUNE 30, 2021
ASSETS
Cash and balances with treasury banks 6 383,640,756 249,969,566
Balances with other banks 7 18,925,058 15,015,366
Lendings to financial institutions 8 180,790,708 126,804,675
Investments 9 1,852,914,100 1,466,405,373
Advances 10 997,022,576 983,871,421
Fixed assets 11 54,797,294 55,086,809
Intangible assets 12 958,215 1,022,143
Right of use assets 13 7,287,177 7,017,020
Other assets 14 128,647,865 112,017,619
3,624,983,749 3,017,209,992
LIABILITIES
Bills payable 15 22,265,478 16,795,186
Borrowings 16 442,256,518 138,539,005
Deposits and other accounts 17 2,679,044,162 2,418,928,469
Liabilities against assets subject to finance lease 18 175,995 197,224
Lease liability against right of use assets 19 8,355,140 7,869,355
Deferred tax liabilities 20 2,857,706 2,933,124
Other liabilities 21 177,559,188 157,545,347
3,332,514,186 2,742,807,710
NET ASSETS 292,469,563 274,402,282
REPRESENTED BY
Share capital 21,275,131 21,275,131
Reserves 58,074,531 57,591,417
Surplus on revaluation of assets 22 75,870,096 73,987,802
Unappropriated profit 136,266,464 120,631,784
291,486,222 273,486,134
Non-controlling interest 983,341 916,148
292,469,563 274,402,282
CONTINGENCIES AND COMMITMENTS 23
The annexed notes 1 to 41 form an integral part of these consolidated condensed interim financial statements.
(Un-audited)
June 30,
2021
(Audited)
December 31,
2020Note -------------- (Rupees in '000) --------------
Zubyr Soomro
Chairman
Arif Usmani
President & CEO
Abdul Wahid Sethi
Chief Financial Officer
Asif Jooma
Director
Imam Bakhsh Baloch
Director

Building Resilience. Creating Opportunities.
HALF YEARLY REPORT JUNE 2021 61
CONSOLIDATED CONDENSED INTERIM PROFIT AND LOSS ACCOUNT (UN-AUDITED)FOR THE HALF YEAR ENDED JUNE 30, 2021
June 30,2021
June 30,2020
June 30,2021
June 30,2020
Note---------------------------------- (Rupees in ‘000) ----------------------------------
Quarter ended Half Year ended
Mark-up / return / interest earned 24 59,566,827 72,788,477 108,089,589 145,393,598
Mark-up / return / interest expensed 25 33,718,391 40,841,155 60,606,162 96,807,886
Net mark-up / return / interest income 25,848,436 31,947,322 47,483,427 48,585,712
NON MARK-UP / INTEREST INCOME
Fee and commission income 26 5,437,874 4,427,954 9,536,612 9,313,718
Dividend income 699,482 636,251 1,469,666 1,020,312
Foreign exchange income 1,822,208 2,022,930 2,775,020 2,828,022
Gain on securities - net 27 1,540,202 2,000,357 4,156,340 3,328,867
Share of profit / (loss) from joint venture - net of tax 69,261 (208,763) 56,209 (217,623)
Share of profit / (loss) from associates - net of tax 24,060 67,633 30,939 (62,966)
Other income 28 493,322 1,243,345 955,223 2,544,203
Total non-mark-up / interest income 10,086,409 10,189,707 18,980,009 18,754,533
Total income 35,934,845 42,137,029 66,463,436 67,340,245
NON MARK-UP / INTEREST EXPENSES
Operating expenses 29 16,646,686 15,985,078 31,326,608 29,873,564
Workers welfare fund - - - -
Other charges 30 21,355 14,624 24,872 294,452
Total non-markup / interest expenses 16,668,041 15,999,702 31,351,480 30,168,016
Profit before provisions 19,266,804 26,137,327 35,111,956 37,172,229
Provisions and write offs - net 31 3,900,569 11,610,877 6,937,884 15,581,459
PROFIT BEFORE TAXATION 15,366,235 14,526,450 28,174,072 21,590,770
Taxation 32 6,163,316 3,553,583 11,126,699 6,479,356
PROFIT AFTER TAXATION 9,202,919 10,972,867 17,047,373 15,111,414
Attributable to:Shareholders of the Bank 9,165,467 10,946,729 16,980,180 15,066,590Non-controlling interest 37,452 26,138 67,193 44,824
9,202,919 10,972,867 17,047,373 15,111,414
Earnings per share - basic and diluted 33 4.31 5.15 7.98 7.08
The annexed notes 1 to 41 form an integral part of these consolidated condensed interim financial statements.
Zubyr Soomro
Chairman
Arif Usmani
President & CEO
Abdul Wahid Sethi
Chief Financial Officer
Asif Jooma
Director
Imam Bakhsh Baloch
Director
----------------------------------------- (Rupees) -----------------------------------------

HALF YEARLY REPORT JUNE 2021
National Bank of Pakistan
62
CONSOLIDATED CONDENSED INTERIM STATEMENT OF COMPREHENSIVE INCOME (UN-AUDITED)FOR THE HALF YEAR ENDED JUNE 30, 2021
June 30,2021
June 30,2020
June 30,2021
June 30,2020
---------------------------------- (Rupees in ‘000) ----------------------------------
Quarter ended Half Year ended
Profit after taxation for the period 9,202,919 10,972,867 17,047,373 15,111,414
Other comprehensive income
Items that may be reclassified to profit and loss
account in subsequent periods:
Exchange gain / (loss) on translation of net assets
of foreign branches, subsidiaries and joint venture 1,375,375 (207,829) (1,213,417) 127,402
Movement in surplus on revaluation of
investments - net of tax 5,252,792 12,033,235 2,029,945 11,272,967
6,628,167 11,825,406 816,528 11,400,369
Items that will not be reclassified to profit and loss
account in subsequent periods:
Remeasurement gain / (loss) on defined benefit
obligations - net of tax 106,567 (524,237) 230,872 (657,612)
Movement in surplus on revaluation of fixed assets -
net of tax (27,489) 589,997 (27,489) 589,997
Movement in surplus on revaluation of non-banking
assets - net of tax - - - -
79,078 65,760 203,383 (67,615)
Total comprehensive income 15,910,164 22,864,033 18,067,284 26,444,168
Total comprehensive income attributable to:
Shareholders of the Bank 15,872,712 22,837,895 18,000,091 26,399,344
Non-controlling interest 37,452 26,138 67,193 44,824
15,910,164 22,864,033 18,067,284 26,444,168
The annexed notes 1 to 41 form an integral part of these consolidated condensed interim financial statements.
Zubyr Soomro
Chairman
Arif Usmani
President & CEO
Abdul Wahid Sethi
Chief Financial Officer
Asif Jooma
Director
Imam Bakhsh Baloch
Director

Building Resilience. Creating Opportunities.
HALF YEARLY REPORT JUNE 2021 63
CONSOLIDATED CONDENSED INTERIM STATEMENT OF CHANGES IN EQUITY (UN-AUDITED)FOR THE HALF YEAR ENDED JUNE 30, 2021
Exc
ha
ng
e
tra
ns
lati
on
Sta
tuto
ry
res
erv
e
Ge
ne
ral
loa
n
loss r
ese
rve
Rev
en
ue
ge
ne
ral
res
erv
e
To
tal
Inve
stm
en
ts
Fix
ed
/ no
n-
ba
nk
ing
ass
ets
To
tal
Bala
nce
as a
t Jan
uary
01, 20
20
21,2
75,1
31
11,5
70,5
96
33,1
68,8
55
8,0
00,0
00
521,3
38
53,2
60,7
89
25,2
53,4
52
45,1
05,1
35
70,3
58,5
87
93,4
65,5
16
238,3
60,0
23
862,5
32
239,2
22,5
55
Pro
fit a
fter
taxa
tion
for
the h
alf
year
ended J
une 3
0, 2020
--
--
--
--
-15,0
66,5
90
15,0
66,5
90
44,8
24
15,1
11,4
14
Oth
er
com
pre
hensi
ve in
com
e / (
loss
) -
netof ta
x-
127,4
02
--
-127,4
02
11,2
72,9
67
589,9
97
11,8
62,9
64
(657,6
12)
11,3
32,7
54
-11,3
32,7
54
Tra
nsf
er
tost
atu
tory
rese
rve
--
1,5
19,0
37
--
1,5
19,0
37
--
-(1
,519,0
37)
--
-T
ran
sfer
fro
msu
rplu
son r
evalu
atio
n o
f
ass
ets
to u
nappro
priate
dpro
fit -
net of ta
x-
--
--
--
(113,7
87)
(113,7
87)
113,7
87
--
-
Tra
nsac
tio
ns
wit
h o
wn
ers
, re
cord
ed
dir
ectl
y in
eq
uit
y
Cash
div
idend
paid
for
the
year
ended
De
cem
be
r 3
1,2
019
(R
s. N
ilpe
rsh
are
)-
--
--
--
--
--
-C
ash
div
ide
nd
pa
id/ p
rofit
dis
trib
utio
nby
sub
sidia
rie
s-
--
--
--
--
--
--
Bala
nce
as a
t Ju
ly01, 20
20
21,2
75,1
31
11,6
97,9
98
34,6
87,8
92
8,0
00,0
00
521,3
38
54,9
07,2
28
36,5
26,4
19
45,5
81,3
45
82,1
07,7
64
106,4
69,2
44
264,7
59,3
68
907,3
56
265,6
66,7
24
Pro
fit a
fter
taxa
tion
for
the
half
year
end
ed D
ecem
ber
31, 2
020
--
--
--
--
-15,4
23,1
63
15,4
23,1
63
51,3
42
15,4
74,5
05
Oth
er
com
pre
hensi
ve in
com
e / (
loss
) -
netof ta
x-
1,1
47,3
34
--
-1,1
47,3
34
(8,2
75,5
35)
272,1
67
(8,0
03,3
68)
159,6
40
(6,6
96,3
94)
-(6
,696,3
94)
Tra
nsf
er
tost
atu
tory
rese
rve
--
1,5
36,8
55
--
1,5
36,8
55
--
-(1
,536,8
55)
--
-T
ran
sfer
fro
msu
rplu
son r
evalu
atio
n o
f
ass
ets
to u
nappro
priate
dpro
fit -
net of ta
x-
--
--
--
(116,5
92)
(116,5
92)
116,5
92
--
-
Tra
nsac
tio
ns
wit
h o
wn
ers
, re
cord
ed
dir
ectl
y in
eq
uit
y
Cash
div
ide
nd
pa
id/ p
rofit
dis
trib
utio
nby
sub
sidia
rie
s-
--
--
--
--
--
(42,5
50)
(42,5
50)
Bala
nce
as a
t Jan
uary
01, 20
21
21,2
75,1
31
12,8
45,3
32
36,2
24,7
47
8,0
00,0
00
521,3
38
57,5
91,4
17
28,2
50,8
84
45,7
36,9
18
73,9
87,8
02
120,6
31,7
84
273,4
86,1
34
916,1
48
274,4
02,2
82
Pro
fit a
fter
taxa
tion
for
the h
alf
year
ended J
une 3
0, 2021
--
--
--
--
-16,9
80,1
80
16,9
80,1
80
67,1
93
17,0
47,3
73
Oth
er
com
pre
hensi
ve in
com
e / (
loss
) -
netof ta
x-
(1,2
13,4
17)
--
-(1
,213,4
17)
2,0
29,9
45
(27,
489)
2,0
02,4
56
230,8
72
1,0
19,9
11
-1,0
19,9
11
Tra
nsf
er
tost
atu
tory
rese
rve
--
1,6
96,5
31
--
1,6
96,5
31
--
-(1
,696,5
31)
--
-T
ran
sfer
fro
msu
rplu
son r
evalu
atio
n o
f
ass
ets
to u
nappro
priate
dpro
fit -
net of ta
x-
--
--
--
(120
,159
)(1
20,1
59)
120,1
59
--
-
Tra
nsac
tio
ns
wit
h o
wn
ers
, re
cord
ed
dir
ect
lyin
eq
uit
y
Cash
div
idend
paid
for
the
year
ended
De
cem
be
r 3
1,2
020
(R
s. N
ilpe
rsh
are
)-
--
--
--
--
--
--
Cash
div
ide
nd
pa
id/ p
rofit
dis
trib
utio
nby
sub
sidia
rie
s-
--
--
--
--
--
--
Bala
nce
as a
t Ju
ne 3
0, 2
021
21,2
75,1
31
11,6
31,9
15
37,9
21,2
78
8,0
00,0
00
521,3
38
58,0
74,5
31
30,2
80,8
28
45,5
89,2
68
75,8
70,0
96
136,2
66,4
64
291,4
86,2
22
983,3
41
292,4
69,5
63
The
ann
exe
d n
ote
s1
to 4
1 f
orm
an
inte
gra
l part
of
these
cons
olid
ate
d c
ond
ens
ed in
terim
financ
ial s
tate
ment
s.
Sh
are
cap
ita
l
Re
se
rve
sS
urp
lus
on
rev
alu
ati
on
of
as
sets
Un
ap
pro
pri
ate
d
pro
fit
Su
b T
ota
l
No
n-
Co
ntr
oll
ing
Inte
res
t
To
tal
Zu
byr
So
om
ro
Chairm
an
Ari
f U
sm
an
i
Pre
sid
en
t &
CE
O
Ab
du
lWa
hid
Se
thi
Ch
ief
Fin
an
cia
l O
ffic
er
As
if J
oo
ma
Directo
r
Ima
m B
ak
hs
h B
alo
ch
Directo
r
----
----
----
----
----
----
----
----
----
----
----
----
----
----
----
----
----
----
----
----
----
----
----
----
----
----
----
--- -
----
----
-- (
Ru
pe
es
in
‘00
0)
----
----
----
----
----
----
----
----
----
----
----
----
----
----
----
----
----
----
----
----
----
----
----
----
----
----
----
----
----
----
-
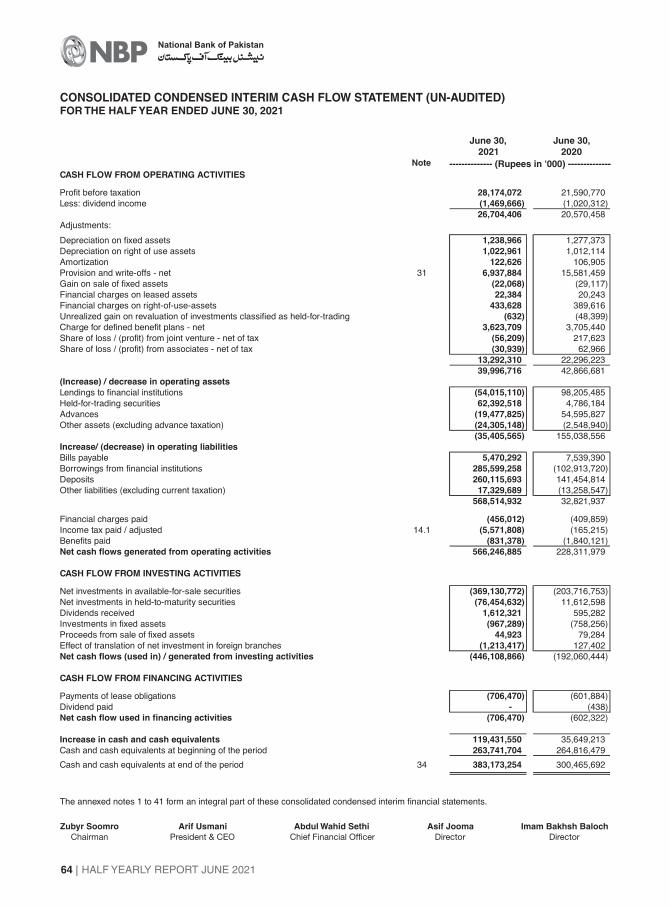
HALF YEARLY REPORT JUNE 2021
National Bank of Pakistan
64
CONSOLIDATED CONDENSED INTERIM CASH FLOW STATEMENT (UN-AUDITED)FOR THE HALF YEAR ENDED JUNE 30, 2021
CASH FLOW FROM OPERATING ACTIVITIES
Profit before taxation 28,174,072 21,590,770
Less: dividend income (1,469,666) (1,020,312)
26,704,406 20,570,458
Adjustments:
Depreciation on fixed assets 1,238,966 1,277,373
Depreciation on right of use assets 1,022,961 1,012,114
Amortization 122,626 106,905
Provision and write-offs - net 31 6,937,884 15,581,459
Gain on sale of fixed assets (22,068) (29,117)
Financial charges on leased assets 22,384 20,243
Financial charges on right-of-use-assets 433,628 389,616
Unrealized gain on revaluation of investments classified as held-for-trading (632) (48,399)
Charge for defined benefit plans - net 3,623,709 3,705,440
Share of loss / (profit) from joint venture - net of tax (56,209) 217,623
Share of loss / (profit) from associates - net of tax (30,939) 62,966
13,292,310 22,296,223
39,996,716 42,866,681
(Increase) / decrease in operating assets
Lendings to financial institutions (54,015,110) 98,205,485
Held-for-trading securities 62,392,518 4,786,184
Advances (19,477,825) 54,595,827
Other assets (excluding advance taxation) (24,305,148) (2,548,940)
(35,405,565) 155,038,556
Increase/ (decrease) in operating liabilities
Bills payable 5,470,292 7,539,390
Borrowings from financial institutions 285,599,258 (102,913,720)
Deposits 260,115,693 141,454,814
Other liabilities (excluding current taxation) 17,329,689 (13,258,547)
568,514,932 32,821,937
Financial charges paid (456,012) (409,859)
Income tax paid / adjusted 14.1 (5,571,808) (165,215)
Benefits paid (831,378) (1,840,121)
Net cash flows generated from operating activities 566,246,885 228,311,979
CASH FLOW FROM INVESTING ACTIVITIES
Net investments in available-for-sale securities (369,130,772) (203,716,753)
Net investments in held-to-maturity securities (76,454,632) 11,612,598
Dividends received 1,612,321 595,282
Investments in fixed assets (967,289) (758,256)
Proceeds from sale of fixed assets 44,923 79,284
Effect of translation of net investment in foreign branches (1,213,417) 127,402
Net cash flows (used in) / generated from investing activities (446,108,866) (192,060,444)
CASH FLOW FROM FINANCING ACTIVITIES
Payments of lease obligations (706,470) (601,884)
Dividend paid - (438)
Net cash flow used in financing activities (706,470) (602,322)
Increase in cash and cash equivalents 119,431,550 35,649,213
Cash and cash equivalents at beginning of the period 263,741,704 264,816,479
Cash and cash equivalents at end of the period 34 383,173,254 300,465,692
The annexed notes 1 to 41 form an integral part of these consolidated condensed interim financial statements.
June 30,
2021 2020Note -------------- (Rupees in '000) --------------
Zubyr Soomro
Chairman
Arif Usmani
President & CEO
Abdul Wahid Sethi
Chief Financial Officer
Asif Jooma
Director
Imam Bakhsh Baloch
Director
June 30,
Building Resilience. Creating Opportunities.
HALF YEARLY REPORT JUNE 2021 65
CJSC Subsidiary Bank of NBP in Kazakhstan, CJSC Subsidiary Bank of NBP in Tajikistan, NBP Exchange Company Limited,
National Bank Modaraba Management Company Limited are wholly owned subsidiaries of the holding company while the
controlling interest in Taurus Securities Limited is 58.32%, NBP Fund Management Limited is 54%, First National Bank
Modarba 30% and Cast-N-Link Products Limited 76.51%.
- The consolidated financial statements include the financial statements of the Bank (Holding Company) and its
subsidiary companies together - "the Group".
- Material intra-group balances and transactions have been eliminated.
- Subsidiary companies are fully consolidated from the date on which more than 50% of voting rights are transferred to
the Group or power to control the company is established and excluded from consolidation from the date of disposal or
when the control is lost.
The holding company was incorporated in Pakistan under the National Bank of Pakistan Ordinance, 1949 and is listed on
Pakistan Stock Exchange (PSX). The registered and head office of the Bank is situated at I.I. Chundrigar Road, Karachi. The
Bank is engaged in providing commercial banking and related services in Pakistan and overseas. The Bank also handles
treasury transactions for the Government of Pakistan (GoP) as an agent to the State Bank of Pakistan (SBP). The Bank
operates 1,514 (December 31, 2020: 1,514) branches in Pakistan and 21 (December 31, 2020: 21) overseas branches
(including the Export Processing Zone branch, Karachi).
- The assets, liabilities, income and expenses of subsidiary companies have been consolidated on a line by line basis.
1.2 BASIS OF CONSOLIDATION
- Non-Controlling interest / (minority interest) in equity of the subsidiary companies are measured at fair value for all the
subsidiaries acquired from period beginning on or after January 1, 2010 whereas minority interest of previously acquired
subsidiaries are measured at the proportionate net assets of subsidiary companies attributable to interest which is not
owned by holding company.
- Income and expenses of subsidiaries acquired during the year are included in the consolidated statement of the
comprehensive income from the effective date of acquisition.
1.1 The "Group" consists of:
Holding Company
- National Bank of Pakistan (the Bank)
Subsidiary Companies
- CJSC Subsidiary Bank of NBP in Tajikistan
- NBP Exchange Company Limited, Pakistan
- National Bank Modaraba Management Company Limited, Pakistan
- Taurus Securities Limited, Pakistan
1. THE GROUP AND ITS OPERATIONS
- CJSC Subsidiary Bank of NBP in Kazakhstan
- First National Bank Modaraba, Pakistan
- NBP Fund Management Limited, Pakistan
- Cast-N-Link Products Limited
The subsidiary company of the Group, National Bank Modaraba Management Company Limited, Pakistan exercises control
over First National Bank Modaraba, Pakistan as its management company and also has a direct economic interest in it. The
Group has consolidated the financial statements of the modaraba as the Ultimate Holding Company.
The Group is principally engaged in commercial banking, modaraba management, brokerage, leasing, foreign currency
remittances, asset management, exchange transactions and investment advisory asset.
NOTES TO THE CONSOLIDATED CONDENSED INTERIM FINANCIAL STATEMENTS (UN-AUDITED)FOR THE HALF YEAR ENDED JUNE 30, 2021
HALF YEARLY REPORT JUNE 2021
National Bank of Pakistan
66
2. BASIS OF PRESENTATION
Standards, interpretations of and amendments to accounting and reporting standards that are not yet effective
2.1.1 These consolidated condensed interim financial statements have been prepared in accordance with the accounting and
reporting standards as applicable in Pakistan for interim financial reporting. The accounting and reporting standards as
applicable in Pakistan for interim financial reporting comprise of:
- Islamic Financial Accounting Standards (IFAS) issued by the Institute of Chartered Accountants of Pakistan as are
notified under the Companies Act, 2017;
- Directives issued by the State Bank of Pakistan (SBP) and the Securities and Exchange Commission of Pakistan
(SECP).
Wherever the requirements of the Banking Companies Ordinance,1962, the Companies Act, 2017, or the directives issued by
the SBP and the SECP differ with the requirements of IAS 34 or IFAS, the requirements of the Banking Companies Ordinance,
1962, the Companies Act, 2017 and the said directives shall prevail.
- International Accounting Standard (IAS) 34, Interim Financial Reporting, issued by the International Accounting
Standards Board (IASB) as notified under the Companies Act, 2017;
3.1 Standards, interpretations of and amendments to accounting and reporting standards that are effective in the
current period
There are certain amendments to existing accounting and reporting standards that have become applicable to the Bank for
accounting periods beginning on or after January 01, 2021. These are either considered to be not relevant or do not have any
significant impact on these consolidated condensed interim financial statements.
- Provisions of and directives issued under the Banking Companies Ordinance, 1962 and the Companies Act, 2017; and
2.1.2 The SBP vide BSD Circular letter No.10, dated August 26, 2002 has deferred the applicability of International Accounting
Standard 39, Financial Instruments (IAS 39): Recognition and Measurement and International Accounting Standard 40,
Investment Property for banking companies till further instructions. Moreover, SBP vide BPRD circular No.4, dated February
25, 2015 has deferred the applicability of Islamic Financial Accounting Standards IFAS 3, Profit and Loss Sharing on Deposits.
Further, according to the notification of the SECP issued vide SRO 411(I) /2008 dated April 28, 2008, International Financial
Reporting Standard IFRS 7, Financial Instruments: Disclosures has not been made applicable for banks. Accordingly, the
requirements of these standards have not been considered in the preparation of these consolidated condensed interim
financial statements. However, investments have been classified and valued in accordance with the requirements of various
circulars issued by the SBP.
As per the SBP's BPRD Circular Letter no. 24 dated July 05, 2021, the implementation of IFRS 9 to banks in Pakistan has
been deferred to accounting periods beginning on or after January 01, 2022. Meanwhile, banks are required to submit IFRS 9
compatible pro forma financial statements for the year ending December 31, 2021 and perform parallel run of IFRS 9 on
quarterly basis. Further, the SBP will provide a timeline by December 2021 for absorption of "Expected Credit Loss" (ECL), for
Capital Adequacy Ratio (CAR) purposes, after assessment / evaluation of pro forma financial statements. Currently, the Bank
is in the process of assessing the impact of application of IFRS 9 on the Bank's financial statements on the basis of draft
guidelines issued by the State Bank of Pakistan.
2.1 STATEMENT OF COMPLIANCE
3. Application of new and revised International Financial Reporting Standards (IFRSs)
2.1.4 The disclosures made in these consolidated condensed interim financial statements have been limited based on the format
prescribed by the SBP vide BPRD Circular No. 5, dated March 22, 2019 and International Accounting Standard IAS 34,
'Interim Financial Reporting' and do not include all the information required in the annual financial statements. Accordingly,
these consolidated condensed interim financial statements should be read in conjunction with the annual financial statements
of the Group for the year ended December 31, 2020.
2.1.3 The SECP vide SRO 56 (1) / 2016 dated January 28, 2016, has notified that the requirements of IFRS 10 (Consolidated
Financial Statements) and section 228 of the Companies Act, 2017 will not be applicable with respect to the investment in
mutual funds established under Trust structure.
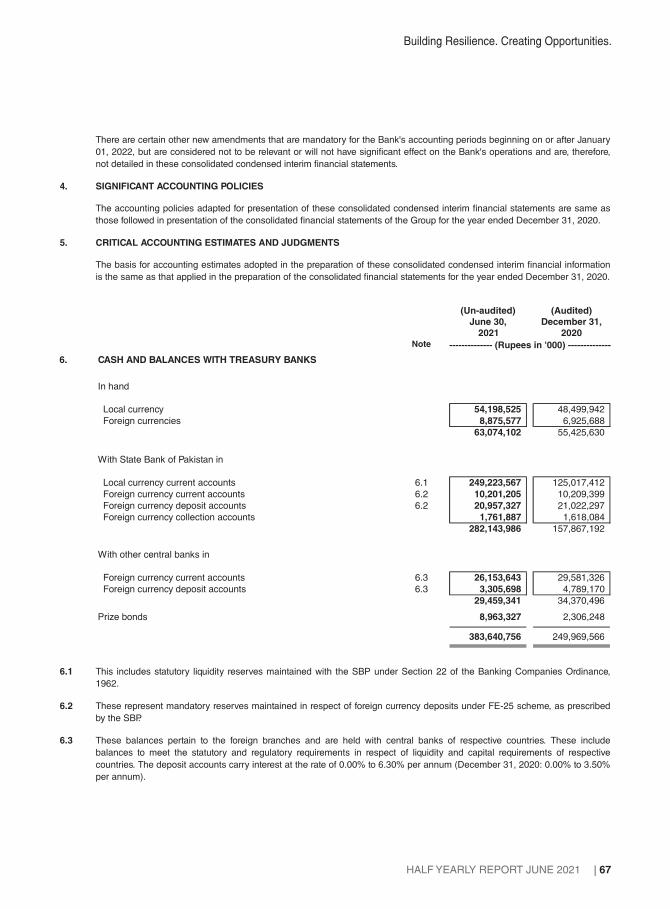
Building Resilience. Creating Opportunities.
HALF YEARLY REPORT JUNE 2021 67
There are certain other new amendments that are mandatory for the Bank's accounting periods beginning on or after January
01, 2022, but are considered not to be relevant or will not have significant effect on the Bank's operations and are, therefore,
not detailed in these consolidated condensed interim financial statements.
The basis for accounting estimates adopted in the preparation of these consolidated condensed interim financial information
is the same as that applied in the preparation of the consolidated financial statements for the year ended December 31, 2020.
4. SIGNIFICANT ACCOUNTING POLICIES
The accounting policies adapted for presentation of these consolidated condensed interim financial statements are same as
those followed in presentation of the consolidated financial statements of the Group for the year ended December 31, 2020.
5. CRITICAL ACCOUNTING ESTIMATES AND JUDGMENTS
6. CASH AND BALANCES WITH TREASURY BANKS
In hand
Local currency 54,198,525 48,499,942
Foreign currencies 8,875,577 6,925,688
63,074,102 55,425,630
With State Bank of Pakistan in
Local currency current accounts 6.1 249,223,567 125,017,412
Foreign currency current accounts 6.2 10,201,205 10,209,399
Foreign currency deposit accounts 6.2 20,957,327 21,022,297
Foreign currency collection accounts 1,761,887 1,618,084
282,143,986 157,867,192
With other central banks in
Foreign currency current accounts 6.3 26,153,643 29,581,326
Foreign currency deposit accounts 6.3 3,305,698 4,789,170
29,459,341 34,370,496
Prize bonds 8,963,327 2,306,248
383,640,756 249,969,566
(Un-audited)
June 30,
2021
(Audited)
December 31,
2020Note -------------- (Rupees in '000) --------------
6.1 This includes statutory liquidity reserves maintained with the SBP under Section 22 of the Banking Companies Ordinance,
1962.
6.3 These balances pertain to the foreign branches and are held with central banks of respective countries. These include
balances to meet the statutory and regulatory requirements in respect of liquidity and capital requirements of respective
countries. The deposit accounts carry interest at the rate of 0.00% to 6.30% per annum (December 31, 2020: 0.00% to 3.50%
per annum).
6.2 These represent mandatory reserves maintained in respect of foreign currency deposits under FE-25 scheme, as prescribed
by the SBP.

HALF YEARLY REPORT JUNE 2021
National Bank of Pakistan
68
7. BALANCES WITH OTHER BANKS
In Pakistan
In current accounts 97,912 33,502
In deposit accounts 7.1 396,079 394,071
493,991 427,573
Outside Pakistan
In current accounts 11,080,548 8,708,983
In deposit accounts 7.2 7,350,519 5,878,810
18,431,067 14,587,793
18,925,058 15,015,366
(Un-audited)
June 30,
2021
(Audited)
December 31,
2020Note -------------- (Rupees in '000) --------------
7.1 These include various deposits with banks and carry interest at rates ranging from 2.0% to 7.0% per annum (December 31,
2020: 2.0% to 8.0% per annum).
7.2 These include various deposits with correspondent banks outside Pakistan and carry interest at rates ranging from 0% to
1.9% per annum (December 31, 2020: 0.0% to 2.5% per annum).
(Un-audited)
June 30,
2021
(Audited)
December 31,
2020Note -------------- (Rupees in '000) --------------
8. LENDINGS TO FINANCIAL INSTITUTIONS
Call / clean money lendings 8.1 2,009,723 2,040,800
Repurchase agreement lendings (Reverse Repo) 8.2 178,780,985 124,763,875
Letters of placement 8.3 174,150 176,150
8.4 180,964,858 126,980,825
Less: provision held against lendings to financial institutions 8.5 (174,150) (176,150)
Lendings to financial institutions - net of provision 180,790,708 126,804,675
8.1 This includes zero rate lending to a financial institution amounting to Rs. 9.7 million (December 31, 2020: Rs. 40.8 million)
which is guaranteed by the SBP.
8.2 These carry mark-up at rates ranging from 7.00% to 7.80% per annum (December 31, 2020: 6.00% to 7.29% per annum)
with maturities ranging from July 02, 2021 to July 15, 2021.
8.3 These are overdue placements and full provision has been made against these placements as at June 30, 2021.
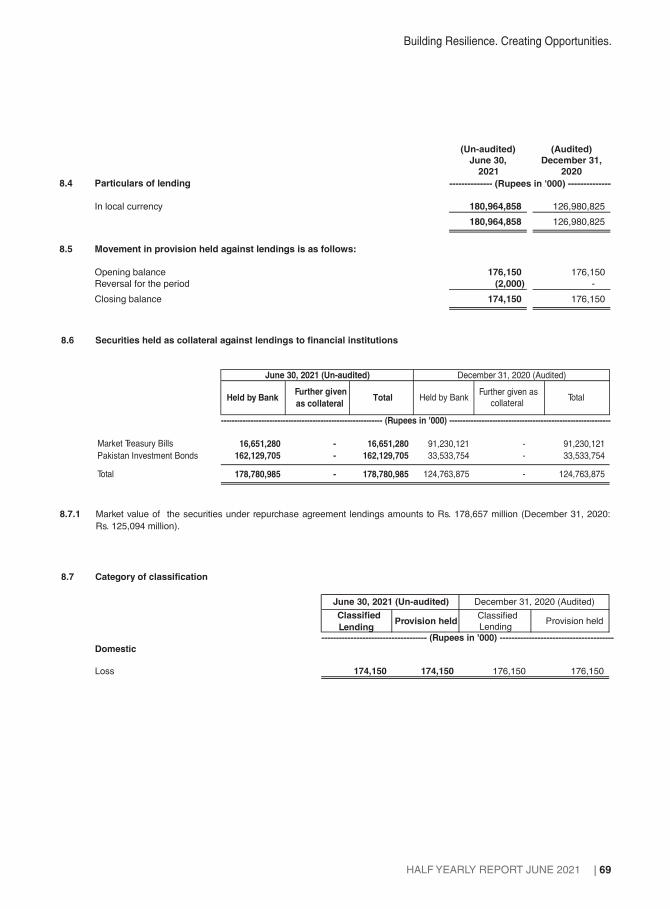
Building Resilience. Creating Opportunities.
HALF YEARLY REPORT JUNE 2021 69
8.6 Securities held as collateral against lendings to financial institutions
Market Treasury Bills 16,651,280 - 16,651,280 91,230,121 - 91,230,121
Pakistan Investment Bonds 162,129,705 - 162,129,705 33,533,754 - 33,533,754
Total 178,780,985 - 178,780,985 124,763,875 - 124,763,875
8.7 Category of classification
Classified
LendingProvision held
Classified
LendingProvision held
Domestic
Loss 174,150 174,150 176,150 176,150
Held by BankFurther given
as collateralTotal Held by Bank
Further given as
collateralTotal
June 30, 2021 (Un-audited) December 31, 2020 (Audited)
June 30, 2021 (Un-audited) December 31, 2020 (Audited)
------------------------------------------------------------ (Rupees in '000) ------------------------------------------------------------
------------------------------------ (Rupees in '000) ---------------------------------------
(Un-audited)
June 30,
2021
(Audited)
December 31,
2020
-------------- (Rupees in '000) --------------8.4 Particulars of lending
In local currency 180,964,858 126,980,825
180,964,858 126,980,825
8.5 Movement in provision held against lendings is as follows:
Opening balance 176,150 176,150
Reversal for the period (2,000) -
Closing balance 174,150 176,150
8.7.1 Market value of the securities under repurchase agreement lendings amounts to Rs. 178,657 million (December 31, 2020:
Rs. 125,094 million).
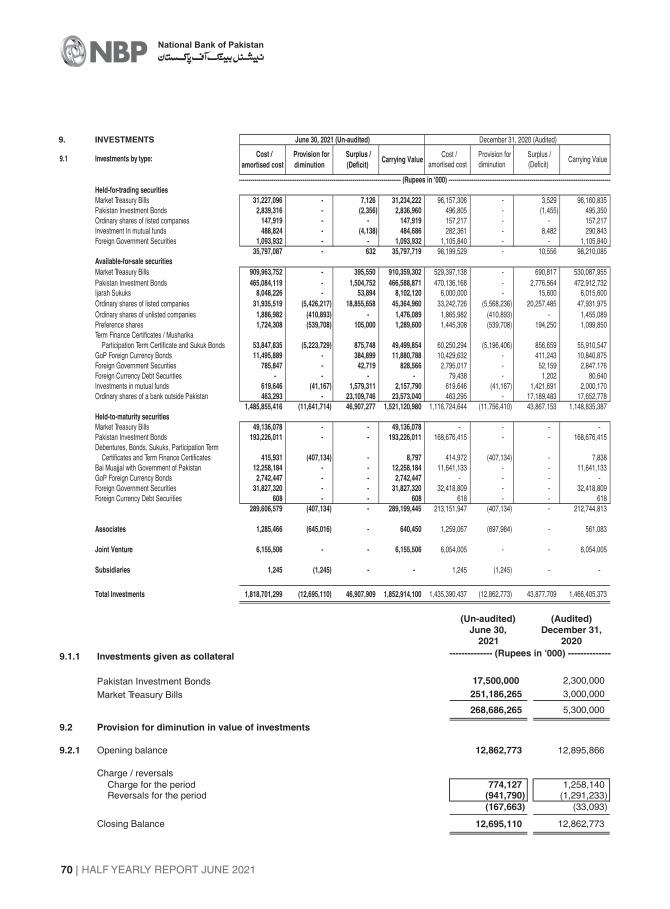
HALF YEARLY REPORT JUNE 2021
National Bank of Pakistan
70
9. INVESTMENTS
9.1 Investments by type:
Held-for-trading securities
Market Treasury Bills 31,227,096 - 7,126 31,234,222 96,157,306 - 3,529 96,160,835
Pakistan Investment Bonds 2,839,316 - (2,356) 2,836,960 496,805 - (1,455) 495,350
Ordinary shares of listed companies 147,919 - - 147,919 157,217 - - 157,217
Investment In mutual funds 488,824 - (4,138) 484,686 282,361 - 8,482 290,843
Foreign Government Securities 1,093,932 - - 1,093,932 1,105,840 - - 1,105,840
35,797,087 - 632 35,797,719 98,199,529 - 10,556 98,210,085Available-for-sale securities
Market Treasury Bills 909,963,752 - 395,550 910,359,302 529,397,138 - 690,817 530,087,955
Pakistan Investment Bonds 465,084,119 - 1,504,752 466,588,871 470,136,168 - 2,776,564 472,912,732
Ijarah Sukuks 8,048,226 - 53,894 8,102,120 6,000,000 - 15,600 6,015,600
Ordinary shares of listed companies 31,935,519 (5,426,217) 18,855,658 45,364,960 33,242,726 (5,568,236) 20,257,485 47,931,975
Ordinary shares of unlisted companies 1,886,982 (410,893) - 1,476,089 1,865,982 (410,893) - 1,455,089
Preference shares 1,724,308 (539,708) 105,000 1,289,600 1,445,308 (539,708) 194,250 1,099,850
Term Finance Certificates / Musharika
Participation Term Certificate and Sukuk Bonds 53,847,835 (5,223,729) 875,748 49,499,854 60,250,294 (5,196,406) 856,659 55,910,547
GoP Foreign Currency Bonds 11,495,889 - 384,899 11,880,788 10,429,632 - 411,243 10,840,875
Foreign Government Securities 785,847 - 42,719 828,566 2,795,017 - 52,159 2,847,176
Foreign Currency Debt Securities - - - - 79,438 - 1,202 80,640
Investments in mutual funds 619,646 (41,167) 1,579,311 2,157,790 619,646 (41,167) 1,421,691 2,000,170
Ordinary shares of a bank outside Pakistan 463,293 - 23,109,746 23,573,040 463,295 - 17,189,483 17,652,778
1,485,855,416 (11,641,714) 46,907,277 1,521,120,980 1,116,724,644 (11,756,410) 43,867,153 1,148,835,387
Held-to-maturity securities
Market Treasury Bills 49,136,078 - - 49,136,078 - - - -
Pakistan Investment Bonds 193,226,011 - - 193,226,011 168,676,415 - - 168,676,415
Debentures, Bonds, Sukuks, Participation Term
Certificates and Term Finance Certificates 415,931 (407,134) - 8,797 414,972 (407,134) - 7,838
Bai Muajjal with Government of Pakistan 12,258,184 - - 12,258,184 11,641,133 - - 11,641,133
GoP Foreign Currency Bonds 2,742,447 - - 2,742,447 - - - -
Foreign Government Securities 31,827,320 - - 31,827,320 32,418,809 - - 32,418,809
Foreign Currency Debt Securities 608 - - 608 618 - - 618
289,606,579 (407,134) - 289,199,445 213,151,947 (407,134) - 212,744,813
Associates 1,285,466 (645,016) - 640,450 1,259,067 (697,984) - 561,083
Joint Venture 6,155,506 - - 6,155,506 6,054,005 - - 6,054,005
Subsidiaries 1,245 (1,245) - - 1,245 (1,245) - -
Total Investments 1,818,701,299 (12,695,110) 46,907,909 1,852,914,100 1,435,390,437 (12,862,773) 43,877,709 1,466,405,373
June 30, 2021 (Un-audited)
Provision for
diminution
Surplus /
(Deficit)Carrying Value
Cost /
amortised cost
Surplus /
(Deficit)Carrying Value
Cost /
amortised cost
Provision for
diminution
December 31, 2020 (Audited)
------------------------------------------------------------------------------------ (Rupees in '000) ------------------------------------------------------------------------------------
9.1.1 Investments given as collateral
Pakistan Investment Bonds 17,500,000 2,300,000
Market Treasury Bills 251,186,265 3,000,000
268,686,265 5,300,000
9.2 Provision for diminution in value of investments
9.2.1 Opening balance 12,862,773 12,895,866
Charge / reversals
Charge for the period 774,127 1,258,140Reversals for the period (941,790) (1,291,233)
(167,663) (33,093)
Closing Balance 12,695,110 12,862,773
(Un-audited)
June 30,
2021
(Audited)
December 31,
2020
-------------- (Rupees in '000) --------------

Building Resilience. Creating Opportunities.
HALF YEARLY REPORT JUNE 2021 71
9.2.2 Particulars of provision against debt securities
Category of classification
NPI Provision NPI Provision
Domestic
Doubtful - - 119,133 59,567
Loss 5,639,627 5,630,863 5,552,738 5,543,9735,639,627 5,630,863 5,671,871 5,603,540
June 30, 2021 (Un-audited) December 31, 2020 (Audited)
------------------------------------- (Rupees in '000) ------------------------------------
9.3 The market value of securities classified as held-to-maturity as at June 30, 2021 amounted to Rs. 295,667 million (December
31, 2020: Rs. 218,678 million).
10. ADVANCES
Note
Loans, cash credits, running finances, etc. 931,001,600 932,517,097 171,325,850 160,534,747 1,102,327,451 1,093,051,844
Islamic financing and related assets 37,290,296 37,546,863 602,837 602,913 37,893,133 38,149,776
Net Investment in finance lease 10.1 52,894 58,239 28,944 28,944 81,838 87,183
Bills discounted and purchased 26,987,853 18,998,127 12,945,291 10,646,008 39,933,144 29,644,135
Advances - gross 10.2 995,332,643 989,120,326 184,902,922 171,812,612 1,180,235,566 1,160,932,938
Provision against advances
- Specific - - 163,190,843 154,587,769 163,190,843 154,587,769
- General 20,022,147 22,473,748 - - 20,022,147 22,473,748
10.4 20,022,147 22,473,748 163,190,843 154,587,769 183,212,990 177,061,517
Advances - net of provision 975,310,496 966,646,578 21,712,079 17,224,843 997,022,576 983,871,421
Performing Non Performing Total
(Audited)
December 31,
2020
(Un-audited)
June 30,
2021
(Audited)
December 31,
2020
(Un-audited)
June 30,
2021
(Audited)
December 31,
2020
(Un-audited)
June 30,
2021
--------------------------------------------------- (Rupees in '000) --------------------------------------------------
10.1 Net Investment in Finance Lease
Lease rentals receivable 56,407 242 - 56,650 61,751 556 - 62,307
Residual value 49,434 185 - 49,619 48,804 815 - 49,619
Minimum lease payments 105,841 427 - 106,268 110,555 1,371 - 111,926
Financial charges for future periods 24,430 - - 24,430 24,710 32 - 24,743
Present value of minimum lease payments 81,411 427 - 81,838 85,845 1,339 - 87,183
June 30, 2021 (Un-audited) December 31, 2020 (Audited)
Not later than
one year
Later than one
and less than
five years
TotalNot later than
one year
Later than one
and less than
five years
Over fiveyears
Total
-------------------------------------------------------------------- (Rupees in '000) ----------------------------------------------------------------
Over fiveyears
The leases executed are for a term of 1 to 5 years. Security deposit is generally obtained upto 10% of the cost of leased
assets at the time of disbursement. The Group requires the lessee to insure the leased assets in favour of the Group.
Additional surcharge is charged on delayed rentals. The average return implicit ranges from 10.19% to 14.85% (December 31,
2020: 10.19% to 17.30%) per annum.
10.2 Particulars of advances (Gross)
In local currency 1,097,835,875 1,071,981,593
In foreign currencies 82,399,691 88,951,345
1,180,235,566 1,160,932,938
(Un-audited)
June 30,
2021
(Audited)
December 31,
2020
-------------- (Rupees in '000) --------------

HALF YEARLY REPORT JUNE 2021
National Bank of Pakistan
72
10.3 Advances include Rs. 184,903 million (2020: Rs. 171,813 million) which have been placed under non-performing status as
detailed below:
Category of Classification
Non
Performing
Loans
Provision
Non
Loans
Performing Provision
Domestic
Other Assets Especially Mentioned 1,719,511 89,161 1,626,950 45,392
Substandard 9,389,649 2,289,712 5,418,693 1,336,002
Doubtful 18,492,260 9,215,839 15,816,861 7,881,223
Loss 113,538,960 111,093,980 106,261,071 103,917,273
143,140,381 122,688,692 129,123,575 113,179,889
Overseas
Not past due but impaired - - - -
Overdue by:
Upto 90 days - - 11,666 9,183
91 to 180 days 734 691 - -
181 to 365 days - - - -
> 365 days 41,761,807 40,501,459 42,677,371 41,398,697
41,762,541 40,502,151 42,689,037 41,407,880
Total 184,902,922 163,190,843 171,812,612 154,587,769
10.4 Particulars of provision against advances
Specific General Total Specific General Total
Note
Opening balance 154,587,769 22,473,748 177,061,517 134,688,966 9,005,951 143,694,917
Exchange adjustments (731,649) (5,687) (737,336) 1,462,567 15,535 1,478,102
Charge for the period / year 3,959,695 5,446,914 9,406,609 19,001,917 13,707,207 32,709,124
Reversals (2,109,733) (232,870) (2,342,603) (3,138,355) (321,795) (3,460,150)
1,849,962 5,214,044 7,064,006 15,863,562 13,385,412 29,248,974
Amounts written off (118,247) - (118,247) (89,494) - (89,494)
Amounts charged off -
agriculture financing 10.4.4 (56,950) - (56,950) (193,807) - (193,807)
Transfer 7,659,958 (7,659,958) - - - -
Transfer from other assets - - - 2,855,975 66,850 2,922,825
Closing balance 163,190,843 20,022,147 183,212,990 154,587,769 22,473,748 177,061,517
December 31, 2020 (Audited)June 30, 2021 (Un-audited)
--------------------------------- -- (Rupees in '000) ----------------------------------
June 30, 2021 (Un-audited) December 31, 2020 (Audited)
------------------------------------------------------ (Rupees in '000) ----------------------------------------------------

Building Resilience. Creating Opportunities.
HALF YEARLY REPORT JUNE 2021 73
10.4.1 Particulars of provision against advances
Specific General Total Specific General Total
In local currency 122,688,692 19,750,492 142,439,184 113,179,889 22,274,089 135,453,978
In foreign currencies 40,502,151 271,655 40,773,806 41,407,880 199,659 41,607,539
163,190,843 20,022,147 183,212,990 154,587,769 22,473,748 177,061,517
June 30, 2021 (Un-audited) December 31, 2020 (Audited)
------------------------------------------------------ (Rupees in '000) ----------------------------------------------------
10.4.2 The Group maintains general reserve in accordance with the applicable requirements of the Prudential Regulations for
Consumer Financing and Prudential Regulations for Small and Medium Enterprise Financing issued by the SBP.
10.4.3 The SBP has allowed specific relaxation to the Bank for non-classification of overdue loans of certain Public Sector Entities
(PSEs) which are guaranteed by Government of Pakistan as non-performing loans up till December 31, 2021.
10.4.4 These represent non-performing advances for agriculture finance which have been classified as loss and fully provided for
more than 3 years. These non-performing advances have been charged off by extinguishing them against the provision held in
accordance with Prudential Regulations for Agriculture Financing issued by the SBP. This charge off does not, in any way,
prejudice the Bank's right of recovery from these customers.
The Group has also maintained general provision of Rs. 14,201 million (December 31, 2020: Rs. 17,078 million) in respect of
its underperforming portfolio on prudent basis.
10.4.5 State Bank of Pakistan (‘SBP’), vide its BPRD circular letter No. 13 of 2020, has provided regulatory relief to dampen the
effects of Covid-19 and allowed banks to offer deferral of principal component of installments to its borrowers for one year,
provided that the borrower will continue to service the mark-up amount as per agreed terms & conditions.
As at June 30, 2021, 77 (December 31, 2020: 77) corporate borrowers, having aggregate outstanding exposure of Rs. 33,328
million (December 31, 2020: 145,851), have availed regulatory relief extended by SBP amounted to Rs. 23,830 million
(December 31, 2020: Rs. 27,357 million).
11. FIXED ASSETS
Capital work-in-progress 11.1 2,362,056 2,232,001
Property and equipment 52,435,238 52,854,808
54,797,294 55,086,809
11.1 Capital work-in-progress
Civil works 2,137,505 2,040,456
Equipment 10,825 10,825
Advances to suppliers and contractors 59,468 59,000
Software implementation in progress 154,258 121,720
2,362,056 2,232,001
(Un-audited)
June 30,
2021
(Audited)
December 31,
2020Note -------------- (Rupees in '000) --------------
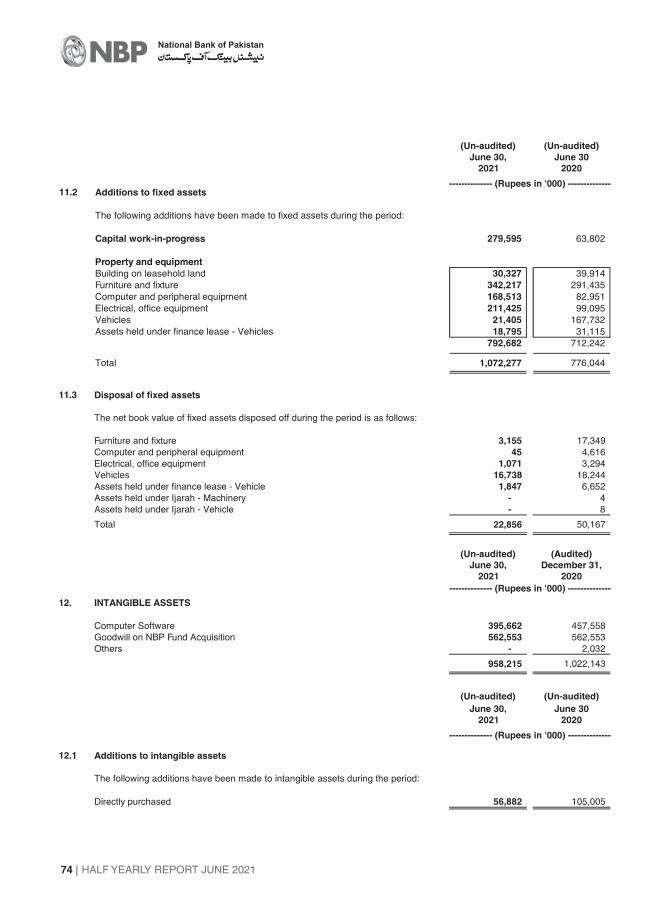
HALF YEARLY REPORT JUNE 2021
National Bank of Pakistan
74
11.2 Additions to fixed assets
The following additions have been made to fixed assets during the period:
Capital work-in-progress 279,595 63,802
Property and equipment
Building on leasehold land 30,327 39,914
Furniture and fixture 342,217 291,435
Computer and peripheral equipment 168,513 82,951
Electrical, office equipment 211,425 99,095
Vehicles 21,405 167,732
Assets held under finance lease - Vehicles 18,795 31,115
792,682 712,242
Total 1,072,277 776,044
June 30,
2021
June 30
2020
-------------- (Rupees in '000) --------------
(Un-audited) (Un-audited)
11.3 Disposal of fixed assets
The net book value of fixed assets disposed off during the period is as follows:
Furniture and fixture 3,155 17,349
Computer and peripheral equipment 45 4,616
Electrical, office equipment 1,071 3,294
Vehicles 16,738 18,244
Assets held under finance lease - Vehicle 1,847 6,652
Assets held under Ijarah - Machinery - 4
Assets held under Ijarah - Vehicle - 8
Total 22,856 50,167
12. INTANGIBLE ASSETS
Computer Software 395,662 457,558
Goodwill on NBP Fund Acquisition 562,553 562,553
Others - 2,032
958,215 1,022,143
12.1 Additions to intangible assets
The following additions have been made to intangible assets during the period:
Directly purchased 56,882 105,005
(Un-audited)
June 30,
2021
(Audited)
December 31,
2020
-------------- (Rupees in '000) --------------
June 30,
2021
June 30
2020
-------------- (Rupees in '000) --------------
(Un-audited) (Un-audited)
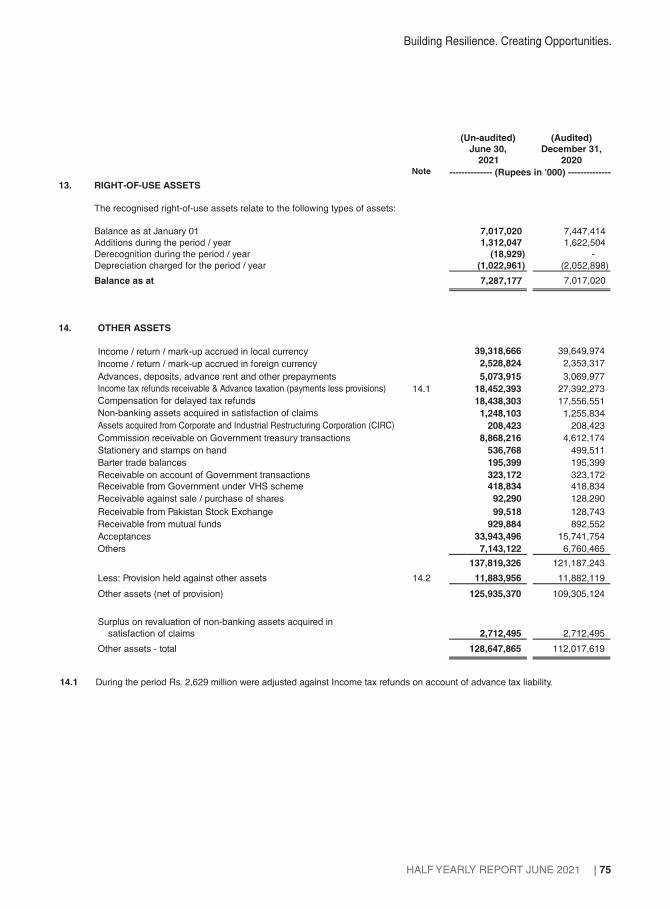
Building Resilience. Creating Opportunities.
HALF YEARLY REPORT JUNE 2021 75
(Un-audited)
June 30,
2021
(Audited)
December 31,
2020Note -------------- (Rupees in '000) --------------
13. RIGHT-OF-USE ASSETS
The recognised right-of-use assets relate to the following types of assets:
Balance as at January 01 7,017,020 7,447,414
Additions during the period / year 1,312,047 1,622,504
Derecognition during the period / year (18,929) -
Depreciation charged for the period / year (1,022,961) (2,052,898)
Balance as at 7,287,177 7,017,020
14. OTHER ASSETS
Income / return / mark-up accrued in local currency 39,318,666 39,649,974
Income / return / mark-up accrued in foreign currency 2,528,824 2,353,317
Advances, deposits, advance rent and other prepayments 5,073,915 3,069,977
Income tax refunds receivable & Advance taxation (payments less provisions) 14.1 18,452,393 27,392,273
Compensation for delayed tax refunds 18,438,303 17,556,551
Non-banking assets acquired in satisfaction of claims 1,248,103 1,255,834
Assets acquired from Corporate and Industrial Restructuring Corporation (CIRC) 208,423 208,423
Commission receivable on Government treasury transactions 8,868,216 4,612,174
Stationery and stamps on hand 536,768 499,511
Barter trade balances 195,399 195,399
Receivable on account of Government transactions 323,172 323,172
Receivable from Government under VHS scheme 418,834 418,834
Receivable against sale / purchase of shares 92,290 128,290
Receivable from Pakistan Stock Exchange 99,518 128,743
Receivable from mutual funds 929,884 892,552
Acceptances 33,943,496 15,741,754
Others 7,143,122 6,760,465
137,819,326 121,187,243
Less: Provision held against other assets 14.2 11,883,956 11,882,119
Other assets (net of provision) 125,935,370 109,305,124
Surplus on revaluation of non-banking assets acquired in
satisfaction of claims 2,712,495 2,712,495
Other assets - total 128,647,865 112,017,619
14.1 During the period Rs. 2,629 million were adjusted against Income tax refunds on account of advance tax liability.

HALF YEARLY REPORT JUNE 2021
National Bank of Pakistan
76
(Un-audited)
June 30,
2021
(Audited)
December 31,
2020
-------------- (Rupees in '000) --------------
14.1.1 Movement in provision held against other assets
Opening balance 11,882,119 10,853,588
Charge for the year / period 20,847 1,511,502
Transfer (out) / in - (484,393)
Adjustment against provision (19,010) 1,422
Closing balance 11,883,956 11,882,119
15. BILLS PAYABLE
In Pakistan 22,230,991 16,718,064
Outside Pakistan 34,487 77,122
22,265,478 16,795,186
16. BORROWINGS
Secured
Borrowings from State Bank of Pakistan
Under Export Refinance Scheme 6,101,982 2,451,874
Under Export Refinance Scheme (New Scheme) 25,416,900 28,686,149
Financing Scheme for Renewable Energy 780,721 481,261
Refinance Facility for Modernization of SMEs - 177,976
Financing Facility for storage of Agriculture Produce (FFSAP) 638,890 256,184
Under Long-Term Financing Facility (LTFF) 17,317,119 16,380,117
Refinance Scheme for Payment of Wages and Salaries 915,173 1,167,527
Temporary Economic Refinance Facility 6,228,564 537,912
Refinance Facility for Combating Covid-19 54,620 61,448
57,453,969 50,200,448
Repurchase agreement borrowings 268,686,264 5,266,007
Bai Muajjal 94,714,002 79,788,522
420,854,235 135,254,977
Unsecured
Call borrowings 18,865,920 2,047,588
Overdrawn nostro accounts 2,536,363 1,236,440
21,402,283 3,284,028
442,256,518 138,539,005
14.2 Provision held against other assets
Income / mark-up accrued in local currency 152,607 152,607
Advances, deposits, advance rent and other prepayments 837,949 837,949
Stationery and stamps on hand 96,542 96,542
Barter trade balances 195,399 195,399
Receivable on account of Government transactions 323,172 323,172
Receivable from Government under VHS scheme 418,834 418,834
Protested bills 4,114,470 4,092,280
Ex-MBL / NDFC - other assets 770,398 770,398
Assets Acquired from corporate and industrial restructuring corporation asset (CIRC). 208,423 208,423
Others 4,766,161 4,786,515
11,883,956 11,882,119
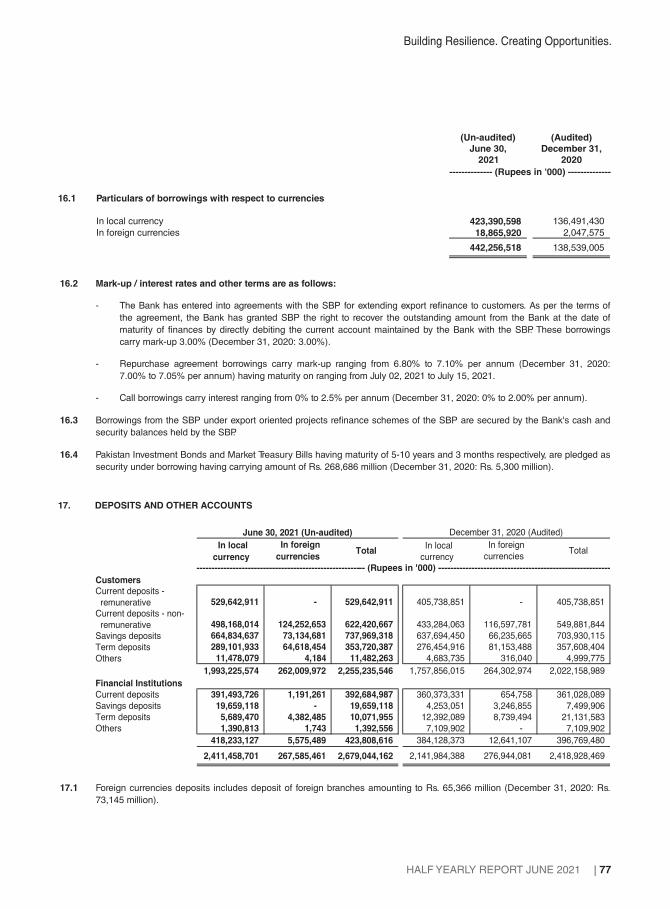
Building Resilience. Creating Opportunities.
HALF YEARLY REPORT JUNE 2021 77
(Un-audited)
June 30,
2021
(Audited)
December 31,
2020
-------------- (Rupees in '000) --------------
17. DEPOSITS AND OTHER ACCOUNTS
In local
currency
In foreign
currenciesTotal
In local
currency
In foreign
currenciesTotal
CustomersCurrent deposits -
remunerative 529,642,911 - 529,642,911 405,738,851 - 405,738,851
Current deposits - non-
remunerative 498,168,014 124,252,653 622,420,667 433,284,063 116,597,781 549,881,844
Savings deposits 664,834,637 73,134,681 737,969,318 637,694,450 66,235,665 703,930,115
Term deposits 289,101,933 64,618,454 353,720,387 276,454,916 81,153,488 357,608,404
Others 11,478,079 4,184 11,482,263 4,683,735 316,040 4,999,775
1,993,225,574 262,009,972 2,255,235,546 1,757,856,015 264,302,974 2,022,158,989
Financial Institutions
Current deposits 391,493,726 1,191,261 392,684,987 360,373,331 654,758 361,028,089
Savings deposits 19,659,118 - 19,659,118 4,253,051 3,246,855 7,499,906
Term deposits 5,689,470 4,382,485 10,071,955 12,392,089 8,739,494 21,131,583
Others 1,390,813 1,743 1,392,556 7,109,902 - 7,109,902
418,233,127 5,575,489 423,808,616 384,128,373 12,641,107 396,769,480
2,411,458,701 267,585,461 2,679,044,162 2,141,984,388 276,944,081 2,418,928,469
June 30, 2021 (Un-audited) December 31, 2020 (Audited)
-------------------------------------------------------- (Rupees in '000) ---------------------------------------------------------
16.1 Particulars of borrowings with respect to currencies
In local currency 423,390,598 136,491,430
In foreign currencies 18,865,920 2,047,575
442,256,518 138,539,005
- Call borrowings carry interest ranging from 0% to 2.5% per annum (December 31, 2020: 0% to 2.00% per annum).
16.2 Mark-up / interest rates and other terms are as follows:
- The Bank has entered into agreements with the SBP for extending export refinance to customers. As per the terms of
the agreement, the Bank has granted SBP the right to recover the outstanding amount from the Bank at the date of
maturity of finances by directly debiting the current account maintained by the Bank with the SBP. These borrowings
carry mark-up 3.00% (December 31, 2020: 3.00%).
- Repurchase agreement borrowings carry mark-up ranging from 6.80% to 7.10% per annum (December 31, 2020:
7.00% to 7.05% per annum) having maturity on ranging from July 02, 2021 to July 15, 2021.
16.3 Borrowings from the SBP under export oriented projects refinance schemes of the SBP are secured by the Bank's cash and
security balances held by the SBP.
16.4 Pakistan Investment Bonds and Market Treasury Bills having maturity of 5-10 years and 3 months respectively, are pledged as
security under borrowing having carrying amount of Rs. 268,686 million (December 31, 2020: Rs. 5,300 million).
17.1 Foreign currencies deposits includes deposit of foreign branches amounting to Rs. 65,366 million (December 31, 2020: Rs.
73,145 million).
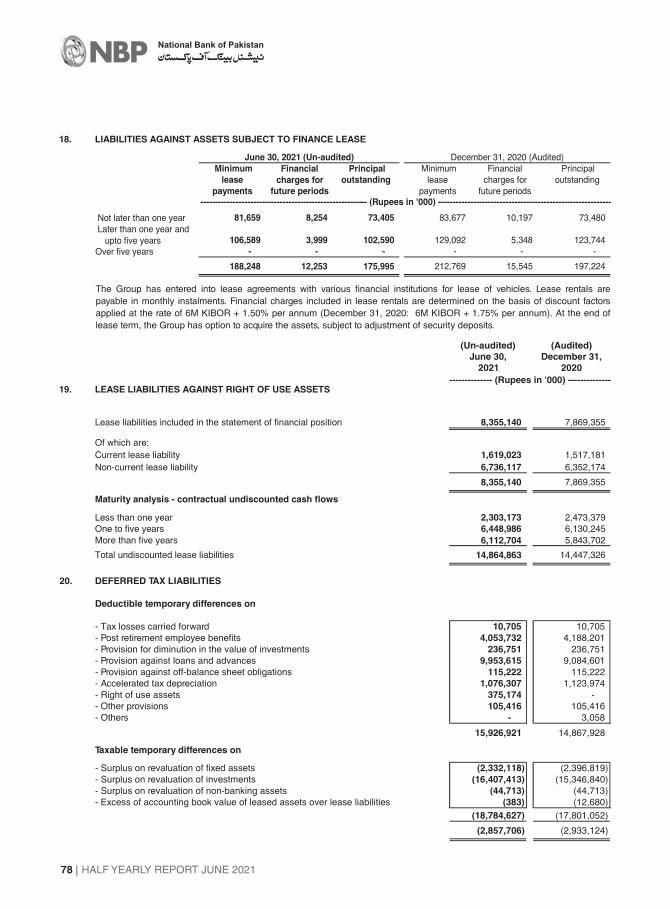
HALF YEARLY REPORT JUNE 2021
National Bank of Pakistan
78
18. LIABILITIES AGAINST ASSETS SUBJECT TO FINANCE LEASE
Minimum Financial Principal Minimum Financial Principal
lease charges for outstanding lease charges for outstanding
payments future periods payments future periods
Not later than one year 81,659 8,254 73,405 83,677 10,197 73,480
Later than one year and
upto five years 106,589 3,999 102,590 129,092 5,348 123,744
Over five years - - - - - -
188,248 12,253 175,995 212,769 15,545 197,224
--------------------------------------------------------- (Rupees in '000) -----------------------------------------------------------
June 30, 2021 (Un-audited) December 31, 2020 (Audited)
The Group has entered into lease agreements with various financial institutions for lease of vehicles. Lease rentals are
payable in monthly instalments. Financial charges included in lease rentals are determined on the basis of discount factors
applied at the rate of 6M KIBOR + 1.50% per annum (December 31, 2020: 6M KIBOR + 1.75% per annum). At the end of
lease term, the Group has option to acquire the assets, subject to adjustment of security deposits.
19. LEASE LIABILITIES AGAINST RIGHT OF USE ASSETS
Lease liabilities included in the statement of financial position 8,355,140 7,869,355
Of which are:
Current lease liability 1,619,023 1,517,181
Non-current lease liability 6,736,117 6,352,174
8,355,140 7,869,355
Maturity analysis - contractual undiscounted cash flows
Less than one year 2,303,173 2,473,379
One to five years 6,448,986 6,130,245
More than five years 6,112,704 5,843,702
Total undiscounted lease liabilities 14,864,863 14,447,326
(Un-audited)
June 30,
2021
(Audited)
December 31,
2020
-------------- (Rupees in '000) --------------
20. DEFERRED TAX LIABILITIES
Deductible temporary differences on
- Tax losses carried forward 10,705 10,705
- Post retirement employee benefits 4,053,732 4,188,201
- Provision for diminution in the value of investments 236,751 236,751
- Provision against loans and advances 9,953,615 9,084,601
- Provision against off-balance sheet obligations 115,222 115,222
- Accelerated tax depreciation 1,076,307 1,123,974
- Right of use assets 375,174 -
- Other provisions 105,416 105,416
- Others - 3,058
15,926,921 14,867,928
Taxable temporary differences on
- Surplus on revaluation of fixed assets (2,332,118) (2,396,819)
- Surplus on revaluation of investments (16,407,413) (15,346,840)
- Surplus on revaluation of non-banking assets (44,713) (44,713)
- Excess of accounting book value of leased assets over lease liabilities (383) (12,680)
(18,784,627) (17,801,052)
(2,857,706) (2,933,124)

Building Resilience. Creating Opportunities.
HALF YEARLY REPORT JUNE 2021 79
21. OTHER LIABILITIES
Mark-up / Return / Interest payable in local currency 38,258,276 37,808,884
Mark-up / Return / Interest payable in foreign currencies 823,639 844,452
Unearned commission and income on bills discounted 969,616 1,593,730
Accrued expenses 21.1 16,065,491 18,315,863
Advance payments 402,225 398,682
Acceptances 33,943,496 15,741,754
Unclaimed dividends 185,516 185,516
Unrealized loss on forward foreign exchange contracts 1,758,364 2,918,017
Unrealized loss on put option 306,339 306,339
Branch adjustment account 549,930 917,487
Employee benefits:
Pension fund 15,386,447 15,704,077
Post retirement medical benefits 23,231,252 22,282,747
Benevolent scheme 1,995,997 2,054,218
Gratuity scheme 3,188,910 2,956,827
Compensated absences 9,628,206 9,251,755
Staff welfare fund 371,257 371,257
Liabilities relating to Barter trade agreements 2,151,891 2,142,033
Provision against off-balance sheet obligations 627,494 627,494
Provision against contingencies 4,302,764 4,180,071
Payable to brokers 135,739 65,137
Payable to customers 283,908 301,585
PIBs short selling 7,668,582 3,237,676
Others 15,323,849 15,339,746
177,559,188 157,545,347
(Un-audited)
June 30,
2021
(Audited)
December 31,
2020Note -------------- (Rupees in '000) --------------
21.1 Litigation related to management trainee program
This has been explained in note 26.3.3.3 to the consolidated financial statement for the year ended December 31, 2020.
Subsequently, the Bank has entered into out of court settlements with many Non-MTO employees ('petitioners‘) and
accordingly compromise agreements ('the agreement‘), offering waiver of loans, increase in basic salaries and provision of
other allowances, were signed with those petitioners who have withdrawn their cases against the Bank. Such out of court
settlements were undertaken with the vast majority of the non petitioners in addition to the petitioners. The Bank is now in the
process of complying with court orders of the various High Courts where the cases have attained finality and is undertaking
payments to the petitioners (who did not avail the out of court settlement) as per the court orders. The management expects
that the issue of Non MTOs will be resolved to a large extent, by the end of 2021.
(Un-audited)
June 30,
2021
(Audited)
December 31,
2020Note -------------- (Rupees in '000) --------------22. SURPLUS ON REVALUATION OF ASSETS
Surplus / (deficit) on revaluation of
- Available for sale securities 9.1 46,907,277 43,867,153
- Fixed Assets 45,208,893 45,421,244
- Non-banking assets 2,757,207 2,757,207
- On securities of associates and joint venture (219,036) (269,430)94,654,341 91,776,174
Deferred tax on surplus / (deficit) on revaluation of:
- Available for sale securities (16,407,413) (15,346,840)
- Fixed Assets (2,332,118) (2,396,819)
- Non-banking assets (44,713) (44,713)
(18,784,244) (17,788,372)
75,870,096 73,987,802
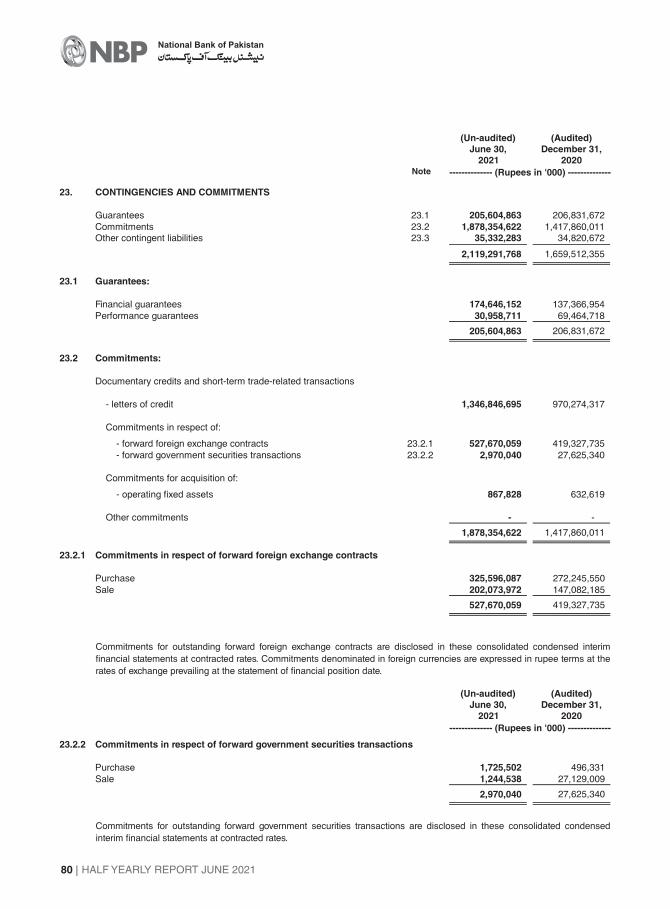
HALF YEARLY REPORT JUNE 2021
National Bank of Pakistan
80
23. CONTINGENCIES AND COMMITMENTS
Guarantees 23.1 205,604,863 206,831,672
Commitments 23.2 1,878,354,622 1,417,860,011Other contingent liabilities 23.3 35,332,283 34,820,672
2,119,291,768 1,659,512,355
23.1 Guarantees:
Financial guarantees 174,646,152 137,366,954
Performance guarantees 30,958,711 69,464,718
205,604,863 206,831,672
23.2 Commitments:
Documentary credits and short-term trade-related transactions
- letters of credit 1,346,846,695 970,274,317
Commitments in respect of:
- forward foreign exchange contracts 23.2.1 527,670,059 419,327,735
- forward government securities transactions 23.2.2 2,970,040 27,625,340
Commitments for acquisition of:
- operating fixed assets 867,828 632,619
Other commitments - -
1,878,354,622 1,417,860,011
(Un-audited)
June 30,
2021
(Audited)
December 31,
2020Note -------------- (Rupees in '000) --------------
23.2.1 Commitments in respect of forward foreign exchange contracts
Purchase 325,596,087 272,245,550
Sale 202,073,972 147,082,185
527,670,059 419,327,735
Commitments for outstanding forward foreign exchange contracts are disclosed in these consolidated condensed interim
financial statements at contracted rates. Commitments denominated in foreign currencies are expressed in rupee terms at the
rates of exchange prevailing at the statement of financial position date.
23.2.2 Commitments in respect of forward government securities transactions
Purchase 1,725,502 496,331
Sale 1,244,538 27,129,009
2,970,040 27,625,340
Commitments for outstanding forward government securities transactions are disclosed in these consolidated condensed
interim financial statements at contracted rates.
(Un-audited)
June 30,
2021
(Audited)
December 31,
2020
-------------- (Rupees in '000) --------------
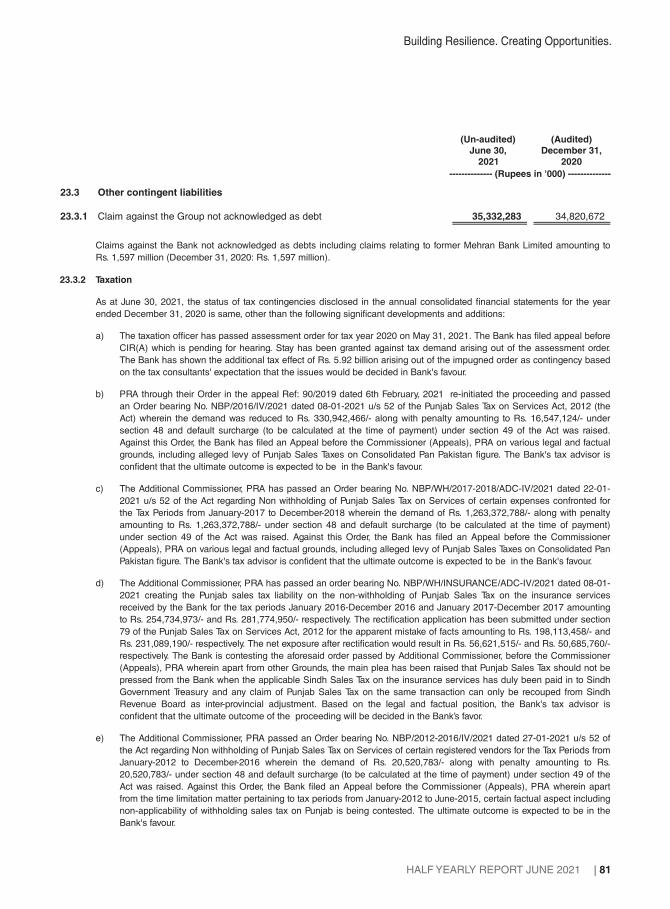
Building Resilience. Creating Opportunities.
HALF YEARLY REPORT JUNE 2021 81
23.3 Other contingent liabilities
23.3.1 Claim against the Group not acknowledged as debt 35,332,283 34,820,672
(Un-audited)
June 30,
2021
(Audited)
December 31,
2020
-------------- (Rupees in '000) --------------
Claims against the Bank not acknowledged as debts including claims relating to former Mehran Bank Limited amounting to
Rs. 1,597 million (December 31, 2020: Rs. 1,597 million).
23.3.2 Taxation
As at June 30, 2021, the status of tax contingencies disclosed in the annual consolidated financial statements for the year
ended December 31, 2020 is same, other than the following significant developments and additions:
b) PRA through their Order in the appeal Ref: 90/2019 dated 6th February, 2021 re-initiated the proceeding and passed
an Order bearing No. NBP/2016/IV/2021 dated 08-01-2021 u/s 52 of the Punjab Sales Tax on Services Act, 2012 (the
Act) wherein the demand was reduced to Rs. 330,942,466/- along with penalty amounting to Rs. 16,547,124/- under
section 48 and default surcharge (to be calculated at the time of payment) under section 49 of the Act was raised.
Against this Order, the Bank has filed an Appeal before the Commissioner (Appeals), PRA on various legal and factual
grounds, including alleged levy of Punjab Sales Taxes on Consolidated Pan Pakistan figure. The Bank's tax advisor is
confident that the ultimate outcome is expected to be in the Bank's favour.
e) The Additional Commissioner, PRA passed an Order bearing No. NBP/2012-2016/IV/2021 dated 27-01-2021 u/s 52 of
the Act regarding Non withholding of Punjab Sales Tax on Services of certain registered vendors for the Tax Periods from
January-2012 to December-2016 wherein the demand of Rs. 20,520,783/- along with penalty amounting to Rs.
20,520,783/- under section 48 and default surcharge (to be calculated at the time of payment) under section 49 of the
Act was raised. Against this Order, the Bank filed an Appeal before the Commissioner (Appeals), PRA wherein apart
from the time limitation matter pertaining to tax periods from January-2012 to June-2015, certain factual aspect including
non-applicability of withholding sales tax on Punjab is being contested. The ultimate outcome is expected to be in the
Bank's favour.
a) The taxation officer has passed assessment order for tax year 2020 on May 31, 2021. The Bank has filed appeal before
CIR(A) which is pending for hearing. Stay has been granted against tax demand arising out of the assessment order.
The Bank has shown the additional tax effect of Rs. 5.92 billion arising out of the impugned order as contingency based
on the tax consultants' expectation that the issues would be decided in Bank's favour.
c) The Additional Commissioner, PRA has passed an Order bearing No. NBP/WH/2017-2018/ADC-IV/2021 dated 22-01-
2021 u/s 52 of the Act regarding Non withholding of Punjab Sales Tax on Services of certain expenses confronted for
the Tax Periods from January-2017 to December-2018 wherein the demand of Rs. 1,263,372,788/- along with penalty
amounting to Rs. 1,263,372,788/- under section 48 and default surcharge (to be calculated at the time of payment)
under section 49 of the Act was raised. Against this Order, the Bank has filed an Appeal before the Commissioner
(Appeals), PRA on various legal and factual grounds, including alleged levy of Punjab Sales Taxes on Consolidated Pan
Pakistan figure. The Bank's tax advisor is confident that the ultimate outcome is expected to be in the Bank's favour.
d) The Additional Commissioner, PRA has passed an order bearing No. NBP/WH/INSURANCE/ADC-IV/2021 dated 08-01-
2021 creating the Punjab sales tax liability on the non-withholding of Punjab Sales Tax on the insurance services
received by the Bank for the tax periods January 2016-December 2016 and January 2017-December 2017 amounting
to Rs. 254,734,973/- and Rs. 281,774,950/- respectively. The rectification application has been submitted under section
79 of the Punjab Sales Tax on Services Act, 2012 for the apparent mistake of facts amounting to Rs. 198,113,458/- and
Rs. 231,089,190/- respectively. The net exposure after rectification would result in Rs. 56,621,515/- and Rs. 50,685,760/-
respectively. The Bank is contesting the aforesaid order passed by Additional Commissioner, before the Commissioner
(Appeals), PRA wherein apart from other Grounds, the main plea has been raised that Punjab Sales Tax should not be
pressed from the Bank when the applicable Sindh Sales Tax on the insurance services has duly been paid in to Sindh
Government Treasury and any claim of Punjab Sales Tax on the same transaction can only be recouped from Sindh
Revenue Board as inter-provincial adjustment. Based on the legal and factual position, the Bank's tax advisor is
confident that the ultimate outcome of the proceeding will be decided in the Bank’s favor.

HALF YEARLY REPORT JUNE 2021
National Bank of Pakistan
82
23.3.3.2 Regularizing the temporary hires / workers deployed by Service provider companies under outsourcing
arrangements
This has been explained in note 26.3.3.1 to the consolidated financial statements of the year ended December 31, 2020.The
management‘s estimate of overall increase in pension liability, based on the independent actuarial firm report for the year
ended December 31, 2020 amounted to Rs. 73.4 billion, excluding any penal interest / profit payment (if any) due to delayed
payment. Further, the pension expense for year 2020 onward will also increase by Rs. 7.4 billion due to this decision. Based
on the opinion of legal counsel, no provision for any additional pension liability has been made in these consolidated
condensed interim financial statements for the above mentioned amount as the Bank is confident about a favorable outcome
on the matter.
The current status of these contingencies is same as disclosed in the annual consolidated financial statements of the Group
for the year ended December 31, 2020.
23.3.3 Contingencies in respect of employees benefits and related matters
23.3.3.1 Pensionary benefits to retired employees
As at June 30, 2021, the status of contingencies disclosed in the annual consolidated financial statements for the year ended
December 31, 2020 is same, other than the following significant developments:
23.3.4 Compliance and risk matters relating to anti-money laundering at the New York Branch
In 2016 the Bank and its New York branch entered into a written agreement with the Federal Reserve Bank of New York and
New York State Department of Financial Services (US regulators). This agreement, inter-alia, requires the Bank to address
certain compliance and risk management matters relating to anti-money laundering and the US bank secrecy law
requirements. This agreement also requires implementation of the requisite systems and controls and the allocation of
adequate resources to ensure full compliance with such requirements. The Bank continues to undertake necessary remedial
actions to address the regulatory weaknesses highlighted in the 2016 written agreement and those identified in subsequent
examinations by the US regulators. However, the Bank remains vulnerable until it completes the required remedial actions and
the same are endorsed by the US Regulators.
24. MARK-UP / RETURN / INTEREST EARNED
Loans and advances 42,162,492 57,575,817
Investments 64,120,035 85,476,981
On securities purchased under resale agreements 1,134,324 1,479,838
Balances with other banks 672,738 860,962
108,089,589 145,393,598
25. MARK-UP / RETURN / INTEREST EXPENSED
Deposits 39,097,322 61,487,352
Borrowings 3,346,442 4,604,262
Cost of foreign currency swaps against foreign currency deposits 4,243,818 4,514,336
Finance charge on lease liability against right of use assets 433,628 389,616
Securities sold under repurchase agreements 13,484,952 25,812,319
60,606,162 96,807,886
For the half year ended
(Un-audited)
June 30,
2021
June 30,
2020
-------------- (Rupees in '000) --------------
(Un-audited)

Building Resilience. Creating Opportunities.
HALF YEARLY REPORT JUNE 2021 83
For the half year ended
(Un-audited)
June 30,
2021
June 30,
2020Note -------------- (Rupees in '000) --------------
26. FEE AND COMMISSION INCOME
Branch banking customer fees 833,992 836,256
Consumer finance related fees 425,873 297,643
Card related fees 905,839 538,743
Credit related fees 99,512 88,373
Investment banking fees 543,347 202,852
Commission on trade 1,080,648 1,018,075
Commission on guarantees 193,175 249,374
Commission on cash management 40,818 1,810
Commission on remittances including home remittances 563,791 428,431
Commission on bancassurance 141,833 93,815
Commission on government transactions 3,981,415 4,894,601
Management fee and sale load 627,046 523,232
Brokerage income 70,687 47,544
Others 28,635 92,969
9,536,612 9,313,718
27. GAIN ON SECURITIES - NET
Realised 27.1 4,155,708 3,280,468
Unrealized - held-for-trading 9.1 632 48,399
4,156,340 3,328,867
27.1 Realised gain on:
Federal Government Securities 335,792 2,570,855
Shares and mutual funds 3,686,132 290,171
Ijarah Sukuks 10,809 -
Foreign Securities 122,975 419,442
4,155,708 3,280,468
28. OTHER INCOME
Rent on property 22,053 5,494
Gain on sale of fixed assets - net 22,068 29,117
Compensation for delayed tax refunds 28.1 881,752 2,376,094
Remittances expense reimbursed by SBP - 112,861
Others 29,350 20,637
955,223 2,544,203
28.1 This represents compensation on delayed refunds determined under Section 171 of Income Tax Ordinance 2001.
(Un-audited)

HALF YEARLY REPORT JUNE 2021
National Bank of Pakistan
84
29. OPERATING EXPENSES
Total compensation expense 20,894,526 19,884,837
Property expense
Rent and taxes 401,052 202,724
Insurance 23,515 27,838
Utilities cost 570,393 555,394
Security (including guards) 1,376,240 1,348,496
Repair and maintenance (including janitorial charges) 423,550 486,407
Depreciation 241,721 214,202
Depreciation on non banking assets 7,731 7,892
Depreciation on Ijarah assets 38,356 49,107
Depreciation on right of use assets 1,022,961 1,012,114
4,105,519 3,904,173Information technology expenses
Software maintenance 607,354 526,513
Hardware maintenance 16,059 8,213
Depreciation 153,247 116,727
Amortization 122,626 106,905
Network charges 231,151 195,914
IT Manage Services 118,244 123,365
1,248,681 1,077,638Other operating expenses
Directors' fees and reimbursement of other expenses 11,497 22,459
Directors' fees and allowances - subsidiaries 5,945 3,795
Fees and allowances to Shariah Board 5,140 4,442
Legal and professional charges 454,528 348,339
Outsourced services costs 347,179 384,487
Travelling and conveyance 287,168 220,297
NIFT clearing charges 82,707 69,518
Depreciation 797,911 889,445
Training and development 21,643 29,265
Postage and courier charges 112,139 129,627
Communication 161,958 156,030
Stationery and printing 686,372 512,170
Marketing, advertisement and publicity 99,063 80,117
Donations - 100
Contributions for other Corporate and Social Responsibility 6,201 85,447
Auditors' Remuneration 103,793 125,205
Financial charges on leased assets 22,384 20,243
Insurance 191,128 358,144
Entertainment 114,372 117,812
Clearing, verification, license fee charges 162,307 173,707
Vehicle Expenses 109,188 81,717
Repairs and maintenance 233,709 213,961
Brokerage 71,495 46,682
Deposit premium expense 785,553 687,318
Others 204,503 246,589
5,077,882 5,006,916
31,326,608 29,873,564
30. OTHER CHARGES
Penalties imposed by State Bank of Pakistan 24,374 293,155
Penalties imposed by other regulatory bodies (Central bank of international branches) - 83
498 1,214
24,872 294,452
Penalties imposed by other regulatory bodies (Regulators of subsidiaries)
For the half year ended
(Un-audited)
June 30,
2021
June 30,
2020
-------------- (Rupees in '000) --------------
(Un-audited)
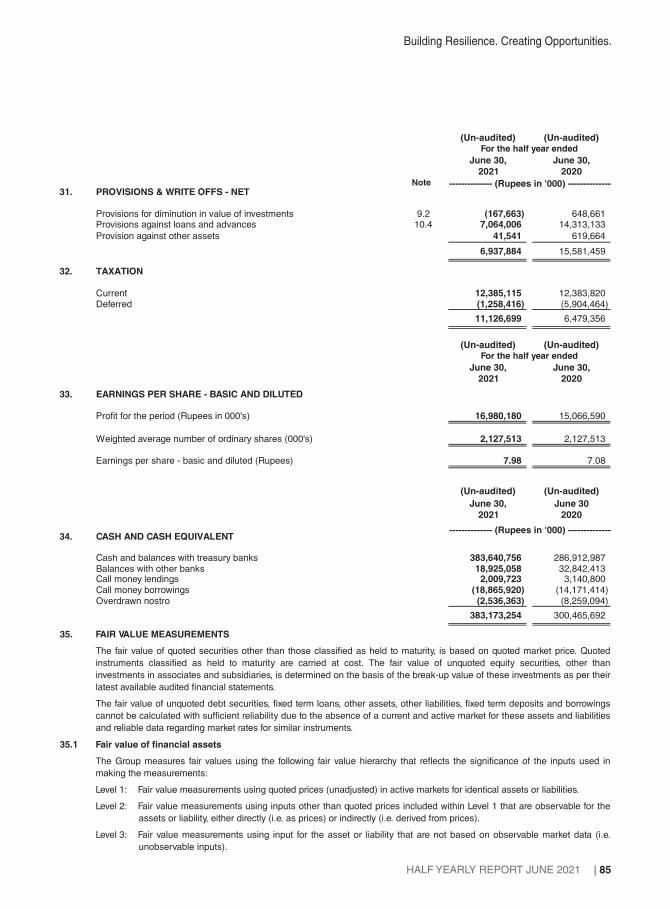
Building Resilience. Creating Opportunities.
HALF YEARLY REPORT JUNE 2021 85
31. PROVISIONS & WRITE OFFS - NET
Provisions for diminution in value of investments 9.2 (167,663) 648,661Provisions against loans and advances 10.4 7,064,006 14,313,133
Provision against other assets 41,541 619,664
6,937,884 15,581,459
32. TAXATION
Current 12,385,115 12,383,820Deferred (1,258,416) (5,904,464)
11,126,699 6,479,356
33. EARNINGS PER SHARE - BASIC AND DILUTED
Profit for the period (Rupees in 000's) 16,980,180 15,066,590
Weighted average number of ordinary shares (000's) 2,127,513 2,127,513
Earnings per share - basic and diluted (Rupees) 7.98 7.08
34. CASH AND CASH EQUIVALENT
Cash and balances with treasury banks 383,640,756 286,912,987Balances with other banks 18,925,058 32,842,413Call money lendings 2,009,723 3,140,800Call money borrowings (18,865,920) (14,171,414)Overdrawn nostro (2,536,363) (8,259,094)
383,173,254 300,465,692
For the half year ended
(Un-audited)
June 30,
2021
June 30,
2020Note -------------- (Rupees in '000) --------------
For the half year ended
(Un-audited)
June 30,
2021
June 30,
2020
June 30,
2021
June 30
2020
-------------- (Rupees in '000) --------------
(Un-audited) (Un-audited)
Level 3: Fair value measurements using input for the asset or liability that are not based on observable market data (i.e.
unobservable inputs).
The fair value of quoted securities other than those classified as held to maturity, is based on quoted market price. Quoted
instruments classified as held to maturity are carried at cost. The fair value of unquoted equity securities, other than
investments in associates and subsidiaries, is determined on the basis of the break-up value of these investments as per their
latest available audited financial statements.
35.1 Fair value of financial assets
35. FAIR VALUE MEASUREMENTS
The fair value of unquoted debt securities, fixed term loans, other assets, other liabilities, fixed term deposits and borrowings
cannot be calculated with sufficient reliability due to the absence of a current and active market for these assets and liabilities
and reliable data regarding market rates for similar instruments.
The Group measures fair values using the following fair value hierarchy that reflects the significance of the inputs used in
making the measurements:
Level 2: Fair value measurements using inputs other than quoted prices included within Level 1 that are observable for the
assets or liability, either directly (i.e. as prices) or indirectly (i.e. derived from prices).
Level 1: Fair value measurements using quoted prices (unadjusted) in active markets for identical assets or liabilities.
(Un-audited)
(Un-audited)

HALF YEARLY REPORT JUNE 2021
National Bank of Pakistan
86
The table below analyses financial instruments measured at the end of the reporting period by the level in the fair value
hierarchy into which the fair value measurement is categorised:
Carrying Value Level 1 Level 2 Level 3 Total
On balance sheet financial instruments
Financial assets - measured at fair value
InvestmentsMarket Treasury Bills 941,593,524 - 941,593,524 - 941,593,524
Pakistan Investment Bonds 469,425,831 - 469,425,831 - 469,425,831
Ijarah Sukuks 8,102,120 - 8,102,120 - 8,102,120
Ordinary shares of listed companies 45,512,879 45,512,879 - - 45,512,879
Investment In mutual funds 2,642,476 - 2,642,476 - 2,642,476
Preference shares 1,289,600 1,289,600 - - 1,289,600
Term Finance Certificates / Musharika and Sukuk Bonds 49,499,854 6,285,000 43,214,854 - 49,499,854
GoP Foreign Currency Bonds 11,880,788 - 11,880,788 - 11,880,788
Foreign Government Securities 1,922,498 - 1,922,498 1,922,498
Ordinary shares of a bank outside Pakistan 23,573,040 23,573,040 - - 23,573,040
1,555,442,610 76,660,519 1,478,782,091 - 1,555,442,609
Financial assets - disclosed but not measured at fair value
Market Treasury Bills 49,136,078 - 49,176,750 - 49,176,750
Pakistan Investment Bonds 193,226,011 - 194,532,410 - 194,532,410
GoP Foreign Currency Bonds 2,742,447 - 2,777,878 - 2,777,878
Foreign Government Securities 31,827,320 - 36,656,970 - 36,656,970
Foreign Currency Debt Securities 608 - 609 - 609
Associates 640,450 208,320 432,130 - 640,450
277,572,914 208,320 283,576,747 - 283,785,067
1,833,015,524 76,868,839 1,762,358,838 - 1,839,227,676
Off-balance sheet financial instruments- measured at fair value
Foreign exchange contracts purchase and sale 527,670,059 - (1,758,364) - (1,758,364)
Forward government securities transactions 2,970,040 - 1,390 - 1,390
Carrying Value Level 1 Level 2 Level 3 Total
On balance sheet financial instruments
Financial assets - measured at fair value
Investments
Market Treasury Bills 626,248,790 - 626,248,790 - 626,248,790
Pakistan Investment Bonds 473,408,082 - 473,408,082 - 473,408,082
Ijarah Sukuks 6,015,600 - 6,015,600 - 6,015,600
Ordinary shares of listed companies 48,089,192 48,089,192 - - 48,089,192
Investments in mutual funds 2,291,013 - 2,291,013 - 2,291,013
Preference shares 1,099,850 1,099,850 - - 1,099,850
Term Finance Certificates / Musharika and Sukuk Bonds 55,910,547 4,280,000 51,630,547 - 55,910,547
GoP Foreign Currency Bonds 10,840,875 - 10,840,875 - 10,840,875
Foreign Government Securities 3,953,016 - 3,953,016 - 3,953,016
Foreign Currency Debt Securities 80,640 - 80,640 - 80,640
Ordinary shares of a bank outside Pakistan 17,652,778 17,652,778 - - 17,652,778
1,245,590,383 71,121,820 1,174,468,563 - 1,245,590,383
---------------------------------------------- (Rupees in '000) ---------------------------------------------
June 30, 2021 (Un-audited)
December 31, 2020 (Audited)
---------------------------------------------- (Rupees in '000) ---------------------------------------------

Building Resilience. Creating Opportunities.
HALF YEARLY REPORT JUNE 2021 87
Carrying Value Level 1 Level 2 Level 3 Total
Financial assets - disclosed but not measured at fair value
Pakistan Investment Bonds 168,676,415 - 171,760,622 - 171,760,622
Foreign Government Securities 32,418,809 - 37,154,346 - 37,154,346
Foreign Currency Debt Securities 618 - 618 - 618
Associates 561,083 181,676 379,408 561,083
201,656,925 181,676 209,294,994 - 209,476,669
1,447,247,308 71,303,496 1,383,763,557 - 1,455,067,052
Off-balance sheet financial instruments - measured at fair value
Foreign exchange contracts purchase and sale 419,327,735 - (2,918,017) - (2,918,017)
Forward government securities transactions 27,625,340 - 52,885 - 52,885
Valuation techniques used in determination of fair valuation of financial instruments within level 2 and level 3
Item Valuation approach and input used
Market Treasury Bills PKRV (MUFAP)
Pakistan Investment Bonds PKRV (MUFAP)
Ijarah Sukuks MUFAP
Ordinary shares of unlisted companies Breakup value as per latest available audited financial statements
Mutual Funds MUFAP
Term Finance Certificates / Musharika and Sukuk Bonds MUFAP
GoP Foreign Currency Bonds Reuter page
Foreign Government Securities Reuter page
Foreign Currency Debt Securities Reuter page
35.2
Carrying Value Level 1 Level 2 Level 3 Total
Land & building (property and equipment) 48,566,621 - - 48,566,621 48,566,621
Non-banking assets acquired in satisfaction of claims 3,960,598 - - 3,960,598 3,960,598
52,527,219 - - 52,527,219 52,527,219
Carrying Value Level 1 Level 2 Level 3 Total
Land & building (property and equipment) 48,770,485 - - 48,770,485 48,770,485
Non-banking assets acquired in satisfaction of claims 3,968,329 - - 3,968,329 3,968,329
52,738,814 - - 52,738,814 52,738,814
Fair value of non-financial assets
Information about the fair value hierarchy of Bank’s non-financial assets as at the end of the reporting period are as follows:
------------------------------------------------------ (Rupees in '000) ------------------------------------------------------
December 31, 2020 (Audited)
June 30, 2021 (Un-audited)
------------------------------------------------------ (Rupees in '000) ------------------------------------------------------
December 31, 2020 (Audited)
------------------------------------------------------ (Rupees in '000) ------------------------------------------------------

HALF YEARLY REPORT JUNE 2021
National Bank of Pakistan
88
36.
SE
GM
EN
TD
ET
AIL
SW
ITH
RE
SP
EC
TT
O B
US
INE
SS
AC
TIV
ITIE
S
Pro
fit
and
loss
acc
ou
nt
(25,
875,
488)
7,98
8,82
813
,732
,637
47,4
51,7
611,
530,
097
2,65
5,59
147
,483
,427
-47
,483
,427
Inte
r se
gm
ent r
evenue
-ne
t49
,779
,122
(6,5
51,1
00)
(12,
140,
047)
(38,
828,
882)
-7,
740,
907
--
-
Non
mark
-up /
retu
rn / in
tere
st in
com
e6,
561,
353
179,
407
2,20
2,38
27,
380,
652
656,
787
1,99
9,42
618
,980
,009
-18
,980
,009
Tot
al I
ncom
e30
,464
,987
1,61
7,13
53,
794,
972
16,0
03,5
312,
186,
884
12,3
95,9
2566
,463
,436
-66
,463
,436
Se
gm
ent d
irec
t ex
pen
ses
14,8
50,8
301,
423,
743
530,
334
189,
565
2,67
7,43
52,
265,
768
21,9
37,6
74-
21,9
37,6
74
Inte
r se
gm
ent e
xpens
e a
lloca
tion
--
--
-9,
413,
806
9,41
3,80
6-
9,41
3,80
6
Tot
al e
xpens
es
14,8
50,8
301,
423,
743
530,
334
189,
565
2,67
7,43
511
,679
,574
31,3
51,4
80-
31,3
51,4
80
Pro
visi
on
s an
dw
rite
offs
-net
513,
453
702,
332
5,61
3,24
1(1
42,0
19)
(64,
910)
315,
788
6,93
7,88
4-
6,93
7,88
4
Pro
fit /
(lo
ss)
befo
reta
xatio
n15
,100
,705
(508
,940
)(2
,348
,602
)15
,955
,985
(425
,641
)40
0,56
428
,174
,072
-28
,174
,072
Sta
tem
ent
of
fin
anci
alp
osi
tio
n
183,
104,
640
16,2
00,8
9725
3,56
314
7,23
1,36
546
,306
,956
9,46
8,39
340
2,56
5,81
4-
402,
565,
814
Inve
stm
ents
--
23,6
99,7
171,
729,
320,
509
46,8
73,5
4253
,020
,334
1,85
2,91
4,10
0-
1,85
2,91
4,10
0
Net in
ter
segm
ent
lend
ing
1,91
7,30
0,66
6-
--
-22
3,33
1,58
82,
140,
632,
254
(2,1
40,6
32,2
54)
-
Lend
ings
to fi
nanc
ial i
nst
itutio
ns-
--
180,
790,
708
--
180,
790,
708
-18
0,79
0,70
8
Adva
nce
s -
perf
orm
ing
180,
978,
966
196,
132,
404
533,
592,
010
-40
,634
,547
43,9
94,7
1699
5,33
2,64
3-
995,
332,
643
Ad
van
ces
-non
-per
form
ing
4,17
6,74
019
,115
,630
54,6
90,0
53-
41,4
38,0
4365
,482
,456
184,
902,
922
-18
4,90
2,92
2
Pro
visi
on
aga
inst
adva
nce
s(8
,840
,017
)(1
7,27
3,10
9)(5
2,71
3,12
3)-
(40,
449,
350)
(63,
937,
393)
(183
,212
,990
)-
(183
,212
,990
)
Ad
van
ces
-N
et17
6,31
5,69
019
7,97
4,92
553
5,56
8,94
0-
41,6
23,2
4045
,539
,779
997,
022,
576
-99
7,02
2,57
6
Oth
ers
28,3
19,8
102,
539,
239
42,0
60,2
8728
9,22
44,
271,
962
114,
210,
038
191,
690,
551
-19
1,69
0,55
1
To
tal A
sset
s2,
305,
040,
806
216,
715,
061
601,
582,
507
2,05
7,63
1,80
713
9,07
5,70
044
5,57
0,13
25,
765,
616,
003
(2,1
40,6
32,2
54)
3,62
4,98
3,74
9
Borr
ow
ings
-3,
930,
849
53,5
23,1
2036
5,93
6,62
918
,865
,920
-44
2,25
6,51
8-
442,
256,
518
Depo
sits
and o
ther
acc
ounts
2,25
6,16
9,29
9-
271,
560,
666
-65
,365
,577
85,9
48,6
202,
679,
044,
162
-2,
679,
044,
162
Net in
ter
segm
ent
bor
row
ing
-20
8,52
8,48
723
9,33
9,98
71,
634,
762,
343
52,0
05,9
875,
995,
451
2,14
0,63
2,25
4(2
,140
,632
,254
)-
Oth
ers
48,8
71,5
074,
255,
725
36,9
14,8
4110
,969
,311
2,41
0,59
810
7,79
1,52
421
1,21
3,50
6-
211,
213,
506
To
tal l
iab
iliti
es2,
305,
040,
806
216,
715,
061
601,
338,
614
2,01
1,66
8,28
313
8,64
8,08
219
9,73
5,59
55,
473,
146,
440
(2,1
40,6
32,2
54)
3,33
2,51
4,18
6
Eq
uity
--
243,
893
45,9
63,5
2442
7,61
824
5,83
4,53
729
2,46
9,56
3-
292,
469,
563
To
tal e
qu
ity
and
liab
iliti
es2,
305,
040,
806
216,
715,
061
601,
582,
507
2,05
7,63
1,80
713
9,07
5,70
044
5,57
0,13
25,
765,
616,
003
(2,1
40,6
32,2
54)
3,62
4,98
3,74
9
Co
nti
ng
enci
es a
nd
com
mit
men
ts-
68,6
97,7
281,
464,
614,
971
527,
670,
058
22,0
08,5
0636
,300
,505
2,11
9,29
1,76
8-
2,11
9,29
1,76
8
Cash
and
bala
nces
with
trea
sury
and
othe
rban
ks
Net m
ark
-up /
retu
rn/ in
tere
st
inco
me /
(exp
ens
e)
Hal
fye
aren
ded
Jun
e30
, 202
1(U
n-a
ud
ited
)
Jun
e30
, 202
1(U
n-a
ud
ited
)
Ret
ail B
anki
ng
Gro
up
Incl
usi
ve
Dev
elo
pm
ent
Gro
up
Co
rpo
rate
an
d
Inve
stm
ent
Ban
kin
g
Tre
asu
ry
Inte
rna
tio
nal
,
Fin
anci
al
Inst
itu
tio
nan
d
Rem
itta
nce
Hea
d O
ffic
e/
Oth
ers
Su
bto
tal
Elim
inat
ion
sT
ota
l
----
----
----
----
----
----
----
----
----
----
----
----
----
----
----
----
----
----
----
----
----
----
----
- (R
up
ees
in
'000)
----
----
----
----
----
----
----
----
----
----
----
----
----
----
----
----
----
----
----
----
----
----
----

Building Resilience. Creating Opportunities.
HALF YEARLY REPORT JUNE 2021 89
Pro
fit a
nd lo
ss a
ccou
nt
(53,
526,
630)
12,2
17,8
0529
,191
,240
56,4
71,5
991,
421,
496
2,81
0,20
348
,585
,712
-48
,585
,712
Inte
r se
gmen
t rev
enue
-ne
t80
,335
,272
(10,
991,
897)
(25,
845,
882)
(47,
459,
964)
-3,
962,
471
--
-
Non
mar
k-up
/re
turn
/ in
tere
st in
com
e6,
546,
092
727,
352
1,16
4,22
36,
117,
275
1,14
0,99
43,
058,
598
18,7
54,5
33-
18,7
54,5
33
Tot
al In
com
e33
,354
,733
1,95
3,26
04,
509,
581
15,1
28,9
102,
562,
490
9,83
1,27
167
,340
,246
-67
,340
,245
Seg
men
t dire
ct e
xpen
ses
13,4
29,0
281,
327,
737
372,
501
159,
110
2,37
2,98
21,
936,
458
19,5
97,8
16-
19,5
97,8
16
Inte
r se
gmen
t exp
ense
allo
catio
n-
--
--
10,5
70,2
0010
,570
,200
-10
,570
,200
Tot
al e
xpen
ses
13,4
29,0
281,
327,
737
372,
501
159,
110
2,37
2,98
212
,506
,658
30,1
68,0
16-
30,1
68,0
16
Pro
visi
ons
and
writ
eof
fs -
net
233,
214
5,84
5,92
78,
712,
389
399,
501
(266
,258
)65
6,68
515
,581
,459
-15
,581
,459
Pro
fit /
(loss
) bef
ore
taxa
tion
19,6
92,4
91(5
,220
,405
)(4
,575
,309
)14
,570
,299
455,
766
(3,3
32,0
72)
21,5
90,7
70-
21,5
90,7
70
Sta
tem
ent o
f fin
anci
alpo
sitio
n
148,
446,
514
9,80
9,66
728
1,21
049
,710
,033
47,9
60,7
668,
776,
741
264,
984,
932
-26
4,98
4,93
2
Inve
stm
ents
--
31,3
93,5
871,
340,
556,
530
46,0
98,0
4648
,357
,210
1,46
6,40
5,37
3-
1,46
6,40
5,37
3
Net
inte
r seg
men
t len
ding
1,71
6,04
1,62
3-
--
-19
2,58
5,01
91,
908,
626,
642
(1,9
08,6
26,6
42)
-
Lend
ings
to fi
nanc
ial i
nstit
utio
ns-
--
126,
802,
025
-2,
650
126,
804,
675
126,
804,
675
Adv
ance
s - p
erfo
rmin
g23
2,02
1,16
212
8,34
0,99
653
8,86
1,52
8-
43,6
33,8
8146
,262
,759
989,
120,
326
-98
9,12
0,32
6
Adv
ance
s- n
on-p
erfo
rmin
g4,
007,
870
22,4
97,0
9847
,548
,441
-42
,345
,094
55,4
14,1
0817
1,81
2,61
2-
171,
812,
612
Pro
visi
on a
gain
st a
dvan
ces
(8,3
83,5
14)
(19,
538,
451)
(52,
114,
538)
-(4
1,26
6,07
9)(5
5,75
8,93
7)(1
77,0
61,5
17)
-(1
77,0
61,5
17)
Adv
ance
s - n
et22
7,64
5,51
913
1,29
9,64
253
4,29
5,43
2-
44,7
12,8
9645
,917
,930
983,
871,
421
-98
3,87
1,42
1
Oth
ers
24,4
62,1
971,
626,
569
22,5
88,5
0136
6,29
73,
972,
925
122,
127,
117
175,
143,
591
-17
5,14
3,59
1
Tota
l Ass
ets
2,11
6,59
5,85
314
2,73
5,87
858
8,55
8,73
01,
517,
434,
885
142,
744,
633
417,
766,
667
4,92
5,83
6,63
3(1
,908
,626
,642
)3,
017,
209,
992
Bor
row
ings
-3,
511,
852
46,6
88,5
9686
,290
,983
2,04
7,57
5-
138,
539,
005
-13
8,53
9,00
5
Dep
osits
and
oth
erac
coun
ts2,
068,
891,
897
-20
0,01
1,96
9-
73,2
25,5
4376
,799
,062
2,41
8,92
8,46
9-
2,41
8,92
8,46
9
Net
inte
r seg
men
t bor
row
ing
-13
6,10
8,15
232
3,78
8,03
41,
375,
268,
749
63,8
68,5
619,
593,
146
1,90
8,62
6,64
2(1
,908
,626
,642
)-
Oth
ers
47,7
03,9
583,
115,
875
17,8
57,4
4112
,387
,953
3,13
8,35
210
1,13
6,66
018
5,34
0,23
6-
185,
340,
236
Tota
l lia
bili
ties
2,11
6,59
5,85
414
2,73
5,87
858
8,34
6,04
01,
473,
947,
685
142,
280,
030
187,
528,
868
4,65
1,43
4,35
2(1
,908
,626
,642
)2,
742,
807,
710
Equ
ity-
-21
2,69
043
,487
,200
464,
603
230,
237,
799
274,
402,
282
-27
4,40
2,28
2
Tota
l eq
uity
and
liab
ilitie
s2,
116,
595,
853
142,
735,
878
588,
558,
730
1,51
7,43
4,88
514
2,74
4,63
341
7,76
6,66
74,
925,
836,
633
(1,9
08,6
26,6
42)
3,01
7,20
9,99
2
Co
ntin
gen
cies
an
dco
mm
itmen
ts55
7,27
7,57
3-
1,04
6,10
3,66
6-
20,5
77,4
2935
,553
,685
1,65
9,51
2,35
5-
1,65
9,51
2,35
5
Cas
han
d ba
lanc
es w
ith tr
easu
ryan
d
othe
r ban
ks
Net
mar
k-up
/re
turn
/in
tere
stin
com
e/
(exp
ense
)
Hal
f yea
r end
ed J
une
30, 2
020
(Un-
audi
ted)
Dec
embe
r 31,
202
0(A
udite
d)
Ret
ail B
anki
ng
Gro
up
Incl
usiv
e
Dev
elop
men
t
Gro
up
Cor
pora
te a
nd
Inve
stm
ent
Ban
king
Tre
asur
y
Inte
rnat
iona
l,
Fin
anci
al
Inst
itutio
nan
d
Rem
ittan
ce
Hea
d O
ffice
/O
ther
sS
ub to
tal
Elim
inat
ions
Tot
al
----
----
----
----
----
----
----
----
----
----
----
----
----
----
----
----
----
----
----
----
----
----
----
- (R
upee
s in
'000
) --
----
----
----
----
----
----
----
----
----
----
----
----
----
----
----
----
----
----
----
----
----
----
--

HALF YEARLY REPORT JUNE 2021
National Bank of Pakistan
90
The
Gro
up
has
rela
ted
part
ytr
ansactions
with
its
pare
nt,
subsid
iaries,
associa
tes,
join
tve
ntu
res,
em
plo
yee
benefit
pla
ns
and
its
directo
rsan
dke
ym
anagem
ent
pers
onnel.
The
deta
ilsof
inve
stm
ent in
subsid
iary
com
panie
s, join
t ve
ntu
re a
nd a
ssocia
ted u
ndert
akin
g a
nd their p
rovis
ions a
re s
tate
d in n
ote
9 o
f th
e c
onsolid
ate
d c
onden
sed inte
rim
fin
ancia
l sta
tem
ent
of
the G
roup.
The
Gro
up
ente
rsin
totr
ansactions
with
rela
ted
part
ies
inth
eord
inary
cours
eof
busin
ess
and
on
substa
ntially
the
sam
ete
rms
as
for
com
para
ble
transactions
with
pers
on
of
sim
ilar
sta
ndin
g.
Contr
ibutions
toand
accru
als
inre
spect
of
sta
ffre
tire
ment
benefits
and
oth
er
benefit
pla
ns
are
made
inaccord
ance
with
the
actu
arialva
luations
/te
rms
of
the
contr
ibution
pla
n.
Rem
unera
tion
to the e
xecutive
s / o
ffic
ers
is d
ete
rmin
ed in a
ccord
ance w
ith the term
s o
f th
eir a
ppoin
tment.
Deta
ils o
f tr
ansactions w
ith r
ela
ted p
art
ies d
uring the p
eriod, oth
er
than those w
hic
h h
ave
been d
isclo
sed e
lsew
here
in these c
onsolid
ate
d fin
ancia
l sta
tem
ents
are
as follo
ws:
37.
RE
LAT
ED
PA
RT
Y T
RA
NS
AC
TIO
NS
Dire
ctor
s
Key
man
age-
men
t
pers
onne
l
Ass
ocia
tes
Join
t
vent
ure
Pen
sion
Fund
(Cur
rent
)
Pen
sion
Fund
(Fix
ed
Dep
osit)
Pen
sion
Fund
(N.I.
D.A
A/c
)
Pro
vide
nt
Fund
Oth
erre
late
d
part
ies
Dire
ctor
s
Key
man
age-
men
t
pers
onne
l
Ass
ocia
tes
Join
t
vent
ure
Pen
sion
Fund
(Cur
rent
)
Pen
sion
Fund
(Fix
ed
Dep
osit)
Pen
sion
Fund
(N.I.
D.A
A/c
)
Pro
vide
nt
Fund
Oth
er re
late
d
parti
es
Bal
ance
sw
ith o
ther
ban
ks
Incu
rren
t acc
ount
s-
--
404,
658
--
--
--
--
2,95
1-
--
--
--
-40
4,65
8-
--
--
--
-2,
951
--
--
-
Adv
ance
s
Ope
ning
bala
nce
-23
3,26
72,
981,
029
--
--
-30
5,11
7-
228,
805
3,04
6,66
2-
--
--
23,3
86,3
25
Add
ition
durin
gth
epe
riod
/ yea
r-
114,
534
--
--
--
33,2
94,4
15-
64,8
50-
--
--
-11
5,82
4,34
7
Rep
aid
durin
gth
epe
riod
/ yea
r-
(25,
915)
(15,
625)
--
--
-(3
3,35
1,61
2)-
(31,
840)
(65,
633)
--
--
-(1
15,6
73,0
58)
Tran
sfer
in/ (
out)
- net
*-
(70,
438)
--
--
--
(6)
-(2
8,54
8)-
--
--
-(2
3,23
2,49
7)
Clo
sing
bala
nce
-25
1,44
82,
965,
404
--
--
-24
7,91
4-
233,
267
2,98
1,02
9-
--
--
305,
117
Pro
visi
ons
agai
nst l
oans
--
2,83
7,28
7-
--
--
--
-2,
837,
287
--
--
-
Oth
erA
sset
sIn
tere
st/m
ark-
upac
crue
d-
-1,
719,
988
--
--
--
--
1,72
0,15
7-
--
--
-
Bor
row
ings
Ope
ning
bala
nce
--
-9,
111
--
--
--
--
279,
814
--
--
-
Bor
row
ings
durin
gth
epe
riod
/ yea
r-
--
36,0
26-
--
--
--
--
--
--
-
Set
tled
durin
gth
epe
riod
/yea
r-
--
--
--
--
--
-(2
70,7
03)
--
--
-
Clo
sing
bala
nce
--
-45
,137
--
--
--
--
9,11
1-
--
--
Dep
osits
and
oth
erac
coun
ts
Ope
ning
bala
nce
1,32
017
7,23
6-
-58
,871
-1,
369,
644
13,2
82,0
1622
7,96
73,
835
94,7
15-
-73
-1,
235,
120
13,2
96,8
8340
,416
,083
Rec
eive
ddu
ring
the
perio
d/y
ear
5,00
051
9,56
2-
-9,
434,
699
-1,
966,
589
848,
604
1,54
8,16
28,
672
713,
917
--
47,0
37,9
83-
3,05
4,52
71,
941,
908
708,
790
With
draw
ndu
ring
the
perio
d/y
ear
(3,6
03)
(502
,310
)-
-(9
,336
,816
)-
(3,0
21,7
41)
(851
,098
)(4
49,7
58)
(11,
228)
(620
,573
)-
-(4
6,97
9,18
5)-
(2,9
20,0
03)
(1,9
56,7
75)
(630
,132
)
Tran
sfer
in/ (
out)
- net
*(1
2)(1
1,01
8)-
--
--
--
41(1
0,82
3)-
--
--
-(4
0,26
6,77
4)
Clo
sing
bala
nce
2,70
418
3,47
0-
-15
6,75
4-
314,
492
13,2
79,5
221,
326,
371
1,32
017
7,23
6-
-58
,871
-1,
369,
644
13,2
82,0
1622
7,96
7
Con
tinge
ncie
san
d co
mm
itmen
ts-
--
--
--
--
--
--
--
--
-
*Tr
ansf
erin
(out
) -ne
t due
to re
tirem
ent /
appo
intm
ent o
f dire
ctor
san
d ch
ange
sin
key
man
agem
ent e
xecu
tives
.
Dec
embe
r 31,
2020
(Aud
i ted)
----
----
----
----
----
----
----
----
----
----
----
----
----
----
----
----
----
----
----
----
----
----
----
----
----
----
----
----
----
----
----
--- -
----
----
----
----
----
----
----
----
----
- (R
upee
s in
'000
) ---
----
----
----
----
----
----
----
----
----
----
----
----
----
----
----
----
----
----
----
----
----
----
----
----
----
----
----
----
----
----
----
----
----
----
----
----
----
----
----
----
June
30, 2
021
(Un-
audi
ted)

Building Resilience. Creating Opportunities.
HALF YEARLY REPORT JUNE 2021 91
The
Federa
lG
ove
rnm
ent
thro
ugh
Sta
teB
ank
of
Pakis
tan
hold
scontr
olli
ng
inte
rest
(75.6
0%
share
hold
ing)
inth
eB
ank
and
there
fore
entities
whic
hare
ow
ned
and
/
or
contr
olle
d b
y the F
edera
l G
ove
rnm
ent, o
r w
here
the F
edera
l G
ove
rnm
ent m
ay e
xerc
ise s
ignific
ant in
fluence, are
rela
ted p
art
ies o
f th
e B
ank.
The
Bank
als
oearn
ed
com
mis
sio
non
handlin
gtr
easury
transactions
on
behalf
of
the
Gove
rnm
ent
of
Pakis
tan
am
ounting
toR
s.3,9
81
mill
ion
for
the
half
year
ended
June
30,
2021.
As
at
the
Sta
tem
ent
of
Fin
ancia
lP
ositio
ndate
the
loans
and
adva
nces,
deposits
and
contingencie
sre
lating
toG
ove
rnm
ent–
rela
ted
entities
am
ounte
dto
Rs.
385,0
39
mill
ion,
Rs.
1,1
00,9
76
mill
ion
and
Rs.
1,3
27,5
87
mill
ion
respective
lyand
incom
eearn
ed
on
adva
nces
and
pro
fit
paid
on
deposits
am
ounte
d to R
s. 1
5,7
98 m
illio
n a
nd R
s. 2
7,4
01 m
illio
n r
espective
ly.
The
Bank
inth
eord
inary
cours
eof
busin
ess
ente
rsin
totr
ansaction
with
Gove
rnm
ent–
rela
ted
entities.
Such
transactions
inclu
de
lendin
gto
,deposits
from
and
pro
vis
ion o
f oth
er
bankin
g s
erv
ice to G
ove
rnm
ent–
rela
ted e
ntities.
37.1
Tran
sacti
on
s w
ith
Go
vern
men
t-re
late
d e
nti
ties
Key
man
age-
men
t
per
son
nel
Ass
oci
ates
Join
t
ven
ture
Pen
sio
n
Fun
d
Pro
vid
ent
Fun
dO
ther
s
Key
man
age-
men
t
pers
onne
l
Ass
ocia
tes
Join
t
vent
ure
Pen
sion
Fund
Pro
vide
nt
Fund
Oth
ers
Inco
me
Mar
k-up
/ ret
urn
/ int
eres
t ear
ned
-5,
613
5-
-4,
979
-10
,966
9-
-12
,820
Ren
t inc
ome
/ lig
htin
g an
d po
wer
and
bank
char
ges
-2,
554
--
--
-2,
319
--
-9,
723
Exp
ense
Mar
k-up
/ ret
urn
/ int
eres
t pai
d-
-33
38,0
3772
4,84
45,
109
--
293
52,7
8472
1,26
82,
140
Exp
ense
spa
idto
com
pany
inw
hich
Dire
ctor
of t
he b
ank
isin
tere
sted
as
CE
O-
--
--
18,6
68-
--
--
5,63
2
Rem
uner
atio
n to
key
man
agem
ent
exec
utiv
esin
clud
ing
char
gefo
r
defin
ed b
enef
itpl
an34
7,22
8-
--
--
220,
761
--
--
-
Pos
t Ret
irem
ent B
enef
itpa
id to
Dire
ctor
cum
Ex-
empl
oyee
--
--
-1,
044
--
--
-1,
044
Jun
e30
, 202
1 (U
n-a
ud
ited
)Ju
ne 3
0,20
20 (
Un-
audi
ted)
----
----
----
----
----
----
----
----
----
----
----
----
----
----
----
----
----
----
----
----
----
----
----
----
----
(Rup
ees
in '0
00) -
----
----
----
----
----
----
----
----
----
----
----
----
----
----
----
----
----
----
----
----
----
----
----
----
---
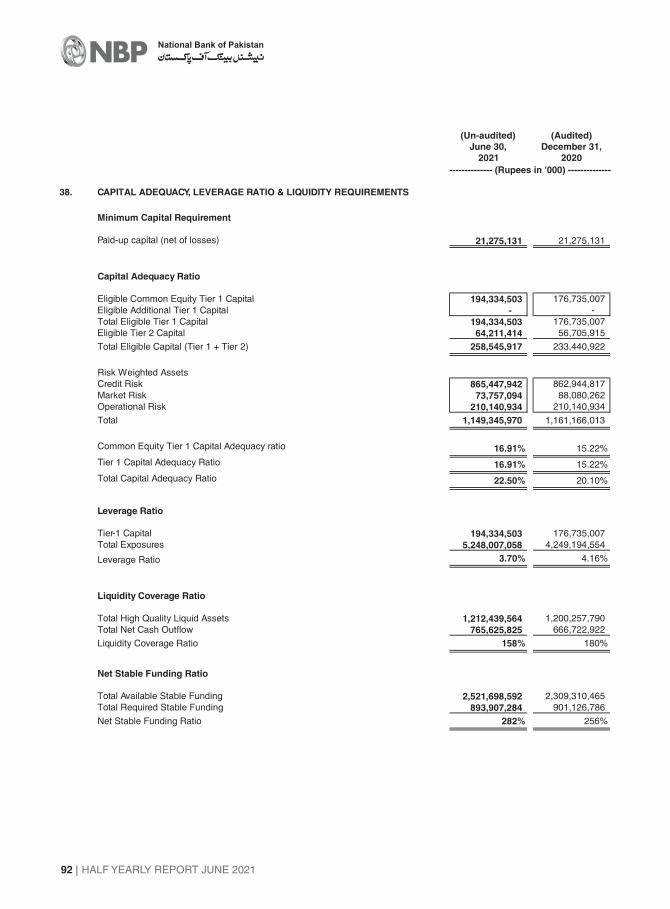
HALF YEARLY REPORT JUNE 2021
National Bank of Pakistan
92
38. CAPITAL ADEQUACY, LEVERAGE RATIO & LIQUIDITY REQUIREMENTS
Minimum Capital Requirement
Paid-up capital (net of losses) 21,275,131 21,275,131
Capital Adequacy Ratio
Eligible Common Equity Tier 1 Capital 194,334,503 176,735,007
Eligible Additional Tier 1 Capital - -
Total Eligible Tier 1 Capital 194,334,503 176,735,007
Eligible Tier 2 Capital 64,211,414 56,705,915
Total Eligible Capital (Tier 1 + Tier 2) 258,545,917 233,440,922
Risk Weighted Assets
Credit Risk 865,447,942 862,944,817
Market Risk 73,757,094 88,080,262
Operational Risk 210,140,934 210,140,934
Total 1,149,345,970 1,161,166,013
Common Equity Tier 1 Capital Adequacy ratio 16.91% 15.22%
Tier 1 Capital Adequacy Ratio 16.91% 15.22%
Total Capital Adequacy Ratio 22.50% 20.10%
Leverage Ratio
Tier-1 Capital 194,334,503 176,735,007
Total Exposures 5,248,007,058 4,249,194,554
Leverage Ratio 3.70% 4.16%
Liquidity Coverage Ratio
Total High Quality Liquid Assets 1,212,439,564 1,200,257,790
Total Net Cash Outflow 765,625,825 666,722,922
Liquidity Coverage Ratio 158% 180%
Net Stable Funding Ratio
Total Available Stable Funding 2,521,698,592 2,309,310,465
Total Required Stable Funding 893,907,284 901,126,786
Net Stable Funding Ratio 282% 256%
(Un-audited)
June 30,
2021
(Audited)
December 31,
2020
-------------- (Rupees in '000) --------------

Building Resilience. Creating Opportunities.
HALF YEARLY REPORT JUNE 2021 93
The bank is operating 190 (December 31, 2020: 191) Islamic banking branches and no Islamic banking windows at the half
year ended June 30, 2021.
39. ISLAMIC BANKING BUSINESS
ASSETS
Cash and balances with treasury banks 7,620,868 5,713,009
Balances with other banks 12,199 11,948
Investments 39.1 46,097,726 42,109,641
Islamic financing and related assets - net 39.2 37,290,273 37,546,704
Fixed assets 128,184 148,884
Right of use assets 699,593 755,116
Other assets 2,218,185 2,676,118
Total Assets 94,067,028 88,961,420
LIABILITIES
Bills payable 443,326 339,103
Deposits and other accounts 39.3 84,839,634 75,268,262
Due to Head Office 517,646 4,124,758
Lease liability against right of use assets 877,211 903,196
Other liabilities 1,401,129 2,198,144
88,078,946 82,833,463
NET ASSETS 5,988,082 6,127,957
REPRESENTED BY
Islamic Banking Fund 4,646,000 3,360,000
Surplus on revaluation of assets 685,749 659,569
Unappropriated / unremitted profit 39.4 656,333 2,108,388
5,988,082 6,127,957
- -
(Un-audited)
June 30,
2021
(Audited)
December 31,
2020Note -------------- (Rupees in '000) --------------
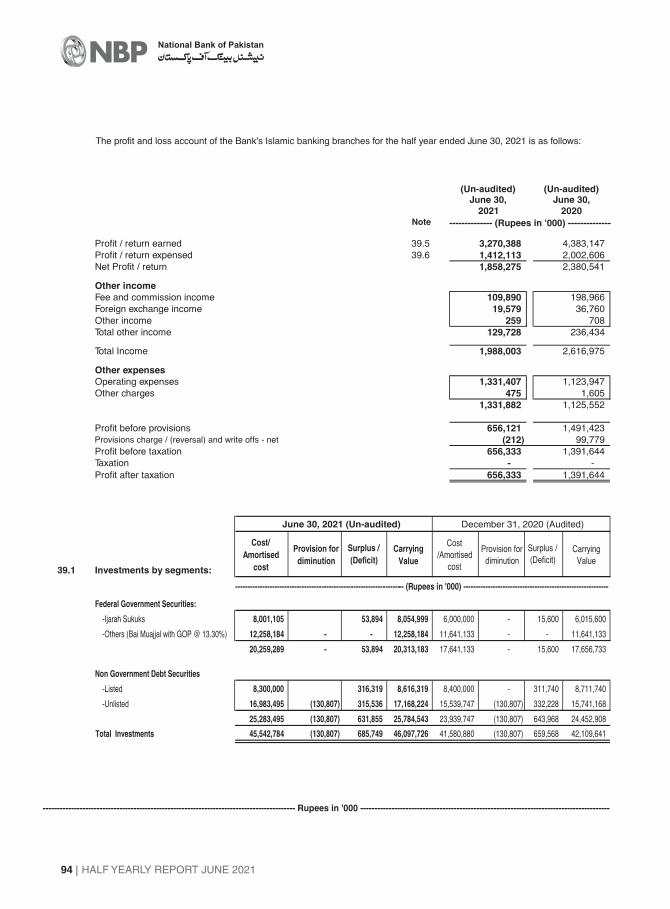
HALF YEARLY REPORT JUNE 2021
National Bank of Pakistan
94
The profit and loss account of the Bank's Islamic banking branches for the half year ended June 30, 2021 is as follows:
Profit / return earned 39.5 3,270,388 4,383,147
Profit / return expensed 39.6 1,412,113 2,002,606
Net Profit / return 1,858,275 2,380,541
Other income
Fee and commission income 109,890 198,966
Foreign exchange income 19,579 36,760
Other income 259 708
Total other income 129,728 236,434
Total Income 1,988,003 2,616,975
Other expenses
Operating expenses 1,331,407 1,123,947
Other charges 475 1,605
1,331,882 1,125,552
Profit before provisions 656,121 1,491,423
Provisions charge / (reversal) and write offs - net (212) 99,779
Profit before taxation 656,333 1,391,644
Taxation - -
Profit after taxation 656,333 1,391,644
(Un-audited) (Un-audited)June 30,
2021
June 30,
2020Note -------------- (Rupees in '000) --------------
----------------------------------------------------------------------------------------- Rupees in '000 ----------------------------------------------------------------------------------------
39.1 Investments by segments:
Federal Government Securities:
-Ijarah Sukuks 8,001,105 53,894 8,054,999 6,000,000 - 15,600 6,015,600
-Others (Bai Muajjal with GOP @ 13.30%) 12,258,184 - - 12,258,184 11,641,133 - - 11,641,133
20,259,289 - 53,894 20,313,183 17,641,133 - 15,600 17,656,733
Non Government Debt Securities
-Listed 8,300,000 316,319 8,616,319 8,400,000 - 311,740 8,711,740
-Unlisted 16,983,495 (130,807) 315,536 17,168,224 15,539,747 (130,807) 332,228 15,741,168
25,283,495 (130,807) 631,855 25,784,543 23,939,747 (130,807) 643,968 24,452,908
Total Investments 45,542,784 (130,807) 685,749 46,097,726 41,580,880 (130,807) 659,568 42,109,641
June 30, 2021 (Un-audited) December 31, 2020 (Audited)
Provision for
diminution
Surplus /
(Deficit)Carrying
Value
Cost/
Amortised
cost
Provision for
diminution
Surplus /
(Deficit)
Carrying
Value
Cost
/Amortised
cost
--------------------------------------------------------------------- (Rupees in '000) -----------------------------------------------------------

Building Resilience. Creating Opportunities.
HALF YEARLY REPORT JUNE 2021 95
39.2 Islamic financing and related assets - net
Ijarah 130,282 168,788
Murabaha 1,763,901 3,464,401
Diminishing Musharaka 19,012,724 17,614,309
Istisna 50,000 50,000
Other Islamic Modes (Wakala tul Istismar, Tijarat) 8,800,000 8,500,000
Advances against Islamic assets (Murabaha, DM, Istisna, Musawama) 7,509,226 8,076,678
Inventory related to Islamic financing (Istisna and Tijarat) 627,000 275,600
Gross Islamic financing and related assets 37,893,133 38,149,776
Less: provision against Islamic financings
- Specific (602,763) (602,913)
- General (97) (159)
(602,860) (603,072)
Islamic financing and related assets - net of provision 37,290,273 37,546,704
(Un-audited)
June 30,
2021
(Audited)
December 31,
2020
-------------- (Rupees in '000) --------------
39.3 Deposits
Customers
Current deposits 21,759,683 26,474,979
Savings deposits 42,806,167 33,051,442
Term deposits 8,195,527 10,129,005
72,761,377 69,655,426
Financial Institutions
Current deposits 642,139 778,039
Savings deposits 11,224,390 3,633,797
Term deposits 211,728 1,201,000
12,078,257 5,612,836
84,839,634 75,268,262
39.4 Unappropriated / unremitted profit
Opening Balance 2,108,388 2,039,140
656,333 2,108,388
(2,108,388) (2,039,140)
Closing balance 656,333 2,108,388
Less: Transferred / remitted to head office
Add: Islamic banking profit for the period
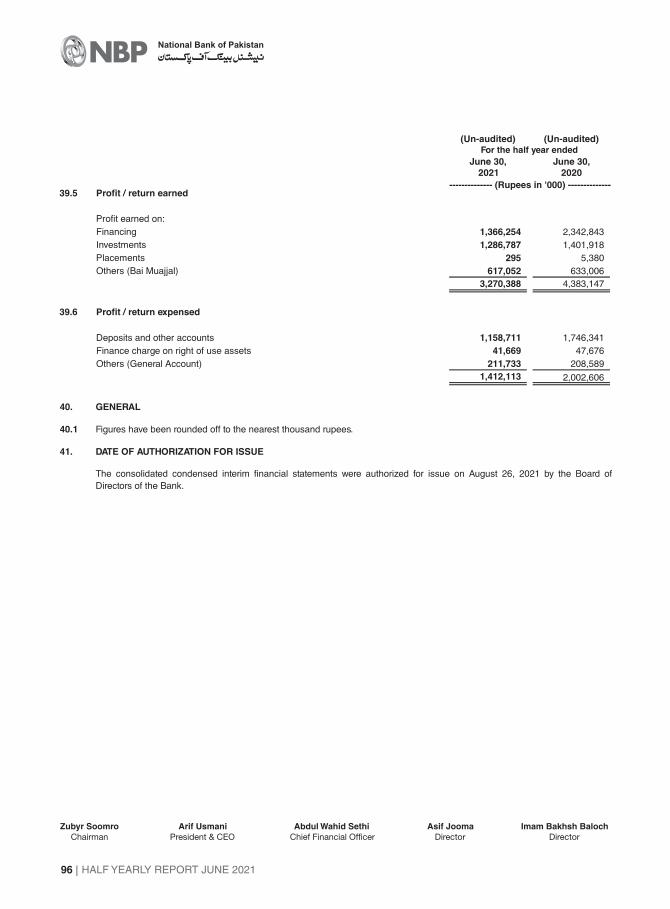
HALF YEARLY REPORT JUNE 2021
National Bank of Pakistan
96
For the half year ended
(Un-audited)
June 30,
2021
June 30,
2020
-------------- (Rupees in '000) --------------39.5 Profit / return earned
Profit earned on:
Financing 1,366,254 2,342,843
Investments 1,286,787 1,401,918
Placements 295 5,380
Others (Bai Muajjal) 617,052 633,006
3,270,388 4,383,147
39.6 Profit / return expensed
Deposits and other accounts 1,158,711 1,746,341
Finance charge on right of use assets 41,669 47,676
Others (General Account) 211,733 208,589
1,412,113 2,002,606
40. GENERAL
40.1 Figures have been rounded off to the nearest thousand rupees.
41. DATE OF AUTHORIZATION FOR ISSUE
The consolidated condensed interim financial statements were authorized for issue on August 26, 2021 by the Board of
Directors of the Bank.
Zubyr Soomro
Chairman
Arif Usmani
President & CEO
Abdul Wahid Sethi
Chief Financial Officer
Asif Jooma
Director
Imam Bakhsh Baloch
Director
(Un-audited)


