
CIS
Business as Usual? Analyzing the Effects of Enlargement on EU Legislative Output
Universität Zürich
Published by the Center for Comparative and International Studies (ETH Zurich and University of Zurich)
Robin HertzETH ZurichWeinbergstrasse 11WEC C [email protected]
Dr. Dirk LeuffenETH ZurichWeinbergstrasse 11WEC C [email protected]
ISSN 1662-7504
Working Paper No 38, 2008

Business as Usual? Analyzing the Effects of Enlargement on EU
Legislative Output�
Robin Hertz ETH Zurich
Weinbergstrasse 11 WEC C 13
Dr. Dirk Leuffen ETH Zurich
Weinbergstrasse 11 WEC C 14
Abstract This paper analyzes the effects of enlargement on European Union (EU) legislative output. Building on veto player theory we use computer simulations to derive hypotheses about group size, heterogeneity and law production. We test this theory by estimating negative binomial regression models on a dataset covering the legislative process for all binding secondary EU legislation from 1976 to 2007. Our analysis does not corroborate all of veto player theory’s expectations. No significant reduction of legislation goes along with an increase in the number of member states. In the outlook we discuss these findings and generate a set of possible explanations for our unexpected results. � Thanks go to Marjorie Buchser, Daniel Finke, Patrick Kuhn, Berthold Rittberger, Gabrielle Ruoff, Thomas Sattler, Nils Weidmann, Jonas Wolf and the members of ETH European Politics Research Group.

2
Introduction
Eastern enlargement is a major step in recent European integration. Starting from a
Community of six the European Union (EU) now consists of 27 member states with
almost 500 million citizens. While this is a success story in many respects, a lot of
questions are asked today about the effects of enlargement for EU governance. Has
enlargement transformed the nature of the beast? And how does it affect decision-
making? In this article, we analyze the consequences of enlargement on EU legislative
output. We conceptualize enlargement as an increase in group size. Group size is an
important variable for the analysis of decision making. First studies on group size go
back to early sociological research (cf. for instance Simmel 1992; Michels 1962; Weber
1921). There is a strong experimental tradition; and the variable has also found its way
into prominent political science theories (cf. for instance Olson 1965; Alesina and
Spolaore 2003). Our analysis builds on veto player theory (Tsebelis 2002) as a recent
contribution to the study of group size.
Using computer simulations we first derive a set of predictions on the relation
between group size, heterogeneity and policy stability for the case of the EU. The
simulations explicitly show that group size has a marginally diminishing negative effect
on legislative output. Adding members makes stronger differences for smaller groups.
Furthermore the simulations underline that a change in group size matters most when
linked to an increase of group heterogeneity. While perfectly in line with the basic ideas
of veto-player theory our simulations allow a more nuanced formulation of predictions
for different group size and heterogeneity scenarios for the case of the EU. We test these
theoretical predictions on a new data-set covering EU lawmaking from 1976 to 2007.

3
Negative binomial regression models gauge the effects of an increase of member states
on EU legislative output.
Our results are reassuring in that they – partly opposing veto player theory’s
predictions – point towards a ‘business as usual’ reading of post-enlargement governance.
An increase of group size does not significantly reduce legislative output. While we were
able to distinguish group size and heterogeneity in the theoretical setup this turns out to
be more problematic in the empirical analysis since an increase of group size generally
brings along more heterogeneity between the member states. While we do not detect
persisting gridlocks we present some evidence for short-term enlargement effects on EU
lawmaking. In particular, old member states’ anticipatory behavior leads to short-term
rises and declines of legislative output. But in the long-run the ‘natural flow’ of
legislation is restored. While our analysis is amongst the first to systematically gauge the
effects of enlargement for decision-making it only focuses on quantitative legislative
output. Future research should therefore address possible qualitative effects of EU
enlargement.
Actors, Heterogeneity and Policy Stability: Simulating the Effects of EU-
Enlargement
For many observers enlargement greatly transforms the nature of EU politics (cf. for
instance Zielonka 2006). It is commonly assumed that adding new member states makes
decision-making more problematic. In particular, enlargement should have negative
effects for legislative output. On the theoretical front, two approaches can be
4
distinguished:1 a veto-player related approach (Dobbins et al., 2004; König and
Bräuninger, 2004; Tsebelis and Yatanagas, 2002) and an a priori voting power approach
(Baldwin et al., 2000; Baldwin and Widgrén, 2003, 2004, 2005; Bilbao et al., 2002;
Felsenthal and Machover, 2004; Johnston, 1995). The a-priori voting power literature is
based on the calculation of all possible coalitions and the fraction of coalitions within the
Council that reach a qualified majority. While the veto-player approach combines
preferences and institutions to predict outcomes, the a-priori voting power approach
focuses on institutions. The simplifying assumptions and the validity of both approaches
have widely been debated (Albert, 2003; Felsenthal et al., 2003; Garrett and Tsebelis,
1999; Garrett and Tsebelis, 2001; Hörl et al., 2005; Lane and Berg, 1999). Especially the
neglect of actors’ preferences in the a-priori voting power approach has often been
criticized (Pajala and Widgrén, 2004; Steunenberg et al., 1999). Although the focus of
these two approaches is different, their predictions point into the same direction:
enlargement is generally said to have a strong impact on the EU’s decision-making
capacity (Kerremans, 1998). Tsebelis and Yataganas (2002: 304), for instance, conclude
that “it will be almost impossible to alter the legislative status quo” and Baldwin and
Widgrén (2004:6) agree that “the Nice Treaty rules cripple the EU’s ability to act since
they make it very difficult to find winning majorities” in an enlarged Union.
In its simplicity, veto player theory can be considered a compelling contribution
to the debate about the effects of group size on decision-making. The dependent variable
policy stability measures system production in terms of a departure from the legislative
status quo. Two components determine policy stability: the size of the winset of the status
1 We here concentrate on rationalist approaches. Most constructivist contributions to this question line up with the rationalist expectations; however, they stress different mechanisms (cf. Leuffen 2006).

5
quo and the size of the core (Tsebelis 2002). While the winset of the status quo is the set
of outcomes that can defeat the status quo, the core is the set of points with an empty
winset, i.e. the points that cannot be defeated by any other policy proposal. As the core
enlarges and/or the winset shrinks, policy stability increases. Adding new veto players
thus either increases policy stability or – if the new players are absorbed – leaves it the
same. Computer simulations enable us to formulate predictions about how different group
size and heterogeneity scenarios affect policy stability in the European Union.
Set-up of the Game and Hypotheses
According to veto player theory the actor constellation determines policy stability. For
our purpose, two variables are decisive: the number of veto players and their preferences
(on an aggregate level the preferences form the group’s heterogeneity). The following
simulations closely build on Steunenberg (2002) who – by the way – predicts that “under
qualified majority voting, enlargement will not affect the Union’s ability to take new
decisions” (Steunenberg, 2002: 112). Our simulations however are more nuanced – we
include more group size constellations and different degrees of heterogeneity; in addition,
we are not interested in deriving a strategic power index.
Our set-up follows a basic “take-it-or-leave-it” game (cf. Romer and Rosenthal
1978). Completely informed actors – the member states in the Council – have Euclidian
preferences in a one-dimensional policy-space that ranges from 0 to 100.2 The number of
members variable follows the historical development of the EU: with six enlargement
rounds our member’s variable takes seven values: 6, 9, 10, 12, 15, 25, and 27. In our
2 For reasons of simplicity we – in contrast with, for instance, Crombez (1996) – do not incorporate the European Parliament in our model.

6
empirical analysis we will concentrate on the 1981 Greek enlargement, the 1986
Southern enlargement, the 1995 Northern enlargement and the 2004 Eastern enlargement.
As to heterogeneity – according to veto player theory more divergent preferences
increase policy stability – we enact a range of scenarios that differently distribute the
actors in the policy space. In particular, we vary the standard deviation of the normal
distribution by which the actors are randomly placed on our policy dimension. For each
EU group size heterogeneity grows from a value of 0 to 50. For instance, for a low degree
of heterogeneity of 10, the actors are randomly placed within the policy space according
to the normal distribution with mean 50 and standard deviation 10. As the standard
deviation of the distribution increases, the actors are more widely dispersed around the
mean.
Once the actors’ ideal points are defined a reversion point is drawn from a
uniform distribution. Refraining from modeling a rational “agenda setter”, we assume
that the Commission makes a random proposal – also drawn from a uniform distribution.
Opting for the uniform distribution in the case of the reversion point and the
Commission’s proposal ensures that the average distance between the proposal and the
reversion point is equal across different levels of heterogeneity. If the reversion point and
the Commission’s proposal were drawn from the same normal distribution as the
members’ ideal points, this would imply that on average the Commission opts for a
greater policy change whenever the members are more heterogeneously distributed. It
would be impossible to say whether a reduction in the adoption rate is due to increased
heterogeneity or the Commission’s greater preference for change.

7
For each number of members and degree of heterogeneity constellation we
distinguish two decision-making rules: unanimity and qualified majority voting. The
qualified majorities are modeled according to the rules that were historically used in the
EU. We then assess 100,000 different policy situations for each constellation with 1000
different random seeds, i.e. 100 policy situations per random seed. Taking the averages
over these 100,000 policy situations per variable constellation produces the data
illustrated in Figure 1. The average adoption rates decrease from a proportion of .5 to
about .01 in the worst scenario of an EU 27 with heterogeneity of 50 in a unanimity
world. As expected, the adoption rates for QMV lie well above those of the unanimity
rule, for less members well above those for more members and for a lower degree of
heterogeneity well above those for a higher degree of heterogeneity.
Figure 1: Simulations of average adoption rates over group size and heterogeneity
The simulations produce explicit hypotheses on how an increase in group size
and/or a growing heterogeneity impacts on policy stability in our simple game. For
instance – assuming a fixed degree of heterogeneity of 20 – a change in group size from
six to nine members reduces the amount of legislation passed by approximately five per
8
cent. Empirically, the changes in EU group size are simply the enlargement rounds. But
how does heterogeneity change in the EU? While the general importance of preference
heterogeneity for decision-making is widely accepted in the literature (cf. Zimmer et al.
2005; König and Bräuninger 2001; König and Bräuninger 2004: 425; Dahl 1999; Drazen
2002) there is less agreement on how to operationalize the concept. We implement a
measure based on GDP, namely the standard deviation of GDP per capita for all EU
member states.3 Far from perfect, this measure varies over time and is the most general
economic indicator informing about the wealth of different EU member states. Given its
general character – GDP depends on economic development and structures and possibly
also informs about budgetary positions of the member states – this measure seems
particularly well suited to inform about heterogeneity across different policy areas.
Referring to Baldwin et al. (1997) and Kandogan (2000), König and Bräuninger (2004:
425) note that the expected dissimilarity between old and new member states in the case
of Eastern Enlargement was based on the fact that Eastern Enlargement increased the
population of the EU by 30% and GDP by only 4%. König and Bräuninger (2004) go on
to analyze the impact of Eastern Enlargement in the Agricultural sector by using GDP per
capita, i.e. wealth, as one indicator for future policy positions. Bauer and Zimmermann
(1999) illustrate the importance of GDP per capita for another issue area affected by
enlargement: migration. Taking into account the importance of the GDP measure for
various policy fields, we believe the variance in GDP per capita to be a plausible estimate
for group heterogeneity in the case of our aggregated analysis.4
3 Data for this variable is obtained from UNdata (http://data.un.org/Data.aspx?q=GDP&d=CDB&f=srID:29922). 4 Here, we make the assumption that the greater the variance in GDP per capita, the greater the variance in policy positions held at the European level. König and Bräuninger (2004) use a simple Tax Payers Model

9
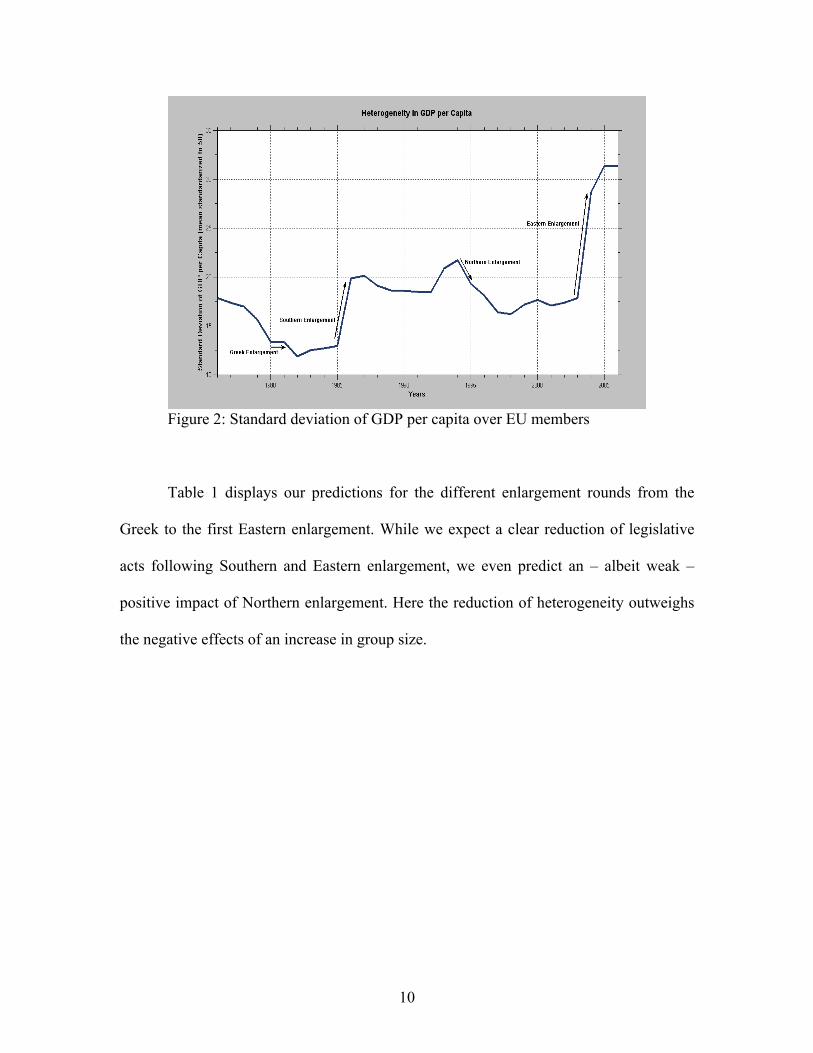
Figure 2 illustrates how the standard deviation of GDP per capita of the member
states – rescaled to a mean of 50 – has evolved over the past 30 years. While the Greek
enlargement displays no effect on our heterogeneity measure, the Southern enlargement
increases the degree of heterogeneity. The accession of Sweden, Finland, and Austria
again leads to greater homogeneity. Finally, Eastern enlargement shows the strongest
positive effect on the degree of heterogeneity.
Since the values in Figure 2 are rescaled to a mean of 50 we can plug them into
our simulations of Figure 1. Assuming a normal distribution of GDP per capita across the
member states, this allows us to formulate predictions about the changes in legislative
output that we expect to observe after the different EU enlargement rounds. We
distinguish a QMV and a unanimity scenario. For instance, in our simulations we do not
expect a strong effect for Greek enlargement. Since the degree of heterogeneity is stable
and just one additional member state is included this – in a QMV scenario – adds up to an
expected reduction of just .2 per cent. In the unanimity scenario we expect a reduction of
.6 per cent.
to derive hypotheses linking a macroeconomic indicator to ideal policy positions. In this model, a greater variance in the macro-level indicator leads to a greater variance in the ideal policy positions – supporting the assumption made here.
10
Figure 2: Standard deviation of GDP per capita over EU members
Table 1 displays our predictions for the different enlargement rounds from the
Greek to the first Eastern enlargement. While we expect a clear reduction of legislative
acts following Southern and Eastern enlargement, we even predict an – albeit weak –
positive impact of Northern enlargement. Here the reduction of heterogeneity outweighs
the negative effects of an increase in group size.

11

12
Group size effects are always stronger in the case of unanimity when compared to
QMV. With the exception of Eastern enlargement this also holds for the impact of
heterogeneity. Taking into account the levels of the adoption rates before Eastern
Enlargement in the case of QMV (.30) and unanimity (.06), the relative impact of the
increase in heterogeneity here, too, is larger under the unanimity rule.
In order to formulate predictions on the total outcomes we estimate the percentage
of acts adopted under QMV and unanimity for the different periods. We retrieve this
information from the dataset provided by König et al. (2006) that covers the period 1983
until 2003 and therefore unfortunately falls short of the post Nice period (for which we
therefore implement a linear prediction). In this dataset 71 per cent of the legislation
preceding the Single European Act is passed under QMV. QMV legislation rises to 76
per cent after the SEA comes into force. Then, surprisingly, QMV legislation drops to 60
per cent after the Maastricht treaty enters into force to then reach a low of 48 per cent,
following the Amsterdam Treaty implementation. Extrapolating this negative trend we
expect 42 per cent of QMV legislation after the Nice treaty. We can now estimate
weighted averages of the QMV and unanimity predictions. The weighted averages are
also displayed in Table 1 and predict the change in the number of acts adopted following
different enlargement rounds. We expect the strongest effects for Southern and Eastern
enlargement. After Southern enlargement legislative output should fall by 7.8 per cent.
After Eastern enlargement we predict a decline of 4.8 per cent.
13
Empirical Analysis
Research Design: Data and Methods
In order to test our theoretical predictions we use a new dataset covering the legislative
process of all binding acts adopted by the Council of Ministers between January 1976 and
December 2006.5 The unit of analysis is monthly legislative output. The dependent
variable is number of decisions, regulations, and directives adopted by the Council of
Ministers per month. It reaches its peak with 164 acts adopted in December 1985 prior to
Southern Enlargement and its minimum in various August months when European
politicians take their summer vacation. Our sample contains 372 monthly observations
with 12,899 adopted acts.6
Since the dependent variable counts legislative output, ordinary least squares
estimates can be inefficient, inconsistent, and biased (King 1988; Long 1997). We
therefore use maximum likelihood based count models. Because our data exhibits
overdispersion, i.e. the variance of the count is larger than its mean, we estimate negative
binomial regression models (cf. Long 1997: 230-238; King 1998: 51-52; Long and
Freeze 2006).
The time-span of our analysis includes four enlargement rounds. Our core
independent variables are group size and heterogeneity. Group size is enacted with
dummies for the different EU sizes as well as with a ‘members’ variable ranging from 9
5 The data was retrieved by deparsing the information from PreLex. 6 Our dataset is similar to the data presented by König et al. (2006). Whereas this dataset has the merit of combining information form PreLex and CELEX it neither covers the Greek accession of 1981 nor the two Eastern enlargement rounds in 2004 and 2007. König et al.’s (2006) dataset includes 2073 decisions, 5358 regulations, and 1044 directives adopted form January 1984 to January 2003. For the same period our dataset includes 2557 Decisions, 5642 Regulations, and 1017 Directives. Our dataset therefore contains an extra 741 legislative acts. These probably correspond to legislative acts dropped by König et al. (2006) when merging the CELEX and the PreLex datasets.

14
to 25. In line with our theoretical models, heterogeneity is measured as the standard
deviation of GDP per capita of the EU member states over time.
Table 2 Variables
Minimum Maximum Mean Standard Deviation
Dependent Variable Acts Adopted by the Council 0 164 34.67 29.48 Veto Player Factors EC10 0 1 0.16 0.37 EC12 0 1 0.29 0.45 EC15 0 1 0.30 0.46 EC25 0 1 0.09 0.28 Number of Members 9 25 13.22 4.23 Heterogeneity 2164.28 18401.09 6995.39 4275.62 Institutional Factors SEA in force 0 1 0.20 0.40 TEU in force 0 1 0.18 0.38 Amsterdam Treaty in force 0 1 0.12 0.33 Nice Treaty in force 0 1 0.13 0.33 Behavioral Factors Acts Submitted by the Commission 0 134 34.49 21.64 Delors 0 1 0.33 0.47 ANT1981 0 1 0.003 0.052 ANT1986 0 1 0.003 0.052 ANT1995 0 1 0.003 0.052 ANT2004 0 1 0.003 0.052 ANT2007 0 1 0.003 0.052
Table 2: Descriptive statistics
We control for the institutional setting by including dummy variables for different
treaty changes since the 1970s. These score one whenever a treaty change comes into
action and is not yet superseded by another treaty. We expect these variables to have a
positive effect if the extension of QMV to new policy sectors as well as widening the
15
scope of integration to different policy fields outweighs the strengthening of new veto
players like the European Parliament.
Since output demands input we include a variable that counts the number of
Commission proposals submitted to the Council each month. This variable is lagged by
four month, the median time it takes to pass EU legislation. It is expected to have a
positive effect. Further behavioral variables capture the effect of old members foreseeing
a future enlargement event and adapting their behavior accordingly. Forward looking
member states have incentives to increase legislative activity before newcomers enter the
club. We therefore expect legislative output to rise in the month preceding the accession
of new member states. This is captured by a dummy for every month preceding an
enlargement. The logic of this anticipation variable is discussed in more detail in Hertz
and Leuffen (2007) and rests on the rationality of the actors involved.7To account for the
historical boost of legislation of the single market program a ‘Delors’ variable captures
Jacques Delors’ Commission Presidency. Table 2 contains information on the descriptive
statistics.
In order to take longer time trends into account lagged dependent variables are
included in the models. They capture the effects of additional variables not covered in our
analysis. In addition, lagged dependent variables reduce autocorrelation. The lagged
variables are expected to positively affect legislative output.
7 In Hertz and Leuffen (2007) we, amongst other things, exclude acts that prepare enlargement so that we can be sure to capture effects on ‘normal’ legislative production.

16
Findings
Figure 3 plots the number of acts adopted per month from 1976 to 2006 as well as the
averages for each number of member states. We observe some pronounced monthly
variations. Some of the highest peaks fall into the month preceding the accession of new
member states. We see a rise in legislative output up until the early 1990s and a drop
thereafter. While on average legislative production increased after the first two
enlargement rounds in 1981 and 1986, it decreased after all subsequent enlargements. In
the EU15 on average 35.8 legislative acts were adopted per month. For the EU25, the
mean drops to 32.6 acts adopted per month. This reduction of around 9 per cent is not
statistically significant (z–value of 0.745).
Figure 3: Acts Adopted per Month
Our multivariate analysis supports this finding. Group-size does not seem to have
a statistically significant impact on the quantity of legislative output. Our baseline model

17
– model 1 – contains the Commission submission variable, the Delors dummy, the four
variables accounting for treaty reforms, the anticipation variables as well as yearly
dummies. A higher number of acts submitted by the Commission leads to a higher
number of acts adopted by the Council. While ‘Delors’, as well as the Amsterdam Treaty
and the Treaty of Nice do not influence the number of legislative acts adopted, more acts
were passed after the implementation of the Single European Act and the Maastricht
Treaty. The ‘anticipation’ variables are all positive and statistically significant. This
means that the number of acts adopted rises in the months preceding enlargement rounds.
In model 2 we add those variables that account for the increase in group size. Due to
collinearity, EU12 and EU25 are dropped from the analysis. In order to keep these
variables in the model we remove the variables accounting for the Delors Presidency, the
Amsterdam Treaty, and the Nice Treaty in model 3. All of these were statistically
insignificant in model 1. The variables accounting for the increase in group size are
interpreted as follows. The baseline of comparison is the EU9. The accession of Greece
(= ‘EU10’) therefore has no influence on the number of acts adopted per month. In the
case of the EU12 and the EU15 we find negative effects that, however, are only weakly
statistically significant. Only if we accept a ten per cent significance level we find a
reduction of legislation in the EU12 of about -42.9 per cent and in the EU15 of about
-43.1 per cent as compared to the EU9. In the EU25 statistically significantly lower
numbers of acts were adopted than in the EU9 (-67.5%). Tests for equality of the
different EU coefficients do not, however, reject equality between the EU12, EU15, and
the EU25 impacts. Thus, whilst more acts were adopted in the EU9 and the EU10, group
size changes do not make a difference beyond the EU12.

18
Table 3 - Effects of Group Size and Heterogeneity on EU Legislative Output
Model 1 Model 2 Model 3 Model 4 Model 5 Acts submitted by the Commission1 0.0048*** 0.0048*** 0.0047*** 0.0047*** 0.0047*** (0.0016) (0.0016) (0.0015) (0.0015) (0.0015) EU10 -0.1495 -0.2968 0.1276 (0.2837) (0.3036) (0.2101) EU122 -0.5608* -0.7203** (0.3306) (0.3213) EU15 0.5561 -0.5641* 0.5588 (0.3823) (0.3299) (0.3820) EU253 -1.1229** (0.5046) Heterogeneity 0.0000 (0.0000) Delors Presidency 0.1082 0.1052 (0.2058) (0.2055) SEA in force 0.6589** 0.6619** 0.5612** 0.5612** 0.5612** (0.2701) (0.2705) (0.2190) (0.2190) (0.2190) TEU in force 0.7355** 0.7335** 0.4671** 0.4671** 0.4671** (0.3134) (0.3134) (0.1933) (0.1933) (0.1933) Amsterdam Treaty in force 0.3884 0.3828 (0.4018) (0.4014) Nice Treaty in force 0.5072 0.5017 (0.4130) (0.4125) Anticipation of 1981 enlargement 1.7420*** 1.7352*** 1.7300*** 1.7300*** 1.7300*** (0.1860) (0.1858) (0.1859) (0.1859) (0.1859) Anticipation of 1986 enlargement 0.9147*** 0.9121*** 0.9561*** 0.9561*** 0.9561*** (0.1870) (0.1873) (0.1568) (0.1568) (0.1568) Anticipation of 1995 enlargement 0.6620*** 0.6572*** 0.6501*** 0.6501*** 0.6501*** (0.1938) (0.1946) (0.1940) (0.1940) (0.1940) Anticipation of 2004 enlargement 1.4963*** 1.1244*** 1.1270*** 1.1270*** 1.1270*** (0.1964) (0.3304) (0.3304) (0.3304) (0.3304) Anticipation of 2007 enlargement 0.8956*** 0.8943*** 0.8928*** 0.8928*** 0.8928*** (0.1267) (0.1267) (0.1265) (0.1265) (0.1265) Number of Members -0.0559 (0.0382) _cons 2.1566*** 2.3026*** 2.4500*** 2.5151*** 2.5479***
(0.2263) (0.1867) (0.2163) (0.1804) (0.5596)
lnalpha _cons -1.2528*** -1.2603*** -1.2578*** -1.2578*** -1.2578*** (0.1072) (0.1073) (0.1069) (0.1069) (0.1069) N 360 360 360 360 360 AIC 3067.941 3067.6732 3064.2631 3064.2631 3064.2631
BIC 3215.6130 3219.2313 3208.0489 3208.0489 3208.0489 Note: Robust Standard errors in parentheses. * = p < 0.1;** = p < 0.05; *** p < 0.01. All models include yearly dummy variables and lagged dependent variables (lag 12 and lag 6), accounting for time trends. 1: Acts submitted by the Commission is lagged by four months in all models. 2: Due to collinearity EU12 is dropped in model 2. 3: Due to collinearity EU25 is dropped in models 2, 4 and 5.

19
In model 4 we account for heterogeneity as measured by standard deviations of
GDP per capita. The coefficient of this variable is insignificant but this might be due to
multicollinearity (the EU25 variable is dropped from the model due to collinearity8 and
we observe high variance inflation factors9). Since other measures of heterogeneity
display similar effects we refrain from substantively interpreting the results of model 4
but rather reinterpret the results of model 3. Figure 2 illustrates that most of the largest
changes in heterogeneity occur together with group-size changes (and, in fact, the
‘heterogeneity’ variable and the ‘members’ variable correlate at a level of .93). It can
therefore be argued that the ‘EU’ variables in model 3 not only capture the group size
effect, but also the historical changes in heterogeneity. As such, group size and
heterogeneity effects are therefore only found for the early enlargement rounds. The last
two enlargement rounds do not seem to matter substantively. While this might not be so
surprising in terms of the Northern enlargement – it is rather surprising regarding Eastern
enlargement. The results are finally supported by model 5 in which group-size and
heterogeneity changes are captured by the ‘members’ variable. The variable is
insignificant indicating that over the whole time period no group-size and heterogeneity
effects can be observed.
While we do not find evidence for group size and heterogeneity effects after the
EU has reached 12 members, the anticipation variables point towards short run effects of
enlargement. Figure 4 graphs the number of legislative acts adopted in the months prior
to and following Eastern Enlargement in May 2004 minus the pre enlargement 3 year
8 Including the heterogeneity variable in logarithmic form does, unfortunately, not solve the problem. 9 The heterogeneity variable has a variance inflation factor above 10. Additionally, by including the heterogeneity variable the variance inflation factors for the EU15 and the EU25 variables increase by a multiple, with the VIF close to 10 for the EU15 and above 10 for the EU25.

20
averages for the specific months. We see that the output is well above the average in the
months preceding the accession of new member states and lies below the pre enlargement
averages after enlargement. Thus while the accession of new member states does not
seem to lead to long run quantitative consequences we detect short run effects. In our
view, the decline of legislative output directly following the accession of new member
states can be explained by anticipatory behavior of old member states rather than by
gridlock dynamics. Note, that the occurrence of anticipatory behavior points towards
possible qualitative effects of enlargement. If old member states decide issues before the
arrival of new member states they might want to avoid qualitative changes of policy –
given that there is not much evidence for quantitative effects of enlargement. This again
clearly underlines that qualitative effects deserve attention by future research.
Figure 4: Short run enlargement effects
21
Discussion
How do these empirical findings fit to our theoretical predictions derived above? When
interpreting the ‘EU’ variables in model 3 as capturing both the historical changes in
group size as well as in heterogeneity we need to compare the results of model 3 with the
last column of table 1. The empirical analysis indicates no effect for the Greek accession
and this is perfectly in line with our theoretical expectation (the adoption rate was
expected to decrease by only .3 percentage points). According to the simulations the
number of adopted acts should decrease by 7.8% after the Spanish and Portuguese
accession. Although we do not find support for a change in the number of acts adopted
when comparing the EU12 to the EU10, a significant negative effect is found when
comparing the EU12 to the EU9, indicating that the combined impact of Southern
Enlargement in 1986 and Greek Enlargement in 1981 have decreased the number of acts
adopted. In the case of Northern Enlargement theory predicts that group size and
heterogeneity effects cancel each other out. Indeed, we find no statistically significant
difference between the EU12 and the EU15. More surprisingly, however, we do not find
evidence for negative effects for the change from 15 to 25 member states. Theory had
predicted a reduction of 4.8 per cent.
The empirical relationships between group-size, preference heterogeneity and
policy stability are more complicated to disentangle than suggested by a simple veto
player setup. In our analysis we do not find strong evidence for increasing gridlock
dynamics due to enlargement. Not even Eastern enlargement with its clear increase in
size and heterogeneity has significantly shocked the EU. This, of course, comes as good
news for the EU. Our analysis suggests continuity in quantitative terms.

22
Two sets of explanations for our findings are conceivable. First, in our setup we
have neglected the role of the European Commission. This institution has enormous
agenda-setting powers and in anticipation of member state preferences it can adjust its
policy proposals to new coalitions. To take up an image introduced by Downs et al.
(1996), it is thus possible that the orchestra after an enlargement plays different tunes
than before. If the policies proposed by the Commission increasingly approach the status
quo this would still be in line with veto player theory. However, since we have only
analyzed quantitative output this qualitative dimension evades us. Future research could,
for instance, consider differentiating between ordinary and landmark legislation (cf.
Mayhew 1991).
A second explanation for our findings could be different group dynamics
alleviating the potentially negative effects of a change in group size. In sociological
approaches increasing group sizes can lead to changes in decision-making structures and
procedures. For instance, an increase of group size could lead to processes of
oligarchization, formalization or adaptation. According to an oligarchization scenario just
a few actors dominate in larger groups. Therefore the actual number of group members is
less important than the informal power structures. In contrast, formalization expects that a
growth in group size leads to a rationalization of decision-making processes. Finally,
adaptation would expect new member states to closely adjust to the behavior of old
member states. This would explain that we do not observe more conflicts between old
and new member states despite increasing heterogeneity in terms of structural variables.
So far, we cannot tell whether these theories actually apply to the case of EU

23
enlargement. However, they urge us to look more carefully into the mechanisms of post
enlargement governance.
Conclusion
The findings presented in this article are a first step to assess the effects of an increase in
the number of member states on EU legislative output. We start off by reviewing veto
player theory and run computer simulations in order to make predictions for the case of
the EU. Our simulations illustrate that the number of members in combination with
increasing heterogeneity should impact on policy-making. When turning to the empirical
tests the results, as a matter of fact, are less tidy. In contrast to many expectations raised
in academic and non-academic literature our analysis does not reveal a systematic
relationship between group size, heterogeneity and policy stability in the EU. This result
comes as good news for the EU – not even Eastern enlargement has lead to persisting
gridlocks. Not all of the theoretical predictions made by veto player theory are however
corroborated by our data. The dynamics of policy-making thus seem more complex than
suggested by this theory. But, of course, our analysis only investigates quantitative
effects and neglects possible qualitative consequences of enlargement. Future research
should thus take qualitative effects into account. Finally, the processes of post
enlargement governance also merit increased attention by future research.

24
References Albert, Max (2003) ‘The Voting Power Approach’, European Union Politics 4(3): 351-366. Alesina, Alberto and Spolaore, Enrico (2003) The Size of Nations. Cambridge: MIT Press. Baldwin, Richard E., Berglöf, Erik, Giavazzi, Francesco and Widgrén, Mika (2000) ‘EU Reforms for Tomorrow’s Europe’, CEPR Discussion Paper No. 2623, November 2000, London. Baldwin, Richard, Francois, Joseph and Portes, Richard (1997) ‘The Costs and Benefits of Eastern Enlargement: The Impact on the EU and Central Europe’, Economic Policy 12(24): 125–76. Baldwin, R. and Widgrén, M. (2003) ‘A study of the Constitutional Treaty’s Voting Reform Paradox’, CEPS Policy Brief No. 44, November 2003, Brussels. Baldwin, R. and Widgrén, M. (2004) ‘Council voting in the Constitutional Treaty: Devil in the details’, CEPS Policy Brief No. 53, July 2004, Brussels. Baldwin, R. and Widgrén, M. (2005) ‘The impact of Turkey’s membership on EU voting’, CEPS Policy Brief No. 62, February 2005, Brussels. Bauer, Thomas K. and Zimmermann, Klaus F. (1999) ‘Assessment of Possible Migration Pressure and its Labour Market Impact Following EU Enlargement to Central and Eastern Europe’, IZA Research Report No. 3, July 1999, Bonn. Bilbao, J.M., Fernández, J.R., Jiménez, N., López, J.J. (2002) ‘Voting power in the European Union enlargement’, European Journal of Operational Research 143: 181-196. Crombez, Christopher (1996) ‘Legislative Procedures in the European Community’, British Journal of Political Science 26: 199-228. Dahl, Robert A. (1999) ‘Can international organizations be democratic? A skeptic’s view?’, in Shapiro, Ian and Hacker-Cordón, Casiano (eds.) Democracy’s Edges, pp. 19-36. Cambridge: Cambridge University Press. Dobbins, M., Drüner, D. and Schneider, G. (2004) ‘Kopenhagener Konsequenzen: Gesetzgebung in der EU vor und nach der Erweiterung’, Zeitschrift für Parlamentsfragen 35(1): 51-67. Downs, George W., Rocke, David M. and Barsoom, Peter N. (1996) ‘Is the good news about compliance good news about cooperation?’, International Organization 50(3): 379-406.

25
Drazen, Alan (2002) Political Economy in Macroeconomics, Princeton: Princeton University Press. Felsenthal, Dan S., Leech, Dennis, List, Christian, Machover, Moshé (2003) ‘In Defence of Voting Power Analysis Responses to Albert’, European Union Politics 4(4): 473-497. Felsenthal, Dan S. and Machover, Moshé (2004) ‘A priori voting power: what is it all about?’, Political Studies Review 2:1-23. Garrett, Geoffrey and Tsebelis, George (1999) ‘Why resist the temptation to apply power indices to the European Union?’, Journal of Theoretical Politics 11(3): 291-308. Garrett, Geoffrey and Tsebelis, Georege (2001) ‘Even More Reasons to Resist the Temptations of Power Indices in the EU’, Journal of Theoretical Politics 13: 99-105. Hertz, Robin and Leuffen, Dirk (2007) ‘Anticipation in Legislative Politics: The Case of EU Enlargement’, Zurich: CIS Working Paper 32. Hörl, Björn, Warntjen, Andreas, and Wonka, Arndt (2005) ‘Built on Quicksand? A Decade of Procedural Spatial Models on EU Legislative Decision-Making’, Journal of European Public Policy 12(3): 592-606. Johnston, R.J. (1995) ‘The Conflict over Qualified Majority Voting in the European Union Council of Ministers: An Analysis of the UK Negotiating Stance Using Power Indices’, British Journal of Political Science 25(2): 245-254. Kandogan, Yener (2000) ‘Political Economy of Eastern Enlargement of the European Union: Budgetary Costs and Reforms in Voting Rules’, European Journal of Political Economy 16(4): 685–705. Kerremans, Bart (1998) ‘The Political and Institutional Consequences of Widening: Capacity and Control in an Enlarged Council’, in Pierre-Henri Laurent and Marc Maresceau (eds) The State of the European Union Deepening and Widening Vol. 4, pp. 87-109. London: Lynne Rienner Publishers. King, Gary (1988) ‘Statistical Models for Political Science Event Counts: Bias in Conventional Procedures and Evidence for the Exponential Poisson Regression Model’, American Journal of Political Science 32: 838-863. King, Gary (1998) Unifying Political Methodology. The Likelihood Theory of Statistical Inference. Ann Arbor: Michigan University Press. König, Thomas and Thomas Bräuninger (2000) ‘Governing the Enlarged European Union: Accession Scenarios and Institutional Reform’, Central European Political Science Review 1(1): 42–62.

26
König, Thomas und Bräuninger, Thomas (2004) ‘Accession and Reform of the European Union. A Game-Theoretical Analysis of Eastern Enlargement and the Constitutional Reform’, European Union Politics 5(4): 419-439. König, Thomas, Luetgert, Brooke and Dannwolf, Tanja (2006) ‘Quantifying European Legislative Research. Using CELEX and PreLex in EU Legislative Studies’, European Union Politics 7(4): 553-574. Lane, Jan-Erik and Berg, Sven (1999) ‘Relevance of Voting Power’, Journal of Theoretical Politics 11(3): 309-320. Leuffen (2006) ‘Die Folgen der Osterweiterung für das Regieren in der EU: rationales Handeln in angemessenen Bahnen?’, paper presented at the workshop Die Konsequenzen der Osterweiterung für die Europaforschung of the Wissenschaftszentrum Berlin, 31 March – 1 April 2006, Berlin. Long, Scott (1997) Regression Models for Categorial and Limited Dependent Variables. Thousand Oaks: Sage. Long, Scott and Freeze, Jeremy (2006) Regression Models for Categorical Dependent Variables using Stata. College Station, Texas: STATA-Press. Mayhew, David (1991) Divided We Govern. Party Control, Lawmaking, and Investigations 1946-1990. New Haven and London: Yale University Press. Michels, R. (1962) Political Parties: A Sociological Study of the Oligarchical Tendencies of Modern Democracy. New York: Free Press. Olson, Mancur (1965) The Logic of Collective Action: Public Goods and the Theory of Groups. Cambridge: Harvard University Press. Pajala, Antti and Widgrén, Mika (2004) ‘A priori versus empirical voting power in the EU Council of Ministers’, European Union Politics 5(1): 73-97. Romer, Thomas and Rosenthal, Howard (1978) ‘Political Resource Allocation, Controlled Agendas and the Status Quo’, Public Choice 33: 27-44. Simmel, Georg (1992) Soziologie. Untersuchungen über die Formen der Vergesellschaftung. Frankfurt a.M.: Suhrkamp. Steunenberg, Bernard (2002) ‘The effects of enlargement on EU decision-making’ in Steunenberg, Bernard (eds) Widening the European Union: The Politics of institutional change and reform, pp. 97-118. London: Routledge.

27
Steunenberg, Bernard, Schmidtchen, Dieter and Koboldt, Christian (1999) ‘Strategic Power in the European Union’, Journal of Theoretical Politics 11(3): 339-366. Tsebelis, George (2002) Veto Players How Political Institutions Work. Princeton NJ: Princeton University Press. Tsebelis, G. and Yataganas, X. (2002) ‘Veto Players and Decision-making in the EU After Nice: Policy Stability and Bureaucratic / Judicial Discretion’, Journal of Common Market Studies 40(2): 283-307. Weber, M. (1921) Wirtschaft und Gesellschaft: Grundriß der verstehenden Soziologie. Tübingen: J.C.B. Mohr. Zielonka, J. (2006) Europe as Empire. The Nature of the Enlarged European Union. Oxford: Oxford University Press. Zimmer, Christina, Schneider, Gerald and Dobbins, Michael (2005) ‘The Contested Council: Conflict Dimensions of an Intergovernmental EU Institution’, Political Studies 53: 403-422.


