
1
Business Opportunities in O&G Sector in Brazil. Joint Ventures Between Brazilian and Japanese Companies.

2
The presentation may contain forecasts about future events. Such forecasts merely reflect the expectations of the Company's management. Such terms as "anticipate", "believe", "expect", "forecast", "intend", "plan", "project", "seek", "should", along with similar or analogous expressions, are used to identify such forecasts. These predictions evidently involve risks and uncertainties, whether foreseen or not by the Company. Therefore, the future results of operations may differ from current expectations, and readers must not base their expectations exclusively on the information presented herein. The Company is not obliged to update the presentation/such forecasts in light of new information or future developments.
Cautionary Statement for US investorsThe United States Securities and Exchange Commission permits oil and gas companies, in their filings with the SEC, to disclose only proved reserves that a company has demonstrated by actual production or conclusive formation tests to be economically and legally producible under existing economic and operating conditions. We use certain terms in this presentation, such as oil and gas resources, that the SEC’s guidelines strictly prohibit us from including in filings with the SEC.
Forward Looking Statements Disclaimer

3
Petrobras Overview

4
Brazilian Constitution Amended
Nov 1995
PetrobrasNYSE Listing
August 2000
First PublicAuction of OilExploration Areas
June 1999
Full
Deregulation
January 2002
Brazil Self-Sufficient in Oil
April 2006
Petrobras: An Investment Grade, Publicly Traded, Major International Oil Company
• Incorporated in 1953 as government monopoly for all hydrocarbon activities in Brazil
• Originally established as a refinery of imported crude oil
• Became net exporter in 2006
• 60% of total equity capital (common and preferred) is now publicly traded
• Government maintains controlling interest with 55% of voting shares
• Market cap of approximately $260 billion, NYSE Listed, quarterly disclosure in US GAAP
• Foreign currency ratings from Moody’s of Baa1, Standard & Poors (BBB), and Fitch (BBB) (3, 1, and 1 notch above sovereign, respectively)
Upgraded to Investment Grade Issuer
October 2005
Crossed the$100 billion dollar Market Cap mark
2006
2MM bpd, $200MM market cap, Discovery of new oil frontier 2007
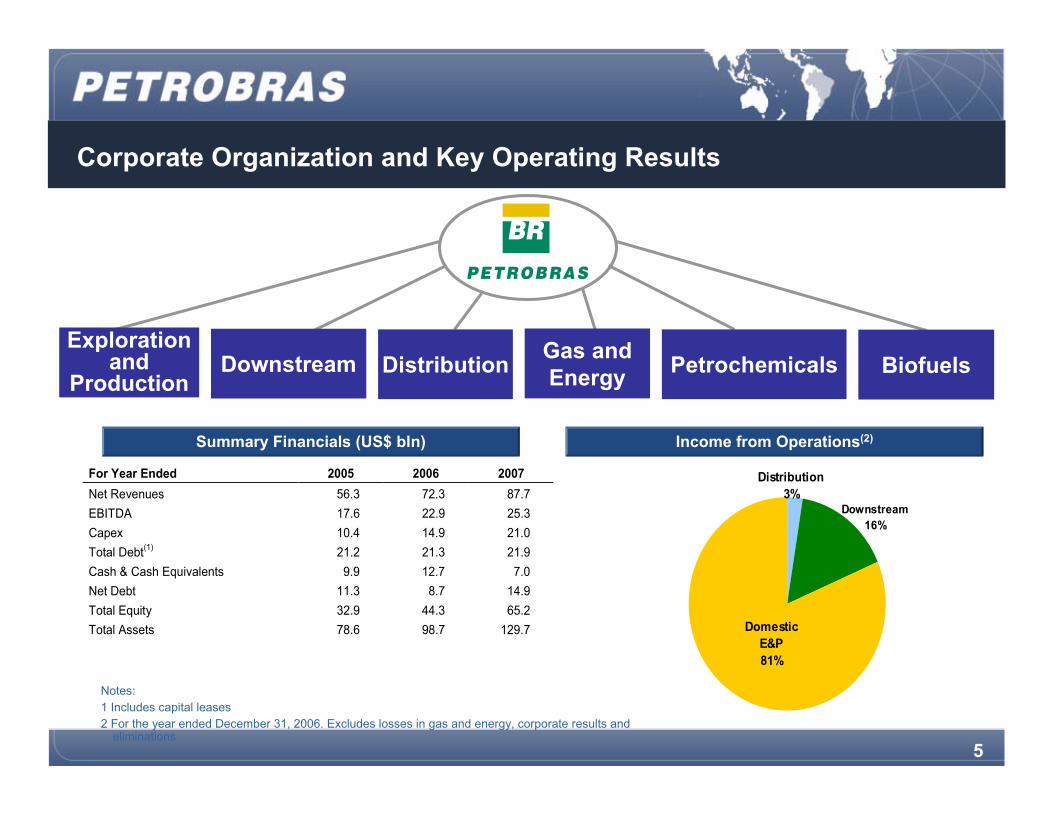
5
For Year Ended 2005 2006 2007 Net Revenues 56.3 72.3 87.7 EBITDA 17.6 22.9 25.3 Capex 10.4 14.9 21.0 Total Debt(1) 21.2 21.3 21.9 Cash & Cash Equivalents 9.9 12.7 7.0 Net Debt 11.3 8.7 14.9 Total Equity 32.9 44.3 65.2 Total Assets 78.6 98.7 129.7
Notes:1 Includes capital leases2 For the year ended December 31, 2006. Excludes losses in gas and energy, corporate results and
eliminations
Summary Financials (US$ bln) Income from Operations(2)
Corporate Organization and Key Operating Results
Exploration and
ProductionDownstream Gas and
Energy BiofuelsDistribution Petrochemicals
Downstream16%
Domestic E&P81%
Distribution3%

6
10.533 11.639 11.820 11.775 11.458 11.704
1.8102.036 2.020
2.217 2.298 2.301
2002 2003 2004 2005 2006 20070
1
1
2
2
3
Reserves MM BOEProduction M BOE/d
(M BBL/d)
(424) (559) (446) (488) (538)
446 409 523 581 615
ExportsImports
25,7236,13 40,75
58,58
79,9770,92
2002 2003 2004 2005 2006 2007
Production and Reserves (SEC)
Market Value (as of May 26, 2008)
Average Realization Price
Imports vs. Exports
2003 20052004 2006 2007
$’s/BBL
Improving Metrics and Proven Track Record
050.000
100.000150.000200.000250.000300.000350.000
Jan-02
Aug-02
Mar-03
Oct-03
May-04
Dec-04
Jul-05
Mar-06
Oct-06
May-07
Dec-07
296,772
(US$mm)
May08
Fonte: Evaluate Energy and Company Reports 2007 (*) Eni – Refining Throughputs

7
220 218 202 179
460
138177 12143
0100200300400500
ExxonMobil
Shell Total Eni Repsol
2006 Proven Reserves (SEC)
Market Value as of March 14, 2008
2007 Oil & Gas Production
2006 Refining Capacity
EniConocoPhillipsChevronBP
World Class Integrated Public Energy Company
(Bln boe) (‘000s boepd)
17,413,7 11,6 11,5
22,1
10,711,26,3
3,2
0,05,0
10,015,020,025,0
ExxonMobil
Shell Petrobras Total Repsol 1.039
1.7362.3012.3162.3242.593
3.2683.7714.180
0
1.000
2.000
3.000
4.000
ExxonMobil
BP Shell Chevron Conoco Total Petrobras Eni Repsol
Petrobras
(US$Bln) (‘000s boepd)
ChevronBP ConocoShell Total
(1)
ConocoPhillips Repsol
5341.234
2.1952.2082.2272.7002.8234.040
6.400
02.0004.000
6.0008.000
ExxonMobil
BP Petrobras Chevron Eni
Source: Company Filings, Company Website Source: Company Filings
Source: Company Filings, FactSet Source: Company Filings, Company Website
(1)

8
Upstream Overview

9
E&P - rapidly growing production profile
2 .8 122 .4 2 1
6 4 3
6 3 7
515
2 8 5151
18 3
8 0 9 8 6 9 1. 0 0 4 1. 13 2 1. 2 7 1 1. 3 3 6 1. 5 0 0 1. 5 4 0 1. 4 9 315 2 16 3
17 919 7
2 2 1 2 3 22 5 2 2 5 0 2 6 5
1. 7 9 21. 7 7 8
7 16
1. 6 8 4
2 7 32 7 7
13 4
2 7 4
12 616 33 5
4 45 36 0
4 54 73 82 5
16 1 16 814 2
10 9
10 9 1110
162 0 2 4
2 3 8 5 9 49 6 10 1
1995 1996 1997 1998 1999 2000 2001 2002 2003 2004 2005 2006 2007Oil and N GL - B razil N atural Gas - B razilOil and N GL - Internat io nal N atural Gas - Internat io nal
Thou
sand
boe
d
885 1.0081.090 1.238
1.5051.565 1.636
1.810 2.036 2.020 2.217
8,3% p.y.
2.298
3.494
4.153
8,7% p.y.
7,7% p.y.
* Includes non consolidated production
*
*
2012 Target
2015 Forecast
2.300

10
2.421
1.792
1.950*2.191
2.2962.374
1.600
1.800
2.000
2.200
2.400
2.600
2007 2008 2009 2010 2011 2012
Rio de JaneiroEspadarte Mód II
100.000 bpd6/jan/07
Rio de JaneiroEspadarte Mód II
100.000 bpd6/jan/07
Main Projects in Brazil – 2007-2012
RoncadorP-52
180.000 bpdNovember 2007
RoncadorP-52
180.000 bpdNovember 2007
RoncadorP-54
180.000 bpdNovember 2007
RoncadorP-54
180.000 bpdNovember 2007
Piranema30.000 bpd10/oct/07
Piranema30.000 bpd10/oct/07
Cidade de VitóriaGolfinho Mód. 2
100.000 bpdNovember 2007
Cidade de VitóriaGolfinho Mód. 2
100.000 bpdNovember 2007
Marlim LesteP-53
180.000 bpd2008
Marlim LesteP-53
180.000 bpd2008
Marlim Sul Módulo 2P-51
180.000 bpd2008
Marlim Sul Módulo 2P-51
180.000 bpd2008
Cidade NiteróiJabuti (FPSO)100.000 bpd
2008
Cidade NiteróiJabuti (FPSO)100.000 bpd
2008
Parque das Conchas
100.000 bpd
2009
Parque das Conchas
100.000 bpd
2009
Frade100.000 bpd
2009
Frade100.000 bpd
2009
Cachalote & Baleia Franca
FPSO Capixaba
100,000 bpd
2010
Cachalote & Baleia Franca
FPSO Capixaba
100,000 bpd
2010
Marlim SulMódulo 3 –
P-56100.000 bpd
2011
Marlim SulMódulo 3 –
P-56100.000 bpd
2011
Espadarte
Módulo 3
100.000 bpd
2012
Espadarte
Módulo 3
100.000 bpd
2012
Jubarte
P-57
180.000 bpd
2012
Jubarte
P-57
180.000 bpd
2012
Obs.: This curve does not include Tupi’s Pilot System Production
* Target may vary +/- 2.5%
TupiEWTUp to
30.000 bpd2009
TupiEWTUp to
30.000 bpd2009
Tupi
Pilot System
Up to 100.000 bpd
2010
Tupi
Pilot System
Up to 100.000 bpd
2010
Roncador
Module 4
P-62
100.000 bpd
2012
Roncador
Module 4
P-62
100.000 bpd
2012

11
Exploration Perspectives

12
Campos
Santos
EspíritoSanto
Golfinho/Canapú/ Peroá/Cangoá
Merluza/ Lagosta
Parquedas Baleias
Light Oil
Papa-Terra
BS-500
Pre-salt Cluster Blocks
Mexilhão
Roncador
Exploratory Perspectives in Brazilian Southeastern Margin

13
BM-S-21(Caramba)
BM-S-24(Jupiter)
BM-S-8(Bem-te-Vi)
BM-S-10(Parati)
BM-S-11(Tupi)
BM-S-22
BM-S-9(Carioca)
BM-S-17
BM-S-42
13
BM-S-50
BM-S-52(Corcovado)
(Yara)
(Guará)
Wells Being Drilled
Wells Drilled
Pre Salt – Santos Basin

14
E&P: UPCOMING UNITS
* Leased
Mauá-JurongNiterói/RJ2012ContractedOil:100.000 bpd
Gas: 6MM m3/diaRoncadorP-62
Mauá-JurongNiterói/RJ2009Under constructionGas: 15MM m3/diaMexilhãoPMXL-1
Atlântico SulSuape/PE
Rio Grande/RS2013
Hull contracted. Basic project under
revision.
Oil: 180.000 bpdGas: 6MM m3/diaRoncadorP-55
ProsafeKeppels -Cingapura
2S08Under constructionOil: 35.000 bpdGas: 10 MM m3/diaCamarupimCidade São
Mateus*
2011
2011
2S08
2S08
2S08
Start-up
Oil: 180.000 bpdGas: 2MM m3/dia
Oil:100.000 bpdGas: 6MM m3/dia
Oil: 180.000 bpdGas: 6MM m3/dia
Oil: 180.000 bpdGas: 6MM m3/dia
Oil: 100.000 bpdGas: 3,5 MM m3/dia
Capacity
Brasfels -FSTP Keppel & Technip
Angra/RJ
Under construction(P-51 Clone)Marlim SulP-56
SBMShipyard N/AContractedJubarteP-57
QuipRio Grande/RSUnder construction Marlim LesteP-53
Nuclep/BrasfelsAngra/RJUnder constructionMarlim SulP-51
ModecSipem - DubaiUnder constructionJabutiFPSO Cidade
de Niterói*
ShipyardStatusFieldUnits

15
E&P: Rigs
11
•Delba V•Delba VI•Scorpion•Delba VII•Delba VIII•Norbe IX•Schahin 1•Schahin 2•Norbe VIII•Petroserv•Etesco 8
Start Up 2012
28
• + 28 New Units to be leased
From 2013 to 2017
2
•Delba IV•Sevan Brasil
Start Up 2011
79Total
•Gold Star•Schahin I•Norbe VI•Delba III•SSV Victoria•W. Orion
•Lone Star•Schahin III•Petrorig II•Sevan Driller•W. Taurus•W.Eminence•Dave Beard
≥ 2000m
•Olinda Star•Ocean Worker
1000-1999m
•Petrobras XIV0-999m
Start Up 2010Start Up 2009Water Depth
• Stena Drillmax e Dep Water Millennium are not being considered since they are being negotiated in the Spot Market
• 29 Rigs contracted plus 28 to be leased up to 2017 making a total of 57 new drilling rigs.

16
New Vessels to be ContractedNew Vessels to be Contracted
Navio-sondaBarco de Apoio Navio de grande porte (VLCC) Plataforma de Produção (FPSO)Plataforma de Produção (FPSO)
Large Vessels
Supply Vessels
FPSO/SS
Others (jack-ups, TLWP)
Total
Leased/ Being Leased To be Leased26
24
6
3
59
44
122
8
1
175

17
Downstream Overview

18
Maintaining Balanced integration between Refining and Production
2,167
Total Refining Capacity (‘000s. bpd)Domestic Oil Production (‘000s. boed)
1,792
2,412Year 2012
2011: New Refinery in
Brazil to add 200 ‘000s. Bpd cap.New Refinery in
Texas expanded & upgraded
28%
13%
18%
4%
8%
8%
21%
Fuel QualityConversion
ExpansionHSE
TransportationPipelines
Others 6,112
2,264
2,270
1,083
5,353
3,938
8,619
Total Downstream Spending of $29.6 Billion

19
Complexo Petroquímico do Rio de Janeiro - COMPERJ
•Total Investment: US$ 8.4 billion (Petrobras Investment US$4.6 billion);• Throughput capacity: 150 thousand heavy oil barrels (Marlim oil from Campos Basin);• Start Up: 2012• Refining and Petrochemical Integrated Complex that through the use of new technologies process heavy oil to obtain oil products and first and second generation petrochemical products.
• Total Investment: US$ 4.1 billion (Petrobras Investment US$2.4 billion);• Throughput capacity: 200 thousand heavy oil barrels (60% Petrobras oil / 40% PDVSA oil);• Focusing diesel and LPG production maximization, the new refinery will aim the growth of oil products demand in the Northeast.
•The Northeast Region, which responds for 19% of oil products demand and holds only one refinery in Bahia, will no longer be a fuel importer (either from refineries in Brazil or abroad);• Costs reduction: oil products transportation are more expensive than for crude oil;• Start Up: 2011
Downstream Business Strategy
New Refinery in Pernambuco

20
Downstream Business Strategy – Northeast Region
Refinery in Rio Grande do Norte
Premium Refinery in Ceará
• Petrobras will deploy its 12th refinery in the state of Rio Grande do Norte.
• New plant to produce gasoline and improve the quality of other oil products (Jet fuel, Diesel and LPG) produced in existing facilities in Guamaré.
• Capacity: 80,000 bpd. Start-up scheduled for 2010.
• Petrobras will study, together with Ceará State, the possibility of installing a Premium refinery;
• Capacity: 300,000 bpd;
• The refinery’s first operation phase is scheduled to start in 2014.
• Petrobras will study, together with Maranhão State, the possibility of installing a Premium refinery;
• Capacity: 600,000 bpd;
• The refinery’s first operation phase is scheduled to start in 2013.
Premium Refinery in Maranhão

21
International Overview

22
International - Overview
Houston
Colombia
Argentina
Angola
United Kingdom.
USA
BRAZIL
Bolivia Rio de Janeiro
NigeriaVenezuela
EcuadorPeru
Mexico
Tanzania
Iran
EXPLORATION AND PRODUCTIONTRADING
HEAD OFFICE
REFININGREPRESENTATIVE OFFICE
New York
Tokyo
Beijing
Singapore
Libya
Mozambique
Uruguay
Turkey
Core Areas:
• Refining
• Add value to Brazilian heavy oil exports
• E&P: West Africa & Gulf of Mexico:
• Apply deep water and deep well drilling technology.
• Latin America:
• Leadership as an integrated energy company
Senegal
Jordan
Pakistan
India
Portugal
Paragay
Okinawa
23
Gas and Energy Overview

24
Domestic Natural Gas Market*
27,5
42,1
19,1
43,9
72,9
30,0
31,1
48,0120
20
40
60
80
100
120
140
160
2007 2012
Thermoelectric Industry Other
Million m3/day134 134
(*) considering maximum dispatch of every thermoelectric power plant• Other: vehicular, residential / commercial, refineries and fertilizer units. (**) Adjusted to STD Heat Value (9,400 Kcal/kg)
E&P**
Bolívia
LNG
58.6
Supply 2012

25
Plangás: Increasing Natural Gas Supply in the Southeast Region
• From the current 15.8 million cubic meters per day to 40 million in 2008 and 55 million in 2010.• Main Projects:
• Marlim and Roncador field in the Campos Basin, Merluza in Santos Basin and Peroá in Espírito Santo Basin.
Total Southeast in 2008: 40 MM m3/d
Additional: + 24,5 MM m3/d
Total Southeast in 2010: 55 MM m3/d
Additional: + 39,2 MM m3/d
Peroá Extension to 10MM m3/d
UTGC Extensionto 20MM m3/d
Cabiúnas/ReducExtension to 23MM m3/d
UTGCA Extension to 15MM m3/d
UPGN Cubatão Adaptation to 15MM m3/d

26
Pipelines Network
Manaus
Belém
Natal
Recife
Salvador
Rio de JaneiroSão Paulo
Porto Alegre
Cacimbas – Catu
Cabiúnas – Vitória
Caraguatatuba – Taubaté
Brasília
Catu – Carmópolis – Pilar
Campinas – Rio
Gasduc III e Japeri-Reduc
Gaspal II / Gasan II
Vitória -Cacimbas
Coari-Manaus
Gasbel II
Existing Pipelines
New Pipelines
Paulinia - Jacutinga
Expansão Gasbol Sul
GASENE

27
Renewables

28
Renewable Energy and Biofuels (2008-2012)
2008-2012 Investments 2012 Target
Biodiesel Plants Availability of 938 Thousand m3/year
H-Bio (Bio-Refining) Vegetable oil Processing 1.6 million m³/year
Installed Capacity of Generation of Electric Power from 365 MW Renewable Sources
Ethanol pipelinesExport of 4.7 billion m³/year of Ethanol
Aeolic Energy
29%
46%
21%
4%
Biofuels
Pipelines and Ethanol Pipelines
Others
H-Bio
US$ 1.5 billionInvestments
Total avoided GHG emissions: 3.93 MM tons CO2 equivalent
Ethanol Project Vessel
Solar Energy
Other Sources of Renewable Energy

29
Petrobras Investments to Export Ethanol
New Ethanol Pipeline (1.150 Km)
New Water Way for Ethanol
New Pipeline (1412 km)
New Ethanol Pipeline (919Km)
São Paulo Marine Terminal
Rio de JaneiroMarine Terminal
Replan – Ilha Dágua Pipeline (Current flow)
Tietê-Paraná Water way
Senador Canedo – São Sebastião Pipeline
Replan – Brasília Pipeline (OSBRA)
Replan – Guararema Pipeline
Existing Pipeline
Future Pipeline
Existing Terminal
Future Terminal
Exportation
Target: Export 4.75 MM cu.m/year in 2012
Large storage capacity necessary to regulate supplyPipelines reduce transport costs; improve energy efficiency
Ethanol collection, storage and distribution centers are spread out through producing and
consuming regions
Large scale marine terminals improve efficiency

30
Financial Considerations
31
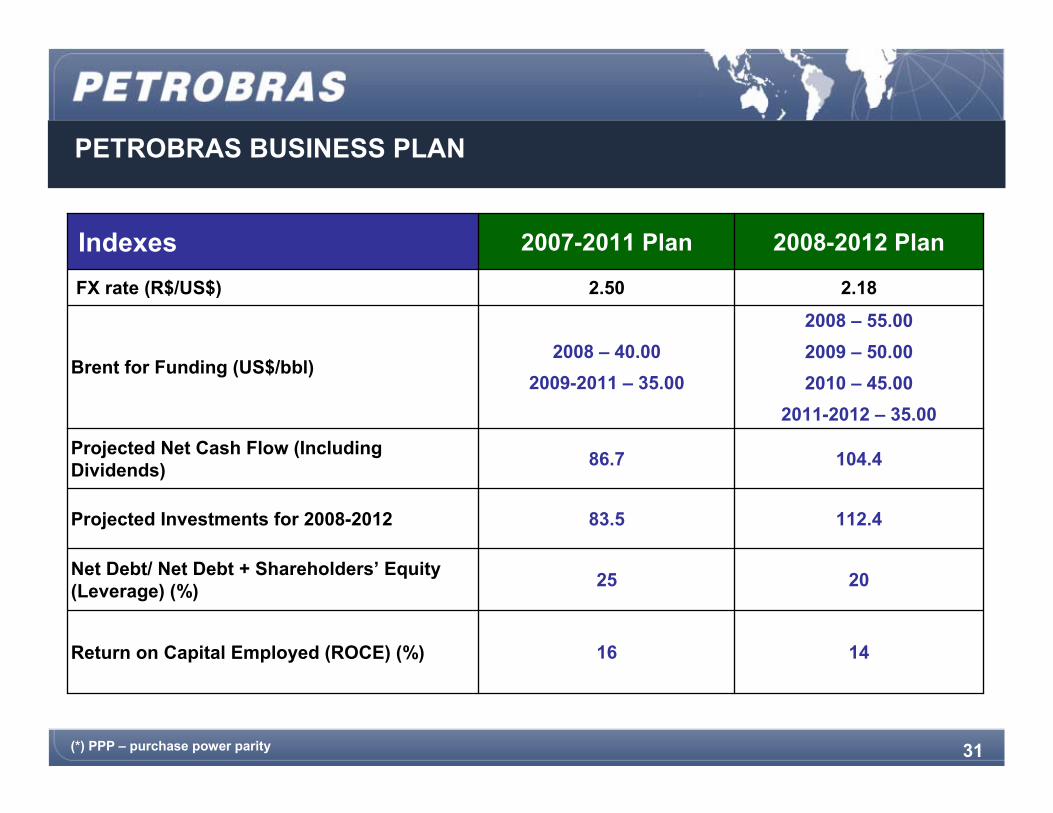
104.486.7Projected Net Cash Flow (Including Dividends)
1416Return on Capital Employed (ROCE) (%)
2025Net Debt/ Net Debt + Shareholders’ Equity (Leverage) (%)
112.483.5Projected Investments for 2008-2012
2008 – 40.002009-2011 – 35.00
2.50
2007-2011 Plan
2.18FX rate (R$/US$)
2008 – 55.002009 – 50.002010 – 45.00
2011-2012 – 35.00
Brent for Funding (US$/bbl)
2008-2012 PlanIndexes
(*) PPP – purchase power parity
PETROBRAS BUSINESS PLAN

32
6%4%
1%2%26%
58%
2%
65.1
29.6
6.74.3
2.62.6
Investment Plan by Business Segment2008-12 Period
US$ 112.4 billion
E&P RTC G&EPetrochemical Distribution Corporate Biofuel
1.5
• US$ 65.1 billion directed to E&P:
• Exploration: US$ 13.8 billion
• Production: US$ 51.3 billion
13%
87%
Brasil Internacional
97.4
15.0
Note: Includes International

33
CFFO(including W.C.)
Capex
Dividends
Consolidated Cash Flows74.3 BN 2003-2007
Source: Petrobras and Bloomberg
Strong returns have enable company to grow without increasing debt
0,0%
5,0%
10,0%
15,0%
20,0%
25,0%
2003 2004 2005 2006 2007
Historical ROCEU.S. GAAP
Operating Income and Assets by Segment -2007
(US GAAP – US$ Millions)
7,5961,83810,61514,48048,529PP&E (inc. Dep.)
291
446
Distri-bution
Int’lGas & Energy
Downstream (Brazil)
E&P(Brazil)
1,1446,0239,37113,558O/w Construction in Progress
(815)(834)2,78514,072Net Op. Inc.
Sources Uses
Inc. Debt

34
Capital Structure and Credit Metrics
(US$ MM)
2005 2006 2007 Cash and Cash Equivalents 9,871 12,688 6,987 Total Debt 21,177 21,338 21,895
Net Debt 11,306 8,650 14,908
Shareholders Equity 32,917 44,299 65,179 Net Income 10,344 12,826 13,138 EBITDA 17,638 22,923 25,333 Net Debt / Book Capital 26% 16% 18% Net Debt/ Market Capital 15% 8% 6% Net Debt / Boe Production (X) 13.9 10.3 15.4 Net Debt / Proved Reserves (X) 1.0 0.8 1.1 Reserves/Production (Years, SPE Criteria) 19.6 18.9 18.9

35
Infrastructure Enhancement
Critical Items Supply (imports)Drilling EquipmentsDynamic Positioning and Propeller SystemsSteel Manufacturing Process and Supply
Skilled Work Force for Construction and Operation
Financiability
Brazilian Oil Indutry Main Chalengies
Brasfels Shipyard at Angra dos Reis. P-51 and P-56 construction sites.
Rio Grande Shipyard under construction. Designed for platforms construction.

36
Results Expected
• Fulifl PETROBRAS Demand for Equipments ;
• Brazil O&G Industry Development into a Competitive Global Player.
PETROBRAS is committed to achieve its business interests with social and economic development responsibilities. It should assure an efficient supply chain of critical resources to its projects and perform its mission to enhance the sustainable development of Brazil and of the other countries where it is established.
Final Remarks

37
Thank You
Petrobras at a Glance - Results and Perspectives
For more information, visit our website: http://www.petrobras.com.br/ri/english


