
ANALYST PRESENTATION
BUSINESS PLAN TO 2022 The strategic approach of the BP is
consistent with the Group's mission and
confirms the focus on innovation,
agility, growth, efficiency and
excellence, to create shared value for
the benefit of all our stakeholders
“ “

Well executed tackling discontinuities
810
~1,020
(56)
+197 0 +69
A'13 Unexp.Negatives
Internalgrowth
Gastenders
M&A F'18
985 ~1,020
A'17 Growth F'18
Forecast 2018 Ebitda vs business plans target
01 GRUPPOHERA
Forecast 2018 Ebitda Ebitda ‘14-’18 in line with BP ‘14-’18 targets (M€) (M€)
+35 m€
+3.9% Cagr
+87 +103
ExpectationBP '17-'21
Outperformance A'17-F'18
+16 m€
Outperform BP ‘17-’21 avg Ebitda growth target
(M€)
+210 m€
+4.7% Cagr
BP '14-'18
+210 m€
5Y growth
1,020
EPS
+10% CAGR
EPS
+1% CAGR
Debt/Ebitda
2.54x
Debt/Ebitda
2.8x

Drivers & Targets to 2022
EBITDA GROWTH
since Group’s establishment
5.x
Well balanced business mix along with a coherent
and risk adverse strategy, underpins a fast,
uninterrupted and resilient growth. A solid base to
create value for all our main stakeholders.

At a glance Hera investment proposition and 2022 targets
02 GRUPPOHERA
Confirming our risk adverse and resilient equity story
Shareholders return Organic Growth
Financial soundness Merger & Acquisition
Business mix
Resilient
value
creation
+16% DPS
+260m€ capex
2.9x Debt/Ebitda
55% regulated
+120m€ growth
+80m€ growth

192
~1,020
'02 '03 '04 '05 '06 '07 '08 '09 '10 '11 '12 '13 '14 '15 '16 '17 'F18
Business mix: proven resiliency
03 GRUPPOHERA
Fully hedging for appropriate enterprise risk management
GDP WASTE
Leader in a short market
NETWORKS
Fully regulated
Inflated returns
ENERGY
Negligible power gen.
Business mix
The mix guarantees internal hedging (Ebitda M€, % change)
GDP negligibile impact
Regulated Liberalized
Brent
Hera supply Ebitda
0.0
50. 0
100 .0
150 .0
200 .0
250 .0
300 .0
350 .0
0.0
20. 0
40. 0
60. 0
80. 0
100 .0
120 .0
140 .0
160 .0
Spread Btp-Bund
Hera networks Ebitda
180 .0
230 .0
280 .0
330 .0
380 .0
430 .0
480 .0
0
100
200
300
400
500
600
'08 '09 '10 '11 '12 '13 '14 '15 '16 '17 '18
(M€, $/barrel)
Commodity price volatility: full hedged (M€, bps)
Spread: full protection of regulated activities
Ebitda
breakdown

15.0
19.0
21.4 17.4
2017 ExpectedMid '20
Upcoming discontinuities into the core businesses
04 GRUPPOHERA
Growth opportunities in both Network and Energy business
Ranking of Italian gas distributors Maggior Tutela client liberalization
1°
2°
3°
1.7 1.7 0.03
>50% <50% Total Avg. RAB intarget ATEMs
75%
(Mln point of delivery, Hera market share)
OrganicGrowth
(Mln clients, % share)
36m 36m
59%
41%
48%
52%
In mid 2020
available to
Free
market
~17m
customers
~38mln
customers
P2 6%
~17m
custom
ers
>0.5 new customers
HERA
Incumbent
50%
Other
27%
4.8% P4
3% P5
3% P6
2% P7
2%
Current
Free mkt shares Hera market share in reference territory

Waste MKT drivers
(Kg, %)
Organic Growth: main industry specific drivers
05 GRUPPOHERA
Favourable scenario to expand in all main sectors
Energy MKT : Client expansion
(% of customers increase in 5Y)
6.1% 6.3% 6.3%
5.6% 5.9% 5.9%
5.3% 5.3% 5.6%
'18 E'19 E'20 E'21 E'22
Gas Electricity Water
Network driver: Wacc interim review
'14 '15 '16 '17 '18
Maintaining past growth drivers
(CAGR %)
OrganicGrowth
591 587
294 243 220
104
S DK A D F I
* Source: Il Sole 24 Ore 17/11/2018
Waste treatment capacity/inhabitant* Treatment price increase
RAB increase +3.9% +4.2%
‘12-’17 ‘18-’22
+7.0% +4.0%
+7.4% +5.5%
W. treatment vol.
Energy clients
Utility 1 Utility 2
Hera, +22%
Utility 4
Multi-Utility 5 Multi-Utility 6
Utility 7
'13 '14 '15 '16 '17
0

Private
shareholders
Cash
payment
Market
multiples
multiple
400 companies
potentials
Private
shareholders
Cash
payment
Market
multiples
multiple
~1.5 clients
potentials
M&A: market fragmentation
06 GRUPPOHERA
Leveraging upon strong platform
Merger & Acquisitions 38 deals underpinned ~50% of Hera’s growth (M€)
Municipalities
shareholders
Share
Cash
payment
Hera
multiples
multiple
14 companies
potentials
Sis
ASC
25%
M&A
Mu
ltiu
tility
E
nerg
y
Wa
ste
Multi-utility Energy Waste
192
985
+335 +67
+391
A'02 M&A Synergies Org. Growth A'17

76%
07 GRUPPOHERA
Maintaining financial soundness
Expanding regulated infrastructures
Capex plan evolution A new cycle of infrastructure developments (B€) (B€)
0
250
500
750
'02 '04 '06 '08 '10 '12 '14 '16 '18 '20 '22
Depreciation Capex & Inv.
Renew/Develop assets
New expansion
of assets
Consolidate platform 2.07 2.22 2.45 2.86
1.98
1.14
BP to '18 BP to '19 BP to '20 BP to '21 BP to '22
‘22 Debt/Ebitda
2.9x ‘21 Debt/Ebitda
2.9x
OrganicGrowth
Financial soundness
3.12
Maintenance
Development
(B€)
Development projects
+0.26
+1.14
+0.42
+0.47
+0.26
Org. Devel. Gas tenders M&A Devel. capex68%
‘02-’17
380m€ avg capex
‘18-’22
624m€ avg capex
regulated
liberalized

08 GRUPPOHERA
A credible step up vs. last business plan
Ebitda target to 2022
Ebitda drivers ‘Stand alone’ Ebitda targets (M€, Ebitda targets excluding M&A) (M€)
917
2016 2017 2018 2019 2020 2021 2022
Old Plan New Plan
Resilient
growth
985
1,185
(10)
+98 +32 +80
A'17 Negatives Org.Growth
Gas Tenders
M&A E'22
+200 m€ +3.8% Cagr
Internal growth
+31
+40

Business targets to 2022
5Y infrastructure expansion
3.1b€
We addressed the evolution of our activities to enhance
the quality and resilience of our services to customers.
Targeting to execute the largest infrastructural
development ever sustained and the evolution of services
to further embrace the key goals for a new (sustainable)
delivery model.

Hera strategic development goals and key priorities
Play a key role in the territorial
social-eco system
Promote efficient use of
resources
Develop Innovative solution (Utility 4.0)
Agility Efficiency
Innovation Excellence
Network
Waste
Energy
Gro
wth
Ecosystem
Circularity & decarbonisation
Technology
The “Why”: Strategic goals and key priorities inspired by SDGs
09 GRUPPOHERA

Commercial offer: Aliplast wider proposal
Waste: development drivers
10 GRUPPOHERA
Concrete actions consistent with trends Waste tenders
(# of industrial clients)
Commercial expansion: Industrial clients
Intelligent w. container
57.7%
73.2%
'17 F'18 E'19 E'20 E'21 E'22
4,100
4,500
'17 '22
+
-
# o
f clie
nts
+10%
PET
Enlarge
procurement
Novara plant
Focus on
specialties
LDPE
HDPE
PP Type of
polymer
Actions
Enlarge extrusion
cap. exploiting
incoming vol.
Develop foreign
mkts for recycled
mat.
Enter this
polymer
recycling
Ongoing
evaluation to
enter this
segment
Enabling the adoption of “circularity” by client
Sorted waste collection
• Pay per use tariff
• Develop special
waste plant for
material recovery
• Collection tenders
• Biomethane
• Further penetrate
“Plastic recycling”
segments
• Green diesel
• Bio-plastic
• Develop “smart”
urban waste
container
• Digitalization and
real time data
collection/analytics

417
201
Maintenance
Development246.0
297.3
(8.0)
+46.7 +12.6
A'17 Negatives Int. Growth M&A E'22
Volume mgmt to reach 8.3 Mtons
Waste: targets to 2022
11 GRUPPOHERA
Italian structural shortage of capacity will underpin prices
(M€)
Ebitda drivers Capex
(Mtons/year, treatment mix %)
Well ahead on EU schedules
(M€)
• 2 Bio-methane
• 2 WTEs revamping
• Landfills expansion
65%
within 2030
✔
10Y in advance
<10%
within 2030
✔
Already today
>65% within
2025
✔
5Y in advance
EU target
Hera
Urban Waste
recycled
Urban Waste
in landfills
Packaging
recycling
0.9 0.9
A'17 E'22
3.7
4.5
A'17 E'22
2.3 2.9
A'17 E'22
Disposal Treatments Third parties 10% 55% 35%

Networks: development drivers
12 GRUPPOHERA
Further value from innovation and resilience
Demand response & Smart District Heating
Real time remote
control to be eligible
for Terna’s flexibility
services (UVAM)
9 UVAM systems
10MW
Sensors installation
Improvement in
monitoring operations
Real time regulation
1,100 substations
replacement
1.8GWh saved in ‘22
Plants Networks Substations
Concrete actions consistent with trends
• Regenerate water
sources
• Smart city enabler
• Quality of services
• D.H. smart
solutions
• Roll- out new
generation meters
• Real time and
remote mgmt
• Water mgmt for
industrial clients
• Re-use sewage
water
• Sludges for biogas
• Geothermal
partnership
Water management projects
Water leakages
Strengthening leakage detection
Smart Districts
IoT & Remote control
25% of network length inspected
Water mgmt project
Promote responsible use of
water
Water consumption monitoring
and optimization
Develop water reuse/energy
efficiency
-10% Group water consumption
Capex deployed to improve resiliency
(M€)
419
624 162
39 4
Water Gas Electricity D.H. Total

1.09 1.63
0.25
+0.54
0.32 1.44
+0.07 +0.18
1.62 0.38
+0.00
0.38 0.23
(0.01) 0.22
2017 Gas Water Electricity D.H. E2022
423.5
580.7
(2)
+78.0 +31.8 +49.4
A'17 Incentives Org.Growth
Gastenders
M&A E'22
1,291
885
Maintenance
Development
Networks: targets to 2022
13 GRUPPOHERA Our safety platform
(M€)
Ebitda drivers Capex
(B€)
RAB growth
(M€)
• 470 m€ tenders
• 415 m€ developm.
and M&A
4.10
3.34
Excellence and investment pay
(M€)
1.6
3.2
4.9
4.0
'16 '17 E'22
Commercial quality Technical quality
8.9
Electric mobility
Energy: development drivers
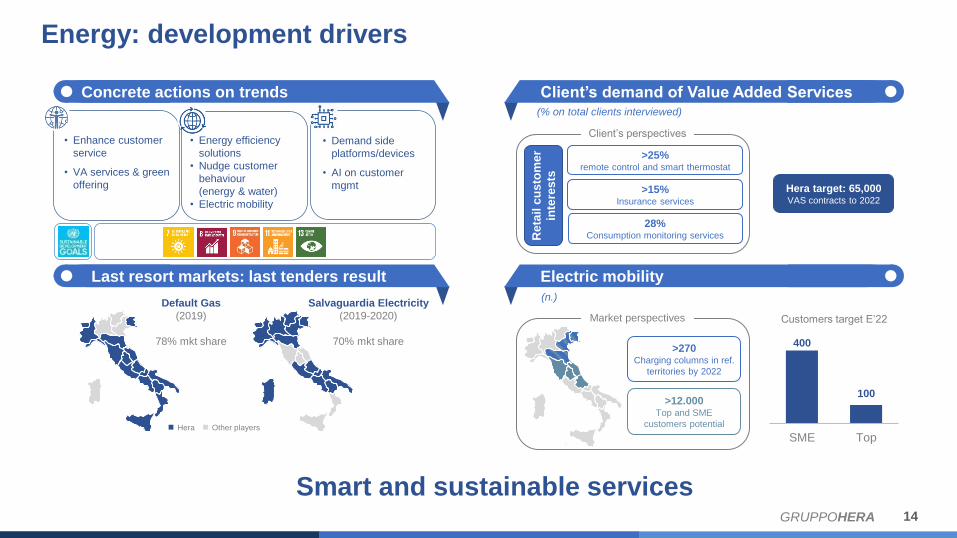
14 GRUPPOHERA
Client’s demand of Value Added Services
Last resort markets: last tenders result
Customers target E’22
Default Gas
(2019)
78% mkt share
Salvaguardia Electricity
(2019-2020)
70% mkt share
Hera Other players
>25%
remote control and smart thermostat
>15% Insurance services
28% Consumption monitoring services R
eta
il c
us
tom
er
inte
res
ts
Hera target: 65,000 VAS contracts to 2022
400
100
SME Top
(n.)
>270
Charging columns in ref.
territories by 2022
Smart and sustainable services
(% on total clients interviewed)
>12.000
Top and SME
customers potential
Market perspectives
Client’s perspectives • Enhance customer
service
• VA services & green
offering
• Demand side
platforms/devices
• AI on customer
mgmt
Concrete actions on trends
• Energy efficiency
solutions
• Nudge customer
behaviour
(energy & water)
• Electric mobility

'14 '15 '16 '17Avg. Italy Hera
'14 '15 '16 '17
25.1 25.5
A'17 Inflation Efficiencies E'22
2.4 >3
+0.2 +0.5
A'17 OrganicGrowth
Newopportunities
E'22
292.6 268.3
(40.5)
+16.3
A'17 Org. Growth M&A E'22
Churn rate: -30% lower than avg market
Energy: targets to 2022
15 GRUPPOHERA
Remain solid nevertheless resizing of “Safeguarded”
(M€)
Ebitda drivers Customer base
(€/Pod)
Cost to serve: flat through the Plan
(Mln)
(%)
Retail gas supply Retail electricity supply

Ebitda and more
16 GRUPPOHERA
Confirming financial soundness
Ebitda by activities
+4.0
+0.7
(0.3) (0.2)
(2.0) (0.8)
Op. CF NWC Provisions Maint.capex
Dividends FCF
Cum. cash flows ‘18-’22 before dev. capex (B€)
Lev. Lev.
51%
49%
55%
45% 985
1,185
+157
+51 (24) +16
A'17 Networks Waste Energy Other E'22
+200 m€
+3.8% Cagr
(M€)
regulated liberalized
+1.14
+0.42
+0.26
+0.47
Org. Devel. M&A Gas tenders Devel. capex
Development capex & other financials (B€)
Debt/Ebitda
~ 2.2x
Debt/Ebitda
2.9x
Cost of Debt
3.7% stable
Tax rate
~30% stable

WHY As there is no Plan(et) B, we have the responsibility for
reconnect business with the environment and society to the
benefit of present and future generations
HOW Sustainability connects businesses to the community and the
environment evolving toward a more resilient ecosystem
WHAT We are planning to increase the Shared Value in the BP
period
EBITDA from CSV activities
as at 2022
40%

Concretely acting as a benefit corporation throughout the business
17 GRUPPOHERA
75% of Ebitda growth target enhance CSV
Creating Shared Value in 2022 (Creation of Shared Value, M€)
Territory
Energy
Resources
HERA CSR
Territory
Resources
Energy
~470m€
40%
Group Ebitda
UN global goal addressed
Innovation &
development of
territorial social-
eco systems
Smart use of
energy
Efficient use of
resources
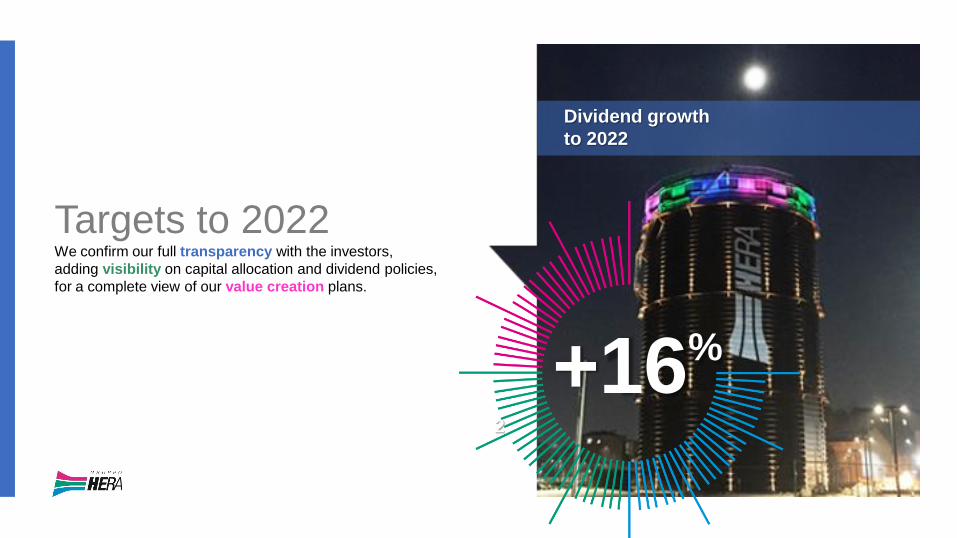
Targets to 2022 We confirm our full transparency with the investors,
adding visibility on capital allocation and dividend policies,
for a complete view of our value creation plans.
+16%
2
Dividend growth
to 2022

Closing remarks
18 GRUPPOHERA
Reliable, visible and sustainable growing perspectives
Comment Dividend per Share (€ cent)
• This business plan is reflecting our usual risk
management attitude, aiming at setting reliable
and visible targets in line with our track record.
• Sizable capex, underpin a solid growth and a
lower risk profile, developing an asset base to
sustain a smarter and technologically intensive
Ecosystem.
• Dividend policy: DPS further growth up to 11 c€
(+16%) in 2022.
9.5
10.0 10.0
10.5 10.5
11.0
'17 '18 '19 '20 '21 '22
+16%

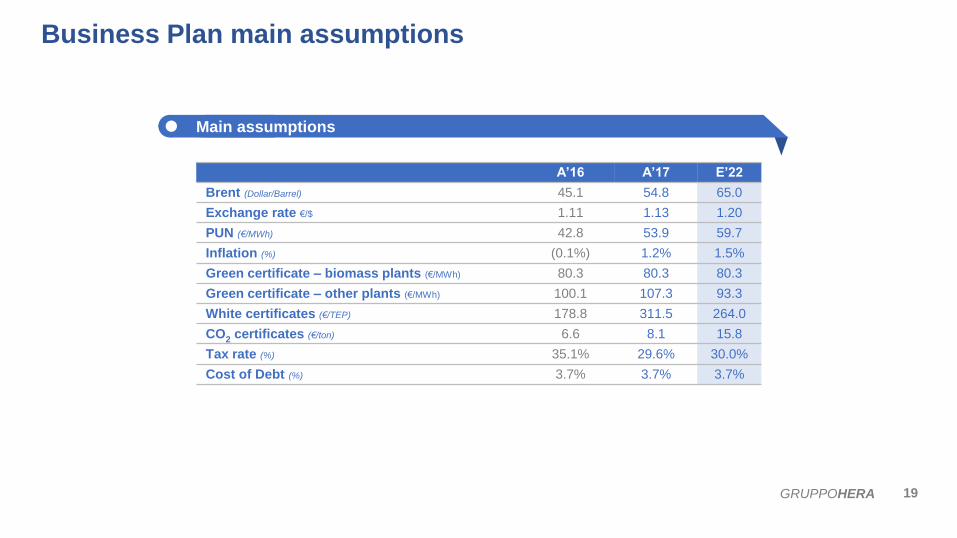
A’16 A’17 E’22
Brent (Dollar/Barrel) 45.1 54.8 65.0
Exchange rate €/$ 1.11 1.13 1.20
PUN (€/MWh) 42.8 53.9 59.7
Inflation (%) (0.1%) 1.2% 1.5%
Green certificate – biomass plants (€/MWh) 80.3 80.3 80.3
Green certificate – other plants (€/MWh) 100.1 107.3 93.3
White certificates (€/TEP) 178.8 311.5 264.0
CO2 certificates (€/ton) 6.6 8.1 15.8
Tax rate (%) 35.1% 29.6% 30.0%
Cost of Debt (%) 3.7% 3.7% 3.7%
19 GRUPPOHERA
Business Plan main assumptions
Main assumptions

20 GRUPPOHERA
Energy 167
Waste 122
Networks 264
Other 22
Energy 188
Waste 89
Networks 195
Other 7
A’17 E’22
479 m€ 575 m€
Consolidated Group Ebit target
Ebit by strategic area
(M€)
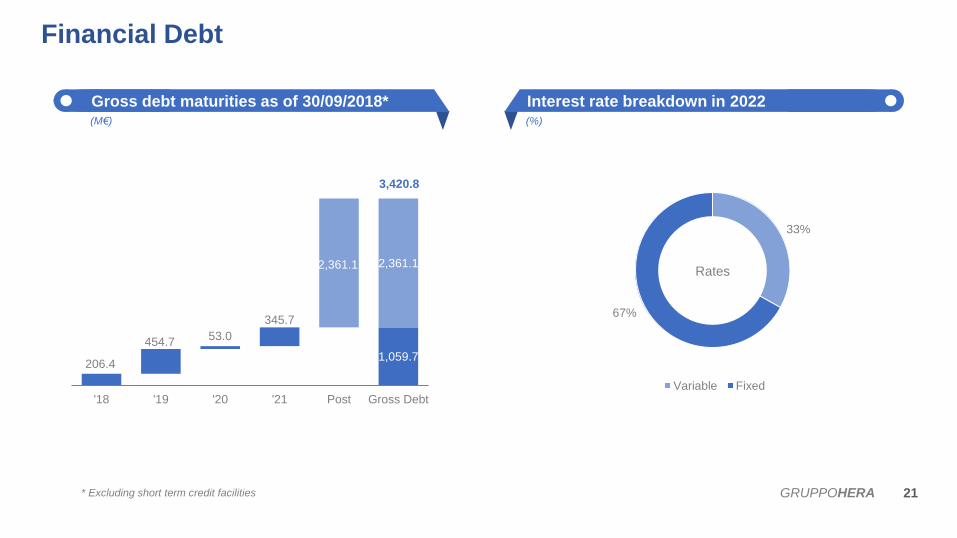
206.4 1,059.7
454.7 53.0
345.7
2,361.1 2,361.1
'18 '19 '20 '21 Post Gross Debt
33%
67%
Variable Fixed
Rates
21 GRUPPOHERA
3,420.8
* Excluding short term credit facilities
Financial Debt
Gross debt maturities as of 30/09/2018* Interest rate breakdown in 2022 (%) (M€)

22 GRUPPOHERA
Highlights
(M€)
Economics Capex E’18-E’22: 618 m€
Ebitda breakdown
(M€)
(M€)
246.0 297.3
A'17 E'22Collection Treatment
A’17 E’22
EBITDA 246.0 297.3
A'17 E'18 E'19 E'20 E'21 E'22
* Excluding volumes from M&A
A’17 E’22*
Waste treated 6,802 8,278
Urban 2,041 2,190
Special 2,526 3,203
by products 2,235 2,885
Waste business

23 GRUPPOHERA
RAB
(M€)
Economics Capex E’18-E’22: 828 m€
Volumes sold
(M€)
(Mmc) (B€)
303 292*
A'17 E'22
*Numbers exclude M&A
A'17 E'18 E'19 E'20 E'21 E'22
A’17 E’22
EBITDA 229.9 286.9
A’17 E’22*
RAB* 1,44 1,62
Water business

24 GRUPPOHERA
Highlights
(M€)
Economics Capex E’18-E’22: 1,339 m€
Ebitda breakdown
(M€)
(M€)
301.7
386.1
A'17 E'22
Gas distribution Gas sales District Heating Heat management *Numbers exclude M&A and third parties RAB
A’17 E’22*
Volume Sales &Trading (Mcm) 5,217 3,462
RAB (B€) 1,09 1,63
A'17 E'18 E'19 E'20 E'21 E'22
Capex Gas tenders
A’17 E’22
EBITDA 301.7 386.1
Gas business

25 GRUPPOHERA
Highlights
(M€)
Economics Capex E’18-E’22: 259 m€
Ebitda breakdown
(M€)
(M€)
A’17 E’22*
Volume Sold (TWh) 10.5 10.6
RAB (B€) 0.38 0.38
184.5 176.1
A'17 E'22
Electricity distribution Electricity sales Power Generation*Numbers exclude M&A
A’17 E’22
EBITDA 184.5 176.1
A'17 E'18 E'19 E'20 E'21 E'22
Electricity business

This presentation contains forward-looking statements regarding future events (which impact the Hera Group’s future
results) that are based on current expectations, estimates and opinions of management.
These forward-looking statements are subject to risks, uncertainties and events that are unpredictable and depend on
circumstances that might change in future.
As a result, any expectation on Group results and estimates set out in this presentation may differ significantly depending
on changes in the unpredictable circumstances on which they are based.
Therefore, any forward -looking statement made by or on behalf of the Hera Group refer on the date they are made.
The Hera Group shall not undertake to update forward-looking statements to reflect any changes in the Group’s
expectations or in the events, conditions or circumstances on which any such statements are based.
Nevertheless, the Hera Group has a “profit warning policy”, in accordance with Italian laws, that shall notify the market
(under “price-sensitive” communication rules) regarding any “sensible change” that might occur in Group expectations on
future results.
26 GRUPPOHERA
Disclaimer


