Calculating the effect of employee
stock options on diluted EPS
Warrick van Zyl
Enrico Uliana

Diluted Earnings per Share
Calculating DEPS
Question?
◼ What is the best method to use for
calculating DEPS when the firm has
outstanding ESOs?
Who cares?
◼ Pervasive use of EPS/DEPS/PE Ratio
Only accounting metric quoted by AFR
and Google Finance
Analysts forecast DEPS (Marquardt and
Wiedman 2005)
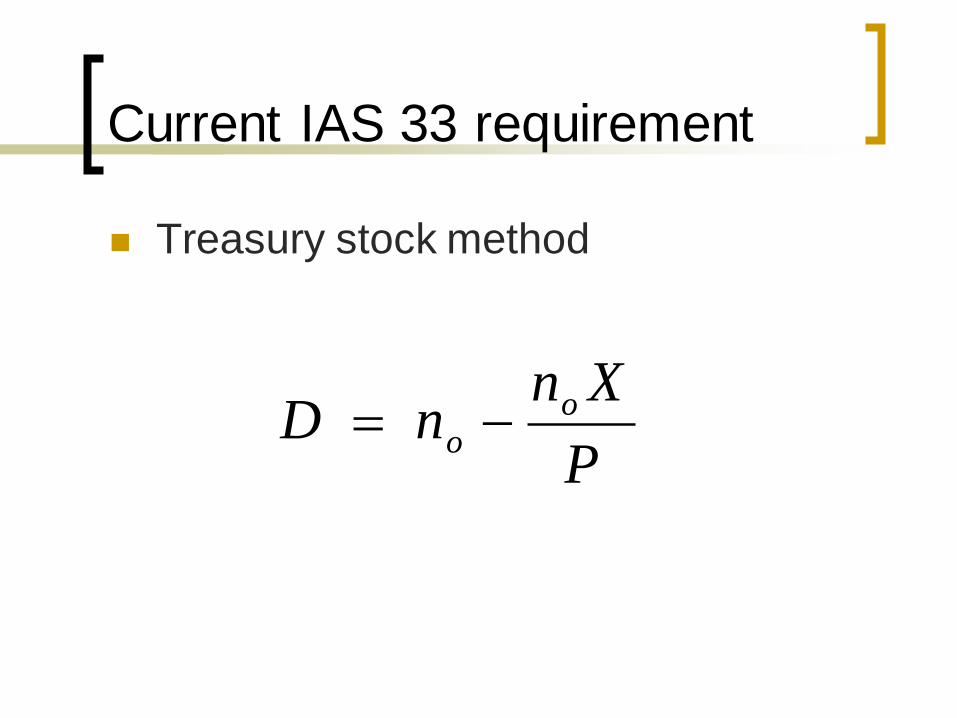
Current IAS 33 requirement
◼ Treasury stock method
P
Xn nD o
o −=
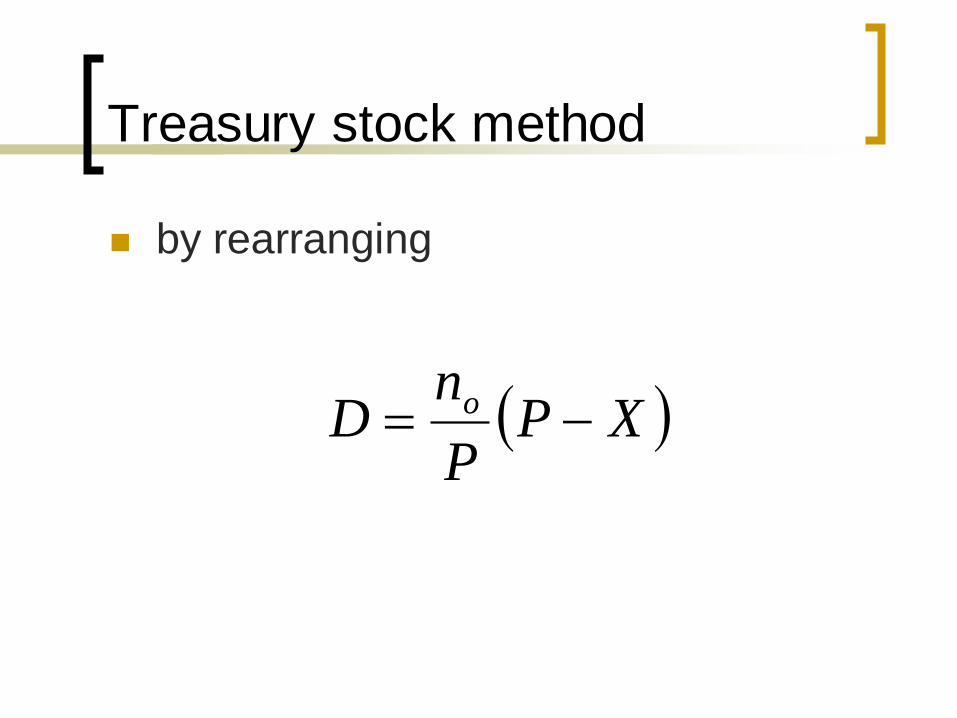
Treasury stock method
◼ by rearranging
( )XPP
nD o −=
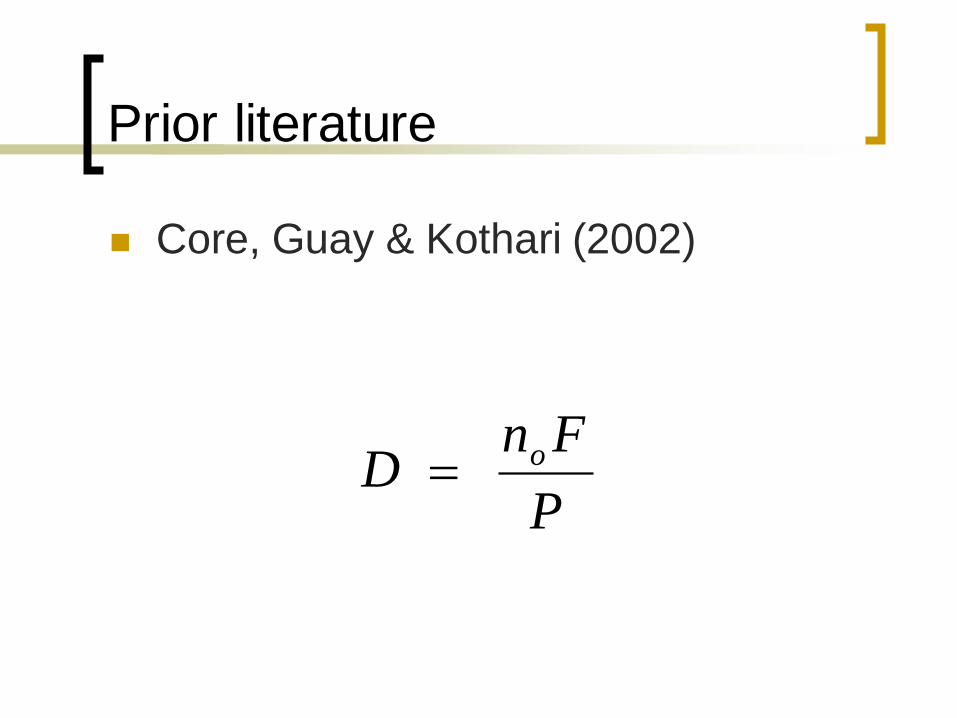
Prior literature
◼ Core, Guay & Kothari (2002)
P
Fn D o=

Prior literature
◼ Landsman, Peasnell, Pope & Yeh
(2006)
within the Ohlson (1995) framework
ESOs should be treated as a liability
carried at fair value
This research
◼ Again use Ohlson (1995) framework
◼ adapted for ESOs by Hess &
Lüders(2001)
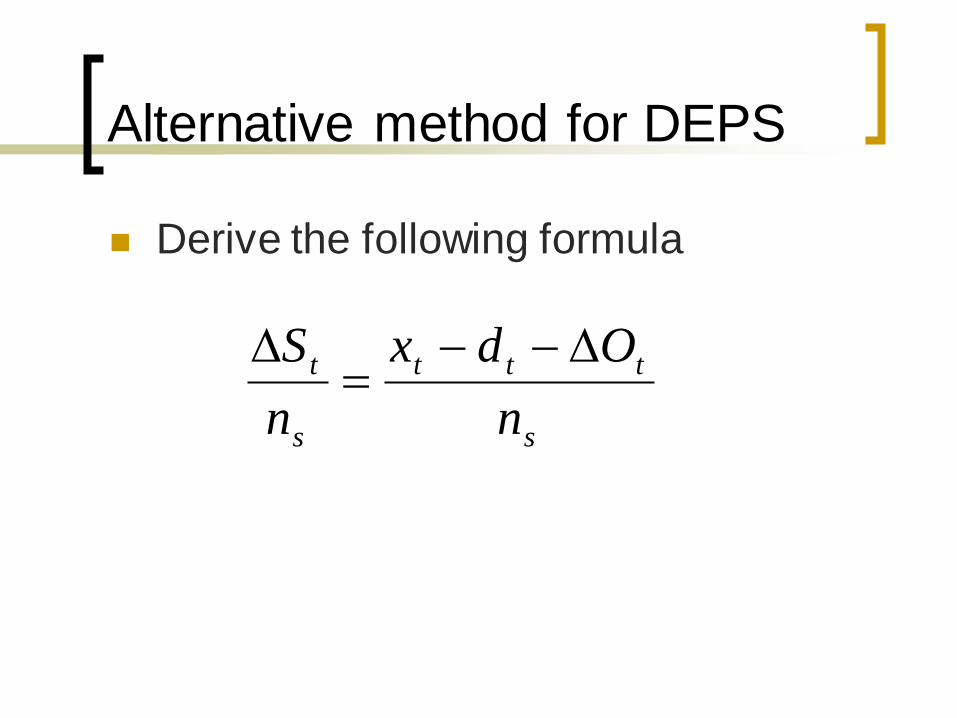
Alternative method for DEPS
◼ Derive the following formula
s
ttt
s
t
n
Odx
n
S −−=
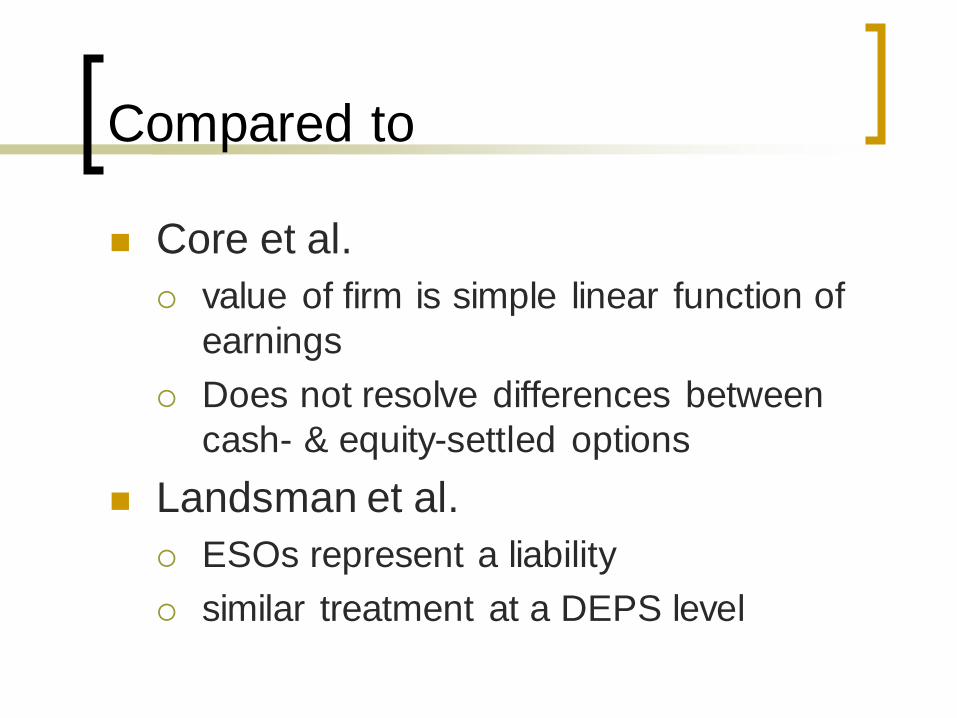
Compared to
◼ Core et al.
value of firm is simple linear function of
earnings
Does not resolve differences between
cash- & equity-settled options
◼ Landsman et al.
ESOs represent a liability
similar treatment at a DEPS level
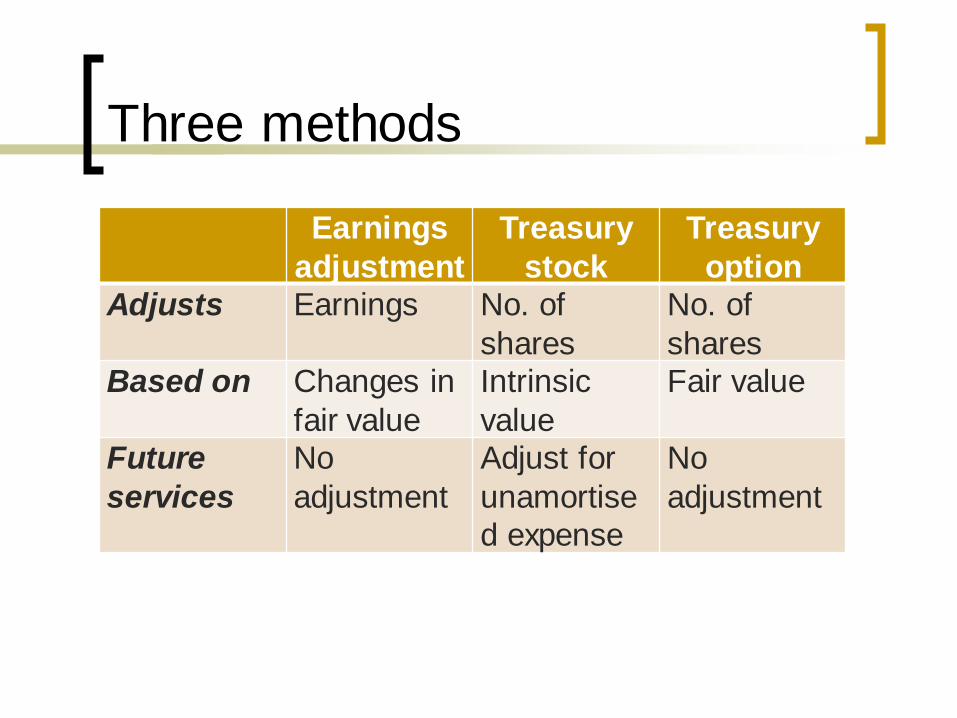
Three methods
Earnings
adjustment
Treasury
stock
Treasury
option
Adjusts Earnings No. of
shares
No. of
shares
Based on Changes in
fair value
Intrinsic
value
Fair value
Future
services
No
adjustment
Adjust for
unamortise
d expense
No
adjustment
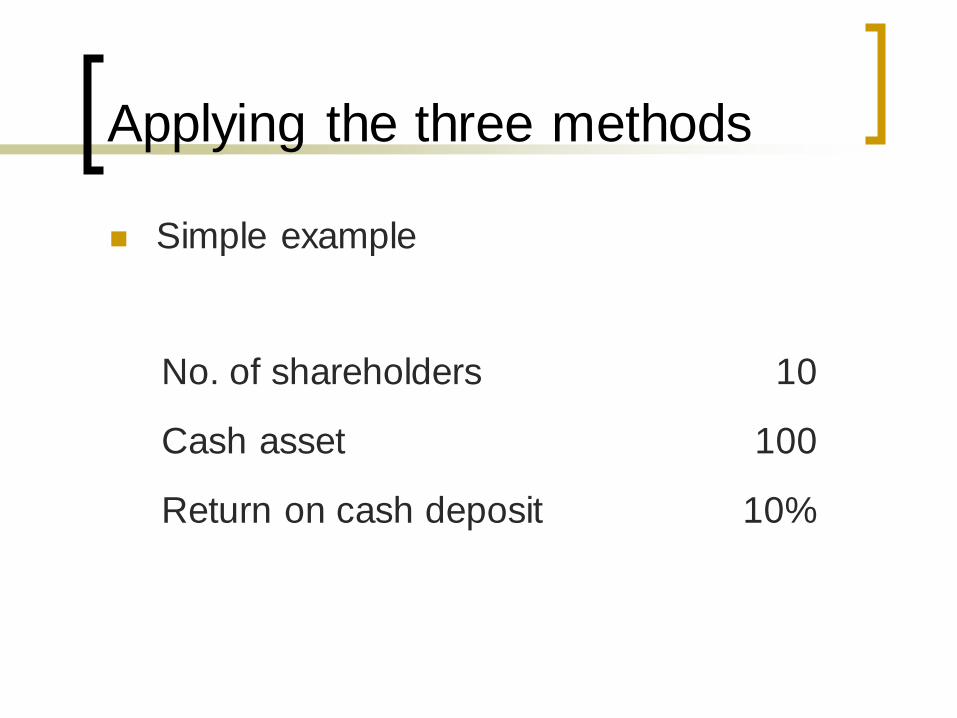
Applying the three methods
◼ Simple example
No. of shareholders 10
Cash asset 100
Return on cash deposit 10%
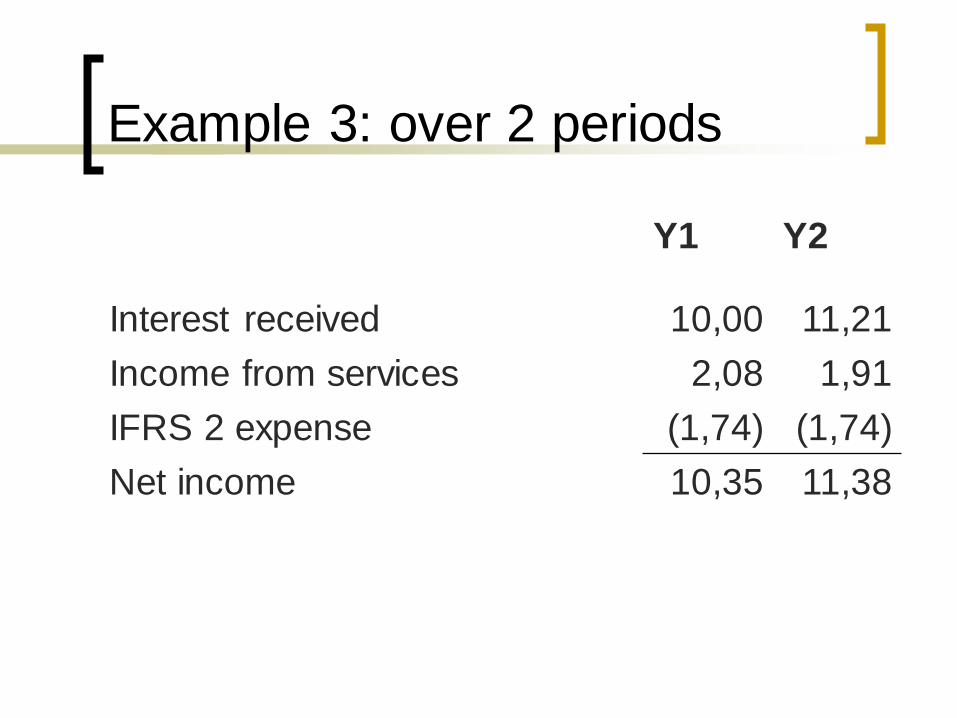
Example 3: over 2 periods
Y1 Y2
Interest received 10,00 11,21
Income from services 2,08 1,91
IFRS 2 expense (1,74) (1,74)
Net income 10,35 11,38
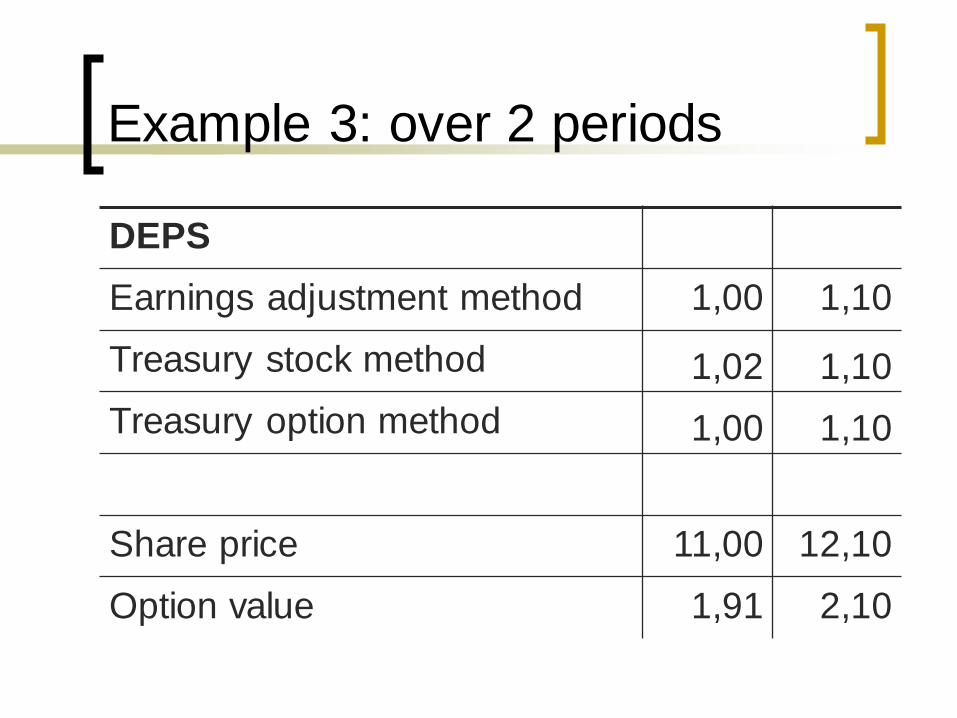
Example 3: over 2 periods
DEPS
Earnings adjustment method 1,00 1,10
Treasury stock method 1,02 1,10
Treasury option method 1,00 1,10
Share price 11,00 12,10
Option value 1,91 2,10
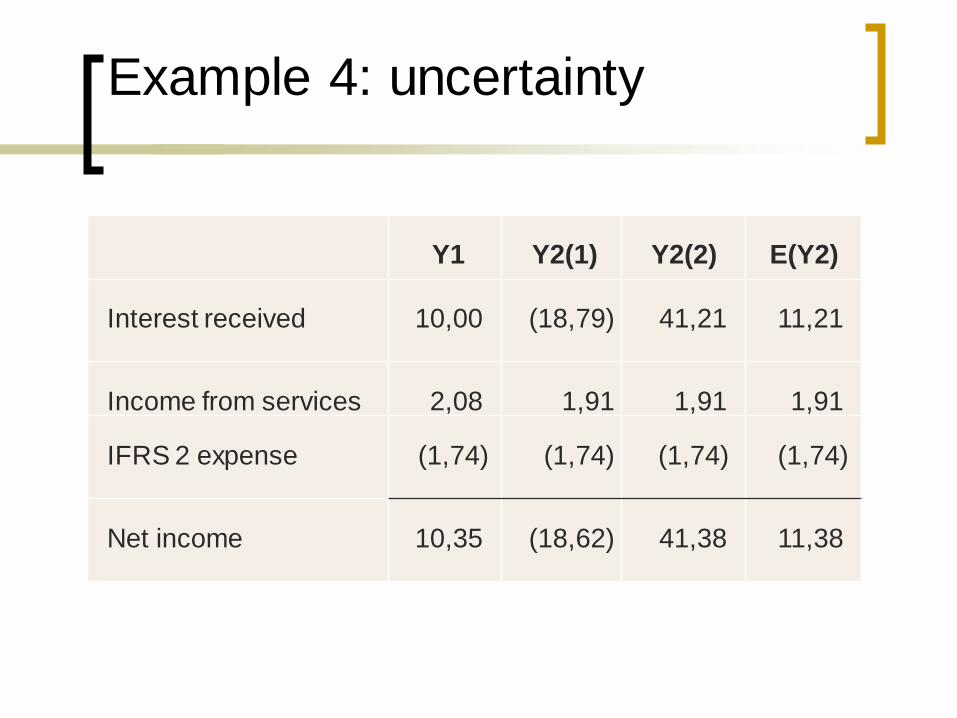
Example 4: uncertainty
Y1 Y2(1) Y2(2) E(Y2)
Interest received 10,00 (18,79) 41,21 11,21
Income from services 2,08 1,91 1,91 1,91
IFRS 2 expense (1,74) (1,74) (1,74) (1,74)
Net income 10,35 (18,62) 41,38 11,38
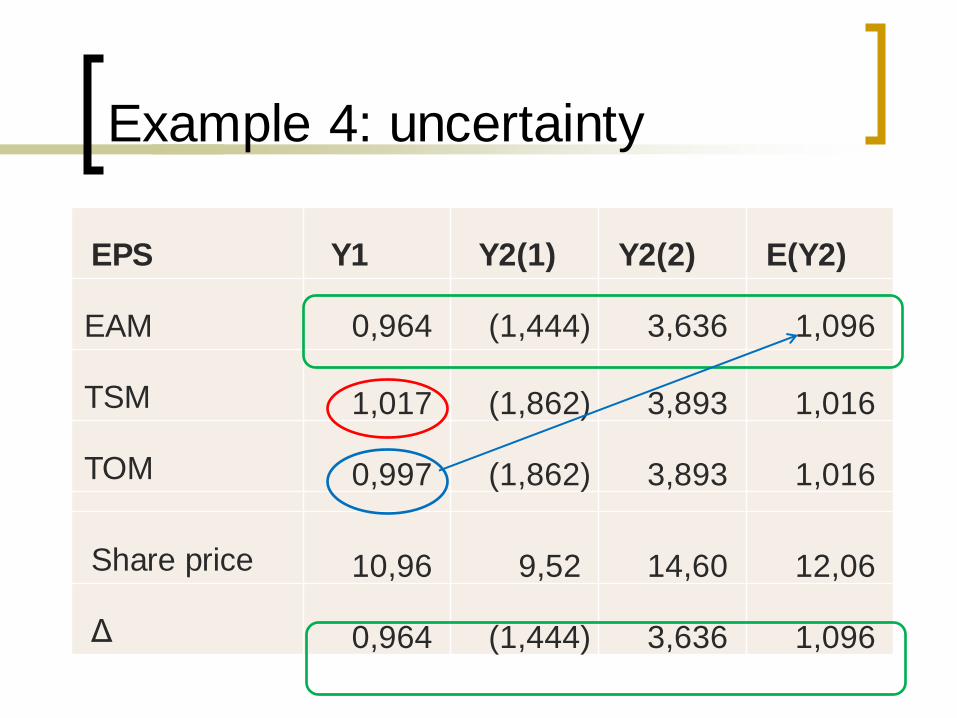
Example 4: uncertainty
EPS Y1 Y2(1) Y2(2) E(Y2)
EAM 0,964 (1,444) 3,636 1,096
TSM 1,017 (1,862) 3,893 1,016
TOM 0,997 (1,862) 3,893 1,016
Share price 10,96 9,52 14,60 12,06
Δ 0,964 (1,444) 3,636 1,096

Which is the best method?
◼ earnings adjustment method
best captures change in wealth
◼ treasury option method
best indicator of future earnings
◼ treasury stock method
least useful of three
Practical consequences
◼ Test EAM using 5 ASX companies:
CSL
Afterpay
Reece
Xero
carsales.com
◼ For the last 5 years
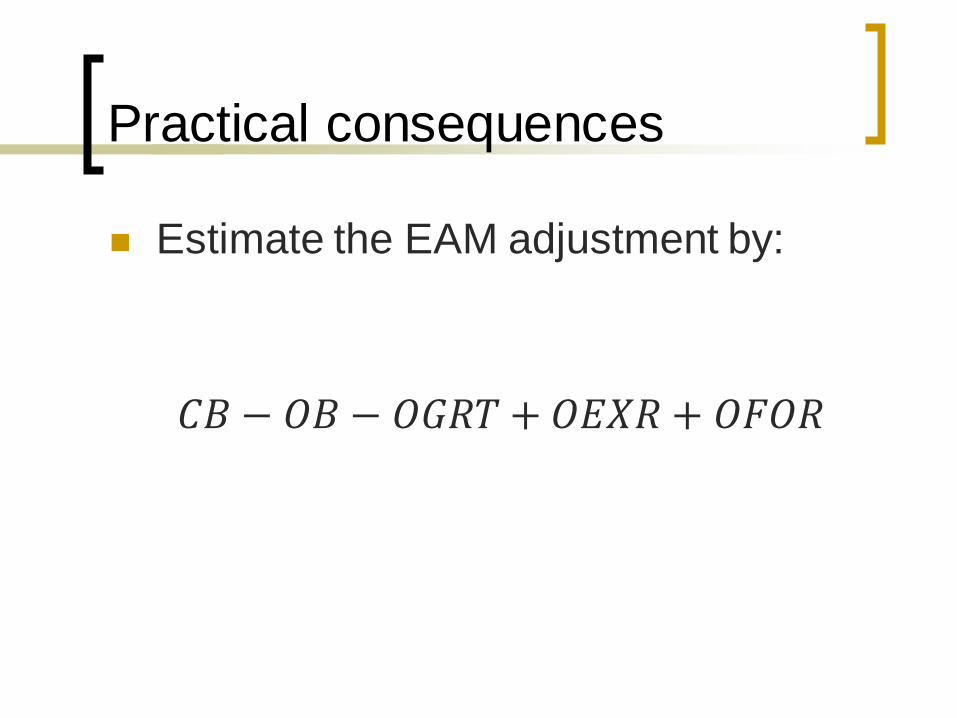
Practical consequences
◼ Estimate the EAM adjustment by:
𝐶𝐵 − 𝑂𝐵 − 𝑂𝐺𝑅𝑇 + 𝑂𝐸𝑋𝑅 + 𝑂𝐹𝑂𝑅
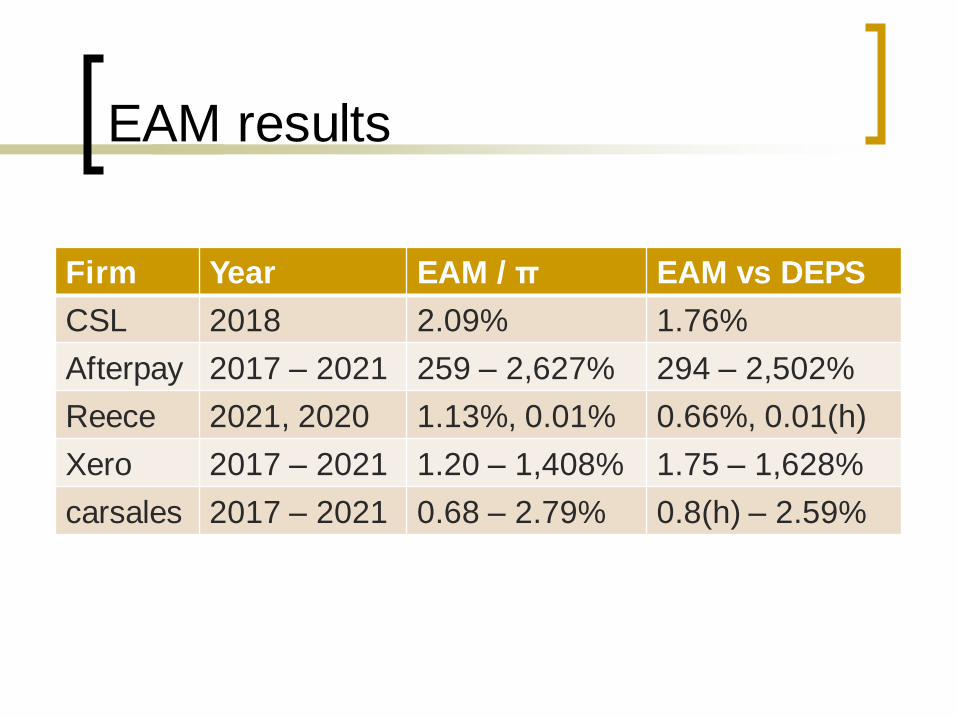
EAM results
Firm Year EAM / π EAM vs DEPS
CSL 2018 2.09% 1.76%
Afterpay 2017 – 2021 259 – 2,627% 294 – 2,502%
Reece 2021, 2020 1.13%, 0.01% 0.66%, 0.01(h)
Xero 2017 – 2021 1.20 – 1,408% 1.75 – 1,628%
carsales 2017 – 2021 0.68 – 2.79% 0.8(h) – 2.59%
EAM results
◼ Conclusions from test sample
IAS 33 significantly understates the
dilution
Can have very large EAM adjustments
◼ Significant DEPS volatility
◼ If P:E ratio large
EAM DEPS can be higher than
basic EPS
Implications for standard
setting
◼ Align cash- and equity-settled ESOs
◼ TOM would be a simple change
◼ Not necessary to adjust exercise price
◼ Need to clarify the distinction between
debt and equity