36 2-2013 | ECOLOGY & FARMING
The global market for organic food and non-food production
Peter Brul
ING baNk (NoT kNowN as The
‘GreeNesT’ of baNks) reporTs ThaT
The DuTch orGaNIc markeT Is GrowING fasTer ThaN The chINese ecoNomy
Calculating the value of organic chains
Despite a recession and difficult eco-
nomic conditions in the two main
markets for organic products, Europe and
the United States, the market share and
volume of organic products has continued
to grow in recent years. The worldwide
acreage of organic land is also growing.
However the relationship between the two
is not always straightforward.
The world’s organic market is made up of
a number of segments. By far the most
important market is that for food and bev-
erages. Western Europe and North Amer-
ica account for more than 95% of the
world market for certified organic foods.
The consumption of organic products per
head is more or less the same in the USA
and north-western Europe, around €57
per person in 2011. In Europe as a whole
the average was €24 per person, but in
Denmark and Switzerland it was more
than €130. Other markets, such as Brazil,
China, Russia, Turkey and the Middle East
are growing strongly, but only make up a
small part of the entire market. Almost all
countries apart from the US, Canada and
north-western Europe are net exporters of
organic products.
Organic farming is regulated by law in the
US and Europe, so the statistical data on
acreage and turnover in organic foods
are pretty reliable. This is much less the
case for the markets for organic textiles
(mainly cotton) and cosmetics and well-
ness products. These markets are also
quite large and have grown fast over the
last ten years.
MARkEts
Organic cotton is mainly certified through
the Global Organic Textile Standard (GOTS).
The number of facilities certified by GOTS
increased by 11% in 2012, growing from
2,714 facilities in 2011 to 3,016 facilities
in 2012. The countries with the most pro-
cessing facilities are India (with 1062 certi-
fied), Turkey (400) and China (252). Market
demand in Europe grew by more than 20%
for the second year in a row.
India is by far the largest producer of organ-
ic cotton, producing just over 100,000 tons
of cotton fibre in 2010-11 on nearly 250,000
hectares of certified land. The top ten cus-
tomers of organic cotton through the Textile
Exchange are mainly large textile retail
chains: H & M (Sweden), C & A (Belgium),
Nike, Inc. (USA), Inditex (Zara) (Spain), Adi-
das (Germany), Green Source (USA), Anvil
(USA), Target (USA), Disney Consumer Prod-
ucts (USA) and the Otto Group (Germany).
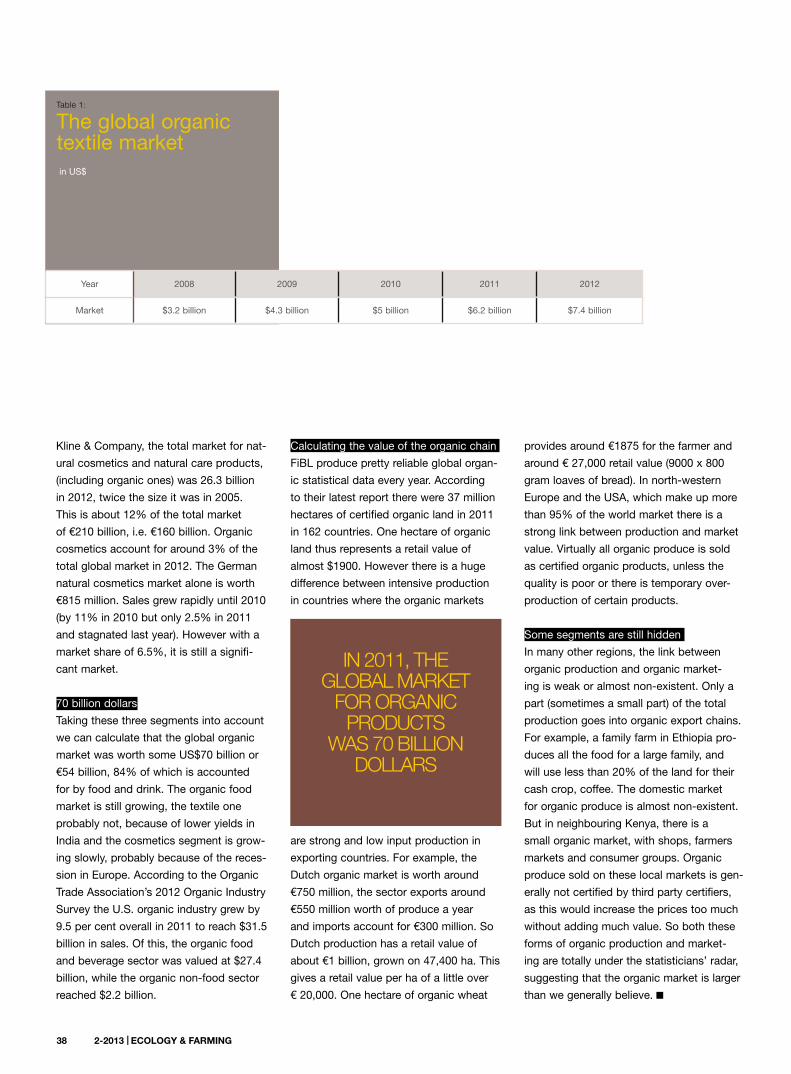
Table 1 (based mainly on figures from the
Textile Exchange) shows the growth in the
global organic textile market over the last
five years.
Wellness
The third significant market segment is for
cosmetics, skin care and widely used natu-
ral medicines such as arnica, neem and
echinacea. This segment is also not covered
by the regulations and there no clear dis-
tinction between ‘natural‘ and organic prod-
ucts. Some large producers consistently use
organic ingredients, and this is an integral
part of their corporate identity and their
brands, but there is no organic label on the
packaging. According to market researcher
Textiles
Less than 30 years ago, the first certified
organic cotton was grown, spun and then
woven into t-shirts and other products.
Now there are more than two hundred
thousand organic cotton growers around
the world and the market is worth approx-
imately €5.65 billion. Organic cotton is
grown in 22 countries: the leading ten (in
rank order) are India, Turkey, Syria, Tanza-
nia, China, United States, Uganda, Peru,
Egypt and Burkina Faso. Textiles are not
regulated under European organic legisla-
tion and this almost inevitably means that
the data are far less reliable than for food-
stuffs. In addition to organic cotton there
is a range of environmental and sustain-
ability labels for cotton. Large textile com-
panies often mix organic and conventional
cotton. They bring the products to the
market without organic certification to ful-
fil their own overall sustainability criteria.
The textiles industry is also under con-
siderable pressure to significantly reduce
pollution. Conventional cotton cultivation
involves intensive pesticide use, cot-
ton is a large consumer of scarce water
resources and the processing of cotton
(including bleaching and dyeing) involves
extremely polluting processes that dye
rivers in developing countries red, blue
or purple, depending on the fashions of
the day. Only a few of the environmental
improvements in the textile industry are
associated with certified organic produc-
tion; far more improvements come in
small steps or are made by the industry’s
own environmental labels.
ECOLOGY & FARMING | 2-2013 37
38 2-2013 | ECOLOGY & FARMING
Calculating the value of the organic chain
FiBL produce pretty reliable global organ-
ic statistical data every year. According
to their latest report there were 37 million
hectares of certified organic land in 2011
in 162 countries. One hectare of organic
land thus represents a retail value of
almost $1900. However there is a huge
difference between intensive production
in countries where the organic markets
are strong and low input production in
exporting countries. For example, the
Dutch organic market is worth around
€750 million, the sector exports around
€550 million worth of produce a year
and imports account for €300 million. So
Dutch production has a retail value of
about €1 billion, grown on 47,400 ha. This
gives a retail value per ha of a little over
€ 20,000. One hectare of organic wheat
provides around €1875 for the farmer and
around € 27,000 retail value (9000 x 800
gram loaves of bread). In north-western
Europe and the USA, which make up more
than 95% of the world market there is a
strong link between production and market
value. Virtually all organic produce is sold
as certified organic products, unless the
quality is poor or there is temporary over-
production of certain products.
Some segments are still hidden
In many other regions, the link between
organic production and organic market-
ing is weak or almost non-existent. Only a
part (sometimes a small part) of the total
production goes into organic export chains.
For example, a family farm in Ethiopia pro-
duces all the food for a large family, and
will use less than 20% of the land for their
cash crop, coffee. The domestic market
for organic produce is almost non-existent.
But in neighbouring Kenya, there is a
small organic market, with shops, farmers
markets and consumer groups. Organic
produce sold on these local markets is gen-
erally not certified by third party certifiers,
as this would increase the prices too much
without adding much value. So both these
forms of organic production and market-
ing are totally under the statisticians’ radar,
suggesting that the organic market is larger
than we generally believe.
In 2011, the gloBal market
for organIc Products
was 70 BIllIon dollars
Kline & Company, the total market for nat-
ural cosmetics and natural care products,
(including organic ones) was 26.3 billion
in 2012, twice the size it was in 2005.
This is about 12% of the total market
of €210 billion, i.e. €160 billion. Organic
cosmetics account for around 3% of the
total global market in 2012. The German
natural cosmetics market alone is worth
€815 million. Sales grew rapidly until 2010
(by 11% in 2010 but only 2.5% in 2011
and stagnated last year). However with a
market share of 6.5%, it is still a signifi-
cant market.
70 billion dollars
Taking these three segments into account
we can calculate that the global organic
market was worth some US$70 billion or
€54 billion, 84% of which is accounted
for by food and drink. The organic food
market is still growing, the textile one
probably not, because of lower yields in
India and the cosmetics segment is grow-
ing slowly, probably because of the reces-
sion in Europe. According to the Organic
Trade Association’s 2012 Organic Industry
Survey the U.S. organic industry grew by
9.5 per cent overall in 2011 to reach $31.5
billion in sales. Of this, the organic food
and beverage sector was valued at $27.4
billion, while the organic non-food sector
reached $2.2 billion.
Table 1:
The global organic textile market in US$
Year 2008 2009 2010 2011 2012
Market $3.2 billion $4.3 billion $5 billion $6.2 billion $7.4 billion


