

i
23400
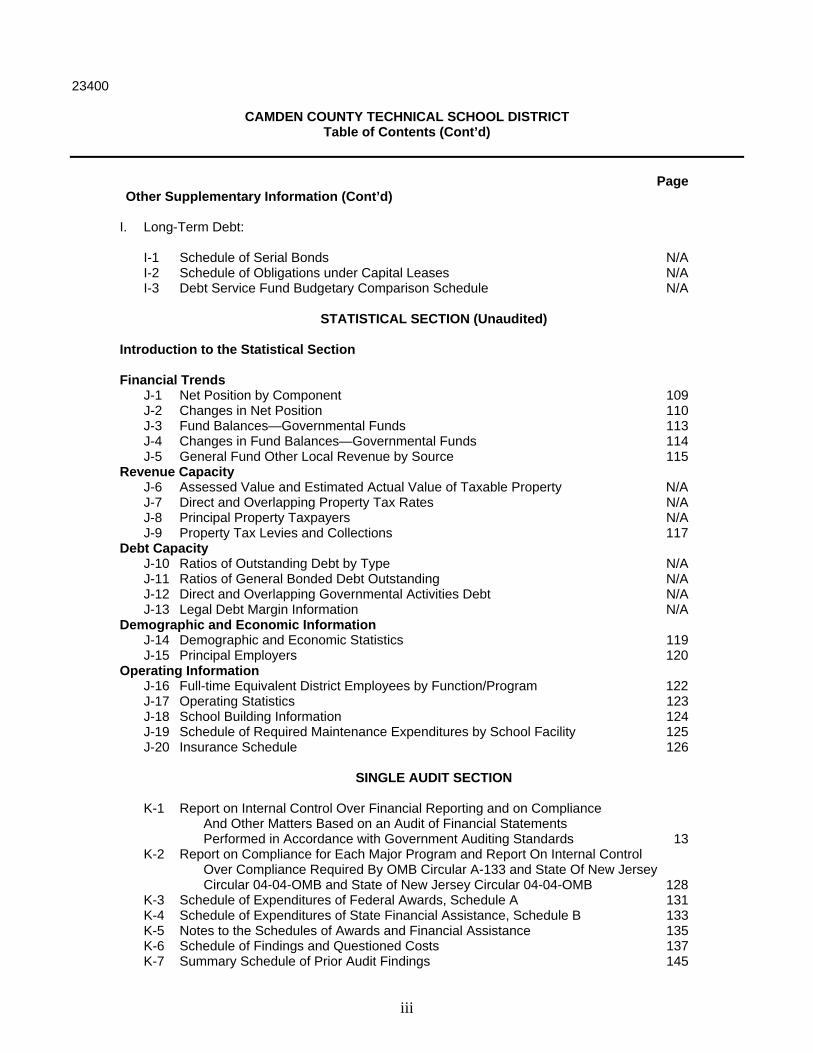
CAMDEN COUNTY TECHNICAL SCHOOL DISTRICT Table of Contents
Page
INTRODUCTORY SECTION Letter of Transmittal 2 Organizational Chart 6 Roster of Officials 7 Consultants and Advisors 8
FINANCIAL SECTION Independent Auditor's Report 10 Required Supplementary Information – Part I Management’s Discussion and Analysis 16 Basic Financial Statements A. District-Wide Financial Statements: A-1 Statement of Net Position 26 A-2 Statement of Activities 27
B. Fund Financial Statements: Governmental Funds: B-1 Balance Sheet 29 B-2 Statement of Revenues, Expenditures and Changes in Fund Balances 30
B-3 Reconciliation of the Statement of Revenues, Expenditures and Changes in Fund Balances of Governmental Funds to the Statement of Activities 31 Proprietary Funds: B-4 Statement of Net Position 32 B-5 Statement of Revenues, Expenses and Changes in Fund Net Position 33 B-6 Statement of Cash Flows 34 Fiduciary Funds: B-7 Statement of Fiduciary Net Position 35 B-8 Statement of Changes in Fiduciary Net Position 36 Notes to the Financial Statements 37 Required Supplementary Information – Part II
C. Budgetary Comparison Schedules
C-1 Budgetary Comparison Schedule – General Fund 60 C-1a Combining Schedule of Revenues, Expenditures and Changes In Fund Balance – Budget and Actual N/A C-1b Education Jobs Fund Program – Budget and Actual 75 C-2 Budgetary Comparison Schedule – Special Revenue Fund 76
Notes to the Required Supplementary Information C-3 Budget-to-GAAP Reconciliation 79

ii
23400
CAMDEN COUNTY TECHNICAL SCHOOL DISTRICT Table of Contents (Cont’d)
Page Other Supplementary Information
D. School Based Budget Schedules:
D-1 Combining Balance Sheet N/A D-2 Blended Resource Fund – Schedule of Expenditures Allocated by Resource Type – Actual N/A D-3 Blended Resource Fund – Schedule of Blended Expenditures – Budget and Actual N/A
E. Special Revenue Fund:
E-1 Combining Schedule of Program Revenues and Expenditures – Budgetary Basis 81 E-2 Preschool Education Aid Schedule(s) of Expenditures – Budgetary Basis N/A
F. Capital Projects Fund:
F-1 Summary Schedule of Project Expenditures 85 F-2 Summary Schedule of Revenues, Expenditures, and Changes in Fund Balances – Budgetary Basis 86 F-2a Schedule(s) of Project Revenues, Expenditures, Project Balance and -2k Project Status -Budgetary Basis 87
G. Proprietary Funds:
Enterprise Fund: G-1 Combining Statement of Net Position 99 G-2 Combining Statement of Revenues, Expenses and Changes in Fund Net Position 100 G-3 Combining Statement of Cash Flows 101 Internal Service Fund: G-4 Combining Statement of Net Position N/A G-5 Combining Statement of Revenues, Expenses and Changes in Fund Net Position N/A G-6 Combining Statement of Cash Flows N/A
H. Fiduciary Funds:
H-1 Combining Statement of Fiduciary Net Position 103 H-2 Combining Statement of Changes in Fiduciary Net Position 104 H-3 Student Activity Agency Fund Schedule of Receipts and Disbursements 105 H-4 Payroll Agency Fund Schedule of Receipts and Disbursements 106
iii
23400
CAMDEN COUNTY TECHNICAL SCHOOL DISTRICT Table of Contents (Cont’d)
Page Other Supplementary Information (Cont’d)
I. Long-Term Debt:
I-1 Schedule of Serial Bonds N/A I-2 Schedule of Obligations under Capital Leases N/A I-3 Debt Service Fund Budgetary Comparison Schedule N/A
STATISTICAL SECTION (Unaudited)
Introduction to the Statistical Section Financial Trends J-1 Net Position by Component 109 J-2 Changes in Net Position 110 J-3 Fund Balances—Governmental Funds 113 J-4 Changes in Fund Balances—Governmental Funds 114 J-5 General Fund Other Local Revenue by Source 115 Revenue Capacity J-6 Assessed Value and Estimated Actual Value of Taxable Property N/A J-7 Direct and Overlapping Property Tax Rates N/A J-8 Principal Property Taxpayers N/A J-9 Property Tax Levies and Collections 117 Debt Capacity J-10 Ratios of Outstanding Debt by Type N/A J-11 Ratios of General Bonded Debt Outstanding N/A J-12 Direct and Overlapping Governmental Activities Debt N/A J-13 Legal Debt Margin Information N/A Demographic and Economic Information J-14 Demographic and Economic Statistics 119 J-15 Principal Employers 120 Operating Information J-16 Full-time Equivalent District Employees by Function/Program 122 J-17 Operating Statistics 123 J-18 School Building Information 124 J-19 Schedule of Required Maintenance Expenditures by School Facility 125 J-20 Insurance Schedule 126
SINGLE AUDIT SECTION
K-1 Report on Internal Control Over Financial Reporting and on Compliance And Other Matters Based on an Audit of Financial Statements Performed in Accordance with Government Auditing Standards 13 K-2 Report on Compliance for Each Major Program and Report On Internal Control Over Compliance Required By OMB Circular A-133 and State Of New Jersey Circular 04-04-OMB and State of New Jersey Circular 04-04-OMB 128 K-3 Schedule of Expenditures of Federal Awards, Schedule A 131 K-4 Schedule of Expenditures of State Financial Assistance, Schedule B 133 K-5 Notes to the Schedules of Awards and Financial Assistance 135 K-6 Schedule of Findings and Questioned Costs 137 K-7 Summary Schedule of Prior Audit Findings 145

INTRODUCTORY SECTION

CAMDEN COUNTY
I lonorable President and Members of the Uoard of Edu cation of the Technical Schools In the Co unty of Camd en, 1ew Jersey
Dear Uoard Members:
f TECHNICAL SCHOOLS
December 2, 201 3
T he comprehensive a nnual fi nancial report of the Camden Co unty Technica l ch ool Dist rict (District) for the fisca l yea r that ended J une 30, 20 13, is hereby subm itted. Responsibility for both the acc uracy of the data a nd completeness a nd fa irness of the presenta tion, incl uding a ll di sclo~ u res. rests with the ma uageme nt of the Uoa rd of Education of the Technical Schools in th e County of Ca mdeu (Board). T o the best of our knowledge a nd belief, the data presented in this report is ~H·cu ra t e in all matcrial res pects a nd is repor ted in a manner designed to fa ir ly present the fi nancial position an d results of operat ion of the va r ious fumls a nd account groups of the District. All disclosures necessa ry to enable the reader to gain a n understand ing of the District's fi na ncial activit ies have been included.
T he comprehensive a nnua l fi nancial repor t is presr nted in four sections : introd uctor). fi nanci al. statist ir·a l and single a udi t. T he introductory sectiou includes this tra nsmitta l letter, the District's orga niza tiona l cha rt a nd a list of principal officials. Th e financia l section incl udes the basi.: fina ucial sta tements an d schedules, as well as the auditor ' s report thereon. T he sta tistical sectiou inclu ucs sclcc tcu fin a ncial and demograph ic inform ation, generally presented on a multi-yea r basis. T he Distnct is rcqtllrcd to un dergo a n annu al single au dit in co nformi ty wit h the provisions of the ingle Audit Act of 1996 a nd the U.S. Ortice of Ma nagement a nd Uudget's Circular A-133, Audits of tate. Local Covernm cnt s and i\iun-P rorit Orgn nizations, a nd Sta te of New J ersey Office of Managem ent and Budget's Circular 0-t -O.t-OM B, Sin:.:lc Audit Polrt;,v for Recipients of Fed era l Grants, State Grants and State Aid. In form ation relat e~ to th is sin gle a udit, in cluding the a uditor 's report on the interna l control stru ct ure and compl ia !lt C wi th appl icable laws a nd regula ti ons and findin gs a nd recommend ations, arc includeu in the single audit section of th is repor t.
I) REPO RT ING E TIT Y AND ITS SERVICES: T he Ca mden Co unty T echnica l School Dist rict is a n independe11 t reporting entit) within the criteria adopted by the Govcnuuental Acco un ting ta nd::nls Boa rd (G ASB) as es ta blished by 'CGA Sta tement No. 3. All fund s or th e District arc includ ed in t hi~ l'l'!lOrt. The Boa rd of Education of th e Technica l Schools in th e County of Ca mden a nd a ll its schools con: ti tutc the Dis trict's reporting entity. The District consists of two camp uses, Pennsauken a nd Gloucester 'I o" nship.
The Distr ict prov id es a full ra nge of ed uca tiona l services ap prop riate to gr:~d e leveb 9 through !2. T hese inclu de regular vocat ional and technicn l progra ms, as well as special ed ucation programs.
The District completed th e 201 2-2013 fiscal year with a n a vera ge da ily enrollm ent Il l' 2,104 stu dents, a increase of 36 s tudents, when compa red to the previous yea r 's nvcrage da ily enrollm ent. The increase pri mari ly renects the increasing number of programs. The to ll vwing detai ls the cha nges in the District 's studen t enrollment.
Gloucester Township Campus • 343 Berlin Cross Keys Road • Sicklerville, NJ • 08081-4000
TELEPHONE: 856-767-7000 + FAX: 856-767-3638 + WEB: www.ccts.info 2

Fiscal Year 2012-2013 2011-2012 2010-2011 2009-2010 2008-2009 2007-2008 2006-2007 2005-2006 2004-2005 2003-2004
Average Daily Enrollment
Student Enrollment 2104 2068 2376 2294 2322 2309 2266 2388 2540 2556
Percent Change 1.74
(12.96) 3.57
( 1.21) .56 1.9
( 5.11) ( 5.98) ( .63) ( 2.85)
2) ECONOMIC CONDITION AND OUTLOOK: Camden County remains one of the Delaware Valley's most desirable locations for industrial and commercial development. Its assessed real estate valuation approximates $38 billion. As Camden County's population rose over the past seven years, the Camden County Board of Chosen Freeholders has been able to contain the property tax rate without negatively effecting services. The property tax rate was .64 in 2007, .58 in 2008, .56 in 2009, .61 in 2010, .66 in 2011,.71 in 2012 and .77 in 2013. During that time period, county financial assistance, derived from property taxes, for operational expenses and capital expenditures remained level. County financial assistance provides approximately 28%, of District operating revenue.
It is anticipated that state education funding, in the immediate future, will be level funding for vocational and technical education. The State of New Jersey provides over 56%, of District revenue.
3) MAJOR INITIATIVES: Sldll development and training in occupational programs provide students with the requisite ability to effectively transition from school to worl<. Enhanced school to worl< support systems have been designed to provide expanded opportunities for career exploration, pre-employment and employment sl<ill development and individual career counseling.
Computers, with Internet access, have been installed in every classroom and occupational program and many have been equipped with projectors, screens and document cameras and other instructional technology. Students and other computer users arc able to access and share information with other computer users on a world-wide basis. Distance learning centers augment universal access. These technologies provide tools for teachers and students to enhance learning in the classroom.
Project-based learning/integrated studies academy, and career programs such as Information Technology, Medical Arts, Performing Arts or Pre-Engineering, provide students who participate with a comprehensive approach to instruction. Students in the academies arc chosen too participate in this style of academic learning because of their natural rigor, creativity and critical thinking that arc required for student achievement. The challenges and inspiration that these programs provide will help students achieve even greater success as they prepare to compete in a global economy.
A new career program in Law and Public Safety was introduced at both campuses in September 2013, in partnership with Camden County College and the Board of Chosen Freeholders.
The 215t Century/after school program continues to provide participating students with academic
enrichment opportunities that complement the regular school day at both campuses.
3

4) INTERNAL ACCOUNTING CONTROLS: Management of the District is responsible for establishing and maintaining an internal control structure designed to ensure that the assets of the District are protected from loss, theft or misuse and to ensure that adequate accounting data arc compiled to allow for the preparation of financial statements in conformity with accounting principles generally accepted in the United States of America (GAAP). The internal control structure is designed to provide reasonable, but not absolute, assurance that these objectives arc met. The concept of reasonable assurance recognizes that: (1) the cost of a control should not exceed the benefits likely to be derived; and (2) the valuation of costs and benefits requires estimates and judgements by management.
As a recipient of federal and state financial assistance, the District is also responsible for ensuring that an adequate internal control structure is in place to ensure compliance with applicable laws and regulations related to those programs. Internal control is also subject to periodic evaluation by District management.
As part of the District's single audit described earlier, tests arc performed to determine the adequacy of the internal control, including that portion related to federal and state financial assistance programs, as well as to determine that the District has complied with applicable laws and regulations.
5) BUDGETARY CONTROLS: In addition to internal accounting controls, the District maintains budgetary controls. The objective of these budgetary controls is to ensure compliance with legal provisions embodied in the annual appropriated budget approved by the board of school estimates. Annual appropriated budgets are adopted for the general fund and the special revenue fund. The final budget amount as amended for the fiscal year is reflected in the financial section.
An encumbrance accounting system is used to record outstanding purchase commitments on a line item basis. Open encumbrances at year-end arc either canceled or arc included as reappropriation of fund balance in the subsequent year. Those amounts to be reappropriated arc reported as reservations of fund balance at June 30,2013.
6) ACCOUNTING SYSTEM AND REPORTS: The District's accounting records reflect accounting principles generally accepted in the United States of America, as promulgated by the Governmental Accounting Standards Board (GASB). The District's accounting system is organized on the basis of funds. These funds arc explained in "Notes to the Financial Statement", Note 1.
7) DEBT ADMINISTRATION: Debt administration is the statutory obligation of the County of Camden.
8) CASH MANAGEMENT: The investment policy of the District is guided in large part by the state statute as detailed in "Notes to the Financial Statements", Note 2. The District has adopted a cash management plan which requires it to deposit public funds in public depositories protected for loss under the provisions of the Governmental Unit Deposit Protection Act ("GUDPA"). GUDPA was enacted in 1970 to protect Governmental Units from a loss of funds on deposit with a failed banking institution in New Jersey. The law requires governmental units to deposit funds only in public depositories located in New Jersey, where the funds are secured in accordance with the Act.
9) RISK MANAGEMENT: The Board carries forms of insurance, including but not limited to general liability, automobile liability and comprehensive/collision, hazard and theft insurance on property and contents, and fidelity bonds.
4

10) OTI-TER INFORMATION:
A) Independ ent Audit- S ta te s tatutes require a n a nnua l audit by independent cert ified pu b lic accountants or registered municipal accountants (RMAs). R obert S. Marron e of t he acco un ting firm of Bowman a nd Company, LLP was selected by the board a t their an nu al reorga nization meeting. In add it ion to meeting the requirements set forth in s tate sta tutes, the audit a lso was designed to meet the requirements of the Sing le Audit Act of 1996 and th e rela ted OMB C ircula r A-133 a nd New J e rsey C ircula r 04-04 OMJ3. T he audito r 's r epo rt on the basic finan cia l s tatements and combining a nd indiv idual fund sta temen ts and sched ul es is included in the fin a ncial section of this report. The a uditor's r eports, r elated specifically to the s ing le aud it, arc included in the single audit section of this re port.
B) Awards- Distr ict stude nts continue to be e lected to lead ership pos itions in th e followi ng career and technica l s tud ent o rganiza tions: SkillsUSA, Future for Ag riculture, Hea lth Occupa tions Stud ents of America, Fa mily, Career, a nd Community Leaders of America, and Futu re Bus iness Leaders of America.
US News and W o rld Report selected the Pennsauke n C ampus o f Ca mden County Technica l Sc hools (CCI'S) as one of th e top high schools in the Nat ion. O ur awa rd winni ng sch ool dist rict co ntinues to train young men a nd women from C amden Co unty in fields ran ging fro m auto mot ive techno logy to busi ness technology.
O ur s tudents co nsis tently gain recognition fo r th eir academic as well as career-tech nica l sk ills. Ou r School of Leadership is unique w ith the Air Force J unior Reserve Officer Traini ng Co rps Unit spo nsoring t he s tud ents a nd its curricu lum.
II) ACKNOWLEDGMENTS:
We wo uld like to express our appr eciation to th e members of t he B oard of Educa t ion of the Tech nical Schools in the County of Ca mden fo•· their concern in providi ng fiscal accou ntabi lity to the citizens and taxpayers o f the District and thereby contributing their fu ll support to the develop ment and maintenance of t he District's financial operation. The prepa r at ion of this repo rt could not have been acco mplished without the ser vice of our financial a nd accounting s taff.
Resp ectfully su bmittcd,
S uperin tendent
JM C:ch
5

Pri
nci
pal
Sch
oo
l Bu
sin
ess
Ad
min
istr
ato
r/B
oar
dSe
cre
tary
Dir
ect
or
of S
pe
cial
Edu
cati
on
Spe
ech
/Lan
guag
e T
he
rap
ist
Ch
ild
Stu
dy
Team
Me
mb
er
Secr
eta
ry
Confidentia
l
Secr
etary
Dir
ect
or
of S
tud
en
t P
ers
on
ne
l Se
rvic
es
Gu
idan
ceC
ou
nse
lor
Secr
eta
ry
Tech
nic
ian
(fu
ll &
par
t ti
me)
Sch
oo
l Nu
rse
Secr
etar
y
Cler
k Ty
pist
Teac
he
r
Libr
ary/
Med
iaSp
ecia
list
Dir
ecto
r o
f A
thle
tics
an
d S
tud
ent
Act
ivit
ies
Ass
ista
nt
Pri
nci
pal
Secr
eta
ry
Bu
s D
rive
r
Po
ol M
anag
erC
oac
h/A
dvi
sor
Cle
rk T
ypis
t
Cu
rric
ulu
mD
ire
cto
r/Su
pe
rvis
or
Secr
eta
ry
Co
ord
inat
or
of
Ad
mis
sio
ns
& S
tud
en
tSe
rvic
es
Ad
mis
sio
ns/
De
ve
lop
me
nt
Off
ice
r
Job
Pla
cem
en
t /C
oo
pe
rati
ve
Ed
uca
tio
n C
oo
rdin
ato
r
Vo
cati
on
al E
valu
ato
r
Secr
eta
ry
Secr
eta
ry
Tech
nic
ian
Subs
tanc
e A
war
enes
s Co
ordi
nato
r
Sup
ervi
sor
of
Pla
nn
ing,
Res
earc
h &
Eva
luat
ion
Secr
etar
y
Sum
mer
Sch
oo
l Dir
ecto
rC
hie
f Te
chn
olo
gy
Off
icer
Tech
no
logy
Op
erat
ion
s C
oo
rdin
ato
r
Co
mp
ute
r Su
pp
ort
Tec
hn
ical
Ass
ista
nt
Ch
ief
Secu
rity
Off
icer
Secu
rity
Res
ou
rce
Off
icer
Secu
rity
(Te
chn
icia
n)
Secu
rity
Off
icer
Dis
tric
t Pro
ject
Coor
dina
tor
Day
Car
e St
aff
Clerk
Typ
ist
Coor
dina
tor
of
Busi
ness
Serv
ices
War
eh
ou
se
Ch
ief B
&G
Off
ice
r
Engineer
Fireperson
Maintenance Mechanic
Custodian
Assistant B&G Officer
Secr
eta
ry
Co
nfi
de
nti
alSe
cre
tary
Payroll SystemsOperator
Payroll Assistant/ComputerSystems Operator
Purchase Assistant
Purchasing Clerk
Accounts Payable Clerk
Bo
ard
of
Ed
uca
tio
n
S
up
r i n
de
n
t
t
e
n
Ab
sen
ce C
all C
oo
rdin
ato
r
Aff
irm
ativ
eA
ctio
n &
Titl
e IX
Off
icer
Trua
ntO
ffic
er
21st
Cen
tury
Sta
ff
Hel
p D
esk/
Tech
nica
l
Ass
t. -
Libr
ary/
IMC
Scho
ol P
hysi
cian
/ M
edic
al In
spec
tor
Ath
leti
c Tr
ain
er
CA
MD
EN C
OU
NTY
TEC
HN
ICA
L SC
HO
OLS
OR
GA
NIZ
ATI
ON
AL
CH
AR
T
J
une
30,
201
3
Polic
y: 2
121
Revi
sed:
Oct
ober
198
8
Sep
tem
ber
1999
N
ovem
ber
2003
D
ecem
ber
21, 2
006
N
ovem
ber
28, 2
007
A
pril
16, 2
008
M
ay 2
1 20
08
Jun
e 18
, 200
8
Feb
ruar
y 18
, 200
9
Jun
e 24
, 200
9
Jun
e 16
, 201
0
Jun
e 15
, 201
1 (e
ff: 7
/1/1
1)
Sub
stit
ute
Tea
cher
Cle
rk T
yp
ist
Aud
itor
Distric
tSolicito
r
Board Secretary
e
Sum
mer
Sch
oo
l
Teac
her
s
Auto Mechanic's Asst.
Cle
rk T
ypis
t
6

CAMDEN COUNTY TECHNICAL SCHOOL DISTRICT
ROSTER OF OFFICIALS June 30, 2013
Members of the Board of Education Term Expires
Alfred C. Fisher, Acting President November 1, 2016 Bart Mueller November 1, 2017 Jason Ravitz November 1, 2015
William Mink, Ed. D. November 1, 2014
C. Ann Volk, Camden County Executive Superintendent of Schools N/A
Other Officials
Timothy Bell, Interim Superintendent
James M. Clark, Business Administrator/Board Secretary
David C. Patterson, Esq., Solicitor
7

CAMDEN COUNTY TECHNICAL SCHOOL DISTRICT
Consultants and Advisors
Audit Firm
Bowman & Company LLP 601 White Horse Road
Voorhees, NJ 08043-2492
Attorney
Maressa & Patterson, LLC 191 West White Horse Pike Berlin, New Jersey 08009
Official Depository
Bank of America 340 S. White Horse Pike Berlin, New Jersey 08009
8

FINANCIAL SECTION

INDEPENDENT AUDITOR'S REPORT The Honorable President and Members of the Board of Education Camden County Technical School District County of Camden, New Jersey Report on the Financial Statements We have audited the accompanying financial statements of the governmental activities, the business-type activities, each major fund, and the aggregate remaining fund information of the Camden County Technical School District, a component unit of the County of Camden, State of New Jersey, as of and for the fiscal year ended June 30, 2013, and the related notes to the financial statements, which collectively comprise the School District’s basic financial statements as listed in the table of contents. Management’s Responsibility for the Financial Statements Management is responsible for the preparation and fair presentation of these financial statements in accordance with accounting principles generally accepted in the United States of America; this includes the design, implementation, and maintenance of internal control relevant to the preparation and fair presentation of financial statements that are free from material misstatement, whether due to fraud or error. Auditor’s Responsibility Our responsibility is to express opinions on these financial statements based on our audit. We conducted our audit in accordance with auditing standards generally accepted in the United States of America; the standards applicable to financial audits contained in Government Auditing Standards, issued by the Comptroller General of the United States; and in compliance with audit requirements as prescribed by the Division of Administration and Finance, Department of Education, State of New Jersey. Those standards require that we plan and perform the audit to obtain reasonable assurance about whether the financial statements are free from material misstatement. An audit involves performing procedures to obtain audit evidence about the amounts and disclosures in the financial statements. The procedures selected depend on the auditor’s judgment, including the assessment of the risks of material misstatement of the financial statements, whether due to fraud or error. In making those risk assessments, the auditor considers internal control relevant to the School District’s preparation and fair presentation of the financial statements in order to design audit procedures that are appropriate in the circumstances, but not for the purpose of expressing an opinion on the effectiveness of the School District’s internal control. Accordingly, we express no such opinion. An audit also includes evaluating the appropriateness of accounting principles used and the reasonableness of significant accounting estimates made by management, as well as evaluating the overall presentation of the financial statements. We believe that the audit evidence we have obtained is sufficient and appropriate to provide a basis for our audit opinions.
10

23400 Opinions In our opinion, the financial statements referred to above present fairly, in all material respects, the respective financial position of the governmental activities, the business-type activities, each major fund, and the aggregate remaining fund information of the Camden County Technical School District in the County of Camden, State of New Jersey, as of June 30, 2013, and the respective changes in financial position and, where applicable, cash flows thereof for the fiscal year then ended in accordance with accounting principles generally accepted in the United States of America. Emphasis of Matter As discussed in Note 2 to the financial statements, during the fiscal year ended June 30, 2013, the School District adopted the following new accounting standards issued by the Governmental Accounting Standards Board (GASB): Statement No. 63, Financial Reporting of Deferred Outflows of Resources, Deferred Inflows of Resources, and Net Position and Statement No. 65, Items Previously Reported as Assets and Liabilities. Our opinion is not modified with respect to this matter. As discussed in Note 4, a cash shortage of $14,442.75 occurred in the Early Childhood Education Center business-type activity fund. The shortage has not been included as a revenue or receivable in the Early Childhood Education Center business-type activity fund Statement of Revenues, Expenses and Changes in Fund Net Position or the Statement of Net Position, respectively, and our opinion is not modified with respect to this matter. Other Matters Required Supplementary Information Accounting principles generally accepted in the United States of America require that the management’s discussion and analysis and budgetary comparison information as listed in the table of contents be presented to supplement the basic financial statements. Such information, although not a part of the basic financial statements, is required by the Governmental Accounting Standards Board who considers it to be an essential part of financial reporting for placing the basic financial statements in an appropriate operational, economic, or historical context. We have applied certain limited procedures to the required supplementary information in accordance with auditing standards generally accepted in the United States of America, which consisted of inquiries of management about the methods of preparing the information and comparing the information for consistency with management’s responses to our inquiries, the basic financial statements, and other knowledge we obtained during our audit of the basic financial statements. We do not express an opinion or provide any assurance on the information because the limited procedures do not provide us with sufficient evidence to express an opinion or provide any assurance. Other Information Our audit was conducted for the purpose of forming opinions on the financial statements that collectively comprise the Camden County Technical School District’s basic financial statements. The accompanying combining statements and related major fund supporting statements and schedules and Schedules of Expenditures of Federal Awards and State Financial Assistance, as required by U.S. Office of Management and Budget Circular A-133, Audits of States, Local Governments, and Non-Profit Organizations, and State of New Jersey Circular 04-04-OMB, Single Audit Policy for Recipients of Federal Grants, State Grants and State Aid, are presented for purposes of additional analysis and are not a required part of the basic financial statements. The accompanying combining statements and related major fund supporting statements and schedules and Schedules of Expenditures of Federal Awards and State Financial Assistance are the responsibility of management and were derived from and relates directly to the underlying accounting and other records used to prepare the basic financial statements. Such information has been subjected to the auditing procedures applied in the audit of the basic financial statements and certain additional procedures, including comparing and reconciling such information directly to the underlying accounting and other records used to prepare the basic financial statements or to the basic financial statements themselves, and other additional procedures in accordance with auditing standards generally accepted in the United States of America. In our opinion, the accompanying combining statements and related major fund supporting statements and schedules and Schedules of Expenditures of Federal Awards and State Financial Assistance are fairly stated, in all material respects, in relation to the basic financial statements as a whole.
11

12

REPORT ON INTERNAL CONTROL OVER FINANCIAL REPORTING AND ON COMPLIANCE AND OTHER MATTERS BASED ON AN AUDIT OF FINANCIAL STATEMENTS PERFORMED IN
ACCORDANCE WITH GOVERNMENT AUDITING STANDARDS
INDEPENDENT AUDITOR'S REPORT The Honorable President and Members of the Board of Education Camden County Technical School District County of Camden, New Jersey We have audited, in accordance with the auditing standards generally accepted in the United States of America and the standards applicable to financial statement audits contained in Government Auditing Standards, issued by the Comptroller General of the United States, and in compliance with audit requirements as prescribed by the Division of Administration and Finance, Department of Education, State of New Jersey, the financial statements of the governmental activities, the business-type activities, each major fund, and the aggregate remaining fund information of the Camden County Technical School District, a component unit of the County of Camden, State of New Jersey, as of and for the fiscal year ended June 30, 2013, and the related notes to the financial statements, which collectively comprise the School District’s basic financial statements, and have issued our report thereon dated December 2, 2013. Internal Control Over Financial Reporting In planning and performing our audit of the financial statements, we considered the Camden County Technical School District’s internal control over financial reporting (internal control) to determine the audit procedures that are appropriate in the circumstances for the purpose of expressing our opinions on the financial statements, but not for the purpose of expressing an opinion on the effectiveness of the School District’s internal control. Accordingly, we do not express an opinion on the effectiveness of the Camden County Technical School District’s internal control. Our consideration of internal control was for the limited purpose described in the preceding paragraph and was not designed to identify all deficiencies in internal control that might be material weaknesses or significant deficiencies and therefore, material weaknesses or significant deficiencies may exist that were not identified. However, as described in the accompanying Schedule of Findings and Questioned Costs and Independent Auditor’s Management Report on Administrative Findings - Financial, Compliance and Performance, we identified certain deficiencies in internal control that we consider to be material weaknesses and significant deficiencies.
13

14
REQUIRED SUPPLEMENTARY INFORMATION PART I

CAMDEN COUNTY TECHNICAL SCHOOLS
MANAGEMENT’S DISCUSSION AND ANALYSIS ( MD&A) YEAR ENDED JUNE 30, 2013
This section of Camden County Technical Schools District’s (CCTS) annual financial report presents a discussion and analysis of the financial activities of the District during the fiscal year that ended June 30, 2013. Please read it in conjunction with the transmittal letter at the front of this report and the District’s financial statements, which immediately follow this section. The Management’s Discussion and Analysis ( MD&A) is a new element initiated as of June 30, 2003 as part of the Required Supplementary Information specified in the Governmental Accounting Standard Board’s (GASB) Statement No. 34-Basic Financial Statements-and Management’s Discussion and Analysis–for State and Local Governments issued in June 1999. Certain comparative information between the current year (2012-2013) and the prior year (2011-2012) is required to be presented in the MD&A. FINANCIAL HIGHLIGHTS
Net Position at June 30, 2013 for governmental and business-type activities amounted to $30,411,055.94 and $325,683.52 respectively.
The District’s General Fund balance decreased to $7,905,654.31 as of June 30, 2013 from $8,047,906.97 as of June 30, 2012,
a decrease of $142,252.66. OVERVIEW OF THE FINANCIAL STATEMENTS This annual report consists of three parts-Management’s Discussion and Analysis (this section), the basic financial statements, and required supplementary information. The basic financial statements include two kinds of statements that present different views of the District:
The first two statements are district-wide financial statements that provide both short-term and long-term information about the District’s overall financial status.
The remaining statements are fund financial statements that focus on individual parts of the District, reporting the District’s
operations in more detail that the district-wide statements. The governmental funds statements tell how basic services like regular and special education were financed in the short-term
as well as what remains for future spending.
Proprietary funds statements offer short- and long-term financial information about the activities the district operates like businesses, such as food services.
Fiduciary funds statements provide information about the financial relationships in which the District acts solely as a trustee
or agent for the benefit of others.
The financial statements also include notes that explain some of the information in the statements and provide more detailed data. The statements are followed by a section of required supplementary information that further explains and supports the financial statements with a comparison of the District’s budget for the year.
16

CAMDEN COUNTY TECHNICAL SCHOOLS
MANAGEMENT’S DISCUSSION AND ANALYSIS ( MD&A) YEAR ENDED JUNE 30, 2013
Table A-1
MAJOR FEATURES OF DISTRICT-WIDE AND FUND FINANCIAL STATEMENTS District-wide Statements Governmental Funds Proprietary Funds Fiduciary Funds Scope Entire district (except
fiduciary funds) The activities of the district that are not proprietary or fiduciary, such as special education and building maintenance.
Activities the district operates similar to private businesses: food services
Instances in which the district administers resources on behalf of someone else, such as scholarship programs and student activities monies
Required financial statements
Statement of net position Statement of activities
Balance Sheet Statement of Revenues, Expenditures, and Changes in fund Balances
Statement of net position Statement of revenues, expenses, and changes in fund net position Statement of cash Flows
Statement of fiduciary net position Statement of changes in fiduciary net position
Accounting basis and measurement focus
Accrual accounting and economic resources focus
Modified accrual accounting and current financial resources focus
Accrual accounting and economic resources focus
Accrual accounting and economic resources focus
Type of asset/liability information
All assets and liabilities, both financial and capital, short-term and long-term
Generally assets expected to be used up and liabilities that come due during the year or soon thereafter; no capital assets or long-term liabilities included
All assets and liabilities, both financial and capital, and short-term and long-term
All assets and liabilities, both short-term and long-term; Camden County Technical School’s funds do not currently contain capital assets, although they can
Type of inflow/outflow information
All revenues and expenses during year regardless of when cash is received or paid
Revenues for which cash is received during or soon after the end of the year
All revenues and expenses during the year regardless of when cash is received or paid
All additions and deductions during the year, regardless of when cash is received or paid
Table A-1 summarizes the major features of the District’s financial statements, including the portion of the District’s activities they cover and the types of information they contain. The remainder of this overview section of management’s discussion and analysis highlights the structure and contents of each of the statements. District-wide Statements The district-wide statements report information about the District as a whole using accounting methods similar to those used by private-sector companies. The statement of net position includes all of the District’s assets and liabilities. All of the current year’s revenues and expenses are accounted for in the statement of activities regardless of when cash is received or paid. The two district-wide statements report the District’s net position and how they have changed. Net position- the difference between the District’s assets and liabilities-are one way to measure the District’s financial health or position. Increases or decreases in the District’s net position are indicators of whether its financial position is improving or
deteriorating, respectively. To assess the overall health of the District, you need to consider additional nonfinancial factors such as changes in the District’s
County funding and the condition of school buildings and other facilities.
17

CAMDEN COUNTY TECHNICAL SCHOOLS
MANAGEMENT’S DISCUSSION AND ANALYSIS ( MD&A) YEAR ENDED JUNE 30, 2013
District-wide Statements (continued) In the district-wide financial statements, the District’s activities are divided into two categories: Governmental activities – Most of the District’s basic services are included here, such as regular and vocational education and
administration. County taxes and state formula aid and federal aid finance most of these activities.
Business-type activities - The District charges fees to help it cover the costs of certain services it provides. The District’s food services are included here.
Fund Financial Statements The fund financial statements provide more detailed information about the District’s funds, focusing on its most significant or “major” funds-not the District as a whole. Funds are accounting devices the District uses to keep track of specific sources of funding and spending on particular programs: Some funds are required by State law and by bond covenants. The District establishes other funds to control and manage money for particular purposes (like repaying its long-term debts) or to
show that it is properly using certain revenues (like federal and state grants). The District has three kinds of funds: Governmental funds – Most of the District’s basic services are included in governmental funds, which generally focus on (1)
how cash and other financial assets that can readily be converted to cash flow in and out and (2) the balances left at year-end that are available for spending. Consequently, the governmental funds statements provide a detailed short-term view that helps you determine whether there are more or fewer financial resources that can be spent in the near future to finance the District’s programs. Because this information does not encompass the additional long-term focus of the district-wide statements, we provide additional information with the governmental funds statements that explain the relationship (or differences) between them.
Proprietary funds – Services for which the District charges a fee are generally reported in proprietary funds. Proprietary funds
are reported in the same way as the district-wide statements. - In fact, the District’s enterprise funds (one type of proprietary fund) are the same as its business-type activities, but
provide more detail and additional information, such as cash flows. - We use internal service funds (the other kind of proprietary fund) to report activities that provide supplies and
services for the District’s other programs and activities. The district currently has one internal service fund. -
Fiduciary funds-The District is the trustee, or fiduciary, for assets that belong to others, such as the scholarship fund and the student activities funds. The District is responsible for ensuring that the assets reported in these funds are used only for their intended purposes and by those to whom the assets belong. We exclude these activities from the district-wide financial statements because the District cannot use these assets to finance its operations.
Notes to the financial statements- The notes provide additional information that is essential to a full understanding of the data provided in the government-wide and fund financial statements.
18

CAMDEN COUNTY TECHNICAL SCHOOLS
MANAGEMENT’S DISCUSSION AND ANALYSIS ( MD&A) YEAR ENDED JUNE 30, 2013
FINANCIAL ANALYSIS OF THE DISTRICT AS A WHOLE Net Position. The District’s net position for governmental and business-type activities were $30,411,056 and $325,684, respectively, as of June 30, 2013. The District’s financial position is the product of financial transactions including the net results of activities, the acquisition and disposal of capital assets and the depreciation of capital assets. The following table presents a summary of the District’s net position for the fiscal years ended June 30, 2013 and June 30, 2012:
2013 2012 2013 2012 2013 2012
Current Assets 11,178,979$ 16,202,695$ 339,870$ 65,490$ 11,518,849$ 16,268,185$ Capital Assets, Net 22,081,235 22,282,988 298,631 279,674 22,379,866 22,562,662
Total Assets 33,260,214 38,485,683 638,501 345,164 33,898,714 38,830,847
Current Liabilities 1,740,056 6,242,724 312,817 55,095 2,052,874 6,297,819 Long Term Liabilities 1,109,101 1,205,821 1,109,101 1,205,821
Total Liabilities 2,849,158 7,448,545 312,817 55,095 3,161,975 7,503,640
Net Position:Net Investment in
Capital Assets 22,081,235 22,282,988 298,631 279,674 22,379,866 22,562,662 Restricted 7,121,388 6,214,382 7,121,388 6,214,382 Unrestricted 1,208,433 2,539,768 27,053 10,394 1,235,485 2,550,162
Total Net Position 30,411,056$ 31,037,138$ 325,684$ 290,068$ 30,736,739$ 31,327,206$
Governmental Business Type Activities Activities Total
19

CAMDEN COUNTY TECHNICAL SCHOOLS
MANAGEMENT’S DISCUSSION AND ANALYSIS ( MD&A) YEAR ENDED JUNE 30, 2013
Changes in Net Position. The District’s Net Position for governmental and business-type activities decreased by $590,467 from July 1, 2012 to June 30, 2013. The following table presents a summary of the changes in net position for the fiscal years ended June 30, 2013 and June 30, 2012.
Increase2013 2012 (Decrease)
Revenues:Program Revenues:
Charges for Services 6,563,620$ 6,465,198$ 98,422$ Operating Grants and Contributions 6,721,770 6,698,105 23,665 Capital Grants and Contributions 146,911 155,296 (8,385)
General Revenues:County Budget Appropriation 11,336,033 12,593,022 (1,256,989) Federal and State Aid 22,030,101 26,058,130 (4,028,029) Miscellaneous Income 573,864 425,627 148,237 Cancellation of Prior Year Receivables (320,033) 320,033 Loss on Disposal of Capital Assets (74,008) (2,852,044) 2,778,036
Total Revenues 47,298,292 49,223,301 (1,925,009) Governmental Expenses: - Instruction 17,803,152 16,932,911 870,241 Student and Instruction Related Services 4,295,245 4,382,166 (86,921) School Administrative Services 2,280,550 2,302,985 (22,435) General and Business Admin Services 4,541,408 3,150,819 1,390,589 Plant Operations and Maintenance 5,570,976 5,351,672 219,304 Pupil Transportation 464,043 426,800 37,243 Unallocated Benefits 11,425,172 10,546,211 878,961
Capital Outlay 245,606 157,151 88,455 Special Schools 21,235 21,235
Total Governmental Expense 46,647,387 43,250,715 3,396,672 Business Type Expenses:
Food Service 1,157,474 1,233,934 (76,460) Early Childhood Center 83,899 74,966 8,933
Total Business Type Expenses 1,241,373 1,308,900 (67,527) Total Expenses 47,888,760 44,559,615 3,329,145
Increase (Decrease) in Net Position (590,467) 4,663,686 (5,254,153) Net Position July 1 31,327,207 26,663,521 4,663,686 Net Position June 30 30,736,740$ 31,327,207$ (590,467)$
20
CAMDEN COUNTY TECHNICAL SCHOOLS
MANAGEMENT’S DISCUSSION AND ANALYSIS ( MD&A) YEAR ENDED JUNE 30, 2013
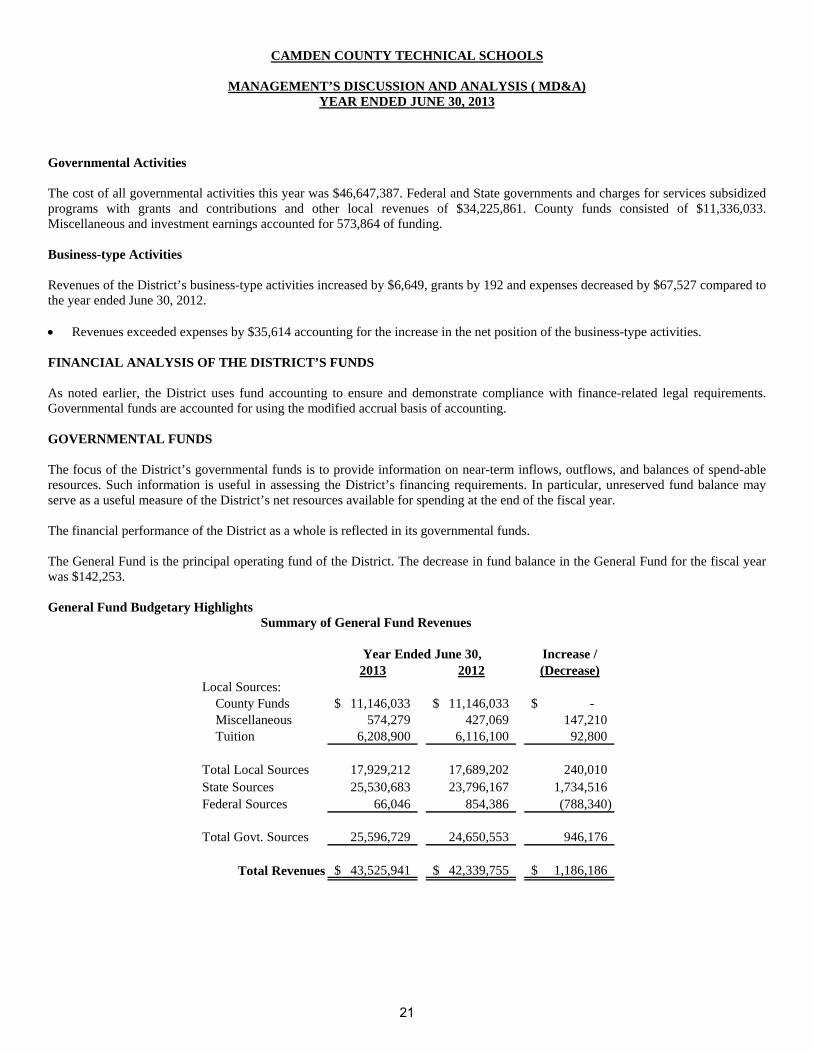
Governmental Activities The cost of all governmental activities this year was $46,647,387. Federal and State governments and charges for services subsidized programs with grants and contributions and other local revenues of $34,225,861. County funds consisted of $11,336,033. Miscellaneous and investment earnings accounted for 573,864 of funding. Business-type Activities Revenues of the District’s business-type activities increased by $6,649, grants by 192 and expenses decreased by $67,527 compared to the year ended June 30, 2012. Revenues exceeded expenses by $35,614 accounting for the increase in the net position of the business-type activities. FINANCIAL ANALYSIS OF THE DISTRICT’S FUNDS As noted earlier, the District uses fund accounting to ensure and demonstrate compliance with finance-related legal requirements. Governmental funds are accounted for using the modified accrual basis of accounting. GOVERNMENTAL FUNDS The focus of the District’s governmental funds is to provide information on near-term inflows, outflows, and balances of spend-able resources. Such information is useful in assessing the District’s financing requirements. In particular, unreserved fund balance may serve as a useful measure of the District’s net resources available for spending at the end of the fiscal year. The financial performance of the District as a whole is reflected in its governmental funds. The General Fund is the principal operating fund of the District. The decrease in fund balance in the General Fund for the fiscal year was $142,253. General Fund Budgetary Highlights Summary of General Fund Revenues
Increase /
2013 2012 (Decrease)Local Sources: County Funds 11,146,033$ 11,146,033$ -$ Miscellaneous 574,279 427,069 147,210 Tuition 6,208,900 6,116,100 92,800
Total Local Sources 17,929,212 17,689,202 240,010 State Sources 25,530,683 23,796,167 1,734,516 Federal Sources 66,046 854,386 (788,340)
Total Govt. Sources 25,596,729 24,650,553 946,176
Total Revenues 43,525,941$ 42,339,755$ 1,186,186$
Year Ended June 30,
21

CAMDEN COUNTY TECHNICAL SCHOOLS
MANAGEMENT’S DISCUSSION AND ANALYSIS (MD&A) YEAR ENDED JUNE 30, 2013
A primary source of funding for the District comes from the County of Camden. County revenues accounted for 26% of total revenues. State Aid accounted for 59% of total revenues. Total General Fund revenues increased by $1,054,138 during the period. Summary of General Fund Expenditures
2013 2012 (Decrease) Change
Regular Ins. 8,155,679$ 7,823,353$ 332,326$ 4%Other Special Inst. 288,011 170,565 117,446 69%Vocational Prog. 6,962,945 6,438,097 524,848 8%Other Inst. 1,148,156 746,005 402,151 54%Support Services and Undistributed Costs 26,787,309 24,175,401 2,611,908 11%Special Schools 21,235 157,151 (135,916) -86%Capital Outlay 262,562 1,894,955 (1,632,393) -86%
Total Expenses 43,625,897$ 41,405,527$ 2,220,370$ 5%
Over the course of the year, the District revised the annual expenditure budget. Differences between the original general fund budget and the final amended budget were a result of authorized transfers only. PROPRIETARY FUND The Proprietary Fund had net position of $325,684 as of June 30, 2013. This reflects a increase of $35,615 from June 30, 2012. This increase is due mainly to increases in revenue and operating transfers. CAPITAL ASSET AND DEBT ADMINISTRATION Capital Assets Capital Assets are individual items purchased at a cost exceeding $2,000, have an extended useful life of one year or more and maintain their identity and structure when placed in service. As of June 30, 2013, the District had invested $38,627,519 in capital assets, including school buildings, athletic facilities, computers and other equipment. This amount represents a net increase prior to depreciation of $ 468,760 from last year. Total depreciation expense for the year was $ 776,237. The following schedule presents the historic cost of capital asset for the fiscal years ended June 30, 2013 and June 30, 2012:
2013 2012Land and Land Improvements 1,523,548$ 1,523,548$ Construction in Progress 8,115,415 7,822,641 Buildings and Improvements 23,105,283 23,105,283
Machinery and Equipment 5,883,273 5,707,287
38,627,519$ 38,158,759$
Year Ended June 30,
22

CAMDEN COUNTY TECHNICAL SCHOOLS
MANAGEMENT’S DISCUSSION AND ANALYSIS ( MD&A) YEAR ENDED JUNE 30, 2013
ECONOMIC FACTORS AND THE DISTRICT’S FUTURE The Camden County Technical Schools District currently has a stable financial position. However, the future State Aid financing of New Jersey public schools is very unpredictable. This was demonstrated again this year by the withholding of the last two state aid payments until after the close of the fiscal year. The District is committed however to overcoming all challenges and continuing sound budgeting, financial practices and planning. The District has also involved itself in the Camden County Transformation Initiative, shared services agreements and other cost savings efforts whenever possible in an effort to reduce its reliance on county tax revenues. This is reflected by the County tax request remaining the same for five consecutive years at $ 11.15 million. At the time, these financial statements were prepared and audited, the District was aware of no new existing circumstances other than the state aid reductions, that could significantly affect its financial health in the future. CONTACTING THE DISTRICT’S FINANCIAL MANAGEMENT This financial report is designed to provide County of Camden citizens, taxpayers, customers, and investors and creditors with a general overview of the District’s finances and to demonstrate the District’s accountability for the money it receives. If you have questions about this report or need additional information, contact the school business administrator/board secretary’s office, Camden County Technical Schools District, 343 Berlin Cross Keys Road, Sicklerville, NJ 08081-4000 (856-767-7000 ext.5400).
23

BASIC FINANCIAL STATEMENTS

DISTRICT-WIDE FINANCIAL STATEMENTS

23400 Exhibit A-1
CAMDEN COUNTY TECHNICAL SCHOOL DISTRICT
Statement of Net PositionAs of June 30, 2013
Governmental Business-TypeActivities Activities Total
ASSETS:
Cash and Cash Equivalents 1,952,700.25$ 174,422.84$ 2,127,123.09$ Receivables, net 863,365.00 8,995.93 872,360.93Interfunds Receivable 258,735.73 258,735.73Internal Balances 34,540.80Intergovernmental Receivables 7,430,065.15 148,411.31 7,578,476.46Inventories 7,832.87 7,832.87Prepaid Expenses 17,963.02 207.00 18,170.02Restricted Assets: Restricted Cash and Cash Equivalents 621,608.67 621,608.67Capital Assets, net 22,081,234.90 298,631.00 22,379,865.90
Total Assets 33,260,213.52 638,500.95 33,864,173.67
LIABILITIES:
Accounts Payable and Other Current Liablities 1,041,162.42 50,590.06 1,091,752.48 Interfunds Payable 258,735.73 258,735.73Unearned Revenue 612,871.86 3,491.64 616,363.50Noncurrent Liabilities: Due Within One Year 86,022.00 86,022.00 Due Beyond One Year 1,109,101.30 1,109,101.30
Total Liabilities 2,849,157.58 312,817.43 3,161,975.01
NET POSITION:
Net Investment in Capital Assets 22,081,234.90 298,631.00 22,379,865.90Restricted for: Capital Reserve 621,608.67 621,608.67 Capital Projects 1,619,290.03 1,619,290.03 Other Purposes 4,880,489.50 4,880,489.50Unrestricted 1,208,432.84 27,052.52 1,235,485.36
Total Net Position 30,411,055.94$ 325,683.52$ 30,736,739.46$
The accompanying Notes to Financial Statements are an integral part of this statement.26

23400
Exh
ibit
A-2
CA
MD
EN
CO
UN
TY
TE
CH
NIC
AL
SC
HO
OL
DIS
TR
ICT
Sta
tem
ent of A
ctiv
ities
For
the F
isca
l Year
Ended J
une 3
0, 2013
Opera
ting
Capita
lC
harg
es
for
Gra
nts
and
Gra
nts
and
Gove
rnm
enta
lB
usi
ness
-Typ
eF
unct
ions
/ P
rogra
ms
Exp
ense
sS
erv
ices
Contr
ibutio
ns
Contr
ibutio
ns
Act
iviti
es
Act
iviti
es
Tota
l
Gove
rnm
enta
l Act
iviti
es:
Inst
ruct
ion:
R
egula
r9,2
92,0
98.5
1$
3,2
40,6
45.7
7$
868,6
23.5
5$
(5,1
82,8
29.1
9)
$
(5,1
82,8
29.1
9)
$
S
peci
al E
duca
tion
33,2
15.1
0
11,5
83.8
6
(21,6
31.2
4)
(21,6
31.2
4)
O
ther
Speci
al I
nst
ruct
ion
258,6
34.9
3
90,1
99.6
7
(168,4
35.2
6)
(168,4
35.2
6)
V
oca
tional
7,0
55,7
45.5
8
2,4
60,7
11.3
3
146,9
11.3
3$
(4,4
48,1
22.9
2)
(4,4
48,1
22.9
2)
O
ther
Inst
ruct
ion
1,1
63,4
58.2
4
405,7
59.3
7
(757,6
98.8
7)
(757,6
98.8
7)
S
upport
Serv
ices:
S
tudent and Inst
ruct
ion R
ela
ted S
erv
ices
4,2
95,2
44.9
5
1,4
04,2
82.5
9(2
,890,9
62.3
6)
(2,8
90,9
62.3
6)
S
chool A
dm
inis
trativ
e S
erv
ices
2,2
80,5
49.6
3
(2,2
80,5
49.6
3)
(2,2
80,5
49.6
3)
G
enera
l and B
usi
ness
Adm
inis
trativ
e S
erv
ices
4,5
41,4
08.4
6
(4,5
41,4
08.4
6)
(4,5
41,4
08.4
6)
P
lant O
pera
tions
and M
ain
tenance
5,5
70,9
75.6
4
(5,5
70,9
75.6
4)
(5,5
70,9
75.6
4)
P
upil
Tra
nsp
ort
atio
n464,0
42.7
6
(464,0
42.7
6)
(464,0
42.7
6)
U
nallo
cate
d B
enefit
s11,4
25,1
71.8
9
3,5
66,6
27.8
3
(7,8
58,5
44.0
6)
(7,8
58,5
44.0
6)
Ite
ms
Less
Than $
2,0
00 C
harg
ed to C
apita
l Outla
y245,6
06.0
5
(245,6
06.0
5)
(245,6
06.0
5)
S
peci
al S
chools
21,2
34.9
0
415.0
0
(20,8
19.9
0)
(20,8
19.9
0)
Tota
l Gove
rnm
enta
l Act
iviti
es
46,6
47,3
86.6
4
6,2
09,3
15.0
0
5,8
39,5
33.9
7
146,9
11.3
3
(34,4
51,6
26.3
4)
-
(34,4
51,6
26.3
4)
Busi
ness
-Typ
e A
ctiv
ities:
F
ood S
erv
ice
1,1
57,4
73.6
7
266,3
95.0
8
882,2
36.3
1
(8,8
42.2
8)
$
(8,8
42.2
8)
E
arly
Child
hood C
ente
r83,8
99.2
4
87,9
10.0
0
4,0
10.7
6
4,0
10.7
6
Tota
l Busi
ness
-Typ
e A
ctiv
ities
1,2
41,3
72.9
1354,3
05.0
8882,2
36.3
1-
-
(4,8
31.5
2)
(4,8
31.5
2)
Tota
l Prim
ary
Gove
rnm
ent
47,8
88,7
59.5
5$
6,5
63,6
20.0
8$
6,7
21,7
70.2
8$
146,9
11.3
3$
(34,4
51,6
26.3
4)
$
(4,8
31.5
2)
$
(34,4
56,4
57.8
6)
$
Genera
l Reve
nues:
C
ounty
Budget A
ppro
priatio
n11,3
36,0
33.0
0$
11,3
36,0
33.0
0$
F
edera
l and S
tate
Aid
not R
est
rict
ed
22,0
30,1
01.0
622,0
30,1
01.0
6 M
isce
llaneous
Inco
me
573,8
64.3
4
573,8
64.3
4T
ran
sfe
rs(4
2,2
97.0
0)
42,2
97.0
0$
-
Loss
on D
isposa
l of F
ixed A
ssets
(72,1
57.0
0)
(1,8
51.0
0)
(74,0
08.0
0)
Tota
l Genera
l Reve
nues,
Speci
al I
tem
s, E
xtra
ord
inary
Ite
ms
and T
ransf
ers
33,8
25,5
44.4
040,4
46.0
033,8
65,9
90.4
0
Change in
Net P
osi
tion
(626,0
81.9
4)
35,6
14.4
8(5
90,4
67.4
6)
Net P
osi
tion -
- Ju
ly 1
31,0
37,1
37.8
8290,0
69.0
431,3
27,2
06.9
2
Net P
osi
tion -
- Ju
ne 3
030,4
11,0
55.9
4$
325,6
83.5
2$
30,7
36,7
39.4
6$
The a
ccom
panyi
ng N
ote
s to
Fin
anci
al S
tate
ments
are
an in
tegra
l part
of th
is s
tate
ment.
Pro
gra
m R
eve
nues
Changes
in N
et P
osi
tion
Net (E
xpense
) R
eve
nue a
nd
27

FUND FINANCIAL STATEMENTS

23400 Exhibit B-1CAMDEN COUNTY TECHNICAL SCHOOL DISTRICT
GOVERNMENTAL FUNDSBalance Sheet
As of June 30, 2013
Special Capital TotalGeneral Revenue Projects Governmental
Fund Funds Fund FundsASSETS:
Cash and Cash Equivalents 2,531,170.97$ 43,137.95$ 2,574,308.92$ Receivables, net 859,715.00 3,650.00 863,365.00Due from Other Funds 4,999,851.43 4,999,851.43Intergovernmental Accounts Receivable: State 58,786.29 6,000.00 5,446,676.71$ 5,511,463.00 Federal 1,913.00 831,653.00 833,566.00 Other 300,659.05 784,377.10 1,085,036.15Prepaid Expenses 17,963.02 17,963.02
Total Assets 8,770,058.76$ 884,440.95$ 6,231,053.81$ 15,885,553.52$
LIABILITIES AND FUND BALANCES:
Liabilities: Accounts Payable 823,190.60$ 215,446.59$ 2,525.23$ 1,041,162.42$ Due to Other Funds 41,213.85 56,122.50 4,609,238.55 4,706,574.90 Unearned Revenue 612,871.86 612,871.86
Total Liabilities 864,404.45 884,440.95 4,611,763.78 6,360,609.18
Fund Balances: Restricted: Capital Reserve 621,608.67 621,608.67 Excess Surplus - Designated for Subsequent Years Expenditures 3,397,073.38 3,397,073.38 Excess Surplus 727,325.94 727,325.94 Capital Projects 1,619,290.03 1,619,290.03 Assigned: Encumbrances 110,860.56 110,860.56 Subsequent Year's Expenditures 645,229.62 645,229.62 Unassigned 2,403,556.14 2,403,556.14
Total Fund Balances 7,905,654.31 - 1,619,290.03 9,524,944.34
Total Liabilities and Fund Balances 8,770,058.76$ 884,440.95$ 6,231,053.81$
Amounts reported for governmental activities in the statement of Net Position (A-1) are different because:
22,081,234.90
(1,195,123.30)
Net Position of governmental activities 30,411,055.94$
The accompanying Notes to Financial Statements are an integral part of this statement.
Capital assets used in governmental activities are not financial resources and, therefore, are notreported in the funds. The cost of the assets are $38,334,744.78 and the accumulated depreciationis $16,546,284.00.
Long-term liabilities, including compensated absences and leases, are not due and payable in thecurrent period and therefore are not reported as liabilities in the funds.
29

23400 Exhibit B-2CAMDEN COUNTY TECHNICAL SCHOOL DISTRICT
GOVERNMENTAL FUNDSStatement of Revenues, Expenditures and Changes in Fund Balances
For the Fiscal Year Ended June 30, 2013
Special Capital TotalGeneral Revenue Projects Governmental
Fund Funds Fund FundsREVENUES:
County Budget Appropriation 11,146,033.00$ 190,000.00$ 11,336,033.00$ Tuition from LEAs 6,208,900.00 6,208,900.00Unrestricted Miscellaneous Revenue 574,279.34 26,450.80$ 600,730.14State Sources 25,530,682.83 5,772.00 25,536,454.83Federal Sources 66,046.06 2,387,594.67 2,453,640.73
Total Revenues 43,525,941.23 2,419,817.47 190,000.00 46,135,758.70
EXPENDITURES:
Current: Regular Instruction 8,155,678.96 868,623.55 9,024,302.51 Special Education Instruction 32,778.10 32,778.10 Other Special Instruction 255,232.93 255,232.93 Vocational Programs 6,962,944.58 6,962,944.58 Other Instruction 1,148,156.24 1,148,156.24 Support Services and Undistributed Costs: Student and Instruction Related Services 2,830,909.36 1,404,282.59 4,235,191.95 School Administrative Services 2,247,454.63 2,247,454.63 Other Administrative Services 4,421,857.46 4,421,857.46 Plant Operations and Maintenance 5,475,705.64 5,475,705.64 Pupil Transportation 375,512.76 375,512.76 Unallocated Benefits 11,435,869.61 11,435,869.61Special Schools 21,234.90 21,234.90Capital Outlay 262,561.72 146,911.33 482,774.12 892,247.17
Total Expenditures 43,625,896.89 2,419,817.47 482,774.12 46,528,488.48
Excess (Deficiency) of Revenues over Expenditures (99,955.66) (292,774.12) (392,729.78)
OTHER FINANCING SOURCES (USES):Operating Transfers:
Enterprise Funds (42,297.00) (42,297.00)
Net Change in Fund Balances (142,252.66) - (292,774.12) (435,026.78)
Fund Balance -- July 1 8,047,906.97 - 1,912,064.15 9,959,971.12
Fund Balance -- June 30 7,905,654.31$ -$ 1,619,290.03$ 9,524,944.34$
The accompanying Notes to Financial Statements are an integral part of this statement.30

23400 Exhibit B-3
CAMDEN COUNTY TECHNICAL SCHOOL DISTRICTReconciliation of the Statement of Revenues, Expenditures,
and Changes in Fund Balances of Governmental Fundsto the Statement of Activities
For the Fiscal Year Ended June 30, 2013
Total Net Change in Fund Balances - Governmental Funds (435,026.78)$
Amounts reported for governmental activities in the statement of activities (A-2) are different because:
Depreciation Expense (776,237.00)$ Loss on Disposal of Capital Assets (72,157.00) Capital Outlays 892,247.17 Capital Outlays Below Depreciation Threshold (245,606.05)
(201,752.88)
10,697.72
Change in Net Position of Governmental Activities (626,081.94)$
The accompanying Notes to Financial Statements are an integral part of this statement.
Capital outlays are reported in governmental funds as expenditures. However, inthe statement of activities, the cost of those assets is allocated over theirestimated useful lives as depreciation expense. This is the amount by whichactual capital outlays exceeded depreciation in the period.
In the statement of activities, certain operating expenses, e.g., compensatedabsences (vacations) are measured by the amounts earned during the year. Inthe governmental funds, however, expenditures for these items are reported inthe amount of financial resources used (paid) . When the earned amountexceeds the paid amount, the difference is reduction in the reconciliation; whenthe paid amount exceeds the earned amount the difference is an addition to thereconciliation.
31

23400 Exhibit B-4CAMDEN COUNTY TECHNICAL SCHOOL DISTRICT
PROPRIETARY FUNDSStatement of Net Position
As of June 30, 2013
Business Type Activities - Enterprise Funds
Food EarlyService Childhood Total
ASSETS:
Current Assets:Cash and Cash Equivalents 174,422.84$ 174,422.84$ Intergovernmental Accounts Receivable:
State 2,852.98 2,852.98 Federal 145,558.33 145,558.33
Other Accounts Receivable 957.68 957.68 Tuition Receivable 8,038.25$ 8,038.25 Prepaid Expenses 207.00 207.00 Due from Other Funds 6,856.29 6,856.29 Inventories 7,832.87 7,832.87
Total Current Assets 331,624.70 15,101.54 346,726.24
Capital Assets, Net of AccumulatedDepreciation 298,631.00 298,631.00
Total Assets 630,255.70 15,101.54 645,357.24
LIABILITIES:
Current Liabilities:Due to Other Funds 265,592.02 265,592.02 Accounts Payable 47,433.71 3,156.35 50,590.06 Prepaid Meals 967.41 967.41 Unearned Revenue 1,149.23 1,375.00 2,524.23
Total Current Liabilities 315,142.37 4,531.35 319,673.72
NET POSITION:
Net Investment in Capital Assets 298,631.00 298,631.00 Unrestricted 16,482.33 10,570.19 27,052.52
Total Net Position 315,113.33$ 10,570.19$ 325,683.52$
The accompanying Notes to Financial Statements are an integral part of this statement.32

23400 Exhibit B-5CAMDEN COUNTY TECHNICAL SCHOOL DISTRICT
PROPRIETARY FUNDSStatement of Revenues, Expenses and Changes in Fund Net Position
For the Fiscal Year Ended June 30, 2013
Business Type Activities - Enterprise Funds
Food EarlyService Childhood Total
OPERATING REVENUES:
Charges for Services: Daily Sales - Reimbursable Programs 237,892.05$ 237,892.05$ Daily Sales - Non-Reimbursable Programs 2,622.59 2,622.59 Miscellaneous 25,880.44 25,880.44 Tuition Fees, Net of Bad Debt Expense of $405.00 87,910.00$ 87,910.00
Total Operating Revenues 266,395.08 87,910.00 354,305.08
OPERATING EXPENSES:
Salaries 341,400.90 57,375.37 398,776.27 Employee Benefits 62,321.79 4,389.22 66,711.01 Other Purchased Services 170,119.05 5,075.31 175,194.36 General Supplies 63,372.83 17,059.34 80,432.17 Cost of Sales 498,769.10 498,769.10 Depreciation 21,490.00 21,490.00
Total Operating Expenses 1,157,473.67 83,899.24 1,241,372.91
Operating Income (Loss) (891,078.59) 4,010.76 (887,067.83)
NON-OPERATING REVENUES (EXPENSES):
State Sources: State School Lunch Program 13,234.37 13,234.37 Federal Sources:
National School Lunch Program 807,240.83 807,240.83 Food Distribution Program 61,761.11 61,761.11 Loss on Disposal of Capital Assets (1,851.00) (1,851.00)
Total Non-Operating Revenues (Expenses) 880,385.31 - 880,385.31
Income (Loss) before Contributions and Transfers (10,693.28) 4,010.76 (6,682.52)
Transfer In - General Fund 42,297.00 42,297.00
Change in Net Position 31,603.72 4,010.76 35,614.48
Net Position -- July 1 283,509.61 6,559.43 290,069.04
Net Position -- June 30 315,113.33$ 10,570.19$ 325,683.52$
The accompanying Notes to Financial Statements are an integral part of this statement.
33

23400 Exhibit B-6CAMDEN COUNTY TECHNICAL SCHOOL DISTRICT
PROPRIETARY FUNDSStatement of Cash Flows
For the Fiscal Year Ended June 30, 2013
Business Type Activities - Enterprise Funds
Food Early Service Childhood Totals
CASH FLOWS FROM OPERATING ACTIVITIES:Receipts from Customers 266,487.09$ 83,864.50$ 350,351.59$ Payments to Employees (341,400.90) (57,375.37) (398,776.27) Payments for Employee Benefits (62,321.79) (4,389.22) (66,711.01) Payments to Suppliers (474,225.38) (22,099.91) (496,325.29)
Net Cash Provided by (Used for) Operating Activities (611,460.98) - (611,460.98)
CASH FLOWS FROM CAPITAL FINANCING ACTIVITIES: Capital Acquisitions (42,297.00) (42,297.00)
CASH FLOWS FROM NON-CAPITAL FINANCING ACTIVITIES:State Sources 10,497.21 10,497.21 Federal Sources 741,350.56 741,350.56 Board Contribution 42,297.00 42,297.00
Net Cash Provided by (Used for) Non-Capital Financing Activities 794,144.77 - 794,144.77
CASH FLOWS FROM INVESTING ACTIVITIES:Interest on Investments - - -
Net Increase (Decrease) in Cash and Cash Equivalents 140,386.79 - 140,386.79
Cash and Cash Equivalents -- July 1 34,036.05 - 34,036.05
Cash and Equivalents -- June 30 174,422.84$ -$ 174,422.84$
Reconciliation of Operating Loss to Net Cash Provided (Used) by Operating Activities: Operating Income (Loss) (891,078.59)$ 4,010.76$ (887,067.83)$ Adjustments to Reconcile Operating Income (Loss) to Cash Provided (Used) by Operating Actitivies: Depreciation Expense 21,490.00 21,490.00 Change in Assets and Liabililties: (Increase) Decrease in Accounts Receivable (385.90) (3,770.25) (4,156.15) (Increase) Decrease in Inventory (797.84) (797.84) (Increase) Decrease in Prepaid Expenses 747.35 747.35 (Increase) Decrease in Interfunds 252,375.62 (1,926.74) 250,448.88 Increase (Decrease) in Accounts Payable 6,457.82 1,214.13 7,671.95 Increase (Decrease) in Unearned Revenue 477.91 (275.25) 202.66
Net Cash Provided by (Used for) Operating Activities (611,460.98)$ -$ (611,460.98)$
The accompanying Notes to Financial Statements are an integral part of this statement.
34

23400 Exhibit B-7
CAMDEN COUNTY TECHNICAL SCHOOL DISTRICTFIDUCIARY FUNDS
Statement of Fiduciary Net PositionAs of June 30, 2013
Trust Funds Agency FundsUnemployment PrivateCompensation Purpose Student
Trust Scholarship Activity PayrollASSETS:
Cash and Cash Equivalents 321,400.49$ 18,239.23$ 149,855.20$ 249,247.29$ Due from General Fund 21,000.00 610.69 Due from Trust Funds 6,946.52
Total Assets 342,400.49 18,239.23 150,465.89 256,193.81
LIABILITIES:
Payable to State 3,901.50 Payroll Deductions Payable 196,708.17Flexible Spending 3,334.15Due to Agency 6,946.52Due to General Fund 56,151.49 Due to Student Groups 150,465.89
Total Liabilities 10,848.02 - 150,465.89$ 256,193.81$
Net Position:
Held in Trust for:Scholarships 18,239.23 Unemployment 331,552.47
Total Net Position 331,552.47$ 18,239.23$
The accompanying Notes to Financial Statements are an integral part of this statement.
35

23400 Exhibit B-8
CAMDEN COUNTY TECHNICAL SCHOOL DISTRICTFIDUCIARY FUNDS
Statement of Changes in Fiduciary Net PositionFor the Fiscal Year Ended June 30, 2013
Private UnemploymentPurpose Compensation
Scholarship Insurance
ADDITIONS:Local Sources:
Board Contributions 21,000.00$ Interest Income 3.85$ 5.23 Donations 7,205.65 Deductions from Employees' Salaries 40,528.45
Total Additions 7,209.50 61,533.68
DEDUCTIONS:Scholarship Payments 5,368.00 Unemployment Compensation Claims 73,876.59
Total Deductions 5,368.00 73,876.59
Change in Net Position 1,841.50 (12,342.91)
Net Position, July 1 16,397.73 343,895.38
Net Position, June 30 18,239.23$ 331,552.47$
The accompanying Notes to Financial Statements are an integral part of this statement.36

CAMDEN COUNTY TECHNICAL SCHOOLS Notes to Financial Statements
For the Fiscal Year Ended June 30, 2013 Note 1: SUMMARY OF SIGNIFICANT ACCOUNTING POLICIES
The financial statements of the Camden County Technical School District (the “School District”) have been prepared to conform with accounting principles generally accepted in the United States of America (“GAAP”) as applied to governmental units. The Governmental Accounting Standards Board (“GASB”) is the accepted standard setting body for establishing governmental accounting and financial reporting principles. The following is a summary of the more significant of these policies.
Description of the Reporting Entity The School District is a Type I district located in the County of Camden, State of New Jersey. As a Type I district, the School District functions independently through a Board of Education. The Board is comprised of five members appointed to four-year terms. These terms are staggered so that one member's term expires each year. The Superintendent is appointed by the Board to act as executive officer of the School District. The purpose of the School District is to educate students in grades 9-12 and the post-secondary students at its two schools. The School District has an approximate enrollment at June 30, 2013 of 2,158. The primary criterion for including activities within the School District's reporting entity, as set forth in Section 2100 of the Governmental Accounting Standards Board Codification of Governmental Accounting and Financial Reporting Standards, is the degree of oversight responsibility maintained by the School District. Oversight responsibility includes financial interdependency, selection of governing authority, designation of management, ability to significantly influence operations and accountability for fiscal matters. The combined financial statements include all funds of the School District over which the Board exercises operating control. There were no additional entities required to be included in the reporting entity under the criteria as described above, in the current fiscal year. Furthermore, the School District is not includable in any other reporting entity on the basis of such criteria. Component Units GASB Statement No. 14, The Financial Reporting Entity, and GASB Statement No. 39, Determining Whether Certain Organizations are Component Units, provide guidance that all entities associated with a primary government are potential component units, and should be evaluated for inclusion in the financial reporting entity. A primary government is financially accountable not only for the organizations that make up its legal entity, but also for legally separate organizations that meet the criteria established by GASB Statements No. 14 and No. 39. In addition, GASB Statement No. 61, The Financial Reporting Entity: Omnibus - an amendment of GASB Statements No. 14 and No. 34, provides additional guidance for organizations that do not meet the financial accountability criteria for inclusion as component units but that nevertheless should be included because the primary government’s management determines that it would be misleading to exclude them. In addition, GASB Statement No. 61 clarifies the manner in which component units are presented (discretely presented, blended, or included in the fiduciary fund financial statements). Based on the aforementioned, The School District is a component unit of the County of Camden as described in Governmental Accounting Standards Board Statement No. 14. These financial statements would be either blended or discretely presented as part of the County’s financial statements if the County reported using general accepted accounting principles applicable to governmental entities. Measurement Focus, Basis of Accounting and Financial Statement Presentation The School District’s basic financial statements consist of government-wide statements, including a statement of net position and a statement of activities, and fund financial statements, which provide a more detailed level of financial information.
37

23400 Notes to Financial Statements (Cont'd) Note 1: SUMMARY OF SIGNIFICANT ACCOUNTING POLICIES (CONT’D)
Measurement Focus, Basis of Accounting and Financial Statement Presentation (Cont’d) Government-wide Financial Statements - The statement of net position and the statement of activities display information about the School District as a whole. These statements include the financial activities of the primary government, except for fiduciary funds. The government-wide financial statements are prepared using the economic resources measurement focus. This is the same approach used in the preparation of the proprietary fund financial statements but differs from the manner in which governmental fund financial statements are prepared. Governmental fund financial statements therefore include a reconciliation with brief explanations to better identify the relationship between the government-wide statements and the statements for governmental funds. The government-wide statement of activities presents a comparison between direct expenses and program revenues for each function or program of the School District’s governmental activities. Direct expenses are those that are specifically associated with a service, program, or department and, therefore, clearly identifiable to a particular function. It is the policy of the School District to not allocate indirect expenses to functions in the statement of activities. Program revenues include charges paid by the recipient of the goods or services offered by the program, grants, and contributions that are restricted to meeting the operational or capital requirements of a particular program. Revenues which are not classified as program revenues are presented as general revenues of the School District. The comparison of direct expenses with program revenues identifies the extent to which each governmental function is self-financing or draws from the general revenues of the School District. Fund Financial Statements - The School District segregates transactions related to certain functions or activities in separate funds in order to aid financial management and to demonstrate legal compliance. A fund is defined as a fiscal and accounting entity with a self-balancing set of accounts. Fund financial statements report detailed information about the School District. The focus of governmental fund financial statements is on major funds rather than reporting funds by type. Each major fund is presented in a single column. Fiduciary funds are reported by fund type. The governmental funds are accounted for on the “flow of current financial resources” measurement focus. This measurement focus is based on the concept of accountability, which includes measuring interperiod equity whether current year revenues were sufficient to pay for current year services. The proprietary fund is accounted for on an “economic resources” measurement focus. Accordingly, statement of revenues, expenses and changes in fund net position for the proprietary fund reports increases and decreases in total economic worth. The private-purpose trust fund is reported using the economic resources measurement focus.
Governmental Funds - Governmental funds are those through which most School District functions are financed. The acquisition, use, and balances of the School District’s expendable financial resources and the related liabilities, except those accounted for in the proprietary fund and fiduciary funds, are accounted for through the governmental funds. The measurement focus is upon determination of changes in financial resources rather than upon determination of net income. The following are the School District’s major governmental funds:
General Fund - The general fund is the primary operating fund of the School District. It is used to account for all financial resources except those required to be accounted for in another fund. Included are certain expenditures for vehicles and movable instructional or non-instructional equipment classified in the capital outlay sub-fund. As required by the New Jersey State Department of Education, the School District includes budgeted capital outlay in this fund. Accounting principles generally accepted in the United States of America, as they pertain to governmental entities, state that general fund resources may be used to directly finance capital outlays for long-lived improvements as long as the resources in such cases are derived exclusively from unrestricted revenues.
38

23400 Notes to Financial Statements (Cont'd) Note 1: SUMMARY OF SIGNIFICANT ACCOUNTING POLICIES (CONT’D)
Measurement Focus, Basis of Accounting and Financial Statement Presentation (Cont’d)
General Fund (Cont’d) Resources for budgeted capital outlay purposes are normally derived from State of New Jersey aid, ad valorem tax revenues, and appropriated fund balance. Expenditures are those which result in the acquisition of or additions to capital assets for land, existing buildings, improvements of grounds, construction of buildings, additions to, or remodeling of buildings, and the purchase of built-in equipment.
In addition to the capital outlay sub-fund, the School District is accountable for an additional sub-fund, the Education Jobs Fund (“Ed Jobs”), resulting from federal legislation signed into law on August 10, 2010. The Ed Jobs program was created to provide funding assistance to states in order to save or create education jobs for the 2010-2011 school year, through September 30, 2012. Jobs funded under this program include those that provide educational and related services for early childhood, elementary, and secondary education. Ed Jobs revenues and expenditures are recorded in the general fund (fund 18) on a reimbursement basis. As such, revenue is not included in the fiscal year surplus, and no portion of general fund balance at June 30, 2013 is considered to be attributable to Ed Jobs. Ed Jobs expenditures during the fiscal year ended June 30, 2013 are included as a component of overall general fund expenditures, and also are included in total general fund expenditures for purposes of the excess surplus calculation.
Special Revenue Fund - The special revenue fund is used to account for and report the proceeds of specific revenue sources that are restricted or committed to expenditure for specified purposes other than debt service or capital projects.
Capital Projects Fund - The capital projects fund is used to account for and report financial resources that are restricted, committed, or assigned to expenditure for capital outlays, including the acquisition or construction of capital facilities and other capital assets, other than those financed by proprietary funds. The financial resources are derived from New Jersey Economic Development Authority grants, temporary notes, or serial bonds which are specifically authorized by the voters as a separate question on the ballot either during the annual election or at a special election.
Proprietary Funds Proprietary funds are used to account for the School District’s ongoing organizations and activities, which are operated and financed in a manner similar to those found in the private sector. The measurement focus is upon the determination of net income. Operating revenues and expenses generally result from providing services and producing and delivering goods in connection with a proprietary fund’s principal ongoing operations. All items not meeting this definition are reported as non-operating revenues and expenses. The School District maintains the following enterprise funds:
Food Service Fund - This fund accounts for the financial transactions related to the food service operations of the School District. Early Childhood Fund - This fund accounts for the financial related activities associated with the child day care center for staff and the community.
39

23400 Notes to Financial Statements (Cont'd) Note 1: SUMMARY OF SIGNIFICANT ACCOUNTING POLICIES (CONT’D)
Measurement Focus, Basis of Accounting and Financial Statement Presentation (Cont’d)
Fiduciary Funds Fiduciary funds are used to account for assets held by the School District on behalf of outside related organizations or on behalf of other funds within the School District. The fiduciary fund category is split into four classifications: pension trust funds, investment trust funds, private-purpose trust funds, and agency funds. The School District maintains the following fiduciary funds:
Agency Funds - Agency funds are used to account for assets held by the School District in a trustee capacity or as an agent for individuals, private organizations, other governments, and / or other funds (i.e., payroll and student activities). The School District retains no equity interest in these funds. Agency funds are custodial in nature (assets equal liabilities) and do not involve measurement of results of operations. The School District maintains the following agency funds: student activity fund and payroll fund.
Private-Purpose Trust Funds - Private-purpose trust funds are used to account for the principal and income for all other trust arrangements that benefit individuals, private organizations, or other governments. The School District maintains the following private-purpose trust funds:
Scholarship Fund - Revenues consist of donations and interest income. Expenditures represent scholarships, which are awarded in accordance with the trust requirements.
New Jersey Unemployment Compensation Insurance Trust Fund - Revenues consist of contributions that have been included in the annual budget of the School District, employee payroll withholdings, and interest income. Expenditures represent claims incurred for unemployment.
Basis of Accounting
Basis of accounting determines when transactions are recorded in the financial records and reported on the financial statements. Government-wide financial statements are prepared using the accrual basis of accounting. Governmental funds use the modified accrual basis of accounting. Proprietary and fiduciary funds also use the accrual basis of accounting.
Modified Accrual
Under the modified accrual basis, revenues are recognized in the accounting period in which they become susceptible to accrual, i.e. both available and measurable. “Measurable” means the amount of the transaction can be determined and “available” means collectible within the current period or soon enough thereafter to be used to pay liabilities of the current period. Significant revenues susceptible to accrual include ad valorem taxes, reimbursable-type grants, and interest on investments. The School District considers all revenues, with the exception of the expenditure-driven grants, as available if they are collected within sixty (60) days after fiscal year-end. The expenditure driven grants are considered available if received within one fiscal year from the balance sheet date. Property tax revenue is recognized when taxes are received, except at fiscal year end when revenue is recognized for taxes received by the School District within sixty (60) days subsequent to fiscal year end. Expenditures are recognized in the accounting period in which the liability is incurred. However, exceptions include the amount of unmatured principal and interest on general long-term debt, compensated absences, claims and judgments and certain prepaids which are recognized when due / paid.
40

23400 Notes to Financial Statements (Cont'd) Note 1: SUMMARY OF SIGNIFICANT ACCOUNTING POLICIES (CONT'D)
Measurement Focus, Basis of Accounting and Financial Statement Presentation (Cont’d) Basis of Accounting (Cont’d)
Modified Accrual (Cont’d) In applying the susceptible to accrual concept to revenues from federal and state sources, the legal contractual requirements of the numerous individual programs are used as guidance. Revenue from grants and entitlements is recognized when all eligibility requirements have been satisfied. There are, however, essentially two types of these revenues. In one, monies must be expended for the specific purpose or project before the School District will receive any amounts; therefore, revenues are recognized based on the occurrence of expenditures. In the other type, monies are virtually unrestricted as to purpose of expenditure and are usually revocable only for failure to comply with prescribed legal and contractual requirements. These resources are reflected as revenues at the time of receipt or earlier if the susceptible to accrual criteria are met. In cases where monies are received and all eligibility requirements, including timing, have been satisfied, but the occurrence of expenditure has yet to happen, amounts are reported as unearned revenue. Conversely, where monies are received but eligibility requirements, including timing, have yet to be satisfied, such amounts are reported as deferred inflows of resources. Accrual
Under the accrual basis of accounting, revenues are recognized in the period earned and expenses are recognized in the period incurred.
Revenue Recognition
County Budget Appropriation – The County Budget Appropriation is susceptible to accrual. As the District is a type I school district, it does not levy property taxes, the District receives an appropriation from the County of Camden’s budget. The School District records the entire approved appropriation as revenue (accrued) at the start of the fiscal year since the revenue is both measurable and available. The School District is entitled to receive moneys under the established payment schedule and the unpaid amount is considered to be an "accounts receivable".
When both restricted and unrestricted resources are available for use, it is the School District’s policy to use restricted resources first, and then unrestricted resources as they are needed.
Budgets / Budgetary Control Annual appropriated budgets are prepared in the spring of each fiscal year for the general, special revenue, and debt service funds, and are submitted to the county office. Budgets are prepared using the modified accrual basis of accounting. The legal level of budgetary control is established at line item accounts within each fund. Line item accounts are defined as the lowest (most specific) level of detail as established pursuant to the minimum chart of accounts referenced in N.J.A.C. 6A:23A-16.2(f)1. Transfers of appropriations may be made by school board resolution at any time during the fiscal year in accordance with N.J.A.C. 6A:23A-13.3.
41

23400 Notes to Financial Statements (Cont'd) Note 1: SUMMARY OF SIGNIFICANT ACCOUNTING POLICIES (CONT'D)
Budgets / Budgetary Control (Cont’d) Formal budgetary integration into the accounting system is employed as a management control device during the year. For governmental funds there are no substantial differences between the budgetary basis of accounting and generally accepted accounting principles, with the exception of the legally mandated revenue recognition of the one or more June state aid payments for budgetary purposes only, and the special revenue fund. N.J.S.A. 18A:22-44.2 provides that in the event a state school aid payment is not made until the following school budget year, school districts must record the delayed one or more June state aid payments as revenue, for budget purposes only, in the current school budget year. The bill provides legal authority for school districts to recognize this revenue in the current budget year. Encumbrance accounting is also employed as an extension of formal budgetary integration in the governmental fund types. Unencumbered appropriations lapse at fiscal year-end. The accounting records of the special revenue fund are maintained on the budgetary basis. The budgetary basis differs from GAAP in that the budgetary basis recognizes encumbrances as expenditures and also recognizes the related revenues, whereas the GAAP basis does not. Sufficient supplemental records are maintained to allow for the presentation of GAAP basis financial reports. The budget, as detailed on Exhibit C-1, Exhibit C-2, and Exhibit I-3, includes all amendments to the adopted budget, if any.
Exhibit C-3 presents a reconciliation of the general fund revenues and special revenue fund revenues and expenditures from the budgetary basis of accounting, as presented in the general fund budgetary comparison schedule and the special revenue fund budgetary comparison schedule, to the GAAP basis of accounting as presented in the statement of revenues, expenditures and changes in fund balances - governmental funds. Note that the School District does not report encumbrances outstanding at fiscal year-end as expenditures in the general fund since the general fund budget follows the modified accrual basis of accounting, with the exception of the aforementioned revenue recognition policy for the one or more June state aid payments.
Encumbrances Encumbrance accounting, under which purchase orders, contracts, and other commitments for the expenditure of funds are recorded to reserve a portion of the applicable appropriation, is utilized for budgetary control purposes. Encumbrances are a component of fund balance at fiscal year-end as they do not constitute expenditures or liabilities, but rather commitments related to unperformed contracts for goods and services. Open encumbrances in the governmental funds, other than the special revenue fund, which have not been previously restricted, committed, or assigned, should be included within committed or assigned fund balance, as appropriate. Open encumbrances in the special revenue fund, however, for which the School District has received advances of grant awards, are reflected on the balance sheet as unearned revenues at fiscal year-end. The encumbered appropriation authority carries over into the next fiscal year. An entry will be made at the beginning of the next fiscal year to increase the appropriation reflected in the certified budget by the outstanding encumbrance amount as of the current fiscal year end.
42

23400 Notes to Financial Statements (Cont'd) Note 1: SUMMARY OF SIGNIFICANT ACCOUNTING POLICIES (CONT'D)
Cash, Cash Equivalents and Investments Cash and cash equivalents, for all funds, include petty cash, change funds, cash in banks and all highly liquid investments with a maturity of three months or less at the time of purchase and are stated at cost plus accrued interest. Such is the definition of cash and cash equivalents used in the statement of cash flows for the proprietary funds. U.S. treasury and agency obligations and certificates of deposit with maturities of one year or less when purchased are stated at cost. All other investments are stated at fair value. New Jersey school districts are limited as to the types of investments and types of financial institutions they may invest in. N.J.S.A. 18A:20-37 provides a list of permissible investments that may be purchased by New Jersey school districts. N.J.S.A. 17:9-41 et seq. establishes the requirements for the security of deposits of governmental units. The statute requires that no governmental unit shall deposit public funds in a public depository unless such funds are secured in accordance with the Governmental Unit Deposit Protection Act (“GUDPA”), a multiple financial institutional collateral pool, which was enacted in 1970 to protect governmental units from a loss of funds on deposit with a failed banking institution in New Jersey. Public depositories include State or federally chartered banks, savings banks or associations located in or having a branch office in the State of New Jersey, the deposits of which are federally insured. All public depositories must pledge collateral, having a market value at least equal to five percent of the average daily balance of collected public funds, to secure the deposits of governmental units. If a public depository fails, the collateral it has pledged, plus the collateral of all other public depositories, is available to pay the amount of their deposits to the governmental units.
Inventories Inventories are valued at cost, which approximates market. The costs are determined on a first-in, first-out method. Inventories recorded on the government-wide financial statements and in the proprietary fund types are recorded as expenses when consumed rather than when purchased. Tuition Receivable Tuition charges were established by the School District based on estimated costs. The charges are subject to adjustment when the final costs are determined. Prepaid Expenses Prepaid expenses recorded on the government-wide financial statements, government fund financial statements and in the proprietary fund financial statements represent payments made to vendors for services that will benefit periods beyond June 30, 2013. Short-Term Interfund Receivables / Payables Short-term interfund receivables / payables (internal balances) represent amounts that are owed, other than charges for goods or services rendered to / from a particular fund within the School District, and that are due within one year. Such balances are eliminated in the statement of net position to minimize the grossing up of internal balances, thus leaving a net amount due between the governmental and business-type activities that are eliminated in the total government column. Balances with fiduciary activities are not considered to be internal balances; therefore, such balances appear on the statement of net position.
43
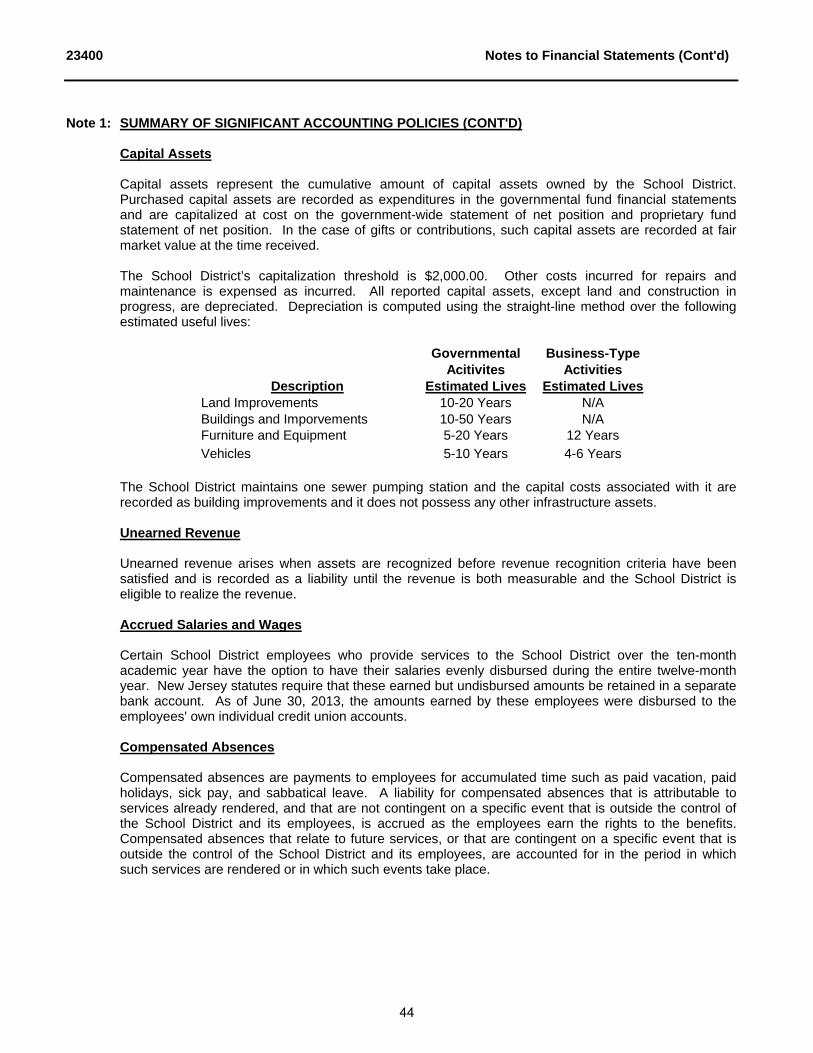
23400 Notes to Financial Statements (Cont'd) Note 1: SUMMARY OF SIGNIFICANT ACCOUNTING POLICIES (CONT'D)
Capital Assets Capital assets represent the cumulative amount of capital assets owned by the School District. Purchased capital assets are recorded as expenditures in the governmental fund financial statements and are capitalized at cost on the government-wide statement of net position and proprietary fund statement of net position. In the case of gifts or contributions, such capital assets are recorded at fair market value at the time received.
The School District’s capitalization threshold is $2,000.00. Other costs incurred for repairs and maintenance is expensed as incurred. All reported capital assets, except land and construction in progress, are depreciated. Depreciation is computed using the straight-line method over the following estimated useful lives:
Governmental Business-Type
Acitivites ActivitiesDescription Estimated Lives Estimated Lives
Land Improvements 10-20 Years N/ABuildings and Imporvements 10-50 Years N/AFurniture and Equipment 5-20 Years 12 YearsVehicles 5-10 Years 4-6 Years
The School District maintains one sewer pumping station and the capital costs associated with it are recorded as building improvements and it does not possess any other infrastructure assets. Unearned Revenue Unearned revenue arises when assets are recognized before revenue recognition criteria have been satisfied and is recorded as a liability until the revenue is both measurable and the School District is eligible to realize the revenue. Accrued Salaries and Wages Certain School District employees who provide services to the School District over the ten-month academic year have the option to have their salaries evenly disbursed during the entire twelve-month year. New Jersey statutes require that these earned but undisbursed amounts be retained in a separate bank account. As of June 30, 2013, the amounts earned by these employees were disbursed to the employees' own individual credit union accounts. Compensated Absences Compensated absences are payments to employees for accumulated time such as paid vacation, paid holidays, sick pay, and sabbatical leave. A liability for compensated absences that is attributable to services already rendered, and that are not contingent on a specific event that is outside the control of the School District and its employees, is accrued as the employees earn the rights to the benefits. Compensated absences that relate to future services, or that are contingent on a specific event that is outside the control of the School District and its employees, are accounted for in the period in which such services are rendered or in which such events take place.
44

23400 Notes to Financial Statements (Cont'd) Note 1: SUMMARY OF SIGNIFICANT ACCOUNTING POLICIES (CONT'D)
Compensated Absences (Cont’d) The School District uses the vesting method to calculate the compensated absences amount. The entire compensated absence liability, including the employer’s share of applicable taxes, is reported on the government-wide financial statements. The portion related to employees in the proprietary funds is recorded at the fund level. The current portion is the amount estimated to be used in the following fiscal year. An expenditure is recognized in the governmental funds as payments come due each period, for example, as a result of employee resignations and retirements. Compensated absences not recorded at the fund level represent a reconciling item between the fund level and government-wide presentations. Accrued Liabilities and Long-Term Obligations All payables, accrued liabilities, and long-term obligations are reported in the government-wide financial statements, and all payables, accrued liabilities, and long-term obligations payable from proprietary funds are reported on the proprietary fund financial statements. In general, governmental fund payables and accrued liabilities that, once incurred, are paid in a timely manner, and in full from current financial resources, are reported as obligations of the funds. However, claims and judgments, compensated absences, special termination benefits, and contractually required pension contributions that will be paid from governmental funds, are reported as a liability in the fund financial statements only to the extent that they are normally expected to be paid with expendable available financial resources. Bonds are recognized as a liability on the governmental fund financial statements when due. Net Position Net position represents the difference between the summation of assets and deferred outflows of resources, and the summation of liabilities and deferred inflows of resources. Net position is classified into the following three components:
Net Investment in Capital Assets - This component represents capital assets, net of accumulated depreciation, net of outstanding balances of borrowings used for the acquisition, construction, or improvement of those assets.
Restricted - Net position is reported as restricted when there are limitations imposed on their use either through the enabling legislation adopted by the School District or through external restrictions imposed by creditors, grantors or laws or regulations of other governments.
Unrestricted - Net position is reported as unrestricted when it does not meet the criteria of the other two components of net position.
The School District applies restricted resources when an expense is incurred for purposes for which both restricted and unrestricted net position is available. Fund Balance The School District reports fund balance in classifications that comprise a hierarchy based primarily on the extent to which the School District is bound to honor constraints on the specific purposes for which amounts in those funds can be spent. The School District’s classifications, and policies for determining such classifications, are as follows:
Nonspendable - The nonspendable fund balance classification includes amounts that cannot be spent because they are either not in spendable form or are legally or contractually required to be maintained intact. The “not in spendable form” criterion includes items that are not expected to be converted to cash, such as inventories and prepaid amounts.
45

23400 Notes to Financial Statements (Cont'd) Note 1: SUMMARY OF SIGNIFICANT ACCOUNTING POLICIES (CONT'D)
Fund Balance (Cont’d)
Restricted - The restricted fund balance classification includes amounts that are restricted to specific purposes. Such restrictions, or constraints, are placed on the use of resources either by being (1) externally imposed by creditors, grantors, contributors, or laws or regulations of other governments; or (2) imposed by law through constitutional provisions or enabling legislation.
Committed - The committed fund balance classification includes amounts that can only be used for specific purposes pursuant to constraints imposed by formal action of the School District’s highest level of decision-making authority, which, for the School District, is the Board of Education. Such formal action consists of an affirmative vote by the Board of Education, memorialized by the adoption of a resolution. Once committed, amounts cannot be used for any other purpose unless the Board of Education removes, or changes, the specified use by taking the same type of action (resolution) it employed to previously commit those amounts.
Assigned - The assigned fund balance classification includes amounts that are constrained by the School District’s intent to be used for specific purposes, but are neither restricted nor committed. Intent is expressed by the Board of Education.
Unassigned - The unassigned fund balance classification is the residual classification for the general fund. This classification represents fund balance that has not been assigned to other funds and that has not been restricted, committed, or assigned to specific purposes within the general fund. The general fund is the only fund that reports a positive unassigned fund balance amount. In other governmental funds, if expenditures incurred for specific purposes exceed the amounts restricted, committed, or assigned to those purposes, it may be necessary to report a negative unassigned fund balance.
When an expenditure is incurred for purposes for which both restricted and unrestricted fund balances are available, it is the policy of the School District to spend restricted fund balances first. Moreover, when an expenditure is incurred for purposes for which amounts in any of the unrestricted fund balance classifications can be used, it is the policy of the School District to spend fund balances, if appropriate, in the following order: committed, assigned, then unassigned.
Interfund Activity
Transfers between governmental and business-type activities on the government-wide statements are reported in the same manner as general revenues. Exchange transactions between funds are reported as revenues in the seller funds and as expenditures / expenses in the purchaser funds. Flows of cash or goods from one fund to another without a requirement for repayment are reported as interfund transfers. Interfund transfers are reported as other financing sources / uses in governmental funds and after non-operating revenues / expenses in proprietary funds. Reimbursements from funds responsible for particular expenditures / expenses to the funds that initially paid for them are not presented on the financial statements.
Accounting Estimates The preparation of financial statements in conformity with accounting principles generally accepted in the United States of America requires management to make estimates and assumptions that affect the amounts reported in the financial statements and accompanying notes. Actual results may differ from those estimates.
46
23400 Notes to Financial Statements (Cont'd) Note 1: SUMMARY OF SIGNIFICANT ACCOUNTING POLICIES (CONT'D)
Impact of Recently Issued Accounting Principles Recently Issued and Adopted Accounting Pronouncements
In November 2010, the GASB issued Statement 60, Accounting and Financial Reporting for Service Concession Arrangements. GASBS 60 provides financial reporting guidance for service concession arrangements (SCAs). SCAs are defined as an arrangement between a transferor (a government) and an operator (governmental or nongovernmental entity) in which (1) the transferor conveys to an operator the right and related obligation to provide services through the use of infrastructure or another public asset (a "facility") in exchange for significant consideration and (2) the operator collects and is compensated by fees from third parties. This Statement is effective for periods beginning after December 15, 2011. The School District does not have any SCAs and therefore the adoption of GASBS 60 does not have any impact on the School District's financial statements.
In November 2010, the GASB issued Statement 61, The Financial Reporting Entity: Omnibus an amendment of GASB Statements No. 14 and No. 34. GASBS 61 provides additional criteria for classifying entities as component units to better assess the accountability of elected officials by ensuring that the financial reporting entity includes only organizations for which the elected officials are financially accountable or that are determined by the government to be misleading to exclude. This Statement is effective for periods beginning after June 15, 2012. The School District elected to early implement GASBS 61 effective for fiscal year 2013. The adoption of GASBS 61, however, does not have any impact on the School District’s financial statements.
In December 2010, the GASB issued Statement 62, Codification of Accounting and Financial Reporting Guidance Contained in Pre-November 30, 1989 FASB and AICPA Pronouncements. GASBS 62 incorporates into the GASB's authoritative literature certain accounting and financial reporting guidance that is included in the following pronouncements issued on or before November 30, 1989, which does not conflict with or contradict GASB pronouncements: Financial Accounting Standards Board (FASB) Statements and Interpretations, Accounting Principles Board Opinions and Accounting Research Bulletins of the American Institute of Certified Public Accountants' (AICPA) Committee on Accounting Procedure. This Statement is effective for periods beginning after December 15, 2011. The adoption of GASBS 62 does not have any impact on the School District's financial statements.
In June 2011, the GASB issued Statement 63, Financial Reporting of Deferred Outflows of Resources, Deferred Inflows of Resources, and Net Position. GASBS 63 provides guidance for reporting deferred outflows of resources, deferred inflows of resources, and net position in a statement of financial position and related disclosures. The statement of net assets is renamed the statement of net position and includes four components: assets, deferred outflows of resources, liabilities, and deferred inflows of resources. This Statement is effective for financial statements for periods beginning after December 15, 2011. The adoption of GASBS 63, however, does not have a material impact on the School District’s financial statements.
In March 2012, the GASB issued Statement 65, Items Previously Reported as Assets and Liabilities. GASBS 65 establishes accounting and financial reporting standards that reclassify, as deferred outflows of resources or deferred inflows of resources, certain items that were previously reported as assets and liabilities and recognizes, as outflows of resources or inflows of resources, certain items that were previously reported as assets and liabilities. This Statement is effective for periods beginning after December 15, 2012. The School District elected to early implement GASBS 65 effective for fiscal year 2013. The adoption of GASBS 65, however, does not have a material impact on the School District’s financial statements.
47

23400 Notes to Financial Statements (Cont'd) Note 1: SUMMARY OF SIGNIFICANT ACCOUNTING POLICIES (CONT'D)
Impact of Recently Issued Accounting Principles (Cont’d) Recently Issued Accounting Pronouncements In March 2012, the GASB issued Statement 66, Technical Corrections - 2012 - an amendment of GASB Statements No. 10 and No. 62. GASBS 66 is to improve accounting and financial reporting by state and local governmental entities by resolving conflicting guidance that resulted from the issuance of two pronouncements, Statements No. 54, Fund Balance Reporting and Governmental Fund Type Definitions, and No. 62, Codification of Accounting and Financial Reporting Guidance Contained in Pre-November 30, 1989 FASB and AICPA Pronouncements. Since the release of these Statements, questions have arisen concerning differences between the provisions in Statement 54 and Statement No. 10, Accounting and Financial Reporting for Risk Financing and Related Insurance Issues, regarding the reporting of risk financing activities. Questions also have arisen about differences between Statement 62 and Statements No. 13, Accounting for Operating Leases with Scheduled Rent Increases, regarding the reporting of certain operating lease transactions, and No. 48, Sales and Pledges of Receivables and Future Revenues and Intra-Entity Transfers of Assets and Future Revenues, concerning the reporting of the acquisition of a loan or a group of loans and the recognition of servicing fees related to mortgage loans that are sold. This Statement is effective for periods beginning after December 15, 2012. Management is currently evaluating the impact of the adoption of this Statement on the School District’s financial statements although no impact is expected. In June 2012, the GASB issued Statement 67, Financial Reporting for Pension Plans - an amendment of GASB Statement No. 25. GASBS 67 is to improve the usefulness of pension information included in the general purpose external financial reports (financial reports) of state and local governmental pension plans for making decisions and assessing accountability. This Statement is effective for periods beginning after June 15, 2013. The School District does not administer any state or local pension plans; therefore, the adoption of GASBS 67 will not have any impact on the School District's financial statements. In June 2012, the GASB issued Statement 68, Accounting and Financial Reporting for Pensions - an amendment of GASB Statement No. 27. GASBS 68 is to improve accounting and financial reporting by state and local governments for pensions. It also improves information provided by state and local governmental employers about financial support for pensions that is provided by other entities. This Statement results from a comprehensive review of the effectiveness of existing standards of accounting and financial reporting for pensions with regard to providing decision-useful information, supporting assessments of accountability and interperiod equity, and creating additional transparency. In addition, this Statement replaces the requirements of Statement No. 27, Accounting for Pensions by State and Local Governmental Employers, as well as the requirements of Statement No. 50, Pension Disclosures, as they relate to pensions that are provided through pension plans administered as trusts or equivalent arrangements that meet certain criteria. The requirements of Statements 27 and 50 remain applicable for pensions that are not covered by the scope of this Statement. This Statement is effective for periods beginning after June 15, 2014. Management is currently evaluating the impact of the adoption of this Statement on the School District’s financial statements and expects the impact to be material. In January 2013, the GASB issued Statement 69, Government Combinations and Disposals of Government Operations. GASBS 69 establishes accounting and financial reporting standards related to government combinations and disposals of government operations. As used in this Statement, the term government combinations includes a variety of transactions referred to as mergers, acquisitions, and transfers of operations. This Statement is effective for periods beginning after December 15, 2013. Management is currently evaluating the impact of the adoption of this Statement on the School District’s financial statements although no impact is expected.
48

23400 Notes to Financial Statements (Cont'd) Note 1: SUMMARY OF SIGNIFICANT ACCOUNTING POLICIES (CONT'D)
Impact of Recently Issued Accounting Principles (Cont’d) Recently Issued Accounting Pronouncements (Cont’d) In April 2013, the GASB issued Statement 70, Accounting and Financial Reporting for Nonexchange Financial Guarantees. GASBS 70 is to improve accounting and financial reporting by state and local governments that extend and receive nonexchange financial guarantees. This Statement requires a government that extends a nonexchange financial guarantee to recognize a liability when qualitative factors and historical data, if any, indicate that it is more likely than not that the government will be required to make a payment on the guarantee. The amount of the liability to be recognized should be the discounted present value of the best estimate of the future outflows expected to be incurred as a result of the guarantee. When there is no best estimate but a range of the estimated future outflows can be established, the amount of the liability to be recognized should be the discounted present value of the minimum amount within the range. This Statement requires a government that has issued an obligation guaranteed in a nonexchange transaction to report the obligation until legally released as an obligor. This Statement also requires a government that is required to repay a guarantor for making a payment on a guaranteed obligation or legally assuming the guaranteed obligation to continue to recognize a liability until legally released as an obligor. When a government is released as an obligor, the government should recognize revenue as a result of being relieved of the obligation. This Statement also provides additional guidance for intra-entity nonexchange financial guarantees involving blended component units. This Statement is effective for periods beginning after June 15, 2013. Management is currently evaluating the impact of the adoption of this Statement on the School District’s financial statements although no impact is expected.
Note 2: CASH AND CASH EQUIVALENTS Custodial Credit Risk Related to Deposits - Custodial credit risk is the risk that, in the event of a bank failure, the School District’s deposits might not be recovered. Although the School District does not have a formal policy regarding custodial credit risk, N.J.S.A. 17:9-41 et seq. requires that governmental units shall deposit public funds in public depositories protected from loss under the provisions of the Governmental Unit Deposit Protection Act (GUDPA). Under the Act, the first $250,000.00 of governmental deposits in each insured depository is protected by the Federal Deposit Insurance Corporation (FDIC). Public funds owned by the School District in excess of FDIC insured amounts are protected by GUDPA. However, GUDPA does not protect intermingled agency funds such as salary withholdings, and student activity funds, or funds that may pass to the School District relative to the happening of a future condition. Such funds are shown as uninsured and uncollateralized in the schedule below. As of June 30, 2013, the School District’s bank balances of $4,151,864.98 were exposed to custodial credit risk as follows:
Insured 253,346.29$ Uninsured and Uncollateralized 582,912.09 Uninsured and Collateralized with Securities
Held by Pledging Financial Institutions 3,315,606.60 Total 4,151,864.98$
49

23400 Notes to Financial Statements (Cont'd) Note 3: CAPITAL RESERVE ACCOUNT
A capital reserve account was established by the School District during the fiscal year ended June 30, 1995 for the accumulation of funds for use as capital outlay expenditures in subsequent fiscal years. The capital reserve account is maintained in the general fund and its activity is included in the general fund annual budget. Funds placed in the capital reserve account are restricted to capital projects in the School District’s approved Long Range Facilities Plan (“LRFP”). Upon submission of the LRFP to the Department, a school district may increase the balance in the capital reserve by appropriating funds in the annual general fund budget certified for taxes or by transfer by board resolution at fiscal year-end (June 1 to June 30) of any unanticipated revenue or unexpended line-item appropriation amounts, or both. A school district may also appropriate additional amounts when the express approval of the voters has been obtained by either a separate proposal at budget time or by a special question at one of the four special elections authorized pursuant to N.J.S.A. 19:60-2. Pursuant to N.J.A.C. 6A:23A-14.1(g), the balance in the account cannot at any time exceed the local support costs of uncompleted capital projects in its approved LRFP. The activity of the capital reserve for the July 1, 2012 to June 30, 2013 fiscal year is as follows:
Balance June 30, 2012 21,608.67$ Increased by:
Transferred from Unexpended Budget 600,000.00 Balance June 30, 2012 621,608.67$
The District is currently in the process of updating their long range facility plan to include all the current and planned projects. The June 30, 2013 capital reserve balance does not exceed the balance of local support costs of uncompleted projects.
Note 4: ACCOUNTS RECEIVABLE
Accounts receivable at June 30, 2013 consisted of accounts (fees) and intergovernmental grants. All intergovernmental receivables are considered collectible in full due to the stable condition of state programs and the current fiscal year guarantee of federal funds. Other accounts receivable are reported below net of allowance for doubtful accounts. However, the District has not established a receivable for a cash shortage of $14,442.75 in the Early Childhood Education Center Fund as the chance of recovering these funds may be remote. Accounts receivable as of fiscal year end for the School District’s individual major and fiduciary funds, in the aggregate, are as follows:
Special CapitalGeneral Revenue Projects Proprietary
Fund Fund Fund Funds TotalIntergovernmental 361,358.34$ 837,653.00$ 6,231,053.81$ 148,411.31$ 7,578,476.46$ Other 859,715.00 3,650.00 8,995.93 872,360.93 Total 1,221,073.34$ 841,303.00$ 6,231,053.81$ 157,407.24$ 8,450,837.39$
50

23400 Notes to Financial Statements (Cont'd) Note 5: INVENTORY
Inventory in the food service fund at June 30, 2013 consisted of the following:
Non-USDA Inventory 6,683.64$ USDA Inventory 1,149.23
7,832.87$
There was no Inventory in the General Fund at June 30, 2013.
Note 6: CAPITAL ASSETS
Capital asset activity for the fiscal year ended June 30, 2013 was as follows:
Balance BalanceJune 30, 2012 Additions Deletions June 30, 2013
Governmental Activities:Capital Assets, not being Depreciated:
Land 5,001.00$ 5,001.00$
Construction in Progress 7,822,640.78 292,774.12$ 8,115,414.90
Total Capital Assets not being Depreciated 7,827,641.78$ 292,774.12$ -$ 8,120,415.90$
Capital Assets, being Depreciated:
Land Improvements 1,518,547.00$ 1,518,547.00$ Building and Improvements 23,105,283.00 23,105,283.00 Equipment 5,707,287.00 353,867.00$ (177,881.00)$ 5,883,273.00
Total Capital Assets, being Depreciated 30,331,117.00 353,867.00 (177,881.00) 30,507,103.00
Less Accumulated Depreciation for:Building and Improvements (12,909,288.00) (417,722.00) (13,327,010.00) Equipment (2,966,483.00) (358,515.00) 105,724.00 (3,219,274.00)
Total Accumulated Depreciation (15,875,771.00) (776,237.00) * 105,724.00 (16,546,284.00)
Total Capital Assets, being Depreciated, Net 14,455,346.00 (422,370.00) (72,157.00) 13,960,819.00
Governmental Activities, Capital Assets, Net 22,282,987.78$ (129,595.88)$ (72,157.00)$ 22,081,234.90$
Business-Type Activities:
Total Capital Assets, being Depreciated:Equipment 688,697.00$ 42,297.00$ (30,144.00)$ 700,850.00$ Less Accumulated Depreciation (409,022.00) (21,490.00) 28,293.00 (402,219.00)
Total Business-Type Activities CapitalAssets, Net 279,675.00$ 20,807.00$ (1,851.00)$ 298,631.00$
51

23400 Notes to Financial Statements (Cont'd) Note 6: CAPITAL ASSETS (Cont’d) * Depreciation expense was charged to governmental functions as follows:
Instruction 379,738.00$ Student and Insturction Related Services 60,053.00 School Administrative Services 33,095.00 General and Business Adminstrative Services 119,551.00 Plant Operations and Maintenance 95,270.00 Pupil Transportation 88,530.00 Total Depreciation Expense 776,237.00$
Note 7: LONG-TERM OBLIGATIONS
During the fiscal year ended June 30, 2013, the following changes occurred in long-term obligations:
Principal PrincipalOutstanding Outstanding Due Within
June 30, 2012 Additions Reductions June 30, 2013 One YearGovernmental Activities:
Compensated Absences 1,205,821.02$ (10,697.72)$ 1,195,123.30$ 86,022.00$
Compensated Absences - Compensated absences will be paid from the fund from which the employees’ salaries are paid. Capital Leases Payable - The School District currently has no outstanding capital leases.
Note 8: PENSION PLANS
A substantial number of the School District's employees participate in one of the following defined benefit pension plans: the Teachers' Pension and Annuity Fund and the Public Employees' Retirement System, which are administered by the New Jersey Division of Pensions and Benefits. In addition, several School District employees participate in the Defined Contribution Retirement Program, which is a defined contribution pension plan. This plan is administered by Prudential Financial for the New Jersey Division of Pensions and Benefits. Each plan has a Board of Trustees that is primarily responsible for its administration. The Division issues a publicly available financial report that includes financial statements and required supplementary information. That report may be obtained by writing to:
State of New Jersey Division of Pensions and Benefits P.O. Box 295 Trenton, New Jersey 08625-0295
Teachers' Pension and Annuity Fund - The Teachers' Pension and Annuity Fund (“TPAF”) is a cost-sharing contributory defined benefit pension plan which was established as of January 1, 1955, under the provisions of N.J.S.A. 18A:66. The TPAF provides retirement, death, and disability, and medical benefits to qualified members. Vesting and benefit provisions are established by N.J.S.A. 18A:66.
52
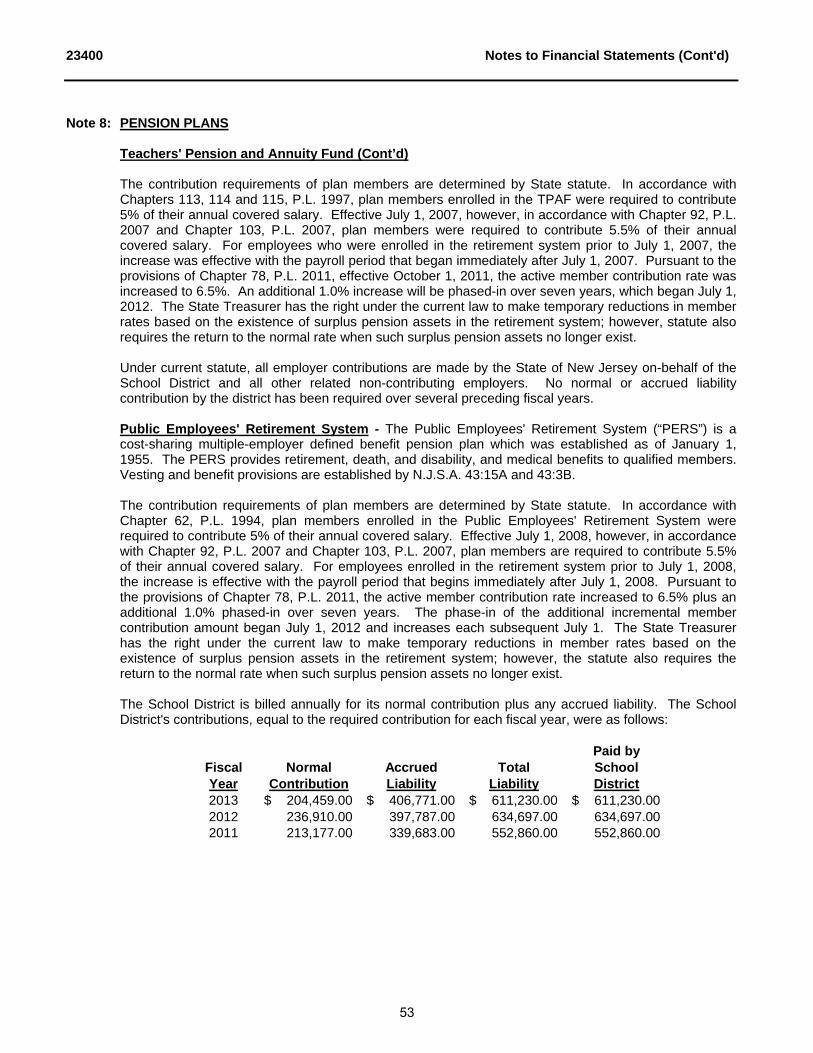
23400 Notes to Financial Statements (Cont'd) Note 8: PENSION PLANS
Teachers' Pension and Annuity Fund (Cont’d) The contribution requirements of plan members are determined by State statute. In accordance with Chapters 113, 114 and 115, P.L. 1997, plan members enrolled in the TPAF were required to contribute 5% of their annual covered salary. Effective July 1, 2007, however, in accordance with Chapter 92, P.L. 2007 and Chapter 103, P.L. 2007, plan members were required to contribute 5.5% of their annual covered salary. For employees who were enrolled in the retirement system prior to July 1, 2007, the increase was effective with the payroll period that began immediately after July 1, 2007. Pursuant to the provisions of Chapter 78, P.L. 2011, effective October 1, 2011, the active member contribution rate was increased to 6.5%. An additional 1.0% increase will be phased-in over seven years, which began July 1, 2012. The State Treasurer has the right under the current law to make temporary reductions in member rates based on the existence of surplus pension assets in the retirement system; however, statute also requires the return to the normal rate when such surplus pension assets no longer exist. Under current statute, all employer contributions are made by the State of New Jersey on-behalf of the School District and all other related non-contributing employers. No normal or accrued liability contribution by the district has been required over several preceding fiscal years.
Public Employees' Retirement System - The Public Employees' Retirement System (“PERS”) is a cost-sharing multiple-employer defined benefit pension plan which was established as of January 1, 1955. The PERS provides retirement, death, and disability, and medical benefits to qualified members. Vesting and benefit provisions are established by N.J.S.A. 43:15A and 43:3B. The contribution requirements of plan members are determined by State statute. In accordance with Chapter 62, P.L. 1994, plan members enrolled in the Public Employees' Retirement System were required to contribute 5% of their annual covered salary. Effective July 1, 2008, however, in accordance with Chapter 92, P.L. 2007 and Chapter 103, P.L. 2007, plan members are required to contribute 5.5% of their annual covered salary. For employees enrolled in the retirement system prior to July 1, 2008, the increase is effective with the payroll period that begins immediately after July 1, 2008. Pursuant to the provisions of Chapter 78, P.L. 2011, the active member contribution rate increased to 6.5% plus an additional 1.0% phased-in over seven years. The phase-in of the additional incremental member contribution amount began July 1, 2012 and increases each subsequent July 1. The State Treasurer has the right under the current law to make temporary reductions in member rates based on the existence of surplus pension assets in the retirement system; however, the statute also requires the return to the normal rate when such surplus pension assets no longer exist. The School District is billed annually for its normal contribution plus any accrued liability. The School District's contributions, equal to the required contribution for each fiscal year, were as follows:
Paid byFiscal Normal Accrued Total SchoolYear Contribution Liability Liability District2013 204,459.00$ 406,771.00$ 611,230.00$ 611,230.00$ 2012 236,910.00 397,787.00 634,697.00 634,697.00 2011 213,177.00 339,683.00 552,860.00 552,860.00
53

23400 Notes to Financial Statements (Cont'd) Note 9: STATE POST-RETIREMENT MEDICAL BENEFITS
Cost Sharing Multiple-Employer OPEB Plan P.L. 1987, c.384 of P.L. 1990, c.6 required Teachers’ Pensions and Annuity Fund (“TPAF”) and the Public Employees’ Retirement System (“PERS”), respectively, to fund post-retirement medical benefits for those State employees who retire after accumulating 25 years of credited service or on a disability retirement. P.L. 2007, c.103 amended the law to eliminate the funding of postemployment medical benefits through the TPAF and PERS. It created separate funds outside of the pension plans for the funding and payment of postemployment medical benefits for retired State employees and retired educational employees. As of June 30, 2012, there were 97,661 retirees receiving postemployment medical benefits. The cost of these benefits is funded through contributions by the State in accordance with P.L. 1994, c.62. Funding of post-retirement medical premiums changed from a pre-funding basis to a pay-as-you-go basis beginning in fiscal year 1994.
The State is also responsible for the cost attributable to P.L. 1992 c.126, which provides free health benefits to members of PERS and the Alternate Benefit Program who retire from a board of education or county college with 25 years of service. The State paid $146.6 million toward Chapter 126 benefits for 16,618 eligible retired members in fiscal year 2012.
Note 10: ON-BEHALF PAYMENTS For the fiscal year ended June 30, 2013, the School District has recognized as revenues and expenditures on-behalf payments made by the State for normal costs and post-retirement costs related to TPAF. The amounts recognized as revenues and expenditures for normal costs and post-retirement costs were $1,107,996.00 and $1,252,863.00, respectively.
Note 11: RISK MANAGEMENT The School District is exposed to various risks of loss related to torts; theft of, damage to, and destruction of assets; errors and omissions; injuries to employees; and natural disasters. Property and Liability Insurance - The School District maintains commercial insurance coverage for property, liability, and surety bonds. A complete schedule of insurance coverage can be found in the Statistical Section of this Comprehensive Annual Financial Report. New Jersey Unemployment Compensation Insurance - The School District has elected to fund its New Jersey Unemployment Compensation Insurance under the "Benefit Reimbursement Method". Under this plan, the School District is required to reimburse the New Jersey Unemployment Trust Fund for benefits paid to its former employees and charged to its account with the State. The School District is billed quarterly for amounts due to the State. The following is a summary of School District contributions, reimbursements to the State for benefits paid and the ending balance of the School District's expendable trust fund for the current and previous two fiscal years:
Fiscal Year Employee Board Interest Amount EndingEnded June 30 Contributions Contributions Earnings Reimbursed Balance
2013 40,528.45$ 21,000.00$ 5.23$ 73,876.59$ 331,552.47$ 2012 37,466.13 150,000.00 259,355.53 343,895.38 2011 38,820.51 658.07 222,886.09 415,784.78
54

23400 Notes to Financial Statements (Cont'd) Note 12: DEFERRED COMPENSATION
The School District offers its employees a choice of six deferred compensation plans created in accordance with Internal Revenue Code Sections 403(b) and 457. The plans, which are administered by the entities listed below, permit participants to defer a portion of their salary until future years. Amounts deferred under the plans are not available to employees until termination, retirement, death, or unforeseeable emergency. The plan administrators are as follows:
T. Seeley Lincoln Financial The Vanguard Group Washington National Insurance The Franklin Life Insurance Prudential Financial
Note 13: COMPENSATED ABSENCES
The School District accounts for compensated absences (e.g., unused vacation, sick leave) as directed by Governmental Accounting Standards Board Statement No. 16 (GASB 16), “Accounting for Compensated Absences”. A liability for compensated absences attributable to services already rendered and not contingent on a specific event that is outside the control of the employer and employee is accrued as employees earn the rights to the benefits. School District employees who are employed for ten months are entitled to ten paid sick leave days per fiscal school year. School District employees who are employed for twelve months are entitled to twelve paid sick leave days per fiscal school year. Unused sick leave may be accumulated and carried forward to the subsequent years. School District employees are entitled to two personal days which may be carried forward to subsequent years. Vacation days not used during the year may not be accumulated and carried forward. Benefits paid in any future year will be calculated according to formulas outlined in the School Districts' agreements with the various employee unions and included in the current years' budget. The liability for vested compensated absences is recorded within those funds as the benefits accrue to employees. As of June 30, 2013, the liability for compensated absences in the governmental activities fund type was $1,195,123.30.
Note 14: INTERFUND BALANCES AND TRANSFERS
The following interfund balances were recorded on the various balance sheets as of June 30, 2013:
Interfunds InterfundsFund Receivable Payable
General 4,860,335.98$ 33,746.87$ Special Revenue 75,925.97 Capital Projects 4,609,238.55 Proprietary 258,735.73 Fiduciary 34,540.80
4,936,261.95$ 4,936,261.95$
The interfund receivables and payables above predominately resulted from payments made by certain funds on behalf of other funds. During the fiscal year 2014, the District expects to liquidate such interfunds, depending upon the availability of cash flow.
55

23400 Notes to Financial Statements (Cont'd) Note 14: INTERFUND BALANCES AND TRANSFERS (CONT’D)
Special CapitalRevenue Projects Proprietary
Fund Fund Fund
Transfer Out:
General Fund 2,431,806$ 482,774$ 690,688$
Transfer In:
Note 15: FUND BALANCES
RESTRICTED As stated in note 1, the restricted fund balance classification includes amounts that are restricted to specific purposes. Such restrictions, or constraints, are placed on the use of resources by either of the following: (1) externally imposed by creditors, grantors, contributors, or laws or regulations of other governments; or (2) imposed by law through constitutional provisions or enabling legislation. Specific restrictions of the School District’s fund balance are summarized as follows:
General Fund -
For Excess Surplus - In accordance with N.J.S.A. 18A:7F-7, as amended, the designation of restricted fund balance - excess surplus is the result of a required calculation pursuant to the New Jersey Comprehensive Educational Improvement and Financing Act of 1996 (CEIFA). New Jersey school districts are required to reserve general fund balance at the fiscal year end of June 30 if they did not appropriate a required minimum amount as budgeted fund balance in their subsequent years’ budget. The excess fund balance at June 30, 2013 is $4,124,399.32. Of this, $3,397,073.38 of excess fund balance, which was generated during 2011-2012, has been restricted and designated for utilization in the 2013-2014 budget. For Capital Reserve Account - As of June 30, 2013, the balance in the capital reserve account is $621,608.67. These funds are restricted for future capital outlay expenditures for capital projects in the School District’s approved Long Range Facilities Plan (LRFP).
Capital Projects Fund – As of June 30, 2013, the restricted fund balance amount was $1,619,290.03.
ASSIGNED As stated in note 1, the assigned fund balance classification includes amounts that are constrained by the School District’s intent to be used for specific purposes, but are neither restricted nor committed. Specific assignments of the School District’s fund balance are summarized as follows:
General Fund -
For Subsequent Year’s Expenditures - The School District has appropriated and included as an anticipated revenue for the fiscal year ending June 30, 2013 $645,229.62 of general fund balance at June 30, 2013. Other Purposes - As of June 30, 2013, the School District had $110,860.56 of encumbrances outstanding for purchase orders and contracts signed by the School District, but not completed, as of the close of the fiscal year.
56

23400 Notes to Financial Statements (Cont'd) Note 15: FUND BALANCES (CONT’D)
UNASSIGNED As stated in note 1, the unassigned fund balance classification represents fund balance that has not been restricted, committed, or assigned to specific purposes. The School District’s unassigned fund balance is summarized as follows:
General Fund – As of June 30, 2013, the fund balance of the general fund was $2,403,556.14. Note 16: LITIGATION
The School District is a defendant in several legal proceedings that are in various stages of litigation. It is believed that the outcome, or exposure to the School District, from such litigation is either unknown or potential losses, if any, would not be material to the financial statements.
57

REQUIRED SUPPLEMENTARY INFORMATION PART II

BUDGETARY COMPARISON SCHEDULES

23400
Ex
hib
it C
-1
CA
MD
EN
CO
UN
TY
TE
CH
NIC
AL
SC
HO
OL
DIS
TR
ICT
Budgeta
ry C
om
pa
riso
n S
ch
ed
ule
G
enera
l Fund
For
the F
isca
l Year
Ended J
une 3
0, 2013
Variance
Origin
al
Budget
Fin
al
Posi
tive (
Negativ
e)
Budget
Modifi
catio
ns
Budget
Act
ual
Fin
al t
o A
ctual
Local S
ourc
es:
County
Budget A
ppro
priatio
n11,1
46,0
33.0
0$
11,1
46,0
33.0
0$
11,1
46,0
33.0
0$
Tu
itio
n f
rom
LE
As
6,2
11,8
00.0
0
6,2
11,8
00.0
0
6,2
08,9
00.0
0
(2,9
00.0
0)
$
Oth
er
Rest
rict
ed M
isce
llaneous
Reve
nues
80,0
00.0
0
80,0
00.0
0
415.0
0
(79,5
85.0
0)
Unre
strict
ed M
isce
llaneous
Reve
nue
573,8
64.3
4
573,8
64.3
4
To
tal -
Lo
ca
l S
ou
rce
s17,4
37,8
33.0
0
-
17,4
37,8
33.0
0
17,9
29,2
12.3
4
491,3
79.3
4
Sta
te S
ourc
es:
Equaliz
atio
n A
id20,7
61,2
93.0
0
20,7
61,2
93.0
0
20,7
61,2
93.0
0
Speci
al E
duca
tion A
id1,1
44,5
10.0
0
1,1
44,5
10.0
0
1,1
44,5
10.0
0
Secu
rity
Aid
149,5
18.0
0
149,5
18.0
0
149,5
18.0
0
On-b
ehalf
TP
AF
Pensi
on C
ontr
ibutio
ns
-
No
rma
l C
ost
(no
n-b
ud
ge
ted
)1,1
07,9
96.0
0
1,1
07,9
96.0
0
Po
st
Re
tire
me
nt
Co
sts
(n
on
-bu
dg
ete
d)
1,2
52,8
63.0
0
1,2
52,8
63.0
0
Reim
burs
ed T
.P.A
.F. S
oci
al S
ecu
rity
C
ontr
ibutio
ns
(non-b
udgete
d)
1,2
05,7
68.8
3
1,2
05,7
68.8
3
Tota
l - S
tate
Sourc
es
22,0
55,3
21.0
0
-
22,0
55,3
21.0
0
25,6
21,9
48.8
3
3,5
66,6
27.8
3
Federa
l Sourc
es:
Educa
tion J
obs
Fund
1,9
13.0
0$
1,9
13.0
0
1,9
13.0
0
SE
MI -
Medic
aid
Initi
ativ
e95,1
42.0
0
95,1
42.0
0
64,1
33.0
6
(31,0
08.9
4)
To
tal -
Fe
de
ral S
ou
rce
s95,1
42.0
0
1,9
13.0
0
97,0
55.0
0
66,0
46.0
6
(31,0
08.9
4)
Tota
l Reve
nues
39,5
88,2
96.0
0
1,9
13.0
0
39,5
90,2
09.0
0
43,6
17,2
07.2
3
4,0
26,9
98.2
3
(Contin
ued)
60

23400
Ex
hib
it C
-1
CA
MD
EN
CO
UN
TY
TE
CH
NIC
AL
SC
HO
OL
DIS
TR
ICT
Budgeta
ry C
om
pa
riso
n S
ch
ed
ule
G
enera
l Fund
For
the F
isca
l Year
Ended J
une 3
0, 2013
Variance
Origin
al
Budget
Fin
al
Posi
tive (
Negativ
e)
Budget
Modifi
catio
ns
Budget
Act
ual
Fin
al t
o A
ctual
EX
PE
ND
ITU
RE
S:
Cu
rre
nt
Exp
en
se
:R
eg
ula
r P
rog
ram
s -
In
str
uctio
n:
Sa
lari
es o
f T
ea
ch
ers
7,3
34,9
17.5
4$
426,9
13.0
0$
7,7
61,8
30.5
4$
7,5
45,0
21.4
3$
216,8
09.1
1$
Oth
er
Sa
larie
s f
or
Instr
uctio
n413,9
70.3
6
10,0
00.0
0
423,9
70.3
6
411,9
66.0
4
12,0
04.3
2
Purc
hase
d P
rofe
ssio
nal/E
duca
tional S
erv
ices
25,0
00.0
0
(1,0
00.0
0)
24,0
00.0
0
24,0
00.0
0
Renta
ls
26,0
00.0
0
26,0
00.0
0
24,1
13.7
2
1,8
86.2
8
Oth
er
Purc
hase
d S
erv
ices
21,5
00.0
0
(1,0
00.0
0)
20,5
00.0
0
2,7
31.0
0
17,7
69.0
0
Tra
ve
l
2,0
00.0
0
2,0
00.0
0
1,3
23.0
3
676.9
7
Genera
l Supplie
s140,5
49.6
3
(1,0
00.0
0)
139,5
49.6
3
116,3
15.5
2
23,2
34.1
1
Te
xtb
oo
ks
98,5
00.0
0
(30,0
00.0
0)
68,5
00.0
0
4,0
50.9
7
64,4
49.0
3
Oth
er
Ob
jects
3,0
00.0
0
3,0
00.0
0
142.0
0
2,8
58.0
0
To
tal R
eg
ula
r P
rog
ram
s -
In
str
uctio
n8,0
37,4
37.5
3
431,9
13.0
0
8,4
69,3
50.5
3
8,1
05,6
63.7
1
363,6
86.8
2
Re
gu
lar
Pro
gra
ms -
Ho
me
In
str
uctio
n:
Sa
lari
es o
f T
ea
ch
ers
51,9
07.4
3
51,9
07.4
3
42,6
91.2
5
9,2
16.1
8
Purc
hase
d P
rofe
ssio
nal/E
duca
tional S
erv
ices
9,0
00.0
0
9,0
00.0
0
7,3
24.0
0
1,6
76.0
0
To
tal R
eg
ula
r P
rog
ram
s -
Ho
me
In
str
uctio
n51,9
07.4
3
9,0
00.0
0
60,9
07.4
3
50,0
15.2
5
10,8
92.1
8
To
tal R
eg
ula
r P
rog
ram
s8,0
89,3
44.9
6
440,9
13.0
0
8,5
30,2
57.9
6
8,1
55,6
78.9
6
374,5
79.0
0
Speci
al E
duca
tion -
Hom
e Inst
ruct
ion:
Sa
lari
es o
f T
ea
ch
ers
18,4
86.0
3
1,0
48.0
0
19,5
34.0
3
18,1
63.0
0
1,3
71.0
3
Purc
hase
d P
rofe
ssio
nal/E
duca
tional S
erv
ices
17,9
52.0
0
17,9
52.0
0
14,6
15.1
0
3,3
36.9
0
Tota
l Specia
l E
ducatio
n -
Hom
e Inst
ructio
n18,4
86.0
3
19,0
00.0
0
37,4
86.0
3
32,7
78.1
0
4,7
07.9
3
(Contin
ued)
61

23400
Ex
hib
it C
-1
CA
MD
EN
CO
UN
TY
TE
CH
NIC
AL
SC
HO
OL
DIS
TR
ICT
Budgeta
ry C
om
pa
riso
n S
ch
ed
ule
G
enera
l Fund
For
the F
isca
l Year
Ended J
une 3
0, 2013
Variance
Origin
al
Budget
Fin
al
Posi
tive (
Negativ
e)
Budget
Modifi
catio
ns
Budget
Act
ual
Fin
al t
o A
ctual
EX
PE
ND
ITU
RE
S (
CO
NT
'D):
Cu
rre
nt
Exp
en
se
(C
on
t'd):
Bili
ngual E
duca
tion -
Inst
ruct
ion
Sa
lari
es o
f T
ea
ch
ers
174,7
11.0
4$
82,0
00.0
0$
256,7
11.0
4$
252,5
21.6
0$
4,1
89.4
4$
Oth
er
Purc
hase
d S
erv
ices
1,2
00.0
0
1,2
00.0
0
1,2
00.0
0
Genera
l Supplie
s4,0
00.0
0
4,0
00.0
0
2,7
11.3
3
1,2
88.6
7
Te
xtb
oo
ks
5,0
00.0
0
5,0
00.0
0
5,0
00.0
0
Tota
l Bili
ngual E
duca
tion -
Inst
ruct
ion
184,9
11.0
4
82,0
00.0
0
266,9
11.0
4
255,2
32.9
3
11,6
78.1
1
Regula
r V
ocational P
rogra
ms
- In
stru
ctio
n:
Sa
lari
es o
f T
ea
ch
ers
3,4
65,4
96.8
6
440,0
00.0
0
3,9
05,4
96.8
6
3,8
96,8
17.3
3
8,6
79.5
3
Oth
er
Sa
larie
s f
or
Instr
uctio
n30,7
83.0
2
80,0
00.0
0
110,7
83.0
2
107,6
45.8
4
3,1
37.1
8
Purc
hase
d P
rofe
ssio
nal-E
duca
tional S
erv
ices
31,0
00.0
0
15,0
00.0
0
46,0
00.0
0
44,5
08.0
0
1,4
92.0
0
Cle
anin
g
25,0
00.0
0
25,0
00.0
0
20,4
55.9
7
4,5
44.0
3
Renta
ls374.1
0
50,0
00.0
0
50,3
74.1
0
39,4
32.7
9
10,9
41.3
1
Oth
er
Purc
hase
d S
erv
ices
142,0
00.0
0
8,0
00.0
0
150,0
00.0
0
147,6
96.3
3
2,3
03.6
7
Tra
ve
l
4,0
00.0
0
4,0
00.0
0
2,9
32.3
4
1,0
67.6
6
Genera
l Supplie
s688,3
03.9
6
150,0
00.0
0
838,3
03.9
6
825,0
91.5
9
13,2
12.3
7
Te
xtb
oo
ks
161,0
00.0
0
(45,0
00.0
0)
116,0
00.0
0
51,8
04.2
6
64,1
95.7
4
Oth
er
Ob
jects
3,0
00.0
0
5,0
00.0
0
8,0
00.0
0
5,8
36.0
0
2,1
64.0
0
To
tal -
Re
gu
lar
Vo
ca
tio
na
l P
rog
ram
s -
In
str
uctio
n4,5
21,9
57.9
4
732,0
00.0
0
5,2
53,9
57.9
4
5,1
42,2
20.4
5
111,7
37.4
9
Speci
al V
oca
tional P
rogra
ms
- In
stru
ctio
n:
Sa
lari
es o
f T
ea
ch
ers
1,5
46,9
48.9
5
(90,7
00.0
0)
1,4
56,2
48.9
5
1,3
97,4
69.7
9
58,7
79.1
6
Oth
er
Sa
larie
s f
or
Instr
uctio
n131,2
95.1
1
32,0
00.0
0
163,2
95.1
1
157,2
98.2
5
5,9
96.8
6
Cle
anin
g
1,0
00.0
0
1,0
00.0
0
94.0
0
906.0
0
Renta
ls
10,0
00.0
0
10,0
00.0
0
5,5
66.8
7
4,4
33.1
3
Oth
er
Purc
hase
d S
erv
ices
53,0
00.0
0
(33,0
00.0
0)
20,0
00.0
0
5,3
52.0
0
14,6
48.0
0 (C
ontin
ued)
62
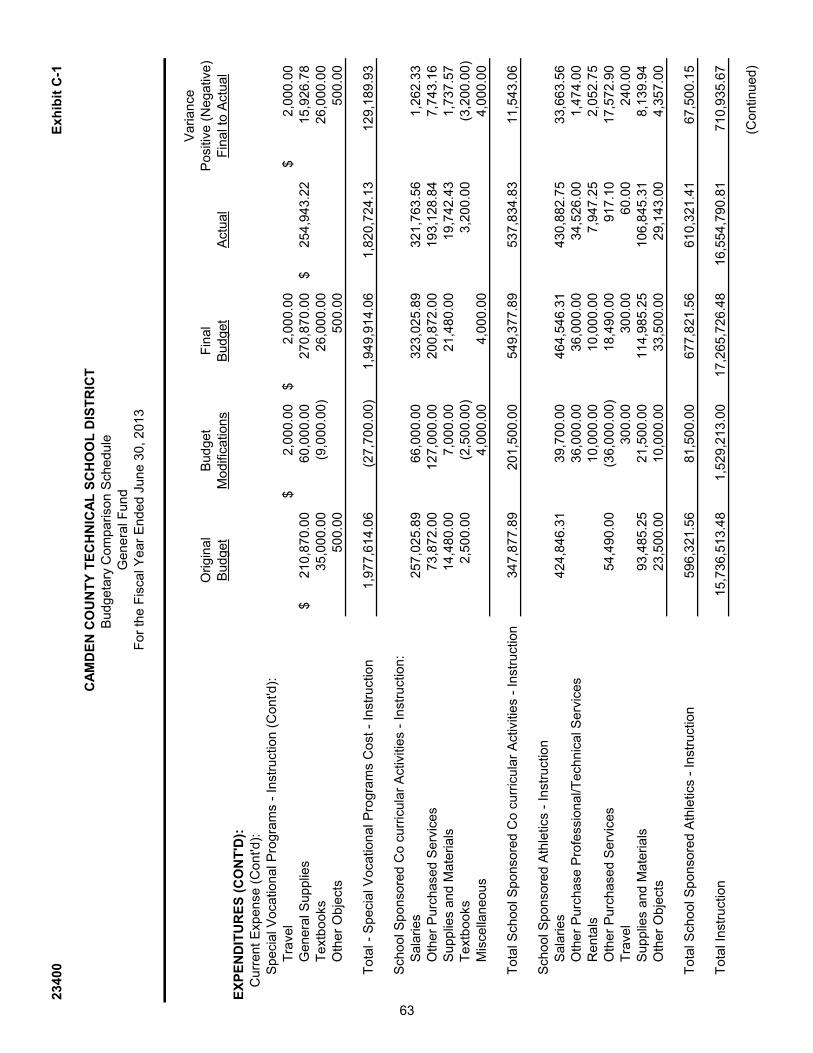
23400
Ex
hib
it C
-1
CA
MD
EN
CO
UN
TY
TE
CH
NIC
AL
SC
HO
OL
DIS
TR
ICT
Budgeta
ry C
om
pa
riso
n S
ch
ed
ule
G
enera
l Fund
For
the F
isca
l Year
Ended J
une 3
0, 2013
Variance
Origin
al
Budget
Fin
al
Posi
tive (
Negativ
e)
Budget
Modifi
catio
ns
Budget
Act
ual
Fin
al t
o A
ctual
EX
PE
ND
ITU
RE
S (
CO
NT
'D):
Cu
rre
nt
Exp
en
se
(C
on
t'd):
Speci
al V
oca
tional P
rogra
ms
- In
stru
ctio
n (
Cont'd
):T
rave
l
2,0
00.0
0$
2,0
00.0
0$
2,0
00.0
0$
Genera
l Supplie
s210,8
70.0
0$
60,0
00.0
0
270,8
70.0
0
254,9
43.2
2$
15,9
26.7
8
Te
xtb
oo
ks
35,0
00.0
0
(9,0
00.0
0)
26,0
00.0
0
26,0
00.0
0
Oth
er
Ob
jects
500.0
0
500.0
0
500.0
0
To
tal -
Sp
ecia
l V
oca
tio
na
l P
rog
ram
s C
ost
- In
str
uctio
n1,9
77,6
14.0
6
(27,7
00.0
0)
1,9
49,9
14.0
6
1,8
20,7
24.1
3
129,1
89.9
3
Sch
ool S
ponso
red C
o c
urr
icula
r A
ctiv
ities
- In
stru
ctio
n:
Sala
ries
257,0
25.8
9
66,0
00.0
0
323,0
25.8
9
321,7
63.5
6
1,2
62.3
3
Oth
er
Purc
hase
d S
erv
ices
73,8
72.0
0
127,0
00.0
0
200,8
72.0
0
193,1
28.8
4
7,7
43.1
6
Supplie
s and M
ate
rials
14,4
80.0
0
7,0
00.0
0
21,4
80.0
0
19,7
42.4
3
1,7
37.5
7
Te
xtb
oo
ks
2,5
00.0
0
(2,5
00.0
0)
3,2
00.0
0
(3,2
00.0
0)
Mis
cella
neous
4,0
00.0
0
4,0
00.0
0
4,0
00.0
0
Tota
l Sch
ool S
ponso
red C
o c
urr
icula
r A
ctiv
ities
- In
stru
ctio
n347,8
77.8
9
201,5
00.0
0
549,3
77.8
9
537,8
34.8
3
11,5
43.0
6
Sch
ool S
ponso
red A
thle
tics
- In
stru
ctio
nS
ala
ries
424,8
46.3
1
39,7
00.0
0
464,5
46.3
1
430,8
82.7
5
33,6
63.5
6
Oth
er
Pu
rch
ase
Pro
fessio
na
l/T
ech
nic
al S
erv
ice
s
36,0
00.0
0
36,0
00.0
0
34,5
26.0
0
1,4
74.0
0
Renta
ls
10,0
00.0
0
10,0
00.0
0
7,9
47.2
5
2,0
52.7
5
Oth
er
Purc
hase
d S
erv
ices
54,4
90.0
0
(36,0
00.0
0)
18,4
90.0
0
917.1
0
17,5
72.9
0
Tra
ve
l
300.0
0
300.0
0
60.0
0
240.0
0
Supplie
s and M
ate
rials
93,4
85.2
5
21,5
00.0
0
114,9
85.2
5
106,8
45.3
1
8,1
39.9
4
Oth
er
Ob
jects
23,5
00.0
0
10,0
00.0
0
33,5
00.0
0
29,1
43.0
0
4,3
57.0
0
Tota
l Sch
ool S
ponso
red A
thle
tics
- In
stru
ctio
n596,3
21.5
6
81,5
00.0
0
677,8
21.5
6
610,3
21.4
1
67,5
00.1
5
To
tal In
str
uctio
n15,7
36,5
13.4
8
1,5
29,2
13.0
0
17,2
65,7
26.4
8
16,5
54,7
90.8
1
710,9
35.6
7 (C
ontin
ued)
63

23400
Ex
hib
it C
-1
CA
MD
EN
CO
UN
TY
TE
CH
NIC
AL
SC
HO
OL
DIS
TR
ICT
Budgeta
ry C
om
pa
riso
n S
ch
ed
ule
G
enera
l Fund
For
the F
isca
l Year
Ended J
une 3
0, 2013
Variance
Origin
al
Budget
Fin
al
Posi
tive (
Negativ
e)
Budget
Modifi
catio
ns
Budget
Act
ual
Fin
al t
o A
ctual
EX
PE
ND
ITU
RE
S (
CO
NT
'D):
Cu
rre
nt
Exp
en
se
(C
on
t'd):
Undis
trib
ute
d E
xpenditu
res
- H
ealth
Serv
ices:
Sala
ries
251,3
98.7
1$
12,0
00.0
0$
263,3
98.7
1$
256,9
06.5
5$
6,4
92.1
6$
Purc
hase
d P
rofe
ssi
onal a
nd T
echnic
al S
erv
ices
25,1
00.0
0
60,5
00.0
0
85,6
00.0
0
79,4
36.4
0
6,1
63.6
0
Renta
ls
1,0
00.0
0
1,0
00.0
0
352.3
1
647.6
9
Oth
er
Purc
hase
d S
erv
ices
5,0
00.0
0
(2,7
00.0
0)
2,3
00.0
0
35.0
0
2,2
65.0
0
Supplie
s and M
ate
rials
6,8
00.0
0
(300.0
0)
6,5
00.0
0
4,3
03.1
7
2,1
96.8
3
Tota
l Undis
trib
ute
d E
xpenditu
res
- H
ealth
Serv
ices
288,2
98.7
1
70,5
00.0
0
358,7
98.7
1
341,0
33.4
3
17,7
65.2
8
Undis
trib
ute
d E
xpenditu
res
- O
ther
Support
Serv
ices
-S
tudents
- R
ela
ted S
erv
ices
Sala
ries
73,9
84.0
0
4,0
00.0
0
77,9
84.0
0
76,0
14.0
0
1,9
70.0
0
Purc
hase
d P
rofe
ssio
nal E
duca
tion S
erv
ices
2,2
24.0
0
2,2
24.0
0
2,2
24.0
0
Supplie
s and M
ate
rials
3,1
00.0
0
3,1
00.0
0
324.7
6
2,7
75.2
4
Tota
l Undis
trib
ute
d E
xpenditu
res
- O
ther
Support
Serv
ices
- S
tudents
- R
ela
ted S
erv
ices
79,3
08.0
0
4,0
00.0
0
83,3
08.0
0
76,3
38.7
6
6,9
69.2
4
Undis
trib
ute
d E
xpenditu
res
- O
ther
Support
Serv
ices
-S
tudents
- R
egula
r:S
ala
rie
s o
f O
the
r P
rofe
ssio
na
l S
taff
938,8
99.5
3
60,0
00.0
0
998,8
99.5
3
992,8
37.9
6
6,0
61.5
7
Sala
ries
of S
ecr
eta
rial a
nd C
lerica
l Ass
ista
nts
144,5
12.5
9
10,0
00.0
0
154,5
12.5
9
152,8
95.9
4
1,6
16.6
5
Oth
er
Sala
ries
4,0
00.0
0
55,0
00.0
0
59,0
00.0
0
56,9
58.2
2
2,0
41.7
8
Oth
er
Purc
hased P
rofe
ssio
nal a
nd T
ech
nic
al S
erv
ices
25,0
00.0
0
25,0
00.0
0
23,8
60.0
0
1,1
40.0
0
Renta
ls374.1
0
15,0
00.0
0
15,3
74.1
0
8,5
65.9
7
6,8
08.1
3
Oth
er
Purc
hase
d S
erv
ices
14,0
00.0
0
(5,5
00.0
0)
8,5
00.0
0
5,6
10.5
2
2,8
89.4
8
Tra
ve
l
3,0
00.0
0
3,0
00.0
0
2,3
51.6
7
648.3
3
(Contin
ued)
64
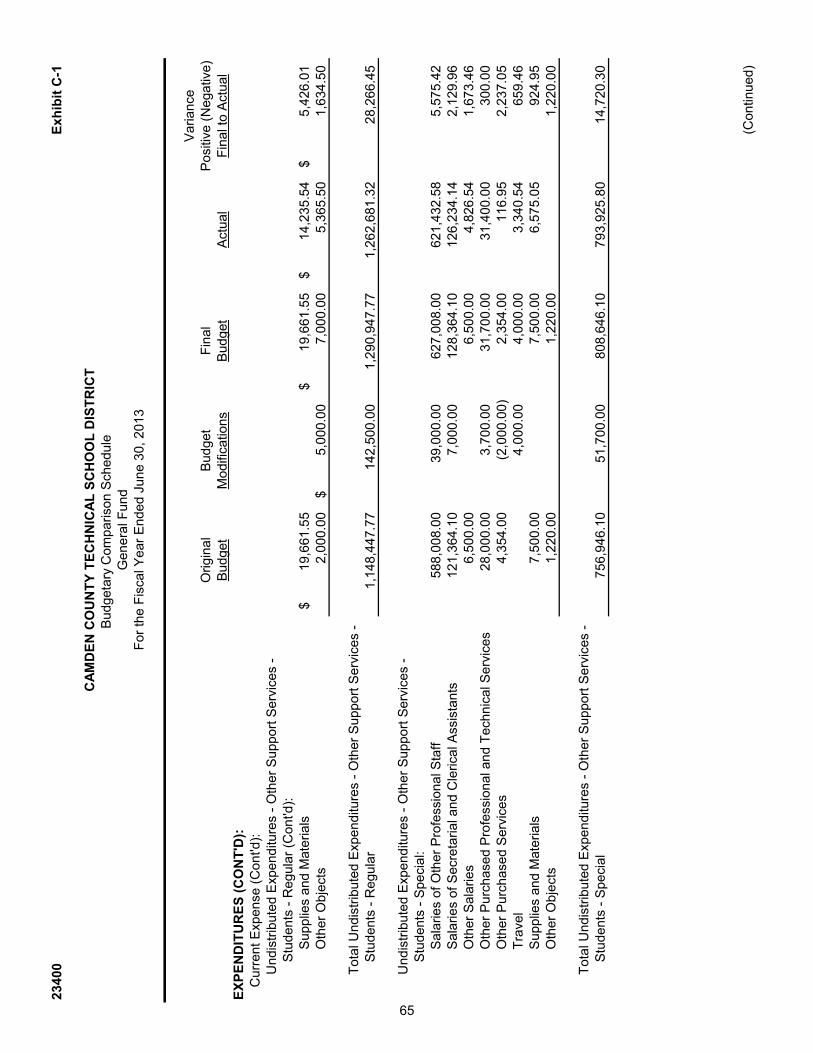
23400
Ex
hib
it C
-1
CA
MD
EN
CO
UN
TY
TE
CH
NIC
AL
SC
HO
OL
DIS
TR
ICT
Budgeta
ry C
om
pa
riso
n S
ch
ed
ule
G
enera
l Fund
For
the F
isca
l Year
Ended J
une 3
0, 2013
Variance
Origin
al
Budget
Fin
al
Posi
tive (
Negativ
e)
Budget
Modifi
catio
ns
Budget
Act
ual
Fin
al t
o A
ctual
EX
PE
ND
ITU
RE
S (
CO
NT
'D):
Cu
rre
nt
Exp
en
se
(C
on
t'd):
Undis
trib
ute
d E
xpenditu
res
- O
ther
Support
Serv
ices
-S
tudents
- R
egula
r (C
ont'd
):S
upplie
s and M
ate
rials
19,6
61.5
5$
19,6
61.5
5$
14,2
35.5
4$
5,4
26.0
1$
Oth
er
Ob
jects
2,0
00.0
0
5,0
00.0
0$
7,0
00.0
0
5,3
65.5
0
1,6
34.5
0
Tota
l Undis
trib
ute
d E
xpenditu
res
- O
ther
Support
Serv
ices
-S
tudents
- R
egula
r1,1
48,4
47.7
7
142,5
00.0
0
1,2
90,9
47.7
7
1,2
62,6
81.3
2
28,2
66.4
5
Undis
trib
ute
d E
xpenditu
res
- O
ther
Support
Serv
ices
-S
tudents
- S
peci
al:
Sa
larie
s o
f O
the
r P
rofe
ssio
na
l S
taff
588,0
08.0
0
39,0
00.0
0
627,0
08.0
0
621,4
32.5
8
5,5
75.4
2
Sala
ries
of S
ecr
eta
rial a
nd C
lerica
l Ass
ista
nts
121,3
64.1
0
7,0
00.0
0
128,3
64.1
0
126,2
34.1
4
2,1
29.9
6
Oth
er
Sala
ries
6,5
00.0
0
6,5
00.0
0
4,8
26.5
4
1,6
73.4
6
Oth
er
Purc
hased P
rofe
ssio
nal a
nd T
ech
nic
al S
erv
ices
28,0
00.0
0
3,7
00.0
0
31,7
00.0
0
31,4
00.0
0
300.0
0
Oth
er
Purc
hase
d S
erv
ices
4,3
54.0
0
(2,0
00.0
0)
2,3
54.0
0
116.9
5
2,2
37.0
5
Tra
ve
l
4,0
00.0
0
4,0
00.0
0
3,3
40.5
4
659.4
6
Supplie
s and M
ate
rials
7,5
00.0
0
7,5
00.0
0
6,5
75.0
5
924.9
5
Oth
er
Ob
jects
1,2
20.0
0
1,2
20.0
0
1,2
20.0
0
Tota
l Undis
trib
ute
d E
xpenditu
res
- O
ther
Support
Serv
ices
-S
tudents
- S
peci
al
756,9
46.1
0
51,7
00.0
0
808,6
46.1
0
793,9
25.8
0
14,7
20.3
0 (C
ontin
ued)
65
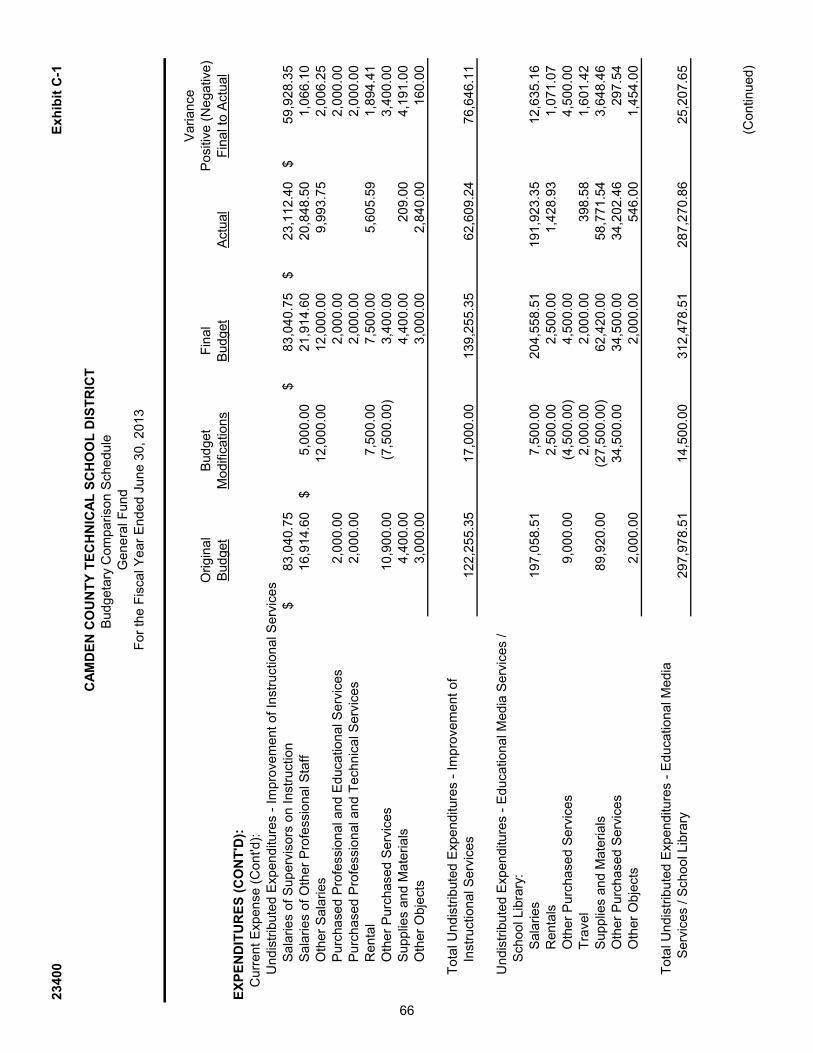
23400
Ex
hib
it C
-1
CA
MD
EN
CO
UN
TY
TE
CH
NIC
AL
SC
HO
OL
DIS
TR
ICT
Budgeta
ry C
om
pa
riso
n S
ch
ed
ule
G
enera
l Fund
For
the F
isca
l Year
Ended J
une 3
0, 2013
Variance
Origin
al
Budget
Fin
al
Posi
tive (
Negativ
e)
Budget
Modifi
catio
ns
Budget
Act
ual
Fin
al t
o A
ctual
EX
PE
ND
ITU
RE
S (
CO
NT
'D):
Cu
rre
nt
Exp
en
se
(C
on
t'd):
Un
dis
trib
ute
d E
xp
en
ditu
res -
Im
pro
ve
me
nt
of
Instr
uctio
na
l S
erv
ice
sS
ala
ries
of S
uperv
isors
on Inst
ruct
ion
83,0
40.7
5$
83,0
40.7
5$
23,1
12.4
0$
59,9
28.3
5$
Sa
larie
s o
f O
the
r P
rofe
ssio
na
l S
taff
16,9
14.6
0
5,0
00.0
0$
21,9
14.6
0
20,8
48.5
0
1,0
66.1
0
Oth
er
Sala
ries
12,0
00.0
0
12,0
00.0
0
9,9
93.7
5
2,0
06.2
5
Purc
hase
d P
rofe
ssio
nal a
nd E
duca
tional S
erv
ices
2,0
00.0
0
2,0
00.0
0
2,0
00.0
0
Purc
hase
d P
rofe
ssi
onal a
nd T
echnic
al S
erv
ices
2,0
00.0
0
2,0
00.0
0
2,0
00.0
0
Renta
l
7,5
00.0
0
7,5
00.0
0
5,6
05.5
9
1,8
94.4
1
Oth
er
Purc
hase
d S
erv
ices
10,9
00.0
0
(7,5
00.0
0)
3,4
00.0
0
3,4
00.0
0
Supplie
s and M
ate
rials
4,4
00.0
0
4,4
00.0
0
209.0
0
4,1
91.0
0
Oth
er
Ob
jects
3,0
00.0
0
3,0
00.0
0
2,8
40.0
0
160.0
0
To
tal U
nd
istr
ibu
ted
Exp
en
ditu
res -
Im
pro
ve
me
nt
of
Inst
ruct
ional S
erv
ices
122,2
55.3
5
17,0
00.0
0
139,2
55.3
5
62,6
09.2
4
76,6
46.1
1
Undis
trib
ute
d E
xpenditu
res
- E
duca
tional M
edia
Serv
ices
/S
chool L
ibra
ry:
Sala
ries
197,0
58.5
1
7,5
00.0
0
204,5
58.5
1
191,9
23.3
5
12,6
35.1
6
Renta
ls
2,5
00.0
0
2,5
00.0
0
1,4
28.9
3
1,0
71.0
7
Oth
er
Purc
hase
d S
erv
ices
9,0
00.0
0
(4,5
00.0
0)
4,5
00.0
0
4,5
00.0
0
Tra
ve
l
2,0
00.0
0
2,0
00.0
0
398.5
8
1,6
01.4
2
Supplie
s and M
ate
rials
89,9
20.0
0
(27,5
00.0
0)
62,4
20.0
0
58,7
71.5
4
3,6
48.4
6
Oth
er
Purc
hase
d S
erv
ices
34,5
00.0
0
34,5
00.0
0
34,2
02.4
6
297.5
4
Oth
er
Ob
jects
2,0
00.0
0
2,0
00.0
0
546.0
0
1,4
54.0
0
Tota
l Undis
trib
ute
d E
xpenditu
res
- E
duca
tional M
edia
Serv
ices
/ S
chool L
ibra
ry297,9
78.5
1
14,5
00.0
0
312,4
78.5
1
287,2
70.8
6
25,2
07.6
5 (C
ontin
ued)
66

23400
Ex
hib
it C
-1
CA
MD
EN
CO
UN
TY
TE
CH
NIC
AL
SC
HO
OL
DIS
TR
ICT
Budgeta
ry C
om
pa
riso
n S
ch
ed
ule
G
enera
l Fund
For
the F
isca
l Year
Ended J
une 3
0, 2013
Variance
Origin
al
Budget
Fin
al
Posi
tive (
Negativ
e)
Budget
Modifi
catio
ns
Budget
Act
ual
Fin
al t
o A
ctual
EX
PE
ND
ITU
RE
S (
CO
NT
'D):
Cu
rre
nt
Exp
en
se
(C
on
t'd):
Undis
trib
ute
d E
xpenditu
res
- In
stru
ctio
nal S
taff T
rain
ing S
erv
ices:
Sala
ries
of S
uperv
isors
on Inst
ruct
ion
5,0
84.7
5$
5,0
84.7
5$
5,0
84.7
5$
Sa
larie
s o
f O
the
r P
rofe
ssio
na
l S
taff
37,3
25.5
2
37,3
25.5
2
4,5
76.7
2$
32,7
48.8
0
Sala
ries
of S
ecr
eta
rial a
nd C
lerica
l Ass
ista
nts
3,0
00.0
0$
3,0
00.0
0
471.5
0
2,5
28.5
0
Purc
hase
d P
rofe
ssio
nal E
duca
tional S
erv
ices
2,0
00.0
0
2,0
00.0
0
1,4
83.0
0
517.0
0
Oth
er
Purc
hase
d S
erv
ices
3,7
90.0
0
3,7
90.0
0
311.0
0
3,4
79.0
0
Supplie
s and M
ate
rials
9,0
00.0
0
9,0
00.0
0
207.7
3
8,7
92.2
7
Tota
l Undis
trib
ute
d E
xpenditu
res
- In
stru
ctio
nal
Sta
ff T
rain
ing
Se
rvic
es
57,2
00.2
7
3,0
00.0
0
60,2
00.2
7
7,0
49.9
5
53,1
50.3
2
Undis
trib
ute
d E
xpenditu
res
- S
upport
Serv
ices
- G
enera
l Adm
inis
tration
Sala
ries
245,3
53.4
7
5,0
00.0
0
250,3
53.4
7
238,0
69.3
3
12,2
84.1
4
Legal S
erv
ices
60,0
00.0
0
(1,5
00.0
0)
58,5
00.0
0
41,4
97.8
0
17,0
02.2
0
Audit
Fees
50,0
00.0
0
(2,0
00.0
0)
48,0
00.0
0
47,5
00.0
0
500.0
0
Arc
hite
ctura
l/Engin
eering F
ees
25,0
00.0
0
(5,0
00.0
0)
20,0
00.0
0
11,3
29.4
6
8,6
70.5
4
Oth
er
Purc
hased P
rofe
ssio
nal S
erv
ices
20,0
00.0
0
(3,0
00.0
0)
17,0
00.0
0
10,5
35.4
6
6,4
64.5
4
Renta
ls
5,0
00.0
0
5,0
00.0
0
3,1
91.7
9
1,8
08.2
1
Co
mm
un
ica
tio
ns /
Te
lep
ho
ne
387,0
00.0
0
(98,0
00.0
0)
289,0
00.0
0
247,9
37.2
4
41,0
62.7
6
Tra
ve
l
1,5
00.0
0
1,5
00.0
0
1,4
55.0
0
45.0
0
BO
E O
ther
Purc
hase
d S
erv
ices
1,0
00.0
0
1,0
00.0
0
1,0
00.0
0
Mis
cella
neous
Purc
hase
d S
erv
ices
80,5
88.0
0
1,5
00.0
0
82,0
88.0
0
81,8
35.6
7
252.3
3
Genera
l Supplie
s3,5
00.0
0
(1,0
00.0
0)
2,5
00.0
0
643.9
7
1,8
56.0
3
BO
E T
rn/M
tg S
upplie
s3,4
00.0
0
500.0
0
3,9
00.0
0
3,7
71.2
3
128.7
7
Ju
dg
me
nts
Ag
ain
st
Dis
tric
t39,0
00.0
0
2,0
00.0
0
41,0
00.0
0
133.0
0
40,8
67.0
0
Mis
cella
neous
8,0
00.0
0
8,0
00.0
0
4,7
65.0
0
3,2
35.0
0
Bo
ard
of
Ed
uca
tio
n M
em
be
r D
ue
s/F
ee
s35,0
00.0
0
(1,5
00.0
0)
33,5
00.0
0
28,8
77.4
0
4,6
22.6
0
Tota
l Undis
trib
ute
d E
xpenditu
res
- S
upport
Serv
ices
- G
enera
l A
dm
inis
tratio
n957,8
41.4
7
(96,5
00.0
0)
861,3
41.4
7
721,5
42.3
5
139,7
99.1
2 (C
ontin
ued)
67
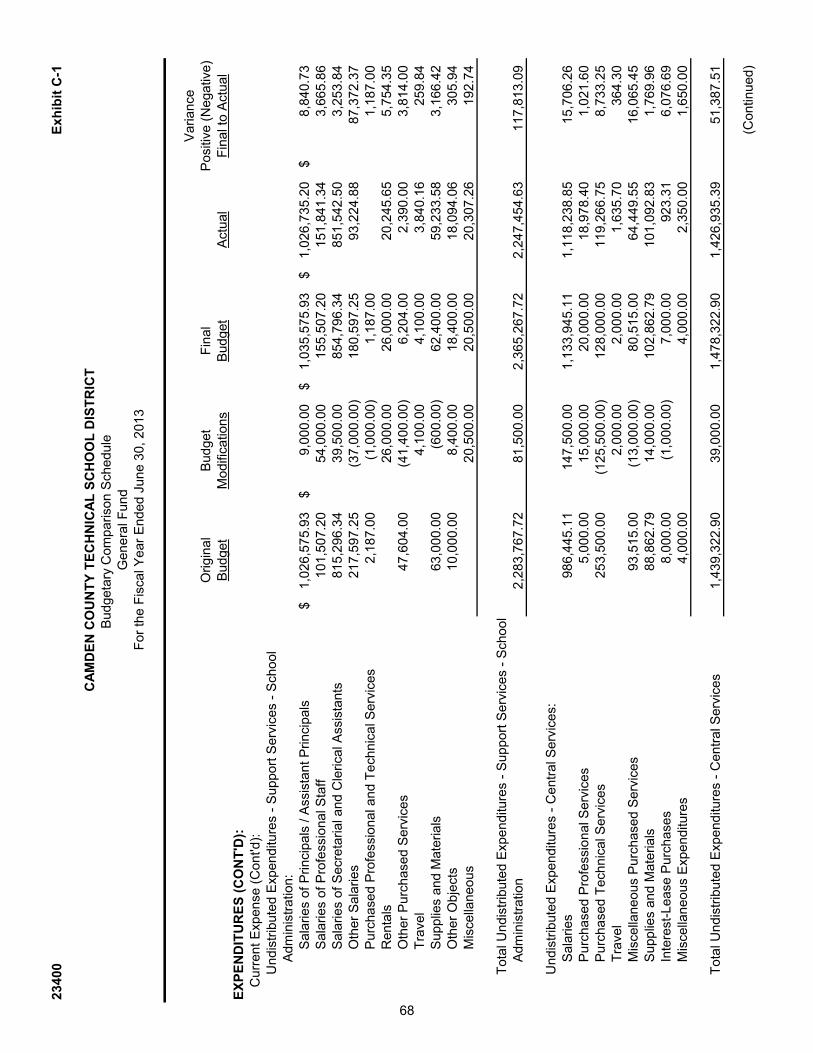
23400
Ex
hib
it C
-1
CA
MD
EN
CO
UN
TY
TE
CH
NIC
AL
SC
HO
OL
DIS
TR
ICT
Budgeta
ry C
om
pa
riso
n S
ch
ed
ule
G
enera
l Fund
For
the F
isca
l Year
Ended J
une 3
0, 2013
Variance
Origin
al
Budget
Fin
al
Posi
tive (
Negativ
e)
Budget
Modifi
catio
ns
Budget
Act
ual
Fin
al t
o A
ctual
EX
PE
ND
ITU
RE
S (
CO
NT
'D):
Cu
rre
nt
Exp
en
se
(C
on
t'd):
Undis
trib
ute
d E
xpenditu
res
- S
upport
Serv
ices
- S
chool
Adm
inis
tratio
n:
Sala
ries
of P
rinci
pals
/ A
ssis
tant P
rinci
pals
1,0
26,5
75.9
3$
9,0
00.0
0$
1,0
35,5
75.9
3$
1,0
26,7
35.2
0$
8,8
40.7
3$
Sa
larie
s o
f P
rofe
ssio
na
l S
taff
101,5
07.2
0
54,0
00.0
0
155,5
07.2
0
151,8
41.3
4
3,6
65.8
6
Sala
ries
of S
ecr
eta
rial a
nd C
lerica
l Ass
ista
nts
815,2
96.3
4
39,5
00.0
0
854,7
96.3
4
851,5
42.5
0
3,2
53.8
4
Oth
er
Sala
ries
217,5
97.2
5
(37,0
00.0
0)
180,5
97.2
5
93,2
24.8
8
87,3
72.3
7
Purc
hase
d P
rofe
ssio
nal a
nd T
ech
nic
al S
erv
ices
2,1
87.0
0
(1,0
00.0
0)
1,1
87.0
0
1,1
87.0
0
Renta
ls
26,0
00.0
0
26,0
00.0
0
20,2
45.6
5
5,7
54.3
5
Oth
er
Purc
hase
d S
erv
ices
47,6
04.0
0
(41,4
00.0
0)
6,2
04.0
0
2,3
90.0
0
3,8
14.0
0
Tra
ve
l
4,1
00.0
0
4,1
00.0
0
3,8
40.1
6
259.8
4
Supplie
s and M
ate
rials
63,0
00.0
0
(600.0
0)
62,4
00.0
0
59,2
33.5
8
3,1
66.4
2
Oth
er
Ob
jects
10,0
00.0
0
8,4
00.0
0
18,4
00.0
0
18,0
94.0
6
305.9
4
Mis
cella
neous
20,5
00.0
0
20,5
00.0
0
20,3
07.2
6
192.7
4
Tota
l Undis
trib
ute
d E
xpenditu
res
- S
upport
Serv
ices
- S
chool
Adm
inis
tratio
n2,2
83,7
67.7
2
81,5
00.0
0
2,3
65,2
67.7
2
2,2
47,4
54.6
3
117,8
13.0
9
Undis
trib
ute
d E
xpenditu
res
- C
entr
al S
erv
ices:
Sala
ries
986,4
45.1
1
147,5
00.0
0
1,1
33,9
45.1
1
1,1
18,2
38.8
5
15,7
06.2
6
Purc
hase
d P
rofe
ssio
nal S
erv
ices
5,0
00.0
0
15,0
00.0
0
20,0
00.0
0
18,9
78.4
0
1,0
21.6
0
Purc
hase
d T
echnic
al S
erv
ices
253,5
00.0
0
(125,5
00.0
0)
128,0
00.0
0
119,2
66.7
5
8,7
33.2
5
Tra
ve
l
2,0
00.0
0
2,0
00.0
0
1,6
35.7
0
364.3
0
Mis
cella
neous
Purc
hase
d S
erv
ices
93,5
15.0
0
(13,0
00.0
0)
80,5
15.0
0
64,4
49.5
5
16,0
65.4
5
Supplie
s and M
ate
rials
88,8
62.7
9
14,0
00.0
0
102,8
62.7
9
101,0
92.8
3
1,7
69.9
6
Inte
rest-
Le
ase
Pu
rch
ase
s8,0
00.0
0
(1,0
00.0
0)
7,0
00.0
0
923.3
1
6,0
76.6
9
Mis
cella
neous
Exp
enditu
res
4,0
00.0
0
4,0
00.0
0
2,3
50.0
0
1,6
50.0
0
Tota
l Undis
trib
ute
d E
xpenditu
res
- C
entr
al S
erv
ices
1,4
39,3
22.9
0
39,0
00.0
0
1,4
78,3
22.9
0
1,4
26,9
35.3
9
51,3
87.5
1 (C
ontin
ued)
68

23400
Ex
hib
it C
-1
CA
MD
EN
CO
UN
TY
TE
CH
NIC
AL
SC
HO
OL
DIS
TR
ICT
Budgeta
ry C
om
pa
riso
n S
ch
ed
ule
G
enera
l Fund
For
the F
isca
l Year
Ended J
une 3
0, 2013
Variance
Origin
al
Budget
Fin
al
Posi
tive (
Negativ
e)
Budget
Modifi
catio
ns
Budget
Act
ual
Fin
al t
o A
ctual
EX
PE
ND
ITU
RE
S (
CO
NT
'D):
Cu
rre
nt
Exp
en
se
(C
on
t'd):
Un
dis
trib
ute
d E
xp
en
ditu
res -
Ad
min
istr
atio
n I
nfo
rma
tio
n T
ech
no
log
y:S
ala
ries
379,8
32.4
5$
26,5
00.0
0$
406,3
32.4
5$
390,4
49.1
4$
15,8
83.3
1$
Purc
hase
d T
ech
nic
al S
erv
ices
22,0
00.0
0
(11,5
00.0
0)
10,5
00.0
0
10,5
00.0
0
Oth
er
Purc
hase
d S
erv
ices
47,2
33.0
0
12,5
00.0
0
59,7
33.0
0
56,8
92.0
3
2,8
40.9
7
Supplie
s and M
ate
rials
60,8
75.5
4
(35,1
50.0
0)
25,7
25.5
4
24,4
38.5
5
1,2
86.9
9
Oth
er
Ob
jects
1,0
00.0
0
650.0
0
1,6
50.0
0
1,6
00.0
0
50.0
0
To
tal U
nd
istr
ibu
ted
Exp
en
ditu
res -
Ad
min
istr
atio
n I
nfo
rma
tio
n
Te
ch
no
log
y510,9
40.9
9
(7,0
00.0
0)
503,9
40.9
9
473,3
79.7
2
30,5
61.2
7
Undis
trib
ute
d E
xpenditu
res
- R
equired M
ain
tenance
for
Sch
ool
Faci
litie
s:C
leanin
g, R
epair a
nd M
ain
tenance
Serv
ices
100,0
00.0
0
100,0
00.0
0
73,5
07.1
2
26,4
92.8
8
Genera
l Supplie
s60,0
00.0
0
60,0
00.0
0
60,0
00.0
0
Tota
l Undis
trib
ute
d E
xpenditu
res
- R
equired M
ain
tenance
for
Sch
ool F
aci
litie
s160,0
00.0
0
160,0
00.0
0
73,5
07.1
2
86,4
92.8
8
Undis
trib
ute
d E
xpenditu
res
- O
ther
Opera
tion a
nd M
ain
tenance
of P
lant S
erv
ices:
Sala
ries
2,0
70,8
27.0
5
(34,0
00.0
0)
2,0
36,8
27.0
5
1,9
37,2
42.0
6
99,5
84.9
9
Purc
hase
d P
rofe
ssio
nal a
nd T
ech
nic
al S
erv
ices
300,0
00.0
0
(205,0
00.0
0)
95,0
00.0
0
95,0
00.0
0
Pu
rch
ase
d T
ech
Se
rvic
es
207,0
00.0
0
207,0
00.0
0
149,1
49.2
9
57,8
50.7
1
Cle
anin
g, R
epair a
nd M
ain
tenance
Serv
ices
764,9
71.6
4
(2,0
00.0
0)
762,9
71.6
4
518,8
61.6
0
244,1
10.0
4
Lease
Purc
hase
Pym
ts -
En
erg
y S
avi
ngs
Impr
Pro
g450,0
00.0
0
(338,0
00.0
0)
112,0
00.0
0
112,0
00.0
0
Oth
er
Pu
rch
ase
d P
rop
ert
y S
erv
ices
52,0
00.0
0
(1,0
00.0
0)
51,0
00.0
0
28,6
16.4
1
22,3
83.5
9
Insu
ran
ce
266,5
00.0
0
266,5
00.0
0
229,2
94.4
5
37,2
05.5
5
Tra
ve
l
1,0
00.0
0
1,0
00.0
0
1,0
00.0
0
Mis
cella
neous
Purc
hase
d S
erv
ices
4,0
00.0
0
1,0
00.0
0
5,0
00.0
0
2,1
32.6
4
2,8
67.3
6
(Contin
ued)
69
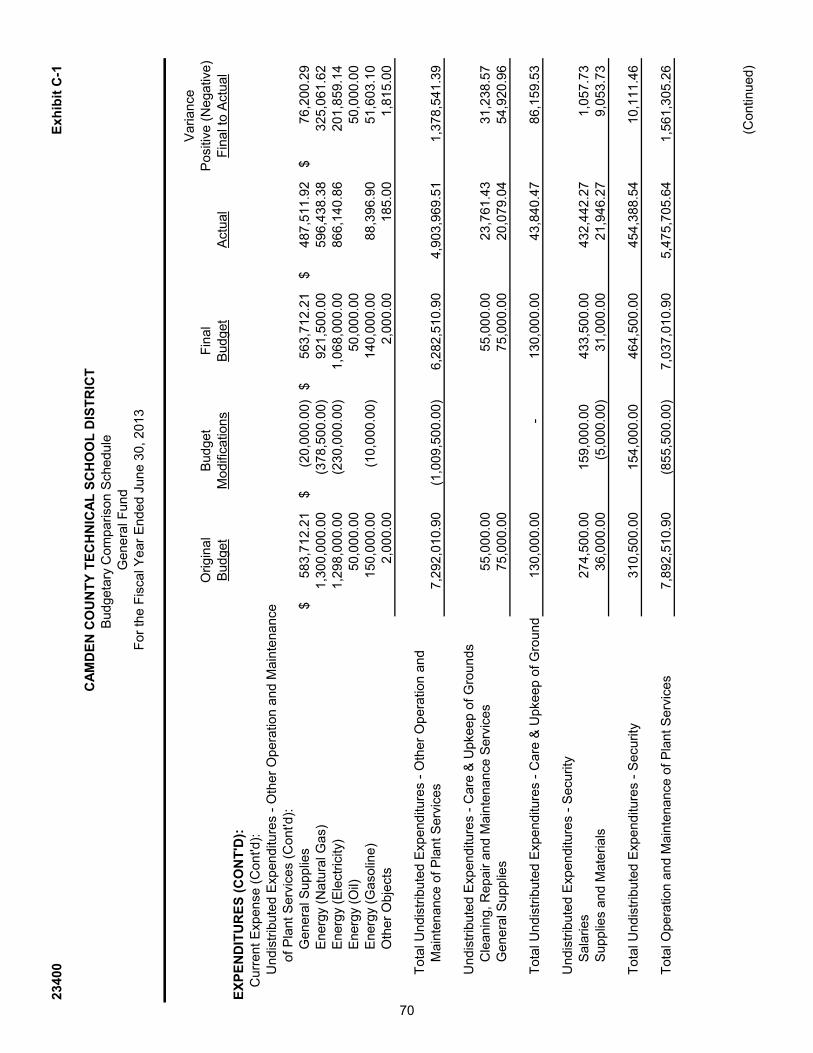
23400
Ex
hib
it C
-1
CA
MD
EN
CO
UN
TY
TE
CH
NIC
AL
SC
HO
OL
DIS
TR
ICT
Budgeta
ry C
om
pa
riso
n S
ch
ed
ule
G
enera
l Fund
For
the F
isca
l Year
Ended J
une 3
0, 2013
Variance
Origin
al
Budget
Fin
al
Posi
tive (
Negativ
e)
Budget
Modifi
catio
ns
Budget
Act
ual
Fin
al t
o A
ctual
EX
PE
ND
ITU
RE
S (
CO
NT
'D):
Cu
rre
nt
Exp
en
se
(C
on
t'd):
Undis
trib
ute
d E
xpenditu
res
- O
ther
Opera
tion a
nd M
ain
tenance
of P
lant S
erv
ices
(Cont'd
):G
enera
l Supplie
s583,7
12.2
1$
(20,0
00.0
0)
$
563,7
12.2
1$
487,5
11.9
2$
76,2
00.2
9$
Energ
y (N
atu
ral G
as)
1,3
00,0
00.0
0
(378,5
00.0
0)
921,5
00.0
0
596,4
38.3
8
325,0
61.6
2
Energ
y (E
lect
rici
ty)
1,2
98,0
00.0
0
(230,0
00.0
0)
1,0
68,0
00.0
0
866,1
40.8
6
201,8
59.1
4
Energ
y (O
il)50,0
00.0
0
50,0
00.0
0
50,0
00.0
0
Energ
y (G
aso
line)
150,0
00.0
0
(10,0
00.0
0)
140,0
00.0
0
88,3
96.9
0
51,6
03.1
0
Oth
er
Ob
jects
2,0
00.0
0
2,0
00.0
0
185.0
0
1,8
15.0
0
Tota
l Undis
trib
ute
d E
xpenditu
res
- O
ther
Opera
tion a
nd
Main
tenance
of P
lant S
erv
ices
7,2
92,0
10.9
0
(1,0
09,5
00.0
0)
6,2
82,5
10.9
0
4,9
03,9
69.5
1
1,3
78,5
41.3
9
Undis
trib
ute
d E
xpenditu
res
- C
are
& U
pke
ep o
f G
rounds
Cle
anin
g, R
epair a
nd M
ain
tenance
Serv
ices
55,0
00.0
0
55,0
00.0
0
23,7
61.4
3
31,2
38.5
7
Genera
l Supplie
s75,0
00.0
0
75,0
00.0
0
20,0
79.0
4
54,9
20.9
6
Tota
l Undis
trib
ute
d E
xpenditu
res
- C
are
& U
pke
ep o
f G
rounds
130,0
00.0
0
-
130,0
00.0
0
43,8
40.4
7
86,1
59.5
3
Undis
trib
ute
d E
xpenditu
res
- S
ecu
rity
Sala
ries
274,5
00.0
0
159,0
00.0
0
433,5
00.0
0
432,4
42.2
7
1,0
57.7
3
Supplie
s and M
ate
rials
36,0
00.0
0
(5,0
00.0
0)
31,0
00.0
0
21,9
46.2
7
9,0
53.7
3
Tota
l Undis
trib
ute
d E
xpenditu
res
- S
ecu
rity
310,5
00.0
0
154,0
00.0
0
464,5
00.0
0
454,3
88.5
4
10,1
11.4
6
Tota
l Opera
tion a
nd M
ain
tenance
of P
lant S
erv
ices
7,8
92,5
10.9
0
(855,5
00.0
0)
7,0
37,0
10.9
0
5,4
75,7
05.6
4
1,5
61,3
05.2
6
(Contin
ued)
70

23400
Ex
hib
it C
-1
CA
MD
EN
CO
UN
TY
TE
CH
NIC
AL
SC
HO
OL
DIS
TR
ICT
Budgeta
ry C
om
pa
riso
n S
ch
ed
ule
G
enera
l Fund
For
the F
isca
l Year
Ended J
une 3
0, 2013
Variance
Origin
al
Budget
Fin
al
Posi
tive (
Negativ
e)
Budget
Modifi
catio
ns
Budget
Act
ual
Fin
al t
o A
ctual
EX
PE
ND
ITU
RE
S (
CO
NT
'D):
Cu
rre
nt
Exp
en
se
(C
on
t'd):
Undis
trib
ute
d E
xpenditu
res
- S
tudent T
ransp
ort
atio
n S
erv
ices:
Sala
ries
for
Pupil
Tra
nsp
ort
atio
n (
Oth
er
than B
etw
een H
om
e
and S
chool)
215,2
08.5
6$
55,0
00.0
0$
270,2
08.5
6$
268,7
41.3
1$
1,4
67.2
5$
Oth
er
Purc
hase
d P
rofe
ssio
nal and T
ech
nic
al S
erv
ices
1,0
00.0
0
1,0
00.0
0
1,0
00.0
0
Cle
anin
g, R
epair a
nd M
ain
tenance
Serv
ices
25,0
00.0
0
25,0
00.0
0
10,7
03.0
6
14,2
96.9
4
Renta
l Paym
ents
- S
chool B
use
s3,5
00.0
0
3,5
00.0
0
3,5
00.0
0
Co
ntr
acte
d S
erv
ice
s -
(N
ot
Ho
me
/Sch
oo
l) -
Ve
nd
ors
60,0
00.0
0
20,0
00.0
0
80,0
00.0
0
74,2
28.5
1
5,7
71.4
9
Mis
cella
neous
Purc
hase
d S
erv
ices
6,0
00.0
0
6,0
00.0
0
3,8
82.6
7
2,1
17.3
3
Supplie
s and M
ate
rials
60,0
00.0
0
(15,0
00.0
0)
45,0
00.0
0
17,9
32.2
1
27,0
67.7
9
Oth
er
Ob
jects
1,0
00.0
0
1,0
00.0
0
25.0
0
975.0
0
Tota
l Undis
trib
ute
d E
xpenditu
res
- S
tudent
Tra
nsp
ort
atio
n S
erv
ices
371,7
08.5
6
60,0
00.0
0
431,7
08.5
6
375,5
12.7
6
56,1
95.8
0
Unallo
cate
d B
enefit
s:G
rou
p I
nsu
ran
ce
2,4
70,0
00.0
0
(312,0
00.0
0)
2,1
58,0
00.0
0
1,8
62,5
87.9
1
295,4
12.0
9
Soci
al S
ecu
rity
Contr
ibutio
ns
693,8
00.0
0
(28,5
00.0
0)
665,3
00.0
0
629,8
31.2
0
35,4
68.8
0
Oth
er
Retir
em
ent C
ontr
ibutio
ns -
PE
RS
687,5
02.0
0
687,5
02.0
0
611,9
66.2
6
75,5
35.7
4
Oth
er
Retir
em
ent C
ontr
ibutio
ns
- R
egula
r55,0
00.0
0
(1,5
00.0
0)
53,5
00.0
0
26,1
89.3
2
27,3
10.6
8
Un
em
plo
yment B
enefit
s250,0
00.0
0
(70,0
00.0
0)
180,0
00.0
0
21,0
00.0
0
159,0
00.0
0
Work
me
n's
Co
mp
en
sa
tio
n709,9
60.0
0
(117,0
00.0
0)
592,9
60.0
0
501,4
11.1
5
91,5
48.8
5
Health
Benefit
s4,7
95,4
76.0
0
(487,0
00.0
0)
4,3
08,4
76.0
0
3,9
63,5
47.8
0
344,9
28.2
0
Tu
itio
n R
eim
bu
rse
me
nt
120,0
00.0
0
120,0
00.0
0
89,6
55.4
4
30,3
44.5
6
Oth
er
Em
plo
yee B
enefit
s152,4
02.0
0
20,0
00.0
0
172,4
02.0
0
163,0
52.7
0
9,3
49.3
0
Tota
l Unallo
cate
d B
enefit
s9,9
34,1
40.0
0
(996,0
00.0
0)
8,9
38,1
40.0
0
7,8
69,2
41.7
8
1,0
68,8
98.2
2
(Contin
ued)
71

23400
Ex
hib
it C
-1
CA
MD
EN
CO
UN
TY
TE
CH
NIC
AL
SC
HO
OL
DIS
TR
ICT
Budgeta
ry C
om
pa
riso
n S
ch
ed
ule
G
enera
l Fund
For
the F
isca
l Year
Ended J
une 3
0, 2013
Variance
Origin
al
Budget
Fin
al
Posi
tive (
Negativ
e)
Budget
Modifi
catio
ns
Budget
Act
ual
Fin
al t
o A
ctual
EX
PE
ND
ITU
RE
S (
CO
NT
'D):
Cu
rre
nt
Exp
en
se
(C
on
t'd):
On-b
ehalf
TP
AF
Pensi
on C
ontr
ibutio
ns
(non-b
udgete
d):
No
rma
l1,1
07,9
96.0
0$
(1,1
07,9
96.0
0)
$
Po
st
Re
tire
me
nt
Co
sts
1,2
52,8
63.0
0
(1,2
52,8
63.0
0)
Reim
burs
ed T
PA
F S
oci
al S
ecu
rity
C
ontr
ibutio
ns
(non-b
udgete
d)
1,2
05,7
68.8
3
(1,2
05,7
68.8
3)
Tota
l On-b
ehalf
Contr
ibutio
ns
3,5
66,6
27.8
3
(3,5
66,6
27.8
3)
Tota
l Undis
trib
ute
d E
xpenditu
res
26,1
40,6
67.2
5$
(1,4
71,3
00.0
0)
$
24,6
69,3
67.2
5$
24,9
87,3
09.4
6
(317,9
42.2
1)
To
tal C
urr
en
t E
xp
en
se
41,8
77,1
80.7
3
57,9
13.0
0
41,9
35,0
93.7
3
41,5
42,1
00.2
7
392,9
93.4
6
Capita
l Outla
y:E
quip
ment:
Voca
tional
Instr
uctio
n -
Re
gu
lar
Pro
gra
ms
50,0
00.0
0
(7,0
00.0
0)
43,0
00.0
0
42,6
41.0
0
359.0
0
Undis
trib
ute
d E
xpenditu
res:
Cust
odia
l Serv
ices
6,5
00.0
0
6,5
00.0
0
6,2
86.9
3
213.0
7
Sch
ool B
use
s -
Regula
r
25,0
00.0
0
25,0
00.0
0
24,2
10.5
2
789.4
8
To
tal E
qu
ipm
en
t50,0
00.0
0
24,5
00.0
0
74,5
00.0
0
73,1
38.4
5
1,3
61.5
5
Faci
litie
s A
cquis
ition a
nd C
onst
ruct
ion S
erv
ices
Arc
hite
ctura
l/Engin
eering F
ees
10,0
00.0
0
10,0
00.0
0
85,1
21.6
4
(75,1
21.6
4)
Oth
er
Purc
hase
d P
rofe
ssio
nal and T
ech
nic
al S
erv
ices
1,8
00,0
00.0
0
1,8
00,0
00.0
0
1,8
00,0
00.0
0
-
Const
ruct
ion S
erv
ices
100,0
00.0
0
100,0
00.0
0
96,8
31.4
6
3,1
68.5
4
Le
ase
Pu
rch
ase
Ag
ree
me
nts
- P
rin
cip
al
7,4
70.1
7
(7,4
70.1
7)
Tota
l Faci
litie
s A
cquis
ition a
nd C
onst
ruct
ion S
erv
ices
1,9
10,0
00.0
0
-
1,9
10,0
00.0
0
1,9
89,4
23.2
7
(79,4
23.2
7)
Tota
l Capita
l Outla
y1,9
60,0
00.0
0
24,5
00.0
0
1,9
84,5
00.0
0
2,0
62,5
61.7
2
(78,0
61.7
2)
(C
ontin
ued)
72

23400
Ex
hib
it C
-1
CA
MD
EN
CO
UN
TY
TE
CH
NIC
AL
SC
HO
OL
DIS
TR
ICT
Budgeta
ry C
om
pa
riso
n S
ch
ed
ule
G
enera
l Fund
For
the F
isca
l Year
Ended J
une 3
0, 2013
Variance
Origin
al
Budget
Fin
al
Posi
tive (
Negativ
e)
Budget
Modifi
catio
ns
Budget
Act
ual
Fin
al t
o A
ctual
EX
PE
ND
ITU
RE
S (
CO
NT
'D):
Sum
mer
School -
Inst
ruct
ion
Sa
lari
es o
f T
ea
ch
ers
136,3
45.0
0$
(80,5
00.0
0)
$
55,8
45.0
0$
16,4
61.5
0
39,3
83.5
0
Sum
mer
Sch
ool -
Support
Serv
ices:
Sala
ries
35,0
00.0
0
-
35,0
00.0
0
4,7
73.4
0
30,2
26.6
0
To
tal S
um
me
r S
ch
oo
l171,3
45.0
0
(80,5
00.0
0)
90,8
45.0
0
21,2
34.9
0
69,6
10.1
0
Tota
l Exp
enditu
res
44,0
08,5
25.7
3
1,9
13.0
0
44,0
10,4
38.7
3
43,6
25,8
96.8
9
384,5
41.8
4
Exce
ss (
De
ficie
ncy)
of R
evenues O
ver
(Under)
Expenditu
res
(4,4
20,2
29.7
3)
-
(4,4
20,2
29.7
3)
(8,6
89.6
6)
4,4
11,5
40.0
7
Oth
er
Fin
an
cin
g S
ou
rce
s (
Use
s):
Op
era
tin
g T
ran
sfe
rs:
Ente
rprise
Funds
(42,2
97.0
0)
(42,2
97.0
0)
Exce
ss (
De
ficie
ncy)
of R
eve
nues
and O
ther
Fin
anci
ng S
ourc
es
Ove
r (U
nder)
Exp
enditu
res
and O
ther
Fin
anci
ng U
ses
(4,4
20,2
29.7
3)
-
(4,4
20,2
29.7
3)
(50,9
86.6
6)
4,3
69,2
43.0
7
Fund B
ala
nce
s, J
uly
110,1
58,4
14.9
7
-
10,1
58,4
14.9
7
10,1
58,4
14.9
7
-
Fund B
ala
nce
s, J
une 3
05,7
38,1
85.2
4
-
5,7
38,1
85.2
4
10,1
07,4
28.3
1
4,3
69,2
43.0
7
Ad
justm
en
t fo
r P
rio
r Y
ea
r E
ncu
mb
ran
ce
s(4
89,1
98.7
3)
-
(489,1
98.7
3)
489,1
98.7
3
Budgete
d F
und B
ala
nce
(3,9
31,0
31.0
0)
-
(3,9
31,0
31.0
0)
(3,9
31,0
31.0
0)
(4,4
20,2
29.7
3)
$
-$
(4,4
20,2
29.7
3)
$
-$
(3,4
41,8
32.2
7)
$
(Contin
ued)
73

23400
Ex
hib
it C
-1
CA
MD
EN
CO
UN
TY
TE
CH
NIC
AL
SC
HO
OL
DIS
TR
ICT
Budgeta
ry C
om
pa
riso
n S
ch
ed
ule
G
enera
l Fund
For
the F
isca
l Year
Ended J
une 3
0, 2013
Variance
Origin
al
Budget
Fin
al
Posi
tive (
Negativ
e)
Budget
Modifi
catio
ns
Budget
Act
ual
Fin
al t
o A
ctual
Re
ca
pit
ula
tio
n o
f F
un
d B
ala
nc
e:
Rest
rict
ed F
und B
ala
nce
sC
apita
l Rese
rve
621,6
08.6
7$
Exc
ess
Surp
lus
-Desi
gnate
d for
Subse
quent Y
ear's
Exp
enditu
res
3,3
97,0
73.3
8
Exc
ess
Surp
lus
- C
urr
ent Y
ear
2,9
29,0
99.9
4
Ass
igned F
und B
ala
nce
Re
se
rve
d f
or
En
cu
mb
ran
ce
s110,8
60.5
6
Desi
gnate
d for
Subse
quent Y
ear's
Exp
enditu
res
645,2
29.6
2
Unass
igned F
und B
ala
nce
2,4
03,5
56.1
4 10,1
07,4
28.3
1
Reco
nci
liatio
n to G
overn
menta
l Funds
Sta
tem
ents
(G
AA
P):
Last
Sta
te A
id P
aym
ent not re
cogniz
ed o
n G
AA
P b
asi
s2,2
01,7
74.0
0
Fund B
ala
nce
per
Gove
rnm
enta
l Funds
(GA
AP
)7,9
05,6
54.3
1$
74

26500
Ex
hib
it C
-1b
CA
MD
EN
CO
UN
TY
TE
CH
NIC
AL
SC
HO
OL
DIS
TR
ICT
Required S
upple
menta
ry I
nfo
rma
tio
nB
udgeta
ry C
om
pariso
n S
chedule
- E
duca
tion J
obs
Fund
GE
NE
RA
L F
UN
DF
or
the F
isca
l Year
Ended J
une 3
0, 2012
Posi
tive
Adopte
dT
ran
sfe
rs/
Fin
al
(Negativ
e)
Budget
Modifi
catio
ns
Budget
Act
ual
Fin
al t
o A
ctual
RE
VE
NU
ES
: F
edera
l Sourc
es:
E
duca
tion J
obs
Fund
1,9
13.0
0$
1,9
13.0
0$
1,9
13.0
0$
EX
PE
ND
ITU
RE
S:
G
en
era
l C
urr
en
t E
xp
en
se:
V
oca
tional -
Regula
r R
eg P
rogra
m 9
- 1
2 S
ala
ries
1,9
13.0
0
1,9
13.0
0
1,9
13.0
0
Tota
l Exp
enditu
res
1,9
13.0
0
1,9
13.0
0
1,9
13.0
0
Exce
ss (
De
ficie
ncy)
of R
eve
nues O
ver
(Under)
Exp
enditu
res
an
d O
the
r F
ina
ncin
g S
ou
rce
s (
Use
s)
-
-
-
-
-
Fund B
ala
nce
s -
July
1,
Fund B
ala
nce
s -
June 3
0,
-$
-$
-$
-$
-$
75

23400
Ex
hib
it C
-2C
AM
DE
N C
OU
NT
Y T
EC
HN
ICA
L S
CH
OO
L D
IST
RIC
TB
udgeta
ry C
om
pa
riso
n S
ch
ed
ule
S
peci
al R
eve
nue F
und
For
the F
isca
l Year
Ended J
une 3
0, 2013
Variance
Origin
al
Budget
Fin
al
Posi
tive (
Negativ
e)
Budget
Modifi
catio
ns
Budget
Act
ual
Fin
al t
o A
ctual
RE
VE
NU
ES
:Local S
ourc
es:
Re
ve
nu
e f
rom
Lo
ca
l S
ou
rce
s23,5
00.0
0$
18,4
11.0
0$
41,9
11.0
0$
26,4
50.8
0$
(15,4
60.2
0)
$
Sta
te S
ourc
es:
Gre
en P
ilot P
rogra
m6,0
00.0
0
4,5
03.5
0
10,5
03.5
0
5,7
72.0
0
(4,7
31.5
0)
Federa
l Sourc
es:
Title
I1,0
72,1
17.0
0
826,3
05.6
1
1,8
98,4
22.6
1
1,1
40,6
66.7
9
(757,7
55.8
2)
Titl
e IIA
120,4
14.0
0
118,2
43.5
6
238,6
57.5
6
62,4
05.1
7
(176,2
52.3
9)
I.D
.E.A
., P
art
B597,3
07.0
0
127,2
40.6
0
724,5
47.6
0
708,5
96.3
6
(15,9
51.2
4)
Carl D
. P
erk
ins
Voca
tional a
nd T
ech
nic
al E
duca
tion A
ct369,2
11.0
0
41,7
96.0
0
411,0
07.0
0
405,8
25.9
0
(5,1
81.1
0)
21st C
entu
ry A
fter
Sch
ool L
earn
ing
535,0
00.0
0
(491,9
16.1
3)
43,0
83.8
7
9,4
01.0
6
(33,6
82.8
1)
Ra
ce
to
th
e T
op
100,4
51.0
0
100,4
51.0
0
43,7
50.5
1
(56,7
00.4
9)
To
tal -
Fe
de
ral S
ou
rce
s2,6
94,0
49.0
0
722,1
20.6
4
3,4
16,1
69.6
4
2,3
70,6
45.7
9
(1,0
45,5
23.8
5)
Tota
l Reve
nues
2,7
23,5
49.0
0$
745,0
35.1
4$
3,4
68,5
84.1
4$
2,4
02,8
68.5
9$
(1,0
65,7
15.5
5)
$
(Contin
ued)
76

23400
Ex
hib
it C
-2C
AM
DE
N C
OU
NT
Y T
EC
HN
ICA
L S
CH
OO
L D
IST
RIC
TB
udgeta
ry C
om
pa
riso
n S
ch
ed
ule
S
peci
al R
eve
nue F
und
For
the F
isca
l Year
Ended J
une 3
0, 2013
Variance
Origin
al
Budget
Fin
al
Posi
tive (
Negativ
e)
Budget
Modifi
catio
ns
Budget
Act
ual
Fin
al t
o A
ctual
EX
PE
ND
ITU
RE
S:
Instr
uctio
n:
Sa
lari
es o
f T
ea
ch
ers
595,0
00.0
0$
19,5
33.2
0$
614,5
33.2
0$
416,8
14.0
4$
197,7
19.1
6$
Purc
hase
d P
rofe
ssi
onal T
ech
nic
al S
erv
ices
208,1
17.0
0
(185,2
90.0
0)
22,8
27.0
0
16,0
84.0
0
6,7
43.0
0
Oth
er
Purc
hase
d S
erv
ices
85,0
00.0
0
(68,0
00.0
0)
17,0
00.0
0
4,2
91.8
7
12,7
08.1
3
Supplie
s and M
ate
rials
230,0
00.0
0
325,1
02.9
5
555,1
02.9
5
426,6
14.9
3
128,4
88.0
2
Oth
er
Ob
jects
1,0
00.0
0
648.0
0
1,6
48.0
0
1,4
55.0
0
193.0
0
To
tal In
str
uctio
n1,1
19,1
17.0
0
91,9
94.1
5
1,2
11,1
11.1
5
865,2
59.8
4
345,8
51.3
1
Support
Serv
ices:
Sala
ries
830,0
00.0
0
370,6
05.9
8
1,2
00,6
05.9
8
904,6
74.4
2295,9
31.5
6
Pers
onnel S
erv
ices
- E
mplo
yee B
enefit
s192,7
21.0
0
74,7
93.4
9
267,5
14.4
9
225,6
63.5
241,8
50.9
7
Purc
hase
d P
rofe
ssi
onal T
ech
nic
al S
erv
ices
137,5
00.0
0
163,0
97.0
0
300,5
97.0
0
163,6
16.8
0136,9
80.2
0
Purc
hase
d P
ropert
y S
erv
ice
33,3
07.0
0
33,3
07.0
0
33,1
60.4
0146.6
0
Oth
er
Purc
hase
d S
erv
ices
228,0
00.0
0
(120,9
39.4
0)
107,0
60.6
0
15,0
62.0
091,9
98.6
0
Tra
ve
l11,0
00.0
0
30,3
89.8
0
41,3
89.8
0
21,9
26.9
219,4
62.8
8
Supplie
s and M
ate
rials
36,0
00.0
0
123,6
16.1
2
159,6
16.1
2
30,5
88.3
6129,0
27.7
6
Tota
l Support
Serv
ices
1,4
35,2
21.0
0
674,8
69.9
9
2,1
10,0
90.9
9
1,3
94,6
92.4
2
715,3
98.5
7
Faci
litie
s A
cquis
ition a
nd C
onst
ruct
ion S
erv
ices:
Non Inst
ruct
ional E
quip
ment
169,2
11.0
0
(34,9
81.0
0)
134,2
30.0
0
129,7
64.3
3
4,4
65.6
7
Inst
ruct
ional E
quip
ment
13,1
52.0
0
13,1
52.0
0
13,1
52.0
0
Tota
l Faci
litie
s A
cquis
ition a
nd C
onst
ruct
ion S
erv
ices
169,2
11.0
0
(21,8
29.0
0)
147,3
82.0
0
142,9
16.3
3
4,4
65.6
7
Tota
l Exp
enditu
res
2,7
23,5
49.0
0$
745,0
35.1
4$
3,4
68,5
84.1
4$
2,4
02,8
68.5
9$
1,0
65,7
15.5
5$
77

OTHER SUPPLEMENTARY INFORMATION

23400 Exhibit C-3CAMDEN COUNTY TECHNICAL SCHOOL DISTRICT
Required Supplementary InformationBudgetary Comparison Schedule
Note to RSIFor the Fiscal Year Ended June 30, 2013
Note A - Explanation of Differences between Budgetary Inflows and Outflows and GAAP Revenues and Expenditures.
SpecialGeneral Revenue
Fund FundSources / Inflows of Resources:
43,617,207.23$ 2,402,868.59$
Differences - Budget to GAAP:
16,948.88
2,110,508.00
(2,201,774.00)
43,525,941.23$ 2,419,817.47$
Uses / Outflows of Resources:
43,625,896.89$ 2,402,868.59$
Differences - Budget to GAAP:
16,948.88
43,625,896.89$ 2,419,817.47$
Encumbrances for supplies and equipment ordered but not received is reportedin the year the order is placed for budgetary purposes, but in the year thesupplies are received for financial reporting purposes.
Total expenditures as reported on the statement of revenues, expenditures, andchanges in fund balances - governmental funds (B-2)
State aid payment recognized for GAAP statements in current year, previouslyrecognized for budgetary purposes
The last State aid payment is recognized as revenue for budgetary purposesand differs from GAAP which does not recognize this revenue until thesubsequent year when the State recognizes the related expense.
Actual amounts (budgetary basis) "revenues" from the budgetary comparisonschedules
Grant accounting budgetary basis differs from GAAP in that encumbrances arerecognized as expenditures, and the related revenue is recognized.
Total revenues as reported on the statement of revenues, expenditures, andchanges in fund balances - governmental funds
Actual amounts (budgetary basis) "total expenditures" from the budgetarycomparison schedule
79

SPECIAL REVENUE FUND

2340
0E
xhib
it E
-1C
AM
DE
N C
OU
NT
Y T
EC
HN
ICA
L S
CH
OO
L D
IST
RIC
TS
PE
CIA
L R
EV
EN
UE
FU
ND
Com
bini
ng S
ched
ule
of R
even
ues
and
Exp
endi
ture
s --
Bud
geta
ry B
asis
For
the
Fis
cal Y
ear
End
ed J
une
30, 2
013
Tot
alT
itle
II -
IDE
A P
art B
Rac
e to
the
Bro
ught
Tot
alT
itle
I, P
art A
Par
t AB
asic
Top
For
war
dR
EV
EN
UE
S:
Loca
l Sou
rces
26,4
50.8
0$
26,4
50.8
0$
S
tate
Sou
rces
5,77
2.00
5,77
2.00
Fed
eral
Sou
rces
2,37
0,64
5.79
1,14
0,66
6.79
$
62,4
05.1
7$
70
8,59
6.36
$ 43
,750
.51
$
415,
226.
96
Tot
al R
even
ues
2,40
2,86
8.59
$
1,14
0,66
6.79
$
62,4
05.1
7$
70
8,59
6.36
$ 43
,750
.51
$
447,
449.
76$
EX
PE
ND
ITU
RE
S:
Inst
ruct
ion:
Sal
arie
s of
Tea
cher
s41
6,81
4.04
$
18
0,69
8.54
$
23
4,76
1.00
$ 1,
354.
50$
Pur
chas
ed P
rofe
ssio
nal T
echn
ical
Ser
vice
s16
,084
.00
1,36
5.00
14,7
19.0
0
O
ther
Pur
chas
ed S
ervi
ces
4,29
1.87
4,29
1.87
Gen
eral
Sup
plie
s42
6,61
4.93
200,
125.
5110
,698
.00
215,
791.
42
Oth
er O
bje
cts
1,45
5.00
1,45
5.00
Tot
al In
stru
ctio
n86
5,25
9.84
382,
189.
05-
246,
914.
00-
23
6,15
6.79
Sup
port
Ser
vice
s:S
alar
ies
904,
674.
4252
9,16
8.31
31,4
91.7
8$
34
0,62
9.00
3,38
5.33
Per
sonn
el S
ervi
ces-
Em
ploy
ee B
enef
its22
5,66
3.52
111,
790.
472,
463.
5611
1,23
8.36
171.
13
Pur
chas
ed P
rofe
ssio
nal T
echn
ical
Ser
vice
s16
3,61
6.80
94,4
50.0
08,
338.
808,
697.
0043
,598
.00
$
8,53
3.00
Pur
chas
ed P
rope
rty
Ser
vice
s33
,160
.40
33,1
60.4
0
O
ther
Pur
chas
ed S
ervi
ces
15,0
62.0
08,
302.
0081
.50
37
0.00
6,30
8.50
Tra
vel
21,9
26.9
23,
263.
0017
,915
.92
748.
00
S
uppl
ies
and
Mat
eria
ls30
,588
.36
11,5
03.9
62,
113.
6115
2.51
16,8
18.2
8
Tot
al S
uppo
rt S
ervi
ces
1,39
4,69
2.42
758,
477.
7462
,405
.17
461,
682.
3643
,750
.51
68,3
76.6
4
Fac
ilitie
s A
cqui
sitio
n an
d C
onst
ruct
ion
Ser
vice
s:In
stru
ctio
nal E
quip
men
t12
9,76
4.33
129,
764.
33N
on In
stru
ctio
nal E
quip
men
t13
,152
.00
13,1
52.0
0
Tot
al F
acili
ties
Acq
uisi
tion
and
Con
stru
ctio
n S
ervi
ces
142,
916.
33-
-
-
-
142,
916.
33
Tot
al E
xpen
ditu
res
2,40
2,86
8.59
$
1,14
0,66
6.79
$
62,4
05.1
7$
70
8,59
6.36
$ 43
,750
.51
$
447,
449.
76$
(Con
tinue
d)
NC
LB
81

2340
0E
xhib
it E
-1C
AM
DE
N C
OU
NT
Y T
EC
HN
ICA
L S
CH
OO
L D
IST
RIC
TS
PE
CIA
L R
EV
EN
UE
FU
ND
Com
bini
ng S
ched
ule
of R
even
ues
and
Exp
endi
ture
s --
Bud
geta
ry B
asis
For
the
Fis
cal Y
ear
End
ed J
une
30, 2
013
Tot
alT
otal
Car
ried
Per
kins
21st
Cen
tury
Gre
en P
ilot
Dis
tanc
eB
roug
htF
orw
ard
Sec
onda
ryLe
arni
ngP
rogr
amLe
arni
ngF
orw
ard
RE
VE
NU
ES
:Lo
cal S
ourc
es26
,450
.80
$
3,
650.
00$
22
,800
.80
$
Sta
te S
ourc
es5,
772.
00
5,77
2.00
$
F
eder
al S
ourc
es41
5,22
6.96
405,
825.
90$
9,
401.
06$
Tot
al R
even
ues
447,
449.
76$
40
5,82
5.90
$
9,40
1.06
$
5,
772.
00$
3,65
0.00
$
22,8
00.8
0$
EX
PE
ND
ITU
RE
S:
Inst
ruct
ion:
Sal
arie
s of
Tea
cher
s1,
354.
50$
83
9.50
$
515.
00$
P
urch
ased
Pro
fess
iona
l Tec
hnic
al S
ervi
ces
14,7
19.0
0
14,7
19.0
0$
Oth
er P
urch
ased
Ser
vice
s4,
291.
87
700.
00
3,
591.
87
Gen
eral
Sup
plie
s21
5,79
1.42
208,
770.
79
6,
670.
23
350.
40$
Oth
er O
bjec
ts
Tot
al In
stru
ctio
n23
6,15
6.79
224,
189.
797,
509.
734,
106.
8735
0.40
-
Sup
port
Ser
vice
s:S
alar
ies
3,38
5.33
1,89
1.33
1,49
4.00
P
erso
nnel
Ser
vice
s-E
mpl
oyee
Ben
efits
171.
1317
1.13
Pur
chas
ed P
rofe
ssio
nal T
echn
ical
Ser
vice
s8,
533.
008,
533.
00
P
urch
ased
Pro
pert
y S
ervi
ces
33,1
60.4
033
,160
.40
Oth
er P
urch
ased
Ser
vice
s6,
308.
502,
200.
002,
650.
00
1,45
8.50
$
T
rave
l
S
uppl
ies
and
Mat
eria
ls16
,818
.28
7,97
8.38
649.
60
8,
190.
30
Tot
al S
uppo
rt S
ervi
ces
68,3
76.6
451
,871
.78
1,89
1.33
1,66
5.13
3,
299.
609,
648.
80
Fac
ilitie
s A
cqui
sitio
n an
d C
onst
ruct
ion
Ser
vice
s:In
stru
ctio
nal E
quip
men
t12
9,76
4.33
129,
764.
33
N
on In
stru
ctio
nal E
quip
men
t13
,152
.00
13,1
52.0
0
Tot
al F
acili
ties
Acq
uisi
tion
and
Con
stru
ctio
n S
ervi
ce14
2,91
6.33
129,
764.
33
-
-
-
13,1
52.0
0
Tot
al E
xpen
ditu
res
447,
449.
76$
40
5,82
5.90
$
9,40
1.06
$
5,
772.
00$
3,65
0.00
$
22,8
00.8
0$
(Con
tinue
d)
82

2340
0E
xhib
it E
-1C
AM
DE
N C
OU
NT
Y T
EC
HN
ICA
L S
CH
OO
L D
IST
RIC
TS
PE
CIA
L R
EV
EN
UE
FU
ND
Com
bini
ng S
ched
ule
of R
even
ues
and
Exp
endi
ture
s --
Bud
geta
ry B
asis
For
the
Fis
cal Y
ear
End
ed J
une
30, 2
013
Tot
alC
ampb
ell
Car
ried
Sou
pE
mer
genc
yF
orw
ard
Fou
ndat
ion
Man
agem
ent
RE
VE
NU
ES
:Lo
cal S
ourc
es22
,800
.80
$
2,88
9.80
$
19,9
11.0
0$
S
tate
Sou
rces
F
eder
al S
ourc
es
Tot
al R
even
ues
22,8
00.8
0$
2,
889.
80$
19
,911
.00
$
EX
PE
ND
ITU
RE
S:
Inst
ruct
ion:
Sal
arie
s of
Tea
cher
s
Pur
chas
ed P
rofe
ssio
nal T
echn
ical
Ser
vice
s
Oth
er P
urch
ased
Ser
vice
s
Gen
eral
Sup
plie
sO
ther
Obj
ects
Tot
al In
stru
ctio
n-
-
-
Sup
port
Ser
vice
s:S
alar
ies
P
erso
nnel
Ser
vice
s-E
mpl
oyee
Ben
efits
P
urch
ased
Pro
fess
iona
l Tec
hnic
al S
ervi
ces
P
urch
ased
Pro
pert
y S
ervi
ces
O
ther
Pur
chas
ed S
ervi
ces
1,45
8.50
$
1,45
8.50
$
Tra
vel
S
uppl
ies
and
Mat
eria
ls8,
190.
30
1,
431.
30
6,
759.
00$
Tot
al S
uppo
rt S
ervi
ces
9,64
8.80
2,88
9.80
6,75
9.00
Fac
ilitie
s A
cqui
sitio
n an
d C
onst
ruct
ion
Ser
vice
s:In
stru
ctio
nal E
quip
men
tN
on In
stru
ctio
nal E
quip
men
t13
,152
.00
13,1
52.0
0
Tot
al F
acili
ties
Acq
uisi
tion
and
Con
stru
ctio
n S
ervi
ces
13,1
52.0
0
-
13,1
52.0
0
Tot
al E
xpen
ditu
res
22,8
00.8
0$
2,
889.
80$
19
,911
.00
$
83

CAPITAL PROJECTS FUND

23400
Ex
hib
it F
-1
Unexp
ended
To
tal
Bala
nce
Pro
ject
Title
Appro
priatio
nP
rior
Years
Curr
ent Y
ear
Exp
enditu
res
June 3
0, 2013
(a)
11,0
10,1
24.2
5$
10,5
09,4
89.3
9$
10,5
09,4
89.3
9$
500,6
34.8
6$
(b)
Win
dow
Repla
cem
en
t -
Pe
nn
sa
uke
n C
am
pu
s721,6
65.0
0721,6
65.0
0
721,6
65.0
0
(c)
Ro
of
Re
pla
ce
me
nt
Bu
ildin
gs 2
, 6
an
d 8
- G
lou
ce
ste
r C
am
pu
s2,2
38,6
94.4
82,2
38,6
94.4
8
2,2
38,6
94.4
8
(d)
Ro
of
Re
pla
ce
me
nt
Bu
ildin
g 4
- G
lou
ce
ste
r C
am
pu
s3,3
19,5
94.3
73,1
65,1
35.2
1
34,2
67.3
0$
3,1
99,4
02.5
1
120,1
91.8
6
(e)
Well
Repla
cem
en
t -
Glo
uce
ste
r C
am
pu
s378,3
92.3
3378,3
92.3
3
378,3
92.3
3
(f)
Em
erg
en
cy
Ge
ne
rato
r -
Pe
nn
sa
uke
n C
am
pu
s225,4
00.0
0219,2
75.7
3
6,1
24.2
7
225,4
00.0
0
(g)
Em
erg
en
cy
Ge
ne
rato
r -
Glo
uce
ste
r C
am
pu
s421,6
00.0
0
232,1
89.7
6
232,1
89.7
6
189,4
10.2
4
(h)
Roof R
epla
cem
ent B
uild
ings
9, 10 a
nd 1
1 -
Glo
uce
ster
Cam
pus
438,7
28.0
0352,8
82.1
4
352,8
82.1
4
85,8
45.8
6
(i)
Audito
rium
Air C
onditi
onin
g -
Pennsa
uke
n C
am
pus
425,4
00.0
0
12,0
36.5
4
12,0
36.5
4
413,3
63.4
6
(j)
Re
str
oo
ms -
Pe
nn
sa
uke
n C
am
pu
s318,0
00.0
0
8,1
56.2
5
8,1
56.2
5
309,8
43.7
5
(k)
Sch
ool B
us
Purc
hase
190,0
00.0
0190,0
00.0
0
190,0
00.0
0
$19,6
87,5
98.4
3$17,5
85,5
34.2
8482,7
74.1
2$
$18,0
68,3
08.4
0$1,6
19,2
90.0
3
Re
se
rve
fo
r E
ncu
mb
ran
ce
s538,9
39.5
0$
Desi
gnate
d for
Subse
quent Y
ear's
Exp
enditu
res
1,0
80,3
50.5
3 $1,6
19,2
90.0
3
Sci
ence
Build
ing a
nd G
reenhouse
Const
ruct
ion -
Pennsa
uke
n
Ca
mp
us
CA
MD
EN
CO
UN
TY
TE
CH
NIC
AL
SC
HO
OL
SC
AP
ITA
L P
RO
JE
CT
S F
UN
DS
um
mary
Sta
tem
en
t o
f P
roje
ct
Exp
en
ditu
res
For
the F
isca
l Year
Ended J
une 3
0, 2013
Exp
enditu
res
to D
ate
85

23400 Exhibit F-2
CAMDEN COUNTY TECHNICAL SCHOOLSCAPITAL PROJECTS FUND
Statement of Revenues, Expenditures and Changes in Fund Balances--Budgetary BasisFor the Fiscal Year Ended June 30, 2013
Revenues and Other Financing SourcesState Sources -$ County Improvement Authorization 190,000.00
Total Revenues 190,000.00
Expenditures and Other Financing UsesPurchased Professional and Technical Services 107,913.14 Construction Services 184,860.98 Non-Instructional Equipment 190,000.00
Total Expenditures 482,774.12
Excess (Deficiency) of Revenues Over (Under) Expenditures (292,774.12)
Fund Balance -- July 1 1,912,064.15
Fund Balance -- June 30 1,619,290.03$
86

23400 Exhibit F-2a
CAMDEN COUNTY TECHNICAL SCHOOLSCAPITAL PROJECTS FUND
Statement of Project Revenues, Expenditures, Project Balance and Project Status--Budgetary Basis
For the Fiscal Year Ended June 30, 2013
RevisedAuthorized
Prior Years Current Year Totals Cost
Revenues and Other Financing SourcesState Sources 5,399,072.00$ 5,399,072.00$ 5,399,072.00$ Transfer from Capital Reserve 600,000.00 600,000.00 600,000.00 County Improvement Authorization 5,011,052.25 5,011,052.25 5,011,052.25
Total Revenues 11,010,124.25 - 11,010,124.25 11,010,124.25
Expenditures and Other Financing UsesPurchased Professional and Technical Services 785,490.12 785,490.12Construction Services 9,723,999.27 9,723,999.27
Total Expenditures 10,509,489.39 - 10,509,489.39 11,010,124.25Excess (Deficiency) of Revenues Over
(Under) Expenditures 500,634.86$ -$ 500,634.86$ -$
Additional Project Information:Project Number N/AGrant Date N/ABond Authorization Date N/ABonds Authorized N/ABonds Issued N/AOriginal Authorized Cost 4,136,000.00$ Additional Authorized Cost 6,874,124.25$ Revised Authorized Cost 11,010,124.25$
Percentage Increase over Original Authorized Cost N/APercentage Completion 95.45%Original Target Completion Date 06/01/10Revised Target Completion Date 06/30/12
Science Building and Greenhouse Construction - Pennsauken Campus
87
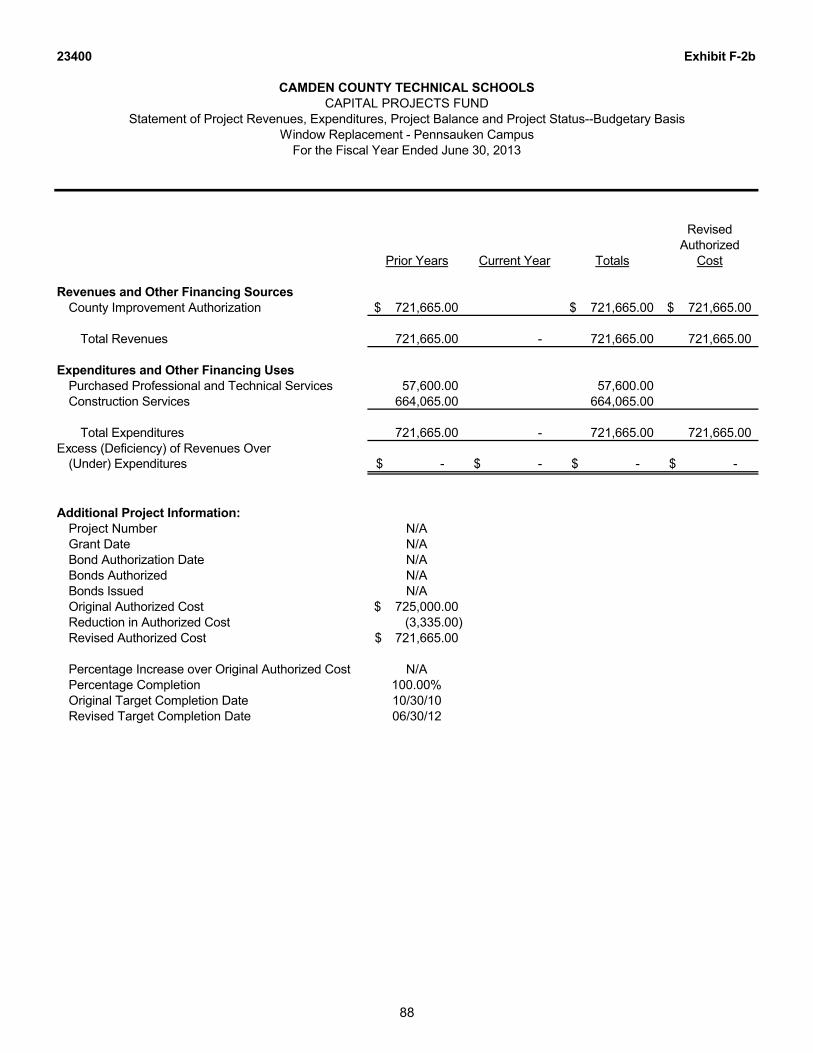
23400 Exhibit F-2b
CAMDEN COUNTY TECHNICAL SCHOOLSCAPITAL PROJECTS FUND
Statement of Project Revenues, Expenditures, Project Balance and Project Status--Budgetary Basis
For the Fiscal Year Ended June 30, 2013
RevisedAuthorized
Prior Years Current Year Totals Cost
Revenues and Other Financing SourcesCounty Improvement Authorization 721,665.00$ 721,665.00$ 721,665.00$
Total Revenues 721,665.00 - 721,665.00 721,665.00
Expenditures and Other Financing UsesPurchased Professional and Technical Services 57,600.00 57,600.00 Construction Services 664,065.00 664,065.00
Total Expenditures 721,665.00 - 721,665.00 721,665.00Excess (Deficiency) of Revenues Over
(Under) Expenditures -$ -$ -$ -$
Additional Project Information:Project Number N/AGrant Date N/ABond Authorization Date N/ABonds Authorized N/ABonds Issued N/AOriginal Authorized Cost 725,000.00$ Reduction in Authorized Cost (3,335.00) Revised Authorized Cost 721,665.00$
Percentage Increase over Original Authorized Cost N/APercentage Completion 100.00%Original Target Completion Date 10/30/10Revised Target Completion Date 06/30/12
Window Replacement - Pennsauken Campus
88

23400 Exhibit F-2c
CAMDEN COUNTY TECHNICAL SCHOOLSCAPITAL PROJECTS FUND
Statement of Project Revenues, Expenditures, Project Balance and Project Status--Budgetary Basis
For the Fiscal Year Ended June 30, 2013
RevisedAuthorized
Prior Years Current Year Totals Cost
Revenues and Other Financing SourcesState Sources 1,480,392.48$ 1,480,392.48$ 1,480,392.48$ County Improvement Authorization 758,302.00 758,302.00 758,302.00
Total Revenues 2,238,694.48 - 2,238,694.48 2,238,694.48
Expenditures and Other Financing UsesPurchased Professional and Technical Services 246,932.37 246,932.37Construction Services 1,991,762.11 1,991,762.11
Total Expenditures 2,238,694.48 - 2,238,694.48 2,238,694.48Excess (Deficiency) of Revenues Over
(Under) Expenditures -$ -$ -$ -$
Additional Project Information:Project Number 0700-040-09-2005Grant Date 12/22/11Bond Authorization Date N/ABonds Authorized N/ABonds Issued N/AOriginal Authorized Cost 3,109,773.00$ Reduction in Authorized Cost 871,078.52 Revised Authorized Cost 2,238,694.48$
Percentage Increase over Original Authorized Cost N/APercentage Completion 100.00%Original Target Completion Date 08/31/11Revised Target Completion Date 12/31/12
Roof Replacement Buildings 2, 6 and 8 - Gloucester Campus
89

23400 Exhibit F-2d
CAMDEN COUNTY TECHNICAL SCHOOLSCAPITAL PROJECTS FUND
Statement of Project Revenues, Expenditures, Project Balance and Project Status--Budgetary Basis
For the Fiscal Year Ended June 30, 2013
RevisedAuthorized
Prior Years Current Year Totals Cost
Revenues and Other Financing SourcesState Sources 1,791,783.37$ 1,791,783.37$ 1,791,783.37$ County Improvement Authorization 1,527,811.00 1,527,811.00 1,527,811.00
Total Revenues 3,319,594.37 - 3,319,594.37 3,319,594.37
Expenditures and Other Financing UsesPurchased Professional and Technical Services 253,260.21 28,039.28$ 281,299.49Construction Services 2,911,875.00 6,228.02 2,918,103.02
Total Expenditures 3,165,135.21 34,267.30 3,199,402.51 3,319,594.37Excess (Deficiency) of Revenues Over
(Under) Expenditures 154,459.16$ (34,267.30)$ 120,191.86$ -$
Additional Project Information:Project Number 0700-040-09-2004Grant Date 12/22/11Bond Authorization Date N/ABonds Authorized N/ABonds Issued N/AOriginal Authorized Cost 3,521,114.00$ Additional Authorized Cost 201,519.63 Revised Authorized Cost 3,319,594.37$
Percentage Increase over Original Authorized Cost N/APercentage Completion 96.38%Original Target Completion Date 08/31/11Revised Target Completion Date 12/31/12
Roof Replacement Building 4 - Gloucester Campus
90

23400 Exhibit F-2e
CAMDEN COUNTY TECHNICAL SCHOOLSCAPITAL PROJECTS FUND
Statement of Project Revenues, Expenditures, Project Balance and Project Status--Budgetary Basis
For the Fiscal Year Ended June 30, 2013
RevisedAuthorized
Prior Years Current Year Totals Cost
Revenues and Other Financing SourcesTransfer from Capital Reserve 378,392.33$ 378,392.33$ 378,392.33$
Total Revenues 378,392.33 - 378,392.33 378,392.33
Expenditures and Other Financing UsesPurchased Professional and Technical Services 21,037.33 21,037.33Construction Services 357,355.00 357,355.00
Total Expenditures 378,392.33 - 378,392.33 378,392.33Excess (Deficiency) of Revenues Over
(Under) Expenditures -$ -$ -$ -$
Additional Project Information:Project Number N/AGrant Date N/ABond Authorization Date N/ABonds Authorized N/ABonds Issued N/AOriginal Authorized Cost 400,000.00$ Reduction in Authorized Cost (21,607.67) Revised Authorized Cost 378,392.33$
Percentage Increase over Original Authorized Cost N/APercentage Completion 100.00%Original Target Completion Date 12/31/11Revised Target Completion Date 12/31/11
Well Replacement - Gloucester Campus
91

23400 Exhibit F-2f
CAMDEN COUNTY TECHNICAL SCHOOLSCAPITAL PROJECTS FUND
Statement of Project Revenues, Expenditures, Project Balance and Project Status--Budgetary Basis
For the Fiscal Year Ended June 30, 2013
RevisedAuthorized
Prior Years Current Year Totals Cost
Revenues and Other Financing SourcesState Sources 59,667.00$ 59,667.00$ 59,667.00$ County Improvement Authorization 165,733.00 165,733.00 165,733.00
Total Revenues 225,400.00 - 225,400.00 225,400.00
Expenditures and Other Financing UsesPurchased Professional and Technical Services 16,275.73 6,124.27$ 22,400.00Construction Services 203,000.00 203,000.00
Total Expenditures 219,275.73 6,124.27 225,400.00 225,400.00Excess (Deficiency) of Revenues Over
(Under) Expenditures 6,124.27$ (6,124.27)$ -$ -$
Additional Project Information:Project Number 0700-030-09-2007Grant Date 09/16/11Bond Authorization Date N/ABonds Authorized N/ABonds Issued N/AOriginal Authorized Cost 225,400.00$ Additional Authorized Cost ---Revised Authorized Cost 225,400.00$
Percentage Increase over Original Authorized Cost N/APercentage Completion 100.00%Original Target Completion Date 06/30/12Revised Target Completion Date 12/31/12
Emergency Generator - Pennsauken Campus
92
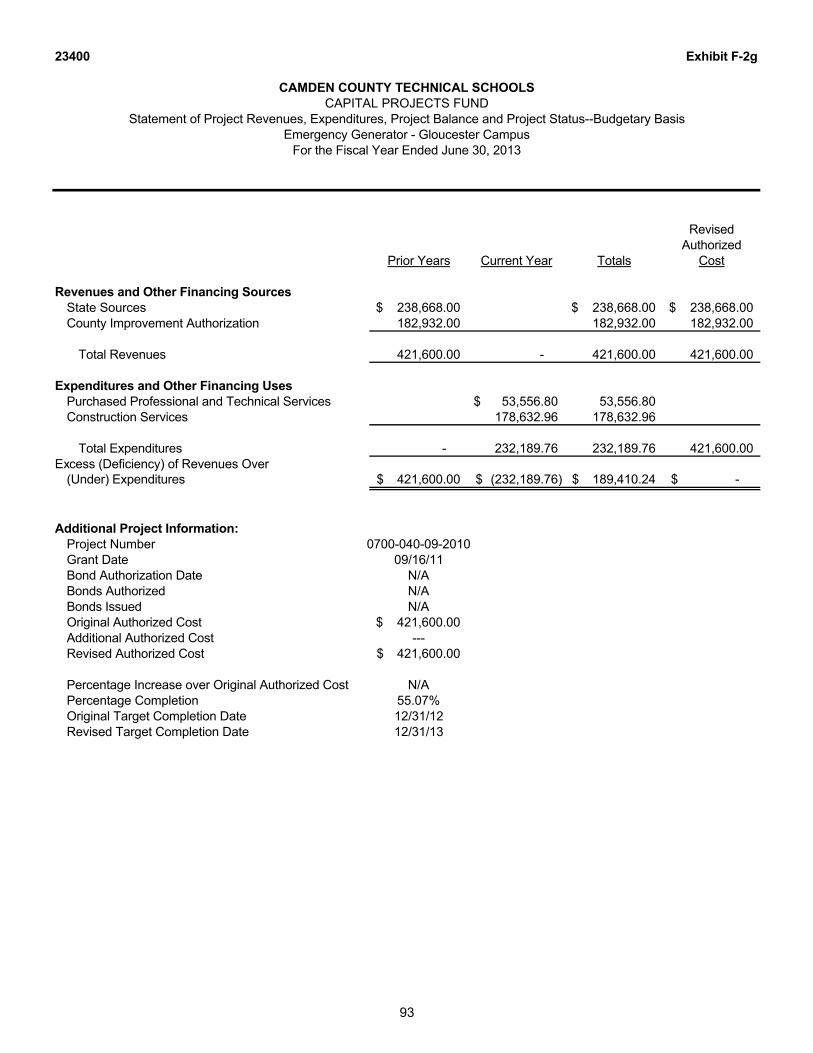
23400 Exhibit F-2g
CAMDEN COUNTY TECHNICAL SCHOOLSCAPITAL PROJECTS FUND
Statement of Project Revenues, Expenditures, Project Balance and Project Status--Budgetary Basis
For the Fiscal Year Ended June 30, 2013
RevisedAuthorized
Prior Years Current Year Totals Cost
Revenues and Other Financing SourcesState Sources 238,668.00$ 238,668.00$ 238,668.00$ County Improvement Authorization 182,932.00 182,932.00 182,932.00
Total Revenues 421,600.00 - 421,600.00 421,600.00
Expenditures and Other Financing UsesPurchased Professional and Technical Services 53,556.80$ 53,556.80Construction Services 178,632.96 178,632.96
Total Expenditures - 232,189.76 232,189.76 421,600.00Excess (Deficiency) of Revenues Over
(Under) Expenditures 421,600.00$ (232,189.76)$ 189,410.24$ -$
Additional Project Information:Project Number 0700-040-09-2010Grant Date 09/16/11Bond Authorization Date N/ABonds Authorized N/ABonds Issued N/AOriginal Authorized Cost 421,600.00$ Additional Authorized Cost ---Revised Authorized Cost 421,600.00$
Percentage Increase over Original Authorized Cost N/APercentage Completion 55.07%Original Target Completion Date 12/31/12Revised Target Completion Date 12/31/13
Emergency Generator - Gloucester Campus
93

23400 Exhibit F-2h
CAMDEN COUNTY TECHNICAL SCHOOLSCAPITAL PROJECTS FUND
Statement of Project Revenues, Expenditures, Project Balance and Project Status--Budgetary Basis
For the Fiscal Year Ended June 30, 2013
RevisedAuthorized
Prior Years Current Year Totals Cost
Revenues and Other Financing SourcesState Sources 438,728.00$ 438,728.00$ 438,728.00$
Total Revenues 438,728.00 - 438,728.00 438,728.00
Expenditures and Other Financing UsesPurchased Professional and Technical Services 54,832.64 54,832.64Construction Services 298,049.50 298,049.50
Total Expenditures 352,882.14 - 352,882.14 438,728.00Excess (Deficiency) of Revenues Over
(Under) Expenditures 85,845.86$ -$ 85,845.86$ -$
Additional Project Information:Project Number 0700-040-09-2006Grant Date 09/16/11Bond Authorization Date N/ABonds Authorized N/ABonds Issued N/AOriginal Authorized Cost 438,728.00$ Additional Authorized Cost ---Revised Authorized Cost 438,728.00$
Percentage Increase over Original Authorized Cost N/APercentage Completion 80.43%Original Target Completion Date 06/30/12Revised Target Completion Date 12/31/12
Roof Replacement Buildings 9, 10 and 11 - Gloucester Campus
94
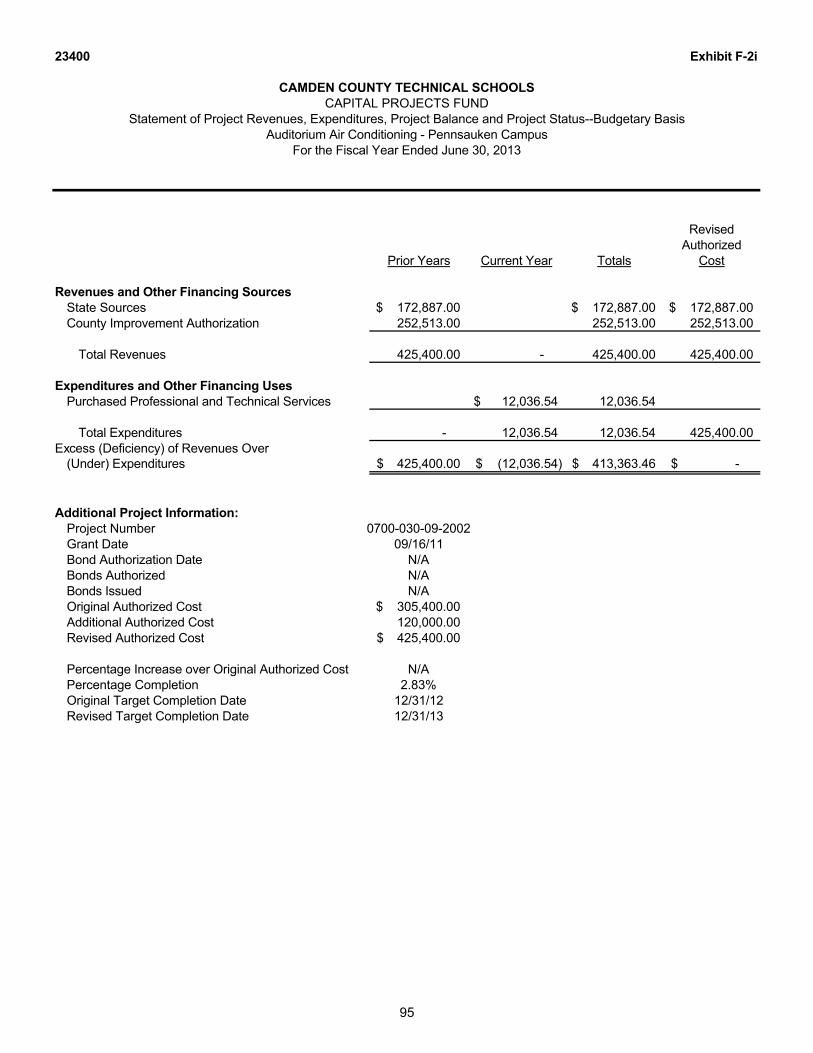
23400 Exhibit F-2i
CAMDEN COUNTY TECHNICAL SCHOOLSCAPITAL PROJECTS FUND
Statement of Project Revenues, Expenditures, Project Balance and Project Status--Budgetary Basis
For the Fiscal Year Ended June 30, 2013
RevisedAuthorized
Prior Years Current Year Totals Cost
Revenues and Other Financing SourcesState Sources 172,887.00$ 172,887.00$ 172,887.00$ County Improvement Authorization 252,513.00 252,513.00 252,513.00
Total Revenues 425,400.00 - 425,400.00 425,400.00
Expenditures and Other Financing UsesPurchased Professional and Technical Services 12,036.54$ 12,036.54
Total Expenditures - 12,036.54 12,036.54 425,400.00Excess (Deficiency) of Revenues Over
(Under) Expenditures 425,400.00$ (12,036.54)$ 413,363.46$ -$
Additional Project Information:Project Number 0700-030-09-2002Grant Date 09/16/11Bond Authorization Date N/ABonds Authorized N/ABonds Issued N/AOriginal Authorized Cost 305,400.00$ Additional Authorized Cost 120,000.00 Revised Authorized Cost 425,400.00$
Percentage Increase over Original Authorized Cost N/APercentage Completion 2.83%Original Target Completion Date 12/31/12Revised Target Completion Date 12/31/13
Auditorium Air Conditioning - Pennsauken Campus
95

23400 Exhibit F-2j
CAMDEN COUNTY TECHNICAL SCHOOLSCAPITAL PROJECTS FUND
Statement of Project Revenues, Expenditures, Project Balance and Project Status--Budgetary Basis
For the Fiscal Year Ended June 30, 2013
RevisedAuthorized
Prior Years Current Year Totals Cost
Revenues and Other Financing SourcesCounty Improvement Authorization 318,000.00$ 318,000.00$ 318,000.00$
Total Revenues 318,000.00 - 318,000.00 318,000.00
Expenditures and Other Financing UsesPurchased Professional and Technical Services 8,156.25$ 8,156.25
Total Expenditures - 8,156.25 8,156.25 318,000.00Excess (Deficiency) of Revenues Over
(Under) Expenditures 318,000.00$ (8,156.25)$ 309,843.75$ -$
Additional Project Information:Project Number N/AGrant Date N/ABond Authorization Date N/ABonds Authorized N/ABonds Issued N/AOriginal Authorized Cost 318,000.00$ Additional Authorized Cost ---Revised Authorized Cost 318,000.00$
Percentage Increase over Original Authorized Cost N/APercentage Completion 2.56%Original Target Completion Date 12/31/12Revised Target Completion Date 12/31/13
Restrooms - Pennsauken Campus
96

23400 Exhibit F-2k
CAMDEN COUNTY TECHNICAL SCHOOLSCAPITAL PROJECTS FUND
Statement of Project Revenues, Expenditures, Project Balance and Project Status--Budgetary Basis
For the Fiscal Year Ended June 30, 2013
RevisedAuthorized
Prior Years Current Year Totals Cost
Revenues and Other Financing SourcesCounty Improvement Authorization 190,000.00$ 190,000.00$ 190,000.00$
Total Revenues - 190,000.00 190,000.00 190,000.00
Expenditures and Other Financing UsesNon-Instructional Equipment 190,000.00 190,000.00 190,000.00
Total Expenditures - 190,000.00 190,000.00 190,000.00Excess (Deficiency) of Revenues Over
(Under) Expenditures -$ -$ -$ -$
Additional Project Information:Project Number N/AGrant Date N/ABond Authorization Date N/ABonds Authorized N/ABonds Issued N/AOriginal Authorized Cost 190,000.00$ Additional Authorized Cost ---Revised Authorized Cost 190,000.00$
Percentage Increase over Original Authorized Cost N/APercentage Completion 100.00%Original Target Completion Date 06/30/13Revised Target Completion Date 06/30/13
School Bus Purchase
97

PROPRIETARY FUNDS

23400 Exhibit G-1
CAMDEN COUNTY TECHNICAL SCHOOL DISTRICT ENTERPRISE FUNDS
Combining Statement of Net PositionAs of June 30, 2013
Food EarlyService Childhood Total
ASSETS:
Current Assets:Cash and Cash Equivalents 174,422.84$ 174,422.84$ Intergovernmental Accounts Receivable:
State 2,852.98 2,852.98 Federal 145,558.33 145,558.33
Other Accounts Receivable 957.68 957.68 Tuition Receivable 8,038.25$ 8,038.25 Prepaid Expenses 207.00 207.00 Due from Other Funds 6,856.29 6,856.29 Inventories 7,832.87 7,832.87
Total Current Assets 331,624.70 15,101.54 346,726.24
Capital Assets, Net of AccumulatedDepreciation 298,631.00 298,631.00
Total Assets 630,255.70 15,101.54 645,357.24
LIABILITIES:
Current Liabilities:Due to Other Funds 265,592.02 265,592.02 Accounts Payable 47,433.71 3,156.35 50,590.06 Prepaid Meals 967.41 967.41 Unearned Revenue 1,149.23 1,375.00 2,524.23
Total Current Liabilities 315,142.37 4,531.35 319,673.72
NET POSITION:
Net Investment in Capital Assets 298,631.00 298,631.00Unrestricted 16,482.33 10,570.19 27,052.52
Total Net Position 315,113.33$ 10,570.19$ 325,683.52$
99

23400 Exhibit G-2
CAMDEN COUNTY TECHNICAL SCHOOL DISTRICTENTERPRISE FUNDS
Combining Statement of Revenues, Expenses and Changes in Fund Net PositionFor the Fiscal Year Ended June 30, 2013
Food EarlyService Childhood Total
OPERATING REVENUES:Charges for Services: Daily Sales - Reimbursable Programs 237,892.05$ 237,892.05$ Daily Sales - Non-Reimbursable Programs 2,622.59 2,622.59 Miscellaneous 25,880.44 25,880.44 Tuition Fees, Net of Bad Debt Expense of $405.00 87,910.00$ 87,910.00
Total Operating Revenues 266,395.08 87,910.00 354,305.08
OPERATING EXPENSES:Salaries 341,400.90 57,375.37 398,776.27 Employee Benefits 62,321.79 4,389.22 66,711.01 Other Purchased Services 170,119.05 5,075.31 175,194.36 General Supplies 63,372.83 17,059.34 80,432.17 Cost of Sales 498,769.10 498,769.10 Depreciation 21,490.00 21,490.00
Total Operating Expenses 1,157,473.67 83,899.24 1,241,372.91
Operating Income (Loss) (891,078.59) 4,010.76 (887,067.83)
NON-OPERATING REVENUES (EXPENSES):State Sources: State School Lunch Program 13,234.37 13,234.37 Federal Sources:
National School Lunch Program 807,240.83 807,240.83 Food Distribution Program 61,761.11 61,761.11 Loss on Disposal of Capital Assets (1,851.00) (1,851.00)
Total Non-Operating Revenues (Expenses) 880,385.31 - 880,385.31
Income (Loss) before Contributions and Transfers (10,693.28) 4,010.76 (6,682.52)
Transfer In - General Fund 42,297.00 42,297.00
Change in Net Position 31,603.72 4,010.76 35,614.48
Net Position -- July 1 283,509.61 6,559.43 290,069.04
Net Position -- June 30 315,113.33$ 10,570.19$ 325,683.52$
100

23400 Exhibit G-3
CAMDEN COUNTY TECHNICAL SCHOOL DISTRICTENTERPRISE FUNDS
Combining Statement of Cash FlowsFor the Fiscal Year Ended June 30, 2013
Food Early Service Childhood Totals
CASH FLOWS FROM OPERATING ACTIVITIES:Receipts from Customers 266,487.09$ 83,864.50$ 350,351.59$ Payments to Employees (341,400.90) (57,375.37) (398,776.27) Payments for Employee Benefits (62,321.79) (4,389.22) (66,711.01) Payments to Suppliers (474,225.38) (22,099.91) (496,325.29)
Net Cash Provided by (Used for) Operating Activities (611,460.98) - (611,460.98)
CASH FLOWS FROM CAPITAL FINANCING ACTIVITIES: Capital Acquisitions (42,297.00) - (42,297.00)
CASH FLOWS FROM NON-CAPITAL FINANCING ACTIVITIES:State Sources 10,497.21 10,497.21 Federal Sources 741,350.56 741,350.56 Board Contribution 42,297.00 42,297.00
Net Cash Provided by (Used for) Non-Capital Financing Activities 794,144.77 - 794,144.77
CASH FLOWS FROM INVESTING ACTIVITIES:Interest on Investments - - -
Net Increase (Decrease) in Cash and Cash Equivalents 140,386.79 - 140,386.79
Cash and Cash Equivalents -- July 1 34,036.05 - 34,036.05
Cash and Equivalents -- June 30 174,422.84$ -$ 174,422.84$
Reconciliation of Operating Loss to Net Cash Provided (Used) by Operating Activities: Operating Income (Loss) (891,078.59)$ 4,010.76$ (887,067.83)$ Adjustments to Reconcile Operating Income (Loss) to Cash Provided (Used) by Operating Actitivies: Depreciation Expense 21,490.00 21,490.00 Change in Assets and Liabililties: (Increase) Decrease in Accounts Receivable (385.90) (3,770.25) (4,156.15) (Increase) Decrease in Inventory (797.84) (797.84) (Increase) Decrease in Prepaid Expenses 747.35 747.35 (Increase) Decrease in Interfunds 252,375.62 (1,926.74) 250,448.88 Increase (Decrease) in Accounts Payable 6,457.82 1,214.13 7,671.95 Increase (Decrease) in Unearned Revenue 477.91 (275.25) 202.66
Net Cash Provided by (Used for) Operating Activities (611,460.98)$ -$ (611,460.98)$
101

FIDUCIARY FUNDS

23400 Exhibit H-1
CAMDEN COUNTY TECHNICAL SCHOOL DISTRICTFiduciary Funds
Combining Statement of Fiduciary Net PositionAs of June 30, 2013
Trust Funds Agency Funds
Unemployment Private-Compensation Purpose Student
Trust Scholarship Activity Payroll TotalASSETS:
Cash and Cash Equivalents 321,400.49$ 18,239.23$ 149,855.20$ 249,247.29$ 738,742.21$ Due from General Fund 21,000.00 610.69 21,610.69 Due from Unemployment 6,946.52 6,946.52
Total Assets 342,400.49 18,239.23 150,465.89 256,193.81 767,299.42
LIABILITIES:
Payable to State 3,901.50 3,901.50 Payroll Deductions Payable 196,708.17 196,708.17 Flexible Spending 3,334.15 3,334.15 Due to Payroll 6,946.52 6,946.52 Due to General Fund 56,151.49 56,151.49 Due to Student Groups 150,465.89 150,465.89
Total Liabilities 10,848.02 - 150,465.89$ 256,193.81$ 417,507.72
Net Position:
Held in Trust for: Scholarships 18,239.23 18,239.23 Unemployment 331,552.47 331,552.47
Total Net Position 331,552.47$ 18,239.23$ 349,791.70$
103
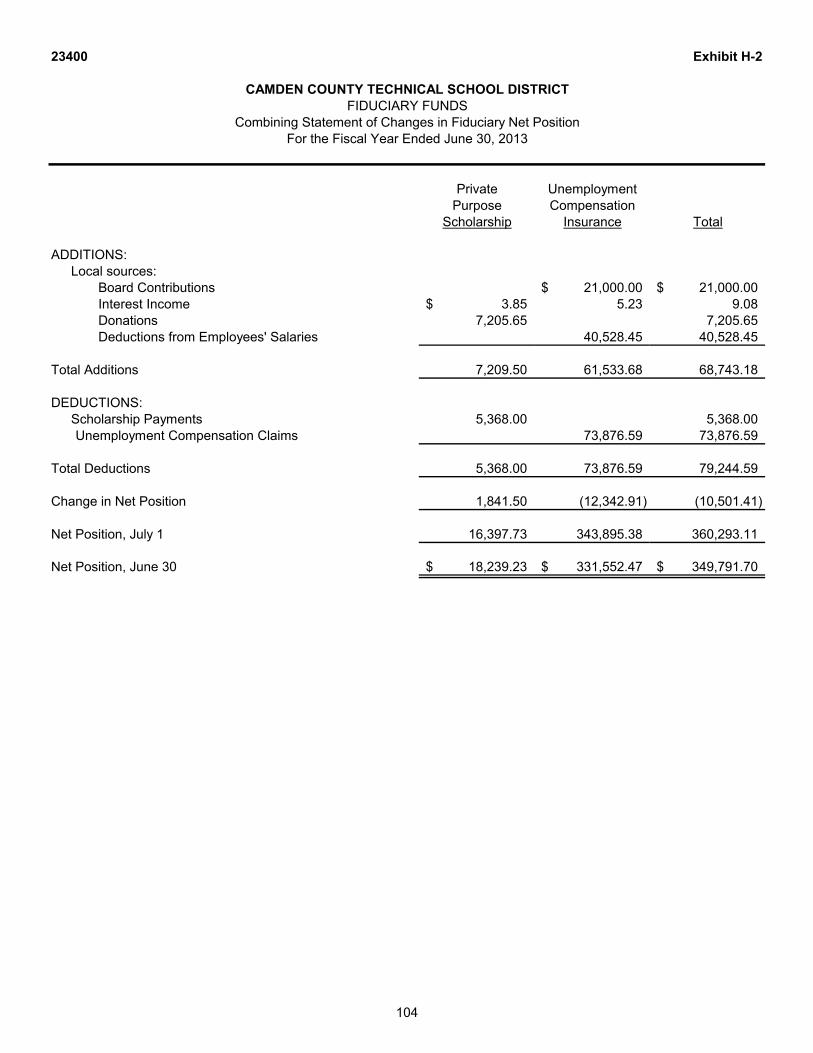
23400 Exhibit H-2
CAMDEN COUNTY TECHNICAL SCHOOL DISTRICTFIDUCIARY FUNDS
Combining Statement of Changes in Fiduciary Net PositionFor the Fiscal Year Ended June 30, 2013
Private UnemploymentPurpose Compensation
Scholarship Insurance Total
ADDITIONS:Local sources:
Board Contributions 21,000.00$ 21,000.00$ Interest Income 3.85$ 5.23 9.08 Donations 7,205.65 7,205.65 Deductions from Employees' Salaries 40,528.45 40,528.45
Total Additions 7,209.50 61,533.68 68,743.18
DEDUCTIONS:Scholarship Payments 5,368.00 5,368.00Unemployment Compensation Claims 73,876.59 73,876.59
Total Deductions 5,368.00 73,876.59 79,244.59
Change in Net Position 1,841.50 (12,342.91) (10,501.41)
Net Position, July 1 16,397.73 343,895.38 360,293.11
Net Position, June 30 18,239.23$ 331,552.47$ 349,791.70$
104

23400 Exhibit H-3
CAMDEN COUNTY TECHNICAL SCHOOL DISTRICTFiduciary Funds
Student Activity Agency Fund Schedule of Receipts and DisbursementsFor the Fiscal Year Ended June 30, 2013
Balance Cash Cash BalanceJune 30, 2012 Receipts Disbursements June 30, 2013
Gloucester Township Campus 52,186.10$ 161,797.31$ 157,287.54$ 56,695.87$
Pennsauken Campus 85,072.67 118,412.36 109,715.01 93,770.02
Total 137,258.77$ 280,209.67$ 267,002.55$ 150,465.89$
105

23400 Exhibit H-4
CAMDEN COUNTY TECHNICAL SCHOOL DISTRICTFiduciary Funds
Payroll Agency Fund Schedule of Receipts and DisbursementsFor the Fiscal Year Ended June 30, 2013
Balance BalanceJune 30, 2012 Additions Deletions June 30, 2013
ASSETS:
Cash and Cash Equivalents 213,142.18$ 27,874,770.74$ 27,838,665.63$ 249,247.29$ Due from Other Funds 4,897.47 45,765.19 40,528.45 10,134.21
Total Assets 218,039.65$ 27,920,535.93$ 27,879,194.08$ 259,381.50$
LIABILITIES:
Payroll Deductions and Withholdings 190,278.56$ 11,571,730.95$ 11,565,301.34$ 196,708.17$ Flexible Spending 1,392.37 17,725.04 15,783.26 3,334.15 Due to Other Funds 26,368.72 756,718.56 723,748.10 59,339.18 Net Payroll 15,574,361.38 15,574,361.38
Total Liabilities 218,039.65$ 27,920,535.93$ 27,879,194.08$ 259,381.50$
106

STATISTICAL SECTION

Financial Trends Information
Financial trends information is intended to assist the user in understanding and assessing how the School District’s financial position has changed over time. Please refer to the following exhibits for a historical view of the School District’s financial performance.

23400
Exh
ibit
J-1
2013
2012
2011
2010
2009
2008
2007
2006
2005
2004
Gove
rnm
enta
l Act
iviti
es:
Net In
vest
ment in
Capita
l Debt
22,0
81,2
34.9
0$
22,2
82,9
87.7
8$
18,0
59,9
05.6
5$
15,9
99,7
65.7
3$
13,3
13,3
10.8
3$
9,3
78,4
61.1
7$
4,9
12,9
59.7
1$
4,7
63,2
34.2
1$
3,7
17,4
47.0
0$
5,1
61,8
25.6
5$
Rest
rict
ed
7,1
21,3
88.2
0
6,2
14,3
82.0
3
4,4
27,0
15.1
6
4,1
90,9
16.2
4
5,4
56,8
79.2
4
5,0
44,5
60.3
5
2,8
51,2
56.5
4
2,5
38,7
27.8
2
3,1
61,6
49.7
2
3,2
57,4
68.5
3
Unre
strict
ed (
Defic
it)1,2
08,4
32.8
4
2,5
39,7
68.0
7
4,0
57,2
32.8
3
4,7
53,9
87.5
7
4,2
80,9
46.1
7
562,2
27.6
3
4,9
70,3
60.0
1
1,3
23,6
82.1
3
3,3
77,5
03.9
8
594,0
44.0
7
Tota
l Gove
rnm
enta
l Act
iviti
es
Net P
osi
tion
30,4
11,0
55.9
4$
31,0
37,1
37.8
8$
26,5
44,1
53.6
4$
24,9
44,6
69.5
4$
23,0
51,1
36.2
4$
14,9
85,2
49.1
5$
12,7
34,5
76.2
6$
8,6
25,6
44.1
6$
10,2
56,6
00.7
0$
9,0
13,3
38.2
5$
Busi
ness
-typ
e A
ctiv
ities:
Net In
vest
ment in
Capita
l Debt
298,6
31.0
0$
279,6
75.0
0$
42,0
27.7
3$
31,6
40.6
6$
26,1
43.0
3$
29,2
26.1
6$
32,3
09.2
9$
33,1
44.9
0$
7,1
54.0
0$
Rest
rict
ed
Unre
strict
ed
27,0
52.5
2
10,3
94.0
4
77,3
39.8
9
102,3
32.8
9
95,8
34.2
4
84,7
60.3
5
66,8
22.6
1
113,0
11.6
1
200,2
99.6
6
209,9
00.7
0$
Tota
l Busi
ness
-typ
e A
ctiv
ities
Net P
osi
tion
325,6
83.5
2$
290,0
69.0
4$
119,3
67.6
2$
133,9
73.5
5$
121,9
77.2
7$
113,9
86.5
1$
99,1
31.9
0$
146,1
56.5
1$
207,4
53.6
6$
209,9
00.7
0$
Dis
tric
t-w
ide:
Net In
vest
ment in
Capita
l Debt
22,3
79,8
65.9
0$
22,5
62,6
62.7
8$
18,1
01,9
33.3
8$
16,0
31,4
06.3
9$
13,3
39,4
53.8
6$
9,4
07,6
87.3
3$
4,9
45,2
69.0
0$
4,7
96,3
79.1
1$
3,7
24,6
01.0
0$
5,1
61,8
25.6
5$
Rest
rict
ed
7,1
21,3
88.2
0
6,2
14,3
82.0
3
4,4
27,0
15.1
6
4,1
90,9
16.2
4
5,4
56,8
79.2
4
5,0
44,5
60.3
5
2,8
51,2
56.5
4
2,5
38,7
27.8
2
3,1
61,6
49.7
2
3,2
57,4
68.5
3
Unre
strict
ed
1,2
35,4
85.3
6
2,5
50,1
62.1
1
4,1
34,5
72.7
2
4,8
56,3
20.4
6
4,3
76,7
80.4
1
646,9
87.9
8
5,0
37,1
82.6
2
1,4
36,6
93.7
4
3,5
77,8
03.6
4
803,9
44.7
7
Tota
l Dis
tric
t-w
ide N
et P
osi
tion
30,7
36,7
39.4
6$
31,3
27,2
06.9
2$
26,6
63,5
21.2
6$
25,0
78,6
43.0
9$
23,1
73,1
13.5
1$
15,0
99,2
35.6
6$
12,8
33,7
08.1
6$
8,7
71,8
00.6
7$
10,4
64,0
54.3
6$
9,2
23,2
38.9
5$
Sourc
e: D
istr
ict R
eco
rds
(Exh
ibit
A-1
)
CA
MD
EN
CO
UN
TY
TE
CH
NIC
AL
SC
HO
OL
DIS
TR
ICT
Net P
osi
tion b
y C
om
ponent
Last
Ten F
isca
l Years
(A
ccru
al B
asi
s of A
ccountin
g)
Unaudite
d
Fis
cal Y
ear
Ended J
une 3
0,
109

23400
Exh
ibit
J-2
2013
2012
2011
2010
2009
2008
2007
2006
2005
2004
Exp
en
ses:
Go
ve
rnm
en
tal A
ctivitie
s:
Inst
ruct
ion:
Regula
r9,2
92,0
98.5
1$
9,3
41,1
60.0
0$
9,7
91,7
26.2
7$
10,2
23,0
79.8
4$
8,9
62,5
66.3
0$
10,8
03,7
00.9
0$
9,8
99,4
10.4
7$
5,9
79,5
52.2
4$
8,7
63,2
70.2
9$
8,7
75,0
60
$
Sp
ecia
l E
du
ca
tio
n33,2
15.1
0
97,9
92.2
5
36,1
64.1
0
35,5
73.0
0
71,0
45.0
0
37,5
76.0
0
9,9
54.0
0
192,6
10.2
1
143,5
07
Oth
er
Sp
ecia
l E
du
ca
tio
n258,6
34.9
3
180,0
26.3
8
175,7
25.8
8
131,8
62.0
0
147,1
61.6
7
89,4
32.9
8
119,2
38.9
2
175,1
35.2
7
166,5
59.2
2
149,7
74
Voca
tional
7,0
55,7
45.5
8
6,4
91,8
24.3
0
5,7
43,3
28.8
8
6,1
69,7
09.2
7
5,2
71,7
08.0
4
2,5
30,7
09.8
3
2,9
68,3
20.9
9
2,6
53,1
61.3
0
2,9
18,4
61.0
0
3,1
68,8
22
Oth
er
Inst
ruct
ion
1,1
63,4
58.2
4
821,9
07.7
2
807,9
25.3
7
910,0
44.9
9
885,6
74.6
7
762,1
55.9
3
674,0
08.3
1
695,0
43.9
1
666,4
26.0
0
656,2
17
Support
Serv
ices:
Stu
dent and Inst
ruct
ion R
ela
ted S
erv
ices
4,2
95,2
44.9
5
4,3
82,1
66.8
8
4,8
24,6
86.4
1
5,1
72,6
82.2
1
4,8
25,5
07.3
6
5,1
02,7
74.3
8
4,8
93,1
79.3
5
2,1
92,4
64.4
0
3,7
72,8
51.2
5
4,0
23,0
75
Sch
oo
l A
dm
inis
tra
tive
Se
rvic
es
2,2
80,5
49.6
3
2,3
02,9
84.4
3
2,2
49,9
63.6
9
2,2
65,5
45.1
2
2,1
42,4
23.2
0
2,1
74,8
30.6
2
2,1
00,8
97.7
9
2,1
06,0
52.4
3
2,0
15,6
55.4
0
2,2
73,1
63
Ge
ne
ral a
nd
Bu
sin
ess A
dm
inis
tra
tive
Se
rvic
es
4,5
41,4
08.4
6
3,1
50,8
19.0
4
2,7
35,6
98.7
3
2,9
08,0
85.9
7
2,6
27,3
72.3
7
2,3
74,0
25.5
4
2,2
36,9
37.6
8
1,9
55,3
06.0
8
2,0
17,2
10.4
9
2,4
06,4
98
Pla
nt O
pera
tions
and M
ain
tenance
5,5
70,9
75.6
4
5,3
51,6
72.1
0
5,3
71,5
74.6
5
5,1
84,2
82.0
1
6,0
72,7
34.2
7
5,6
62,6
21.1
0
4,9
98,4
88.9
7
5,2
20,2
11.8
9
5,0
23,4
22.9
6
4,9
56,2
74
Pu
pil
Tra
nsp
ort
atio
n464,0
42.7
6
426,8
00.1
1
348,6
56.7
2
290,5
05.7
0
302,6
25.2
4
313,2
30.2
5
232,6
62.8
7
249,0
91.0
9
243,3
11.5
1
226,3
37
Un
allo
ca
ted
Be
ne
fits
11,4
25,1
71.8
9
10,5
46,2
11.3
6
10,3
78,6
35.3
2
9,6
75,8
37.2
5
8,6
81,3
78.3
7
9,2
48,7
08.5
7
8,9
32,8
52.2
0
7,5
09,2
10.5
8
7,4
19,4
94.5
1
6,9
61,1
69
Sp
ecia
l S
ch
oo
ls21,2
34.9
0
157,1
51.2
7
1,8
84,2
61.4
8
2,0
81,9
59.4
0
1,9
32,4
42.1
8
2,2
50,8
13.5
3
2,0
91,0
57.7
5
2,0
99,9
77.2
6
2,2
70,9
82.1
4
2,1
59,3
84
Ca
pita
l O
utla
y245,6
06.0
5
64,3
48.3
7
316,5
76.3
0
851,1
50.3
0
(1,7
62,0
04.1
2)
(700,3
32)
Un
allo
ca
ted
De
pre
cia
tio
n282,5
69.0
0
665,5
55.2
5
670,9
90.7
8
To
tal G
ove
rnm
en
tal A
ctivitie
s E
xp
en
se
s46,6
47,3
86.6
4
43,2
50,7
15.8
4
44,3
48,3
47.5
0
45,1
13,5
15.1
3
41,9
22,6
38.6
7
41,6
67,1
55.9
4
40,2
90,7
28.6
0
29,7
38,7
57.5
8
36,1
41,2
45.7
6
35,1
98,9
46.3
2
Bu
sin
ess-t
yp
e A
ctivitie
s:
Fo
od
Se
rvic
e1,1
57,4
73.6
7
1,2
33,9
33.8
5
1,0
86,3
40.4
8
1,0
67,3
28.6
6
1,0
50,7
24.4
8
1,1
70,5
89.1
6
1,2
09,2
73.8
6
1,4
22,2
38.6
2
1,2
20,9
25.0
0
1,1
91,0
22.1
5
Oth
er
83,8
99.2
4
74,9
65.8
0
98,0
07.1
7
178,5
18.0
7
272,2
79.5
5
324,3
26.8
8
416,4
72.2
6
524,1
44.3
8
552,0
26.4
9
416,9
32.7
1
To
tal B
usin
ess-t
yp
e A
ctivitie
s E
xp
en
se
1,2
41,3
72.9
1
1,3
08,8
99.6
5
1,1
84,3
47.6
5
1,2
45,8
46.7
3
1,3
23,0
04.0
3
1,4
94,9
16.0
4
1,6
25,7
46.1
2
1,9
46,3
83.0
0
1,7
72,9
51.4
9
1,6
07,9
54.8
6
To
tal D
istr
ict
Exp
en
se
s47,8
88,7
59.5
5$
44,5
59,6
15.4
9$
45,5
32,6
95.1
5$
46,3
59,3
61.8
6$
43,2
45,6
42.7
0$
43,1
62,0
71.9
8$
41,9
16,4
74.7
2$
31,6
85,1
40.5
8$
37,9
14,1
97.2
5$
36,8
06,9
01.1
8$
(Contin
ued)
CA
MD
EN
CO
UN
TY
TE
CH
NIC
AL
SC
HO
OL
DIS
TR
ICT
Changes
in N
et P
osi
tion
Last
Ten F
isca
l Years
(A
ccru
al B
asi
s of A
ccountin
g)
Unaudite
d
Fis
cal Y
ear
Ended J
une 3
0,
110

23400
Exh
ibit
J-2
2013
2012
2011
2010
2009
2008
2007
2006
2005
2004
CA
MD
EN
CO
UN
TY
TE
CH
NIC
AL
SC
HO
OL
DIS
TR
ICT
Changes
in N
et P
osi
tion
Last
Ten F
isca
l Years
(A
ccru
al B
asi
s of A
ccountin
g)
Unaudite
d
Fis
cal Y
ear
Ended J
une 3
0,
Pro
gra
m R
even
ues:
Go
ve
rnm
en
tal A
ctivitie
s:
Charg
es
for
Serv
ices:
Inst
ruct
ion
3,7
48,1
88.6
7$
3,7
71,2
78.8
7$
5,7
62,7
00.0
0$
4,6
67,5
00.0
0$
4,6
60,0
00.0
0$
4,6
35,7
50.0
0$
Voca
tional
2,4
60,7
11.3
3
2,3
44,8
21.1
3
928,0
14.3
9$
964,5
10.3
1$
61,0
91.0
0$
Sp
ecia
l S
ch
oo
ls415.0
0
1,4
41.8
4
884,2
19.4
5
1,0
27,4
56.0
7
839,5
18.0
8
1,1
68,0
43.2
1
1,1
15,5
40.3
4$
982,3
11
Opera
ting G
rants
and C
ontr
ibutio
ns
5,8
39,5
33.9
7
5,8
16,0
60.5
6
6,5
74,1
41.5
9
6,9
68,3
62.2
9
6,3
17,1
16.5
9
10,2
03,6
85.1
3
9,0
10,0
34.2
5
7,6
44,2
18.2
1
7,8
35,8
19.2
8
7,8
54,0
63.0
6
Capita
l Gra
nts
and C
ontr
ibutio
ns:
Inst
ruct
ion
58,0
03.2
6
Voca
tional
146,9
11.3
3
155,2
95.8
1
284,3
40.2
0
1,0
14,6
12.5
1
341,7
44.6
4
344,5
51.0
9
182,3
15.3
3
133,2
59.0
1
134,2
56.0
6
163,7
20.4
5
To
tal G
ove
rnm
en
tal A
ctivitie
s P
rog
ram
Re
ve
nu
es
12,1
95,7
60.3
0
12,0
88,8
98.2
1
7,7
42,7
01.2
4
9,0
10,4
30.8
7
7,4
98,3
79.3
1
11,7
16,2
79.4
3
10,3
07,8
89.9
2
8,7
05,4
91.6
1
8,9
34,5
85.6
5
9,1
19,1
88.5
1
Bu
sin
ess-t
yp
e a
ctivitie
s:
Charg
es
for
serv
ices
Fo
od
Se
rvic
e266,3
95.0
8
269,8
76.6
2
284,0
41.2
5
277,7
08.1
9
285,5
90.8
4
319,0
62.4
5
331,0
18.8
7
273,5
35.5
2
259,2
49.9
9
261,2
04.1
0
Oth
er
87,9
10.0
0
77,7
79.5
0
77,5
59.5
0
42,6
71.9
9
188,2
70.7
4
252,0
78.8
0
337,8
13.1
9
399,6
49.1
2
488,9
18.7
5
395,2
11.1
3
Opera
ting G
rants
and C
ontr
ibutio
ns
882,2
36.3
1882,0
44.6
8798,2
74.0
2785,5
49.2
0688,5
33.4
6619,2
12.2
9556,9
18.4
4509,9
32.1
3393,3
00.1
7375,5
59.6
9
To
tal B
usin
ess-t
yp
e A
ctivitie
s P
rog
ram
Re
ve
nu
es
1,2
36,5
41.3
9
1,2
29,7
00.8
0
1,1
59,8
74.7
7
1,1
05,9
29.3
8
1,1
62,3
95.0
4
1,1
90,3
53.5
4
1,2
25,7
50.5
0
1,1
83,1
16.7
7
1,1
41,4
68.9
1
1,0
31,9
74.9
2
To
tal D
istr
ict
Pro
gra
m R
eve
nu
es
13,4
32,3
01.6
9$
13,3
18,5
99.0
1$
8,9
02,5
76.0
1$
10,1
16,3
60.2
5$
8,6
60,7
74.3
5$
12,9
06,6
32.9
7$
11,5
33,6
40.4
2$
9,8
88,6
08.3
8$
10,0
76,0
54.5
6$
10,1
51,1
63.4
3$
Net
(Exp
en
se)/
Reven
ue:
Go
ve
rnm
en
tal A
ctivitie
s(3
4,4
51,6
26.3
4)
$(3
1,1
61,8
17.6
3)
$(3
6,6
05,6
46.2
6)
$(3
6,1
03,0
84.2
6)
$(3
4,4
24,2
59.3
6)
$(2
9,9
50,8
76.5
1)
$(2
9,9
82,8
38.6
8)
$(2
1,0
33,2
65.9
7)
$(2
7,2
06,6
60.1
1)
$(2
6,0
79,7
57.8
1)
$
Bu
sin
ess-t
yp
e A
ctivitie
s(4
,831.5
2)
(79,1
98.8
5)
(24,4
72.8
8)
(139,9
17.3
5)
(160,6
08.9
9)
(304,5
62.5
0)
(399,9
95.6
2)
(763,2
66.2
3)
(631,4
82.5
8)
(575,9
79.9
4)
To
tal D
istr
ict-
wid
e N
et
Exp
en
se
(34,4
56,4
57.8
6)
$(3
1,2
41,0
16.4
8)
$(3
6,6
30,1
19.1
4)
$(3
6,2
43,0
01.6
1)
$(3
4,5
84,8
68.3
5)
$(3
0,2
55,4
39.0
1)
$(3
0,3
82,8
34.3
0)
$(2
1,7
96,5
32.2
0)
$(2
7,8
38,1
42.6
9)
$(2
6,6
55,7
37.7
5)
$
(Contin
ued)
111
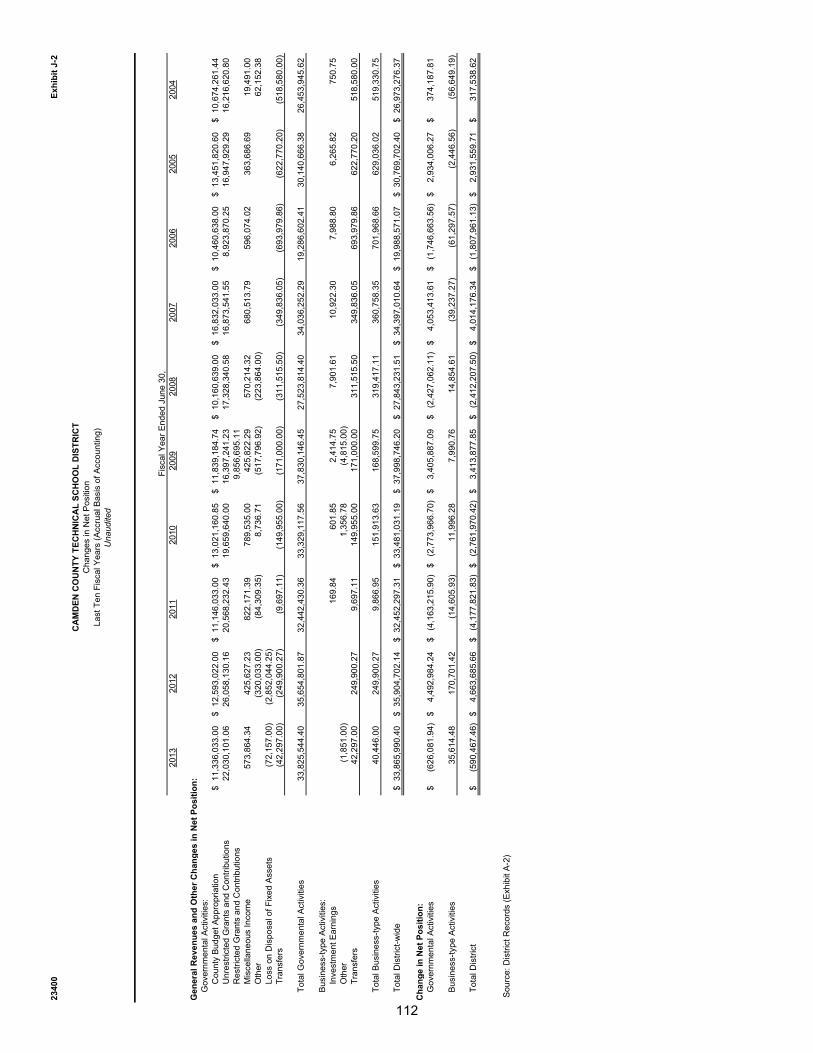
23400
Exh
ibit
J-2
2013
2012
2011
2010
2009
2008
2007
2006
2005
2004
CA
MD
EN
CO
UN
TY
TE
CH
NIC
AL
SC
HO
OL
DIS
TR
ICT
Changes
in N
et P
osi
tion
Last
Ten F
isca
l Years
(A
ccru
al B
asi
s of A
ccountin
g)
Unaudite
d
Fis
cal Y
ear
Ended J
une 3
0,
Gen
era
l R
even
ues a
nd
Oth
er
Ch
an
ges in
Net
Po
sit
ion
:G
ove
rnm
en
tal A
ctivitie
s:
County
Budget A
ppro
priatio
n11,3
36,0
33.0
0$
12,5
93,0
22.0
0$
11,1
46,0
33.0
0$
13,0
21,1
60.8
5$
11,8
39,1
84.7
4$
10,1
60,6
39.0
0$
16,8
32,0
33.0
0$
10,4
60,6
38.0
0$
13,4
51,8
20.6
0$
10,6
74,2
61.4
4$
Unre
strict
ed G
rants
and C
ontr
ibutio
ns
22,0
30,1
01.0
626,0
58,1
30.1
620,5
68,2
32.4
319,6
59,6
40.0
016,3
97,2
41.2
3
17,3
28,3
40.5
8
16,8
73,5
41.5
5
8,9
23,8
70.2
5
16,9
47,9
29.2
9
16,2
16,6
20.8
0
Rest
rict
ed G
rants
and C
ontr
ibutio
ns
9,8
56,6
95.1
1
Mis
cella
neous
Inco
me
573,8
64.3
4
425,6
27.2
3
822,1
71.3
9
789,5
35.0
0
425,8
22.2
9
570,2
14.3
2
680,5
13.7
9
596,0
74.0
2
363,6
86.6
9
19,4
91.0
0
Oth
er
(320,0
33.0
0)
(84,3
09.3
5)
8,7
36.7
1
(517,7
96.9
2)
(223,8
64.0
0)
62,1
52.3
8
Lo
ss o
n D
isp
osa
l o
f F
ixe
d A
sse
ts(7
2,1
57.0
0)
(2,8
52,0
44.2
5)
Tra
nsf
ers
(42,2
97.0
0)
(249,9
00.2
7)
(9,6
97.1
1)
(149,9
55.0
0)
(171,0
00.0
0)
(311,5
15.5
0)
(349,8
36.0
5)
(693,9
79.8
6)
(622,7
70.2
0)
(518,5
80.0
0)
To
tal G
ove
rnm
en
tal A
ctivitie
s33,8
25,5
44.4
0
35,6
54,8
01.8
7
32,4
42,4
30.3
6
33,3
29,1
17.5
6
37,8
30,1
46.4
5
27,5
23,8
14.4
0
34,0
36,2
52.2
9
19,2
86,6
02.4
1
30,1
40,6
66.3
8
26,4
53,9
45.6
2
Bu
sin
ess-t
yp
e A
ctivitie
s:
Inve
stm
ent E
arn
ings
169.8
4
601.8
5
2,4
14.7
5
7,9
01.6
1
10,9
22.3
0
7,9
88.8
0
6,2
65.8
2
750.7
5
Oth
er
(1,8
51.0
0)
1,3
56.7
8
(4,8
15.0
0)
Tra
nsf
ers
42,2
97.0
0
249,9
00.2
7
9,6
97.1
1
149,9
55.0
0
171,0
00.0
0
311,5
15.5
0
349,8
36.0
5
693,9
79.8
6
622,7
70.2
0
518,5
80.0
0
To
tal B
usin
ess-t
yp
e A
ctivitie
s40,4
46.0
0
249,9
00.2
7
9,8
66.9
5
151,9
13.6
3
168,5
99.7
5
319,4
17.1
1
360,7
58.3
5
701,9
68.6
6
629,0
36.0
2
519,3
30.7
5
To
tal D
istr
ict-
wid
e33,8
65,9
90.4
0$
35,9
04,7
02.1
4$
32,4
52,2
97.3
1$
33,4
81,0
31.1
9$
37,9
98,7
46.2
0$
27,8
43,2
31.5
1$
34,3
97,0
10.6
4$
19,9
88,5
71.0
7$
30,7
69,7
02.4
0$
26,9
73,2
76.3
7$
Ch
an
ge in
Net
Po
sit
ion
:G
ove
rnm
en
tal A
ctivitie
s(6
26,0
81.9
4)
$
4,4
92,9
84.2
4$
(4,1
63,2
15.9
0)
$
(2,7
73,9
66.7
0)
$
3,4
05,8
87.0
9$
(2,4
27,0
62.1
1)
$
4,0
53,4
13.6
1$
(1,7
46,6
63.5
6)
$
2,9
34,0
06.2
7$
374,1
87.8
1$
Bu
sin
ess-t
yp
e A
ctivitie
s35,6
14.4
8
170,7
01.4
2
(14,6
05.9
3)
11,9
96.2
8
7,9
90.7
6
14,8
54.6
1
(39,2
37.2
7)
(61,2
97.5
7)
(2,4
46.5
6)
(56,6
49.1
9)
To
tal D
istr
ict
(590,4
67.4
6)
$
4,6
63,6
85.6
6$
(4,1
77,8
21.8
3)
$
(2,7
61,9
70.4
2)
$
3,4
13,8
77.8
5$
(2,4
12,2
07.5
0)
$
4,0
14,1
76.3
4$
(1,8
07,9
61.1
3)
$
2,9
31,5
59.7
1$
317,5
38.6
2$
So
urc
e:
Dis
tric
t R
eco
rds (
Exh
ibit A
-2)
112

23400
Exh
ibit
J-3
2013
2012
2011
2010
2009
2008
2007
2006
2005
2004
Genera
l Fund:
Rest
rict
ed:
Exc
ess
Surp
lus
4,1
24,3
99.3
2$
4,2
80,7
09.2
1$
4,4
27,0
14.1
6$
3,7
90,9
15.2
4$
5,0
56,8
78.2
4$
4,0
44,5
59.3
5$
2,8
51,2
55.5
4$
2,5
38,7
26.8
2$
2,9
20,1
87.2
8$
3,0
43,1
16.3
1$
Capita
l Rese
rve A
ccount
621,6
08.6
7
21,6
08.6
7
1.0
0
400,0
01.0
0
400,0
01.0
0
1,0
00,0
01.0
0
1.0
0
1.0
0
1.0
0
1.0
0
Ass
igned:
Oth
er
Purp
ose
s110,8
60.5
6
489,1
98.7
3
155,6
26.4
2
852,6
15.9
1
1,3
20,2
62.1
7
109,2
63.9
4
117,1
70.9
6
55,7
94.0
0
71,6
21.9
0
372,3
43.8
3
Subse
quent Y
ear's
Exp
enditu
re645,2
29.6
2
936,8
87.1
7
2,2
67,1
29.6
7
1,9
42,9
55.0
9
Unass
igned
2,4
03,5
56.1
42,3
19,5
03.1
9317,2
99.1
669,1
46.2
21,5
00,4
81.9
7
1,6
33,0
24.9
6
4,0
97,0
80.8
8
2,0
58,0
47.9
5
2,3
99,8
56.0
0
1,4
25,1
19.0
1
Tota
l Genera
l Fund
7,9
05,6
54.3
1$
8,0
47,9
06.9
7$
7,1
67,0
70.4
1$
7,0
55,6
33.4
6$
8,2
77,6
23.3
8$
6,7
86,8
49.2
5$
7,0
65,5
08.3
8$
4,6
52,5
69.7
7$
5,3
91,6
66.1
8$
4,8
40,5
80.1
5$
All
Oth
er
Gove
rnm
enta
l Funds:
Rest
rict
ed:
Capita
l Pro
ject
s F
und
1,6
19,2
90.0
3$
1,9
12,0
64.1
5$
2,6
21,7
06.6
5$
3,1
49,9
60.0
4$
2,5
83,5
76.8
4$
3,2
84,6
29.4
9$
4,0
86,8
53.6
1$
294,4
65.2
4$
2,2
22,9
90.4
0$
214,3
51.2
2$
Tota
l All
Funds
9,5
24,9
44.3
4$
9,9
59,9
71.1
2$
9,7
88,7
77.0
6$
10,2
05,5
93.5
0$
10,8
61,2
00.2
2$
10,0
71,4
78.7
4$
11,1
52,3
61.9
9$
4,9
47,0
35.0
1$
7,6
14,6
56.5
8$
5,0
54,9
31.3
7$
Sourc
e: D
istr
ict R
eco
rds
(Exh
ibit
B-1
)
CA
MD
EN
CO
UN
TY
TE
CH
NIC
AL
SC
HO
OL
DIS
TR
ICT
Fund B
ala
nce
s, G
ove
rnm
enta
l Funds
Last
Ten F
isca
l Years
(M
odifi
ed A
ccru
al B
asi
s of A
ccountin
g)
Unaudite
d Fis
cal Y
ear
Ended J
une 3
0,
113
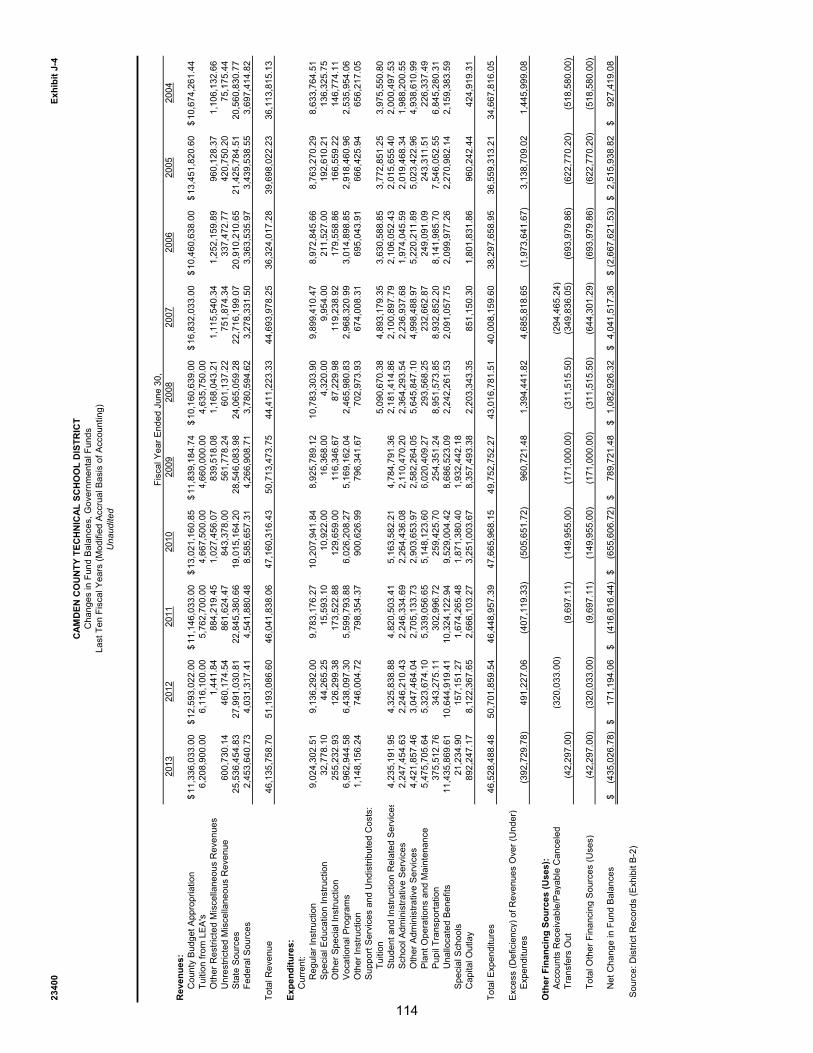
23
40
0E
xh
ibit
J-4
20
13
20
12
20
11
20
10
20
09
20
08
20
07
20
06
20
05
20
04
Re
ve
nu
es
:C
ou
nty
Bu
dg
et
Ap
pro
pri
atio
n1
1,3
36
,03
3.0
0$
12
,59
3,0
22
.00
$1
1,1
46
,03
3.0
0$
13
,02
1,1
60
.85
$1
1,8
39
,18
4.7
4$
10
,16
0,6
39
.00
$1
6,8
32
,03
3.0
0$
10
,46
0,6
38
.00
$1
3,4
51
,82
0.6
0$
10
,67
4,2
61
.44
$T
uitio
n f
rom
LE
A's
6,2
08
,90
0.0
06
,11
6,1
00
.00
5,7
62
,70
0.0
04
,66
7,5
00
.00
4,6
60
,00
0.0
0
4
,63
5,7
50
.00
Oth
er
Re
str
icte
d M
isce
llan
eo
us R
eve
nu
es
1,4
41
.84
88
4,2
19
.45
1,0
27
,45
6.0
78
39
,51
8.0
8
1
,16
8,0
43
.21
1,1
15
,54
0.3
4
1
,25
2,1
59
.89
96
0,1
28
.37
1,1
06
,13
2.6
6
U
nre
str
icte
d M
isce
llan
eo
us R
eve
nu
e6
00
,73
0.1
44
60
,17
4.5
48
61
,62
4.4
78
43
,37
8.0
05
61
,77
8.2
4
6
01
,13
7.2
2
7
51
,87
4.3
4
3
37
,47
2.7
7
4
20
,75
0.2
0
7
5,1
75
.44
S
tate
So
urc
es
25
,53
6,4
54
.83
27
,99
1,0
30
.81
22
,84
5,3
80
.66
19
,01
5,1
64
.20
28
,54
6,0
83
.98
2
4,0
65
,05
9.2
8
22
,71
6,1
99
.07
2
0,9
10
,21
0.6
5
21
,42
5,7
84
.51
2
0,5
60
,83
0.7
7
Fe
de
ral S
ou
rce
s2
,45
3,6
40
.73
4,0
31
,31
7.4
14
,54
1,8
80
.48
8,5
85
,65
7.3
14
,26
6,9
08
.71
3,7
80
,59
4.6
2
3
,27
8,3
31
.50
3,3
63
,53
5.9
7
3
,43
9,5
38
.55
3,6
97
,41
4.8
2
To
tal R
eve
nu
e4
6,1
35
,75
8.7
0
51
,19
3,0
86
.60
4
6,0
41
,83
8.0
6
47
,16
0,3
16
.43
5
0,7
13
,47
3.7
5
44
,41
1,2
23
.33
4
4,6
93
,97
8.2
5
36
,32
4,0
17
.28
3
9,6
98
,02
2.2
3
36
,11
3,8
15
.13
Ex
pe
nd
itu
res
:C
urr
en
t:R
eg
ula
r In
str
uctio
n9
,02
4,3
02
.51
9,1
36
,29
2.0
09
,78
3,1
76
.27
10
,20
7,9
41
.84
8,9
25
,78
9.1
2
1
0,7
83
,30
3.9
0
9,8
99
,41
0.4
7
8
,97
2,8
45
.66
8,7
63
,27
0.2
9
8
,63
3,7
64
.51
Sp
ecia
l E
du
ca
tio
n I
nstr
uctio
n3
2,7
78
.10
44
,26
5.2
51
5,5
93
.10
10
,92
2.0
01
6,3
68
.00
4
,32
0.0
0
9
,95
4.0
0
2
11
,52
7.0
0
1
92
,61
0.2
1
1
36
,32
5.7
5
O
the
r S
pe
cia
l In
str
uctio
n2
55
,23
2.9
31
26
,29
9.3
81
73
,52
2.8
81
29
,65
9.0
01
16
,34
6.6
7
8
7,2
29
.98
1
19
,23
8.9
2
1
79
,55
8.8
6
1
66
,55
9.2
2
1
46
,77
4.1
1
V
oca
tio
na
l P
rog
ram
s6
,96
2,9
44
.58
6,4
38
,09
7.3
05
,59
9,7
93
.88
6,0
26
,20
8.2
75
,16
9,1
62
.04
2,4
65
,98
0.8
3
2
,96
8,3
20
.99
3,0
14
,89
8.8
5
2
,91
8,4
60
.96
2,5
35
,95
4.0
6
O
the
r In
str
uctio
n1
,14
8,1
56
.24
74
6,0
04
.72
79
8,3
54
.37
90
0,6
26
.99
79
6,3
41
.67
70
2,9
73
.93
67
4,0
08
.31
69
5,0
43
.91
66
6,4
25
.94
65
6,2
17
.05
Su
pp
ort
Se
rvic
es a
nd
Un
dis
trib
ute
d C
osts
:
Stu
de
nt
an
d I
nstr
uctio
n R
ela
ted
Se
rvic
es
Tu
itio
n
5,0
90
,67
0.3
8
4
,89
3,1
79
.35
3,6
30
,58
8.8
5
3
,77
2,8
51
.25
3,9
75
,55
0.8
0
Sch
oo
l A
dm
inis
tra
tive
Se
rvic
es
Stu
de
nt
an
d I
nstr
uctio
n R
ela
ted
Se
rvic
es
4,2
35
,19
1.9
54
,32
5,8
38
.88
4,8
20
,50
3.4
15
,16
3,5
82
.21
4,7
84
,79
1.3
6
2
,18
1,4
14
.86
2,1
00
,89
7.7
9
2
,10
6,0
52
.43
2,0
15
,65
5.4
0
2
,00
0,4
97
.53
O
the
r A
dm
inis
tra
tive
Se
rvic
es
Sch
oo
l A
dm
inis
tra
tive
Se
rvic
es
2,2
47
,45
4.6
32
,24
6,2
10
.43
2,2
46
,33
4.6
92
,26
4,4
36
.08
2,1
10
,47
0.2
0
2
,36
4,2
93
.54
2,2
36
,93
7.6
8
1
,97
4,0
45
.59
2,0
19
,46
8.3
4
1
,98
8,2
00
.55
P
lan
t O
pe
ratio
ns a
nd
Ma
inte
na
nce
Oth
er
Ad
min
istr
ative
Se
rvic
es
4,4
21
,85
7.4
63
,04
7,4
64
.04
2,7
05
,13
3.7
32
,90
3,6
53
.97
2,5
82
,26
4.0
5
5
,64
5,8
47
.10
4,9
98
,48
8.9
7
5
,22
0,2
11
.89
5,0
23
,42
2.9
6
4
,93
8,6
10
.99
P
up
il T
ran
sp
ort
atio
nP
lan
t O
pe
ratio
ns a
nd
Ma
inte
na
nce
5,4
75
,70
5.6
45
,32
3,6
74
.10
5,3
39
,05
6.6
55
,14
8,1
23
.60
6,0
20
,40
9.2
7
2
93
,56
8.2
5
2
32
,66
2.8
7
2
49
,09
1.0
9
2
43
,31
1.5
1
2
26
,33
7.4
9
Un
allo
ca
ted
Be
ne
fits
Pu
pil
Tra
nsp
ort
atio
n3
75
,51
2.7
63
43
,27
5.1
13
02
,99
6.7
22
59
,42
5.7
02
54
,35
1.2
4
8
,95
1,5
73
.85
8,9
32
,85
2.2
0
8
,14
1,9
85
.70
7,5
46
,05
2.5
5
6
,84
5,2
80
.31
Un
allo
ca
ted
Be
ne
fits
11
,43
5,8
69
.61
10
,64
4,9
19
.41
10
,32
4,1
22
.94
9,5
29
,00
4.4
28
,68
6,5
23
.09
2,2
42
,26
1.5
3
2
,09
1,0
57
.75
2,0
99
,97
7.2
6
2
,27
0,9
82
.14
2,1
59
,38
3.5
9
S
pe
cia
l S
ch
oo
ls2
1,2
34
.90
15
7,1
51
.27
1,6
74
,26
5.4
81
,87
1,3
80
.40
1,9
32
,44
2.1
8
C
ap
ita
l O
utla
y8
92
,24
7.1
78
,12
2,3
67
.65
2,6
66
,10
3.2
73
,25
1,0
03
.67
8,3
57
,49
3.3
8
2
,20
3,3
43
.35
85
1,1
50
.30
1,8
01
,83
1.8
6
9
60
,24
2.4
4
4
24
,91
9.3
1
To
tal E
xp
en
ditu
res
46
,52
8,4
88
.48
5
0,7
01
,85
9.5
4
46
,44
8,9
57
.39
4
7,6
65
,96
8.1
5
49
,75
2,7
52
.27
4
3,0
16
,78
1.5
1
40
,00
8,1
59
.60
3
8,2
97
,65
8.9
5
36
,55
9,3
13
.21
3
4,6
67
,81
6.0
5
Exce
ss (
De
ficie
ncy)
of
Re
ve
nu
es O
ve
r (U
nd
er)
Exp
en
ditu
res
(39
2,7
29
.78
)
49
1,2
27
.06
(40
7,1
19
.33
)
(50
5,6
51
.72
)
96
0,7
21
.48
1,3
94
,44
1.8
2
4
,68
5,8
18
.65
(1,9
73
,64
1.6
7)
3,1
38
,70
9.0
2
1
,44
5,9
99
.08
Oth
er
Fin
an
cin
g S
ou
rce
s (
Us
es
):A
cco
un
ts R
ece
iva
ble
/Pa
ya
ble
Ca
nce
led
(32
0,0
33
.00
)
(29
4,4
65
.24
)
Tra
nsfe
rs O
ut
(42
,29
7.0
0)
(9,6
97
.11
)(1
49
,95
5.0
0)
(17
1,0
00
.00
)
(31
1,5
15
.50
)
(34
9,8
36
.05
)
(69
3,9
79
.86
)
(62
2,7
70
.20
)
(51
8,5
80
.00
)
To
tal O
the
r F
ina
ncin
g S
ou
rce
s (
Use
s)
(42
,29
7.0
0)
(32
0,0
33
.00
)
(9,6
97
.11
)
(14
9,9
55
.00
)
(17
1,0
00
.00
)
(31
1,5
15
.50
)
(64
4,3
01
.29
)
(69
3,9
79
.86
)
(62
2,7
70
.20
)
(51
8,5
80
.00
)
Ne
t C
ha
ng
e in
Fu
nd
Ba
lan
ce
s(4
35
,02
6.7
8)
$
1
71
,19
4.0
6$
(4
16
,81
6.4
4)
$
(6
55
,60
6.7
2)
$
7
89
,72
1.4
8$
1
,08
2,9
26
.32
$
4,0
41
,51
7.3
6$
(2
,66
7,6
21
.53
)$
2
,51
5,9
38
.82
$
92
7,4
19
.08
$
So
urc
e:
Dis
tric
t R
eco
rds (
Exh
ibit B
-2)
CA
MD
EN
CO
UN
TY
TE
CH
NIC
AL
SC
HO
OL
DIS
TR
ICT
Ch
an
ge
s in
Fu
nd
Ba
lan
ce
s,
Go
ve
rnm
en
tal F
un
ds
La
st
Te
n F
isca
l Y
ea
rs (
Mo
difie
d A
ccru
al B
asis
of
Acco
un
tin
g)
Un
au
dite
d
Fis
ca
l Y
ea
r E
nd
ed
Ju
ne
30
,
114

23
40
0E
xh
ibit
J-5
Ge
ne
ral F
un
d O
the
r L
oca
l R
eve
nu
e b
y S
ou
rce
La
st
Te
n F
isca
l Y
ea
rsU
na
ud
ite
d
***
***
Fis
ca
l Y
ea
rS
ale
s,
Re
fun
d o
fR
en
tal
Te
ch
nic
al
En
de
dIn
tere
st o
nR
eim
bu
rse
me
nts
Prio
r Y
ea
ro
fT
ech
Inst
itute
E
rate
Ba
ke
Sh
op
Fa
st
Fo
od
Sch
ool T
uiti
on
Ju
ne
30
,In
ve
stm
en
tsa
nd
Mis
ce
llan
eo
us
Exp
enditu
res
Fa
cilit
ies
Se
rvic
es
Re
imb
urs
em
en
tS
ale
sS
ale
sa
nd
Bo
oks
Tota
l
20
13
62
1.2
3$
27
8,5
03
.21
$
73
,42
8.4
2$
61
,70
5.0
0$
13
0,7
76
.45
$
1,0
90
.10
$
28
,15
4.9
3$
5
74
,27
9.3
4$
20
12
14
9,3
06
.00
84
,37
2.2
3
1,4
41
.84
$
12
9,3
14
.46
92
0.0
0
25
,45
8.0
4
36
,25
6.5
0$
42
7,0
69
.07
20
11
4,8
59
.35
21
6,4
57
.93
11
7,2
97
.25
30
7,1
13
.96
14
2,7
81
.56
6,4
29
.50
27
,23
1.8
4
88
4,2
19
.45
1,7
06
,39
0.8
4
20
10
12
,04
9.7
1
23
5,2
06
.38
35
,59
1.3
0
39
8,7
07
.05
96
,38
6.9
4
85
1.5
0
22
,79
1.9
4
1,0
27
,45
6.0
71
,82
9,0
40
.89
2
00
93
6,1
51
.07
2
15
,27
6.5
1
39
,06
1.7
2
17
,24
4.0
7
12
1,7
01
.42
73
8.0
0
31
,80
0.5
7
83
9,5
18
.08
1,3
01
,49
1.4
4
20
08
13
8,6
12
.97
25
4,9
75
.87
47
,52
3.2
7
3,9
96
.84
85
,07
1.1
1
4,7
03
.50
35
,33
0.7
6
1,1
68
,04
3.2
11
,73
8,2
57
.53
2
00
72
68
,94
4.8
76
0,1
82
.40
74
,55
1.9
7
6,6
75
.14
13
4,3
08
.45
4,5
74
.00
1,1
15
,54
0.3
41
,66
4,7
77
.17
2
00
62
01
,08
6.9
61
53
,00
3.3
0
75
,26
7.3
6
39
,20
6.5
1
42
,16
5.0
9
1,0
13
,35
9.2
21
,52
4,0
88
.44
2
00
56
7,0
98
17
3,6
43
12
2,9
46
12
,95
3
44
,45
1
90
7,1
06
1,3
28
,19
7
20
04
19
,49
1
71
,56
0
12
,69
3
9,2
21
51
,87
0
98
2,3
11
1,1
47
,14
6
***
Cla
ssific
atio
ns d
elin
ea
ted
in
fis
ca
l ye
ar
20
07
fo
r re
po
rtin
g p
urp
ose
s,
am
ou
nts
we
re in
clu
de
d in
Sa
les,
Re
imb
urs
em
en
ts a
nd
Mis
ce
llan
eo
us in
20
06
an
d p
rio
r
So
urc
e:
Sch
oo
l D
istr
ict
Re
co
rds
CA
MD
EN
CO
UN
TY
TE
CH
NIC
AL
SC
HO
OL
DIS
TR
ICT
115

Revenue Capacity
Revenue Capacity is intended to assist users in understanding the revenue environment within which the School District operates. Please refer to the following exhibits for a historical view revenue statistics and factors prevalent in the location in which the School District operates.

23
40
0E
xh
ibit
J
-9
Net C
ounty
Appro
priatio
ns
Fis
cal Y
ear
Ge
ne
ral
Capita
l Pro
ject
sfo
r th
e
Perc
enta
ge
Ge
ne
ral
Capita
l Pro
ject
sE
nded J
une 3
0,
Fund
Fund
Fis
cal Y
ear
Am
ount
of Levy
Fund
Fund
2013
589,9
53.1
9$
2,8
29,9
50.6
4$
11,3
36,0
33.0
0$
13,6
70,9
00.6
8$
121%
300,6
59.0
5$
784,3
77.1
0$
2012
77,7
37.5
3
2,0
48,1
83.7
8
12,3
47,9
89.0
0
11,0
54,0
06.4
8
90%
589,9
53.1
9
2,8
29,9
50.6
4
2011
1,0
43,6
66.5
3
2,6
34,9
42.7
3
11,1
46,0
33.0
5
12,6
98,7
21.0
0
114%
77,7
37.5
3
2,0
48,1
83.7
8
2010
1,4
08,8
35.5
3
92,4
14.8
8
13,8
71,0
32.8
5
11,6
93,6
74.0
0
84%
1,0
43,6
66.5
3
2,6
34,9
42.7
3
2009
1,2
85,7
61.2
0
4,0
22,2
25.2
5
11,8
39,1
84.7
4
15,6
45,9
20.7
8
132%
1,4
08,8
35.5
3
92,4
14.8
8
2008
1,7
88,1
99.0
9
4,2
82,3
18.7
2
10,1
60,6
38.6
4
10,9
23,1
70.0
0
108%
1,2
85,7
61.2
0
4,0
22,2
25.2
5
2007
593,2
64.1
4
16,8
32,0
33.0
0
11,3
54,7
79.3
3
100%
1,7
88,1
99.0
9
4,2
82,3
18.7
2
2006
2,7
64,1
49.5
3
2,1
55,7
86.6
0
10,4
60,6
38.0
0
14,7
87,3
09.9
9
100%
593,2
64.1
4
2005
13,4
51,8
21.0
0
8,5
31,8
84.8
7
100%
2,7
64,1
49.5
3
2,1
55,7
86.6
0
2004
10,6
74,2
61.0
0
10,6
74,2
61.0
0
100%
(1)
Sch
ool t
axe
s are
colle
cted b
y th
e C
ounty
Tre
asu
rer.
U
nd
er
Ne
w J
ers
ey
Sta
te S
tatu
te, a
co
unty
is r
equired to r
em
it to
the s
chool d
istr
ict th
e e
ntir
e p
ropert
y ta
x bala
nce
, in
the
am
ount c
ert
ified p
rior
to the e
nd o
f th
e s
chool ye
ar.
So
urc
e:
Dis
tric
t R
eco
rds
Year
of th
e L
evy
(1
)
CA
MD
EN
CO
UN
TY
TE
CH
NIC
AL
SC
HO
OL
DIS
TR
ICT
County
Appro
priatio
ns
and C
olle
ctio
ns
Last
Ten F
isca
l Years
Unaudite
d
Begin
nin
g
County
Rece
ivable
Endin
gC
ounty
Rece
ivable
Colle
cted w
ithin
the F
isca
l
117

Demographic and Economic Information
Demographic and economic information is intended (1) to assist users in understanding the socioeconomic environment within which the School District operates and (2) to provide information that facilitates comparisons of financial statement information over time and among school districts. Please refer to the following exhibits for a historical view of the demographic and economic statistics and factors prevalent in the location in which the School District operates.

23400
Ex
hib
it J
-14
De
mo
gra
ph
ic S
tatistics
Last
Ten Y
ears
Unaudite
d
Per
Capita
Year
Ended
County
Pers
onal
Eff
ective
Bu
ying
Un
em
plo
yment
De
ce
mb
er
31
,P
opula
tion (
1)
Inco
me
(2
)In
co
me
(3
)R
ate
(4)
2013
Unava
ilable
Unava
ilable
Unava
ilable
Unava
ilable
2012
513,5
39
Unava
ilable
Unava
ilable
10.6
0%
2011
513,2
41
22,1
20,1
73,8
59
$
43,0
99
$
10.6
0%
2010
513,6
01
21,9
41,0
34,7
20
42,7
20
10.6
0%
2009
517,8
79
21,4
43,2
97,8
74
41,4
06
10.0
0%
2008
517,7
39
21,7
40,8
96,0
88
41,9
92
6.1
0%
2007
517,5
59
20,8
36,9
25,3
40
40,2
60
4.7
0%
2006
516,5
47
19,9
75,3
89,0
37
38,6
71
5.1
0%
2005
514,9
60
18,6
92,5
33,0
40
36,2
99
4.7
0%
2004
512,7
10
17,9
21,7
78,0
50
34,9
55
5.4
0%
So
urc
es: (1)
Popula
tion in
form
atio
n p
rovi
ded b
y th
e N
J D
ept of Labor
and W
ork
forc
e D
eve
lop
me
nt
(2)
Pers
onal i
nco
me h
as
been e
stim
ate
d b
ase
d u
pon the m
unic
ipal p
opula
tion a
nd p
er
capita
pers
onal
in
co
me
pre
se
nte
d(3
)P
er
capita
pers
onal i
nco
me b
y m
unic
ipalit
y-est
imate
d b
ase
d u
pon the 2
000 C
ensu
s publis
hed b
y th
e
U
S B
ure
au o
f E
conom
ic A
naly
sis
(4)
Un
em
plo
yment data
pro
vided b
y th
e N
J D
ept of Labor
and W
ork
forc
e D
eve
lop
me
nt
CA
MD
EN
CO
UN
TY
TE
CH
NIC
AL
SC
HO
OL
DIS
TR
ICT
119

23
40
0E
xh
ibit
J-1
5
Perc
en
tag
eP
erc
en
tag
eo
f T
ota
lo
f T
ota
lM
un
icip
al
Mu
nic
ipa
lE
mp
loyer
Em
plo
yees
Ra
nk
E
mp
loym
en
tE
mp
loyees
Ra
nk
Em
plo
ym
en
t
N/A
N/A
1N
/AN
/AN
/AN
/AN
/A2
N/A
N/A
N/A
N/A
N/A
4N
/AN
/AN
/AN
/AN
/A3
N/A
N/A
N/A
N/A
N/A
5N
/AN
/AN
/AN
/AN
/A6
N/A
N/A
N/A
N/A
N/A
7N
/AN
/AN
/AN
/AN
/A8
N/A
N/A
N/A
N/A
N/A
9N
/AN
/AN
/AN
/AN
/A10
N/A
N/A
N/A
---
---
---
---
2004
2013
CA
MD
EN
CO
UN
TY
TE
CH
NIC
AL
SC
HO
OL
DIS
TR
ICT
Princi
pal N
on-G
ove
rnm
enta
l Em
plo
yers
Curr
ent Y
ear
and N
ine Y
ears
Ago
Unaudite
d
120
Operating Information
Operating information is intended to provide contextual information about the School District’s operations and resources to assist readers in using financial statement information to understand and assess the School District’s economic condition. Please refer to the following exhibits for a historical view of the factors and statistics pertinent to the School District’s operations.

23
40
0E
xh
ibit
J-1
6
2013
2012
2011
2010
2009
2008
2007
2006 -
2004
Fu
nc
tio
n/P
rog
ram
Instr
uctio
nR
egula
r138
142
141
143
86
82
80
N/A
Speci
al e
duca
tion
N/A
N/A
N/A
N/A
68
71
69
N/A
Oth
er
speci
al e
duca
tion
42
22
22
2N
/AV
oca
tional
78
76
68
66
69
68
62
N/A
Oth
er
instr
uctio
n4
23
11
11
N/A
No
np
ub
lic s
ch
oo
l p
rog
ram
sA
dult/
contin
uin
g e
duca
tion p
rogra
ms
Support
Serv
ices:
Tuitio
nS
tudent &
inst
ruct
ion r
ela
ted s
erv
ices
37
33
38
38
40
44
45
N/A
Genera
l adm
inis
trativ
e s
erv
ices
34
55
55
5N
/AS
chool a
dm
inis
trativ
e s
erv
ices
38
37
38
34
25
26
26
N/A
Busi
ness
adm
inis
trativ
e s
erv
ices
26
25
25
23
19
19
19
N/A
Pla
nt opera
tions
and m
ain
tenance
41
42
44
45
44
43
37
N/A
Pupil
transp
ort
atio
nS
peci
al S
chools
00
17
19
18
21
22
N/A
Food S
erv
ice
3N
/AC
om
mu
nity
Educa
tion a
nd R
ecr
eatio
n
To
tal
369.0
363.0
381.0
376.0
377.0
382.0
371.0
---
So
urc
e:
Dis
tric
t R
eco
rds
CA
MD
EN
CO
UN
TY
TE
CH
NIC
AL
SC
HO
OL
DIS
TR
ICT
Full-
time E
quiv
ale
nt D
istr
ict E
mplo
yees
by
Funct
ion/P
rogra
mLast
Ten F
isca
l Years
Unaudite
d
Fis
cal Y
ear
Ended J
une 3
0,
122

23
40
0E
xh
ibit
J-1
7
Fis
ca
lY
ear
Pupil
Ave
rage D
aily
A
vera
ge D
aily
%
Change in
S
tudent
Ended
Opera
ting
Co
st
Pe
r P
erc
enta
ge
Te
ach
ing
T
ea
ch
er
Ra
tio
Enro
llment
Attendance
A
vera
ge D
aily
A
ttendance
June 3
0,
Enro
llment
Exp
enditu
res
(a)
Pupil
Change
Sta
ff (
b)
Hig
h S
chool
(AD
E)
(c)
(AD
A)
(c)
Enro
llment
Perc
enta
ge
2013
2158
46,4
01,7
81
$
$ 21,5
02
6.5
4%
203
11:1
2
,104
1969
-9.9
7%
93.5
8%
2012
2143
43,2
50,7
16
2
0,1
82
22.1
0%
201
11:1
2
,068
1926
-8.5
9%
93.1
3%
2011
2683
44,3
48,3
48
1
6,5
29
-6.3
2%
198
12:1
2
,376
2187
3.9
9%
92.0
5%
2010
2294
4
0,4
75,6
82
1
7,6
44
8.3
8%
195
11:1
2
,294
2107
-0.9
9%
91.8
5%
2009
2322
3
7,8
02,0
48
1
6,2
80
10.2
7%
192
10:1
2
,322
2103
-2.4
7%
92.1
6%
2008
2309
3
4,0
89,4
36
1
4,7
64
0.6
9%
382
6:1
2
,309
2128
-7.8
5%
94.4
0%
2007
2266
3
3,2
24,0
94
1
4,6
62
13.3
2%
371
6:1
2
,266
2139
-6.3
9%
91.3
7%
2006
2388
3
0,8
98,6
27
1
2,9
39
11.0
2%
N/A
N/A
2
,388
2182
-0.4
2%
91.3
9%
2005
2540
2
9,6
02,1
38
1
1,6
54
6.9
5%
N/A
N/A
2
,540
2321
-2.5
1%
91.2
0%
2004
2556
2
7,8
53,3
74
1
0,8
97
11.3
7%
N/A
N/A
2
,556
2331
8.3
4%
90.8
8%
So
urc
es:
D
istr
ict
Re
co
rds
No
te:
Enro
llment base
d o
n a
nnual O
ctober
dis
tric
t co
unt.
a)
Opera
ting e
xpenditu
res
equal t
ota
l exp
enditu
res
less
debt se
rvic
e a
nd c
apita
l outla
y; S
chedule
J-1
b)
Te
ach
ing
sta
ff in
clu
de
s o
nly
fu
ll-tim
e e
qu
iva
len
ts o
f ce
rtific
ate
d s
taff
.c)
Ave
rage d
aily
enro
llment and a
vera
ge d
aily
att
en
da
nce
are
ob
tain
ed
fro
m t
he
Sch
oo
l R
eg
iste
r S
um
ma
ry (
SR
S).
CA
MD
EN
CO
UN
TY
TE
CH
NIC
AL
SC
HO
OL
DIS
TR
ICT
Opera
ting S
tatis
tics
Last
Ten F
isca
l Years
Unaudite
d
123

23400
Ex
hib
it J
-18
2013
2012
2011
2010
2009
2008
2007
2006
2005
2004
Dis
tric
t B
uil
din
g
Glo
uc
es
ter
To
wn
sh
ip C
am
pu
sS
quare
Feet
362,4
90
362,4
90
362,4
90
362,4
90
362,4
90
362,4
90
362,4
90
362,4
90
362,4
90
362,4
90
Capaci
ty (
stu
de
nts
)2,3
75
2,3
75
2,3
75
2,3
75
2,3
75
2,3
75
2,3
75
2,3
75
2,3
75
2,3
75
Enro
llment
1,3
66
1,3
54
1,3
35
1,2
47
1,1
60
1,1
18
1,1
21
1,1
98
1,1
80
1,1
78
Enro
llment-
Post
Seco
ndary
-
-
559
660
834
977
1,0
14
1,0
28
1,1
33
1,1
55
Pe
nn
sa
uk
en
To
wn
sh
ip C
am
pu
sS
quare
Feet
177,3
69
177,3
69
177,3
69
177,3
69
177,3
69
129,9
69
129,9
69
129,9
69
129,9
69
129,9
69
Capaci
ty (
stu
de
nts
)1,0
16
1,0
16
1,0
16
1,0
16
1,0
16
849
849
849
849
849
Enro
llment
792
789
789
789
780
705
750
741
716
785
Nu
mb
er
of
Sch
oo
ls a
t Ju
ne
30
, 2
01
3
Hig
h S
chools
= 2
CA
MD
EN
CO
UN
TY
TE
CH
NIC
AL
SC
HO
OL
DIS
TR
ICT
Sch
ool B
uild
ing Info
rmatio
nLast
10 F
isca
l Years
Unaudite
d
Fis
cal Y
ear
Ended J
une 3
0,
124

23400
Exh
ibit
J-1
9
CA
MD
EN
CO
UN
TY
TE
CH
NIC
AL
SC
HO
OL
DIS
TR
ICT
Genera
l Fund
Sch
edule
of R
equired M
ain
tenance
for
Sch
ool F
aci
litie
sLast
Ten F
isca
l Years
Undis
trib
ute
d E
xpenditu
res
- R
equired M
ain
tenance
fo
r S
cho
ol F
aci
litie
s
11-0
00-2
61-x
xx
* S
ch
oo
l F
acili
tie
s2013
2012
2011
2010
2009
2008
2007
2006
2005
2004
Pennsa
uke
n C
am
pus
16,2
58
$
16,3
99
$
1,5
61
$
5,3
85
$
6,7
24
$
40,6
73
$
46,3
43
$
31,4
53
$
27,8
85
$
82,1
08
$
G
louce
ster
Tow
nsh
ip C
am
pus
57,2
50
34,7
02
49,0
49
54,5
86
160,0
24
183,4
81
95,7
54
101,0
97
173,9
13
201,0
23
Tota
l Sch
ool F
aci
litie
s73,5
08
51,1
01
50,6
10
59,9
71
166,7
48
224,1
54
142,0
97
132,5
50
201,7
98
283,1
31
Oth
er
Fa
cilit
ies
---
---
---
---
---
---
---
---
---
---
Tota
l73,5
08
$
51,1
01
$
50,6
10
$
59,9
71
$
166,7
48
$
224,1
54
$
142,0
97
$
132,5
50
$
201,7
98
$
283,1
31
$
* S
chool f
aci
litie
s as
defin
ed u
nder
EF
CF
A.
(N
.J.A
.C. 6A
:26-1
.2 a
nd N
.J.A
.C. 6:2
4-1
.3)
So
urc
e:
Sch
oo
l D
istr
ict
Fis
cal Y
ear
Ended J
une 3
0,
125

23400 Exhibit J-20
CAMDEN COUNTY TECHNICAL SCHOOL DISTRICTInsurance Schedule
June 30, 2013Unaudited
DistrictCoverage Deductible
Blanket Real and Personal Property $400,000,000 $5,000 per occurrence
Electronic Data Processing $1,365,000 per occurrence $1,000 per occurrence
Equipment $100,000,000 $5,000 per accident
General Liability $11,000,000 $1,000 each claim
Employee Benefits $11,000,000 $1,000 each claim
Crime $100,000 $1,000
Auto Liability $11,000,000 per accident $1,000 each for collision and comprehensive
Workers Compensation $2,000,000 per accident
School Board Legal Liability Coverage A $11,000,000 $5,000.00 each claim
Student Accident & Health School Time Compulsory Coverage $1,000,000
Catastrophic Umbrella $11,000,000
Nurses - Professional Liability $6,000,000
Nurses - Professional Liability $6,000,000
Nurses - Professional Liability $6,000,000
Environmental Impairment Liability $11,000,000 $10,000 deductible
Public Official Bond - B/A $150,000
Source: District Records
126
SINGLE AUDIT SECTION

REPORT ON COMPLIANCE FOR EACH MAJOR PROGRAM AND REPORT ON INTERNAL CONTROL OVER COMPLIANCE REQUIRED BY OMB CIRCULAR A-133 AND
STATE OF NEW JERSEY CIRCULAR 04-04-OMB
INDEPENDENT AUDITOR’S REPORT The Honorable President and Members of the Board of Education Camden County Technical School District County of Camden, New Jersey Report on Compliance for Each Major Federal and State Program We have audited the Camden County Technical School District’s compliance with the types of compliance requirements described in the OMB Circular A-133 Compliance Supplement and the New Jersey State Grant Compliance Supplement that could have a direct and material effect on each of the School District’s major federal and state programs for the fiscal year ended June 30, 2013. The School District's major federal and state programs are identified in the Summary of Auditor's Results section of the accompanying Schedule of Findings and Questioned Costs. Management’s Responsibility Management is responsible for compliance with the requirements of laws, regulations, contracts, and grants applicable to its federal and state programs. Auditor’s Responsibility Our responsibility is to express an opinion on compliance for each of the School District's major federal and state programs based on our audit of the types of compliance requirements referred to above. We conducted our audit of compliance in accordance with auditing standards generally accepted in the United States of America; the standards applicable to financial audits contained in Government Auditing Standards, issued by the Comptroller General of the United States; audit requirements as prescribed by the Division of Administration and Finance, Department of Education, State of New Jersey; OMB Circular A-133, Audits of States, Local Governments, and Non-Profit Organizations; and State of New Jersey Circular 04-04-OMB, Single Audit Policy for Recipients of Federal Grants, State Grants and State Aid. Those standards, OMB Circular A-133, and State of New Jersey Circular 04-04-OMB, require that we plan and perform the audit to obtain reasonable assurance about whether noncompliance with the types of compliance requirements referred to above that could have a direct and material effect on a major federal or state program occurred. An audit includes examining, on a test basis, evidence about the Camden County Technical School District's compliance with those requirements and performing such other procedures as we considered necessary in the circumstances. We believe that our audit provides a reasonable basis for our opinion on compliance for each major federal and state program. However, our audit does not provide a legal determination of the School District's compliance.
128

23400 Opinion on Each Major Federal and State Program In our opinion, the Camden County Technical School District complied, in all material respects, with the types of compliance requirements referred to above that could have a direct and material effect on each of its major federal and state programs identified in the Summary of Auditor’s Results section of the accompanying Schedule of Findings and Questioned Costs for the fiscal year ended June 30, 2013. Other Matters The results of our auditing procedures disclosed instances of noncompliance, which are required to be reported in accordance with OMB Circular A-133 and New Jersey Circular 04-04-OMB and which are described in the accompanying Schedule of Findings and Questioned Costs and Independent Auditor’s Management Report on Administrative Findings - Financial, Compliance and Performance as findings no.: 2013-3, 2013-4, 2013-5 and 2013-6. Our opinion on each major federal and state program is not modified with respect to these matters. The School District’s response to the noncompliance findings identified in our audit is described in the accompanying Schedule of Findings and Questioned Costs. The School District’s response was not subjected to the auditing procedures applied in the audit of compliance and, accordingly, we express no opinion on the response. Report on Internal Control Over Compliance Management of the Camden County Technical School District is responsible for establishing and maintaining effective internal control over compliance with the types of compliance requirements referred to above. In planning and performing our audit of compliance, we considered the School District's internal control over compliance with the types of requirements that could have a direct and material effect on each major federal or state program to determine the auditing procedures that are appropriate in the circumstances for the purpose of expressing an opinion on compliance for each major federal or state program and to test and report on internal control over compliance in accordance with OMB Circular A-133 and State of New Jersey Circular 04-04-OMB, but not for the purpose of expressing an opinion on the effectiveness of internal control over compliance. Accordingly, we do not express an opinion on the effectiveness of the School District’s internal control over compliance. Our consideration of internal control over compliance was for the limited purpose described in the preceding paragraph and was not designed to identify all deficiencies in internal control over compliance that might be material weaknesses or significant deficiencies and therefore, material weaknesses or significant deficiencies may exist that were not identified. However, as discussed below, we identified certain deficiencies in internal control over compliance that we consider to be material weaknesses and significant deficiencies. A deficiency in internal control over compliance exists when the design or operation of a control over compliance does not allow management or employees, in the normal course of performing their assigned functions, to prevent, or detect and correct, noncompliance with a type of compliance requirement of a federal or state program on a timely basis. A material weakness in internal control over compliance is a deficiency, or combination of deficiencies, in internal control over compliance, such that there is a reasonable possibility that material noncompliance with a type of compliance requirement of a federal or state program will not be prevented, or detected and corrected, on a timely basis. We consider the deficiency in internal control over compliance described in the accompanying Schedule of Findings and Questioned Costs and Independent Auditor’s Management Report on Administrative Findings - Financial, Compliance and Performance as finding no.: 2013-5 to be a material weakness. A significant deficiency in internal control over compliance is a deficiency, or a combination of deficiencies, in internal control over compliance with a type of compliance requirement of a federal or state program that is less severe than a material weakness in internal control over compliance, yet important enough to merit attention by those charged with governance. We consider the deficiencies in internal control over compliance described in the accompanying Schedule of Findings and Questioned Costs and Independent Auditor’s Management Report on Administrative Findings - Financial, Compliance and Performance as findings no.: 2013-3, 2013-4 and 2013-6 to be significant deficiencies.
129

130

23400
Federal Program or
Federal Grantor/Pass-Through CFDA Grant or State Award
Grantor/Program Title Number Project Number Amount From To
General Fund:
U.S. Department of Education
Passed-through State Department of Education:
Education Jobs Fund 84.410 N/A 1,913$ 7/1/2012 6/30/2013
Education Jobs Fund 84.410 N/A 766,399 7/1/2011 6/30/2012
U.S. Department of Health and Human Services:
Passed-through the State Department of Education:
Special Education--Medicaid Initiative 93.778 N/A 64,133 7/1/2012 6/30/2013
Total General Fund
Special Revenue Fund:
U.S. Department of Education
Passed-through State Department of Education:
Title I 84.010A NCLB-0700-13 1,232,153 9/1/2012 8/31/2013
Title I Distinguished Schools 84.010A NCLB-0700-13 10,000 9/1/2011 8/31/2012
Title IIA 84.367 NCLB-0700-13 133,983 9/1/2012 8/31/2013
Title III 84.365 NCLB-0700-13 261 9/1/2012 8/31/2013
I.D.E.A. Part B Regular 84.027 FT-0700-13 686,140 9/1/2012 8/31/2013
Race to the Top 84.413A N/A 100,451 9/1/2011 11/30/2015
Special Education - States Grants:
21st Century-After School Learning 84.287C 100-034-5060-075 535,000 9/1/2011 8/31/2012
Perkins Secondary Vocational Education 84.048 PERK-0700-13 411,007 7/1/2012 6/30/2013
Total Special Revenue Fund
Enterprise Fund:
U.S. Department of Agriculture
Passed-through State Department of Education:
Food Distribution Program 10.555 N/A 61,761 7/1/2012 6/30/2013
National School Lunch Program 10.555 N/A 604,169 7/1/2012 6/30/2013
School Breakfast Program 10.553 N/A 193,972 7/1/2012 6/30/2013
Adult and Child Care Food Program 10.558 N/A 5,085 7/1/2011 6/30/2012
National School Lunch Program - After School Snacks 10.555 N/A 9,100 7/1/2012 6/30/2013
Total Enterprise Fund
Total Federal Financial Awards
(1) Passed Through Other Local Government Entities
The accompanying Notes to Financial Statements and Notes to Schedules of Expenditures of Federal Awards and
State Financial Assistance are an integral part of this schedule.
Grant Period
CAMDEN COUNTY TECHNICAL SCHOOLS
Schedule of Expenditures of Federal Awards, Schedule A
For the Fiscal Year Ended June 30, 2013
131

Exhibit K-3
Unearned
Revenue
(Accounts Due to Cash Budgetary (Accounts Unearned Due to
Receivable) Grantor Received Adjustments Expenditures Receivable) Revenue Grantor
1,913.00$ (1,913.00)$
(104,692.09)$ 104,692.09$
(37,240.85) 101,373.91 64,133.06
(141,932.94) - 206,066.00 - 66,046.06 (1,913.00) - -
(46,821.85) 1,333,584.00 (142,455.77)$ 1,138,528.09 (386,914.00) 392,692.29$
10,000.00 2,138.70 7,861.30$
(166.44) 78,322.00 62,405.17 (125,610.00) 141,360.39
(261.00) 261.00
(130,547.40) 586,135.00 708,596.36 (253,015.00) 6.24
34,598.00 43,750.51 (65,853.00) 56,700.49
(43,426.13) 52,827.19 9,401.06
(15,175.38) 421,001.28 405,825.90
(226,137.20) - 2,506,467.47 (142,455.77) 2,370,645.79 (831,653.00) 591,020.41 7,861.30
1,750.74 61,159.60 61,761.11 1,149.23
(5,580.83) 509,212.74 604,169.04 (100,537.13)
(7,794.75) 163,457.94 193,971.53 (38,308.34)
(5,085.00) (5,085.00)
(47.88) 7,520.28 9,100.26 (1,627.86)
(16,757.72) - 741,350.56 - 869,001.94 (145,558.33) 1,149.23 -
(384,827.86)$ -$ 3,453,884.03$ (142,455.77)$ 3,305,693.79$ (979,124.33)$ 592,169.64$ 7,861.30$
Balance June 30, 2012
Balance June 30, 2013
For the Fiscal Year Ended June 30, 2013
Schedule of Expenditures of Federal Awards, Schedule A
CAMDEN COUNTY TECHNICAL SCHOOLS
132

23400
Unearned
Program or Revenue
State Grantor/ Grant or State Award Grant Period (Accounts Due to
Program Title Project Number Amount Match From To Receivable) Grantor
General Fund:
State Department of Education
Equalization Aid 495-034-5120-078 20,073,901.00$ N/A 07/01/11 06/30/12 (2,004,646.35)$
Equalization Aid 495-034-5120-078 20,761,293.00 N/A 07/01/12 06/30/13
Special Education Aid 495-034-5120-089 1,058,618.00 N/A 07/01/11 06/30/12 (105,861.65)
Special Education Aid 495-034-5120-089 1,144,510.00 N/A 07/01/12 06/30/13
Security Aid 495-034-5120-084 149,518.00 N/A 07/01/12 06/30/13
Reimbursed T.P.A.F. Social Sec. Cont. 495-034-5095-002 1,185,922.47 N/A 07/01/11 06/30/12 (9,641.62)
Reimbursed T.P.A.F. Social Sec. Cont. 495-034-5095-002 1,205,768.83 N/A 07/01/12 06/30/13
Total General Fund (2,120,149.62) -
Special Revenue Fund:
Personalized Student Learning N/A 7,500.00 N/A 07/01/11 06/30/12 (843.42)
Green Pilot Program 100-034-5062-032 6,000.00 N/A 02/01/12 01/31/13 2,845.50
Green Pilot Program 100-034-5062-032 6,000.00 N/A 02/01/13 01/31/14
Total Special Revenue Fund 2,002.08 -
Capital Projects Fund:
New Jersey School Development Authority:
Additional State School Building Aid--
Education Facilities Construction Grant 0700-040-09-2005 1,760,442.00 1,349,331.00$ 12/22/11 open (1,480,392.48)
Education Facilities Construction Grant 0700-040-09-2004 1,993,303.00 1,527,811.00 12/22/11 open (1,791,783.37)
Education Facilities Construction Grant 0700-030-09-2007 59,667.00 45,733.00 09/16/11 open (59,667.00)
Education Facilities Construction Grant 0700-040-09-2010 238,668.00 182,932.00 09/16/11 open
Education Facilities Construction Grant 0700-040-09-2006 438,728.00 336,272.00 09/16/11 open (329,040.04)
Education Facilities Construction Grant 0700-030-09-2002 172,887.00 132,513.00 09/16/11 open
Education Facilities Construction Grant 0700-030-04-00PT 229,780.00 N/A 07/01/07 open (188,736.45)
Education Facilities Construction Grant 0700-030-08-0EAE 5,399,072.00 N/A 07/01/07 open (1,075,814.41)
Total Capital Projects Fund (4,925,433.75) -
Enterprise Fund:
State Department of AgricultureState School Lunch Program 100-010-3350-023 12,334.17 N/A 07/01/11 06/30/12 (115.82)State School Lunch Program 100-010-3350-023 13,234.37 N/A 07/01/12 06/30/13
Total Enterprise Fund (115.82) -
Total State Financial Assistance (7,043,697.11)$ -$
The accompanying Notes to Financial Statements and Notes to Schedules of Expenditures of Federal Awards and State Financial Assistance
are an integral part of this schedule.
Balance June 30, 2012
CAMDEN COUNTY TECHNICAL SCHOOL
Schedule of Expenditures of State Financial Assistance, Schedule B
For the Year Ended June 30, 2013
133
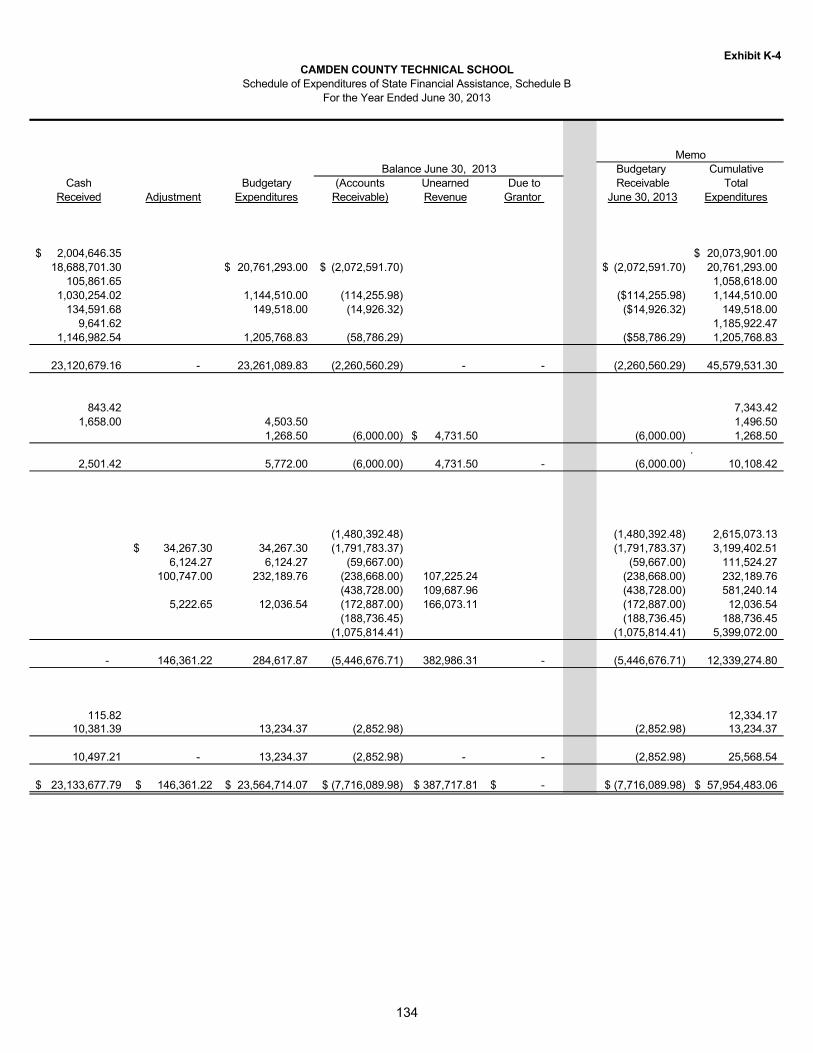
Exhibit K-4
Budgetary Cumulative
Cash Budgetary (Accounts Unearned Due to Receivable Total
Received Adjustment Expenditures Receivable) Revenue Grantor June 30, 2013 Expenditures
2,004,646.35$ 20,073,901.00$
18,688,701.30 20,761,293.00$ (2,072,591.70)$ (2,072,591.70)$ 20,761,293.00
105,861.65 1,058,618.00
1,030,254.02 1,144,510.00 (114,255.98) ($114,255.98) 1,144,510.00
134,591.68 149,518.00 (14,926.32) ($14,926.32) 149,518.00
9,641.62 1,185,922.47
1,146,982.54 1,205,768.83 (58,786.29) ($58,786.29) 1,205,768.83
23,120,679.16 - 23,261,089.83 (2,260,560.29) - - (2,260,560.29) 45,579,531.30
843.42 7,343.42
1,658.00 4,503.50 1,496.50
1,268.50 (6,000.00) 4,731.50$ (6,000.00) 1,268.50
.
2,501.42 5,772.00 (6,000.00) 4,731.50 - (6,000.00) 10,108.42
(1,480,392.48) (1,480,392.48) 2,615,073.13
34,267.30$ 34,267.30 (1,791,783.37) (1,791,783.37) 3,199,402.51
6,124.27 6,124.27 (59,667.00) (59,667.00) 111,524.27
100,747.00 232,189.76 (238,668.00) 107,225.24 (238,668.00) 232,189.76
(438,728.00) 109,687.96 (438,728.00) 581,240.14
5,222.65 12,036.54 (172,887.00) 166,073.11 (172,887.00) 12,036.54
(188,736.45) (188,736.45) 188,736.45
(1,075,814.41) (1,075,814.41) 5,399,072.00
- 146,361.22 284,617.87 (5,446,676.71) 382,986.31 - (5,446,676.71) 12,339,274.80
115.82 12,334.1710,381.39 13,234.37 (2,852.98) (2,852.98) 13,234.37
10,497.21 - 13,234.37 (2,852.98) - - (2,852.98) 25,568.54
23,133,677.79$ 146,361.22$ 23,564,714.07$ (7,716,089.98)$ 387,717.81$ -$ (7,716,089.98)$ 57,954,483.06$
Schedule of Expenditures of State Financial Assistance, Schedule B
For the Year Ended June 30, 2013
Balance June 30, 2013
Memo
CAMDEN COUNTY TECHNICAL SCHOOL
134

23400
CAMDEN COUNTY TECHNICAL SCHOOLSNotes to Schedules of Expenditures of Federal Awards and State Financial Assistance
For the Fiscal Year Ended June 30, 2013
Note 1: GENERAL
The accompanying schedules of expenditures of federal awards and state financial assistance include federal and state award activity of the Camden County Technical School District (hereafter referred to as the “School District”). The School District is defined in Note 1 to the School District's basic financial statements. All federal and state awards received directly from federal and state agencies, as well as federal awards and state financial assistance passed through other government agencies, are included on the schedules of expenditures of federal awards and state financial assistance.
Note 2: BASIS OF ACCOUNTING
The accompanying schedules of expenditures of federal awards and state financial assistance are presented using the budgetary basis of accounting with the exception of programs recorded in the food service fund, which are presented using the accrual basis of accounting. These bases of accounting are described in Note 1 to the School District's basic financial statements. The information in this schedule is presented in accordance with the requirements of OMB Circular A-133, Audits of States, Local Governments, and Non-Profit Organizations. Therefore, some amounts presented in this schedule may differ from amounts presented in, or used in the preparation of, the basic financial statements.
Note 3: RELATIONSHIP TO FINANCIAL STATEMENTS
The basic financial statements present the general fund and special revenue fund on a GAAP basis. Budgetary comparison statements or schedules (RSI) are presented for the general fund and special revenue fund to demonstrate finance-related legal compliance in which certain revenue is permitted by law or grant agreement to be recognized in the audit year, whereas for GAAP reporting, revenue is not recognized until the subsequent year or when expenditures have been made.
The general fund is presented in the accompanying schedules on the modified accrual basis with the exception of the revenue recognition of the one or more deferred June state aid payments in the current budget year, which is mandated pursuant to N.J.S.A. 18A:22-44.2. For GAAP purposes payments arenot recognized until the subsequent budget year due to the state deferral and recording of the one ormore June state aid payments in the subsequent year. The special revenue fund is presented in the accompanying schedules on the grant accounting budgetary basis which recognizes encumbrances as expenditures and also recognizes the related revenues, whereas the GAAP basis does not. The special revenue fund also recognizes the one or two state June payments in the current budget year, consistent with N.J.S.A. 18A:22-44.2.
The net adjustment to reconcile revenues from the budgetary basis to the GAAP basis is $91,266.00 for the general fund and $(16,948.88) for the special revenue fund. See Exhibit C-3, Notes to Required Supplementary Information, for a reconciliation of the budgetary basis to the modified accrual basis of accounting for the general and special revenue funds.
135

23400 Notes to the Schedules of Expenditures of Federal Awardsand State Financial Assistance (Cont'd)
Note 3: RELATIONSHIP TO FINANCIAL STATEMENTS (CONT’D)
Awards and financial assistance expenditures are reported in the School District's basic financial statements on a GAAP basis as presented as follows:
Fund Federal State Total
General 66,046.06$ 25,530,682.83$ 25,596,728.89$ Special Revenue 2,387,594.67 5,772.00 2,393,366.67 Food Service 869,001.94 13,234.37 882,236.31
3,322,642.67$ 25,549,689.20$ 27,990,095.56$
Note 4: RELATIONSHIP TO FEDERAL AND STATE FINANCIAL REPORTS
Amounts reported in the accompanying schedules agree with the amounts reported in the related federal and state financial reports.
Note 5: ADJUSTMENTS
Amounts reported in the “Adjustments” column for the Title I grant represent expenditures that were recorded as expenses in prior years that were deemed unallowable. The adjustments for the State Education Facilities Construction Grant represent the backing out of the local portion of the expenditures in order to reflect the appropriate State receivable.
Note 6: FEDERAL AND STATE LOANS OUTSTANDING
The School District had the following loan balance outstanding at June 30, 2013:
Federal CFDA AmountLoan Program Title Number Outstanding
State SDA N/A 5,446,676.71$
Note 7: OTHER
Revenues and expenditures reported under the Food Distribution Program represent current year value received and current year distribution, respectively. TPAF Social Security Contributions represents the amount reimbursed by the State for the employer’s share of social security contributions for TPAF members for the fiscal year ended June 30, 2013.
Note 8: MAJOR PROGRAMS
Major programs are identified in the Summary of Auditor's Results section of the Schedule of Findings and Questioned Costs.
136

Section 1- Summary of Auditor's Results
Financial Statements
Type of auditor's report issued
Internal control over financial reporting:
Material weakness(es) identified? x yes no
Significant deficiency(ies) identified? x yes none reported
Noncompliance material to financial statements noted? yes x no
Federal Awards
Internal control over major programs:
Material weakness(es) identified? yes x no
Significant deficiency(ies) identified? x yes none reported
Type of auditor's report issued on compliance for major programs
Any audit findings disclosed that are required to be reported in
accordance with Section 510(a) of OMB Circular A-133? x yes no
Identification of major programs:
CFDA Number(s) Name of Federal Program or Cluster
84.048
10.550
10.553
10.555
10.558
Dollar threshold used to determine Type A programs
Auditee qualified as low-risk auditee? yes x no
84.027
Food Distribution Program
National School Breakfast Program
23400
CAMDEN COUNTY TECHNICAL SCHOOLS
Schedule of Findings and Questioned Costs
For the Year Ended June 30, 2013
Unmodified
Unmodified
84.010
IDEA Part B--Basic
Career and Technical Education--Basic Grants to States (Perkins IV)
National School Lunch Program
NCLB - Title I
300,000.00$
National After School Snack Program
137

Section 1- Summary of Auditor's Results (Cont'd)
State Financial Assistance
Internal control over major programs:
Material weakness(es) identified? x yes no
Significant deficiency(ies) identified? x yes none reported
Type of auditor's report issued on compliance for major programs
Any audit findings disclosed that are required to be reported in accordance with Section 510(a) of OMB Circular A-133 orNew Jersey Circular 04-04-OMB? x yes no
Identification of major programs:
GMIS Number(s) Name of State Program
Dollar threshold used to determine Type A programs
Auditee qualified as low-risk auditee? x yes no
For the Year Ended June 30, 2013
23400
CAMDEN COUNTY TECHNICAL SCHOOLS
Schedule of Findings and Questioned Costs
Unmodified
706,941.00$
495-034-5120-078 Equalization Aid
495-034-5120-089 Special Education Categorical Aid
495-034-5120-084 Security Aid
495-034-5095-002 T.P.A.F. Social Security Aid
138

23400
CAMDEN COUNTY TECHNICAL SCHOOLSSchedule of Findings and Questioned Costs
For the Fiscal Year Ended June 30, 2013
Section 2- Schedule of Financial Statement Findings
This section identifies the significant deficiencies, material weaknesses, and instances of noncompliance related to the financial statements that are required to be reported in accordance with Government Auditing Standardsand with audit requirements as prescribed by the Division of Administration and Finance, Department ofEducation, State of New Jersey.
Finding No. 2013-1
Criteria or Specific RequirementThe District is required to have a properly maintained general ledger for all fiduciary funds and insure that all revenue is reconciled and deposited in a timely manner. The District must also design and operate their internal controls so that there is reasonable assurance deficiencies are prevented, or detected and corrected on a timely basis.
ConditionThe general ledger maintained by the District for the Early Childhood Education Center (ECEC) was not reconciled to the point of sale system and source documents.
ContextCash receipts in the amount of $14,442.75 could not be traced to the District’s bank statements or general ledger. These unaccounted receipts represent 99% of the total cash receipts received by the ECEC. During the year, the revenue receipts for the ECEC that were processed through the finance office were never reconciled to the bank statements.
EffectThe District’s financial records for the ECEC do not reflect this revenue since it was not recorded in the general ledger.
CauseDuring the year, the District never reconciled the receipts recorded in the ECEC point of sale system to the bank statement or general ledger. Also, the chain of custody for cash and checks, from receipt to deposit, lends itself to the possibility of misappropriation of funds.
RecommendationThe District should reevaluate all internal controls, including the process for collecting and depositing cash, for the Early Childhood Education Center and ensure that the point of sale system records are reconciled to the general ledger and bank account.
View of Responsible Officials and Planned Corrective ActionThe responsible officials agree with the finding and will address the matter as part of their corrective action plan.
139

23400
CAMDEN COUNTY TECHNICAL SCHOOLSSchedule of Findings and Questioned Costs
For the Fiscal Year Ended June 30, 2013
Section 2- Schedule of Financial Statement Findings (Cont’d)
Finding No. 2013-2
Criteria or Specific RequirementThe District is required to have a properly maintained general ledger for all fiduciary funds and insure that all revenue is reconciled and deposited in a timely manner.
ConditionThe cash reconciliation process for the food service fund is inadequate to ensure errors are prevented, or detected and corrected on a timely basis.
ContextThe District’s reconciliation process for the food service fund is not properly documented or monitored by management to ensure the proper reports are utilized to reconcile receipts. The daily reconciliations contain variances ranging from a shortage of $670.73 to overages of $39.20 that have not been investigated by the District.
EffectPossible misstatement of the school district’s financial records.
CauseThe District utilizes a manual spreadsheet reconciliation process instead of the POS. The manual reconciliation has been found to contain formula errors and an “income adjustment” column used to balance cash deposits. The income adjustment column is not investigated and contains significant cash variances. Also, the District did not record faculty sales in the POS system, the daily ending cash was just added to the deposit slips.
RecommendationThe district should review their reconciliation process and ensure all sales are recorded in the POS system.
View of Responsible Officials and Planned Corrective ActionThe responsible officials agree with the finding and will address the matter as part of their corrective action plan.
140

23400
CAMDEN COUNTY TECHNICAL SCHOOLSSchedule of Findings and Questioned Costs
For the Fiscal Year Ended June 30, 2013
Section 3- Schedule of Federal Award Findings and Questioned Costs
This section identifies the significant deficiencies, material weaknesses, and instances of noncompliance, including questioned costs, related to the audit of major Federal programs, as required by OMB Circular A-133.
Finding No. 2013-3
ProgramFood Distribution Program – 10.550National School Breakfast Program – 10.553National School Lunch Program – 10.555National School Snack Program – 10.555Adult and Child Care Food Program – 10.558
Criteria or Specific Requirement – Special Tests and ProvisionsThe National School Lunch Program requires that by November 15th of each school year, the School District must verify the current free and reduced price eligibility of households selected from a sample of applications that it has approved for free and reduced price meals, unless the LEA is otherwise exempt from the requirement.
ConditionDuring our testing of 26 Verification Reports filed, we found the following issues resulting in an estimated Federal overclaim of $282.51:
The numbers reported on the verification report do not match the verifications performed by the District. 14 out of 26 verifications were incorrectly documented as to the verification procedures performed.
One of the verifications was calculated incorrectly based on the supporting documentation attached. The District did not properly document applications re-approved before February 15, 2013. In 2 instances after lunch applications had been verified and moved to reduced or denied due to income
requirements, the District accepted a new application with additional household members on it; without documentation as to why a person was added to the application.
ContextWe found the errors discussed above during our test of compliance of 26 verified applications for the National School Lunch Program.
Questioned CostsN/A
EffectThe School District did not comply in all instances with the requirements of the National School Lunch Program..
CauseThe School District did not maintain adequate oversight over the National School Lunch Program.
RecommendationThe School District should design and implement controls to ensure adequate oversight over the National School Lunch Program.
View of Responsible Officials and Planned Corrective ActionThe responsible officials agree with the finding and will address the matter as part of their corrective action plan.
141
23400
CAMDEN COUNTY TECHNICAL SCHOOLSSchedule of Findings and Questioned Costs
For the Fiscal Year Ended June 30, 2013
Section 4- Schedule of State Financial Assistance Findings and Questioned Costs
This section identifies the significant deficiencies, material weaknesses, and instances of noncompliance, including questioned costs, related to the audit of major State programs, as required by OMB Circular A-133 and State of New Jersey Circular 04-04-OMB.
Finding No. 2013-4
ProgramEqualization Aid (GMIS Number 495-034-5120-078)Special Education Categorical Aid (GMIS Number 495-034-5120-089)Security Aid (GMIS Number 495-034-5120-084)
Criteria or Specific RequirementN.J.S.A. 18A:18A and N.J.S.A. 18A:19 require the District’s to establish internal controls so that payments for claims are properly authorized.
ConditionWe found the following errors in our tests of internal controls and compliance requirements for the payment of claims:
11 out of 40 payments lacked a signature certifying the goods/services were received/rendered. 14 out of 40 payments were for claims that the invoice date was prior to the purchase order date. 1 contract was renewed pursuant to N.J.S.A. 18A:18A-42, however, the original contract did not include
provisions for a renewal as is required by the statute. A payment was made for services that were over the District’s quote threshold, however, the District did
not obtain quotes. A claim was paid without having supporting documentation. An extraordinary unspecified service contract was awarded and the District did not advertise the award of
the contract. The District did not maintain proof of advertisement for the request of bids for the rehabilitation of the
sewer pumping station.
ContextWe noted the errors during our test of internal controls and compliance requirements.
Questioned CostsN/A
EffectNot properly monitoring controls over expenditures could result in overexpenditures or payments for goods or services that were not received or approved.
CauseThere was a break down in the monitoring and enforcement of internal controls over expenditures.
RecommendationThe District should ensure that all internal controls over expenditures are reviewed and adhered to.
View of Responsible Officials and Planned Corrective ActionThe responsible officials agree with the finding and will address the matter as part of their corrective action plan.
142

23400
CAMDEN COUNTY TECHNICAL SCHOOLSSchedule of Findings and Questioned Costs
For the Fiscal Year Ended June 30, 2013
Section 4- Schedule of State Financial Assistance Findings and Questioned Costs (Cont’d)
Finding No. 2013-5
ProgramEqualization Aid (GMIS Number 495-034-5120-078)Special Education Categorical Aid (GMIS Number 495-034-5120-089)Security Aid (GMIS Number 495-034-5120-084)
Criteria or Specific RequirementThe District is required to follow State requirements for budgeting, reporting and general ledger reconciliation.
ConditionThe following issues occurred during the 2012 – 2013 school year:
Bank reconciliations for February 2013 to June 2013 were not completed in a timely manner. County Superintendent approval was not obtained for transfers made to Capital Outlay or transfers that,
on a cumulative basis, exceed 10% of the amount in the Districts original budget which resulted in several general fund accounts being over-expended.
The Board Secretary's annual report detailing the financial transactions during the year and the Board Designee's annual report detailing the amounts received and disbursed for school purposes during the year were filed late with the county superintendent.
Shared Service Agreements with the County of Camden were charged to capital outlay, however, the services in the agreements are for other administrative services.
ContextWe noted the errors during our test of internal controls and compliance requirements.
Questioned CostsN/A
EffectThe District did not comply with the requirements of the State Aid Public grant program.
CauseThe District did not maintain adequate oversight over the State Aid Public grant program.
RecommendationThe District should evaluate and document the job duties of employees in the finance office in order to design and implement controls to ensure adequate oversight over the various requirements of the State Aid Public grant program.
View of Responsible Officials and Planned Corrective ActionThe responsible officials agree with the finding and will address the matter as part of their corrective action plan.
143

23400
CAMDEN COUNTY TECHNICAL SCHOOLSSchedule of Findings and Questioned Costs
For the Fiscal Year Ended June 30, 2013
Section 4- Schedule of State Financial Assistance Findings and Questioned Costs (Cont’d)
Finding No. 2013-6
ProgramEqualization Aid (GMIS Number 495-034-5120-078)Special Education Categorical Aid (GMIS Number 495-034-5120-089)Security Aid (GMIS Number 495-034-5120-084)
Criteria or Specific RequirementAny fringe benefit provided to an employee must be imputed in the recipients pay unless specifically excluded by law. Fringe benefits must also be approved by the board.
ConditionThe Early Childhood Education Center (ECEC) Coordinator received a fringe benefit for child care tuition without specific board approval or having imputed income as required by the Federal government.
ContextThere was no formal document approved by the board relating to a child care tuition fringe benefit for the ECEC Coordinator nor was income imputed.
Questioned CostsN/A
EffectPossible unapproved compensation and back taxes owed by the employee and a breakdown of internal controls as it relates to policies and procedures.
CauseAlthough the ECEC Coordinator indicated it was part of his compensation package, there was no formal documentation approved by the Board.
RecommendationThe board should approve and document all employee fringe benefits and impute income if applicable and amend all payroll related documents.
View of Responsible Officials and Planned Corrective ActionThe responsible officials agree with the finding and will address the matter as part of their corrective action plan.
144

23400
CAMDEN COUNTY TECHNICAL SCHOOLSSummary Schedule of Prior Year Audit Findings
and Questioned Costs as Prepared by Management
This section identifies the status of prior year findings related to the financial statements and Federal Awards and State Financial Assistance that are required to be reported in accordance with Government Auditing Standards,OMB Circular A-133 and State of New Jersey Circular 04-04-OMB.
FINANCIAL STATEMENT FINDINGS
Finding No. 2012-1
ConditionThe general ledger maintained by the District for the Early Childhood Education Center (ECEC) was not reconciled to the point of sale system and source documents.
Current StatusThis Condition continues to exist as finding 2013-1.
Planned Corrective ActionThe responsible officials agree with the finding and will address the matter as part of their corrective action plan.
Finding No. 2012-2
ConditionThe Early Childhood Education Center (ECEC) Coordinator received a fringe benefit for child care tuition without specific board approval or having imputed income as required by the Federal government.
Current StatusThis Condition continues to exist as finding 2013-6.
Planned Corrective ActionThe responsible officials agree with the finding and will address the matter as part of their corrective action plan.
145

23400
CAMDEN COUNTY TECHNICAL SCHOOLSSummary Schedule of Prior Year Audit Findings
and Questioned Costs as Prepared by Management
FEDERAL AWARDS
Finding No. 2012-3
Program
Adult and Child Care Food Program – 10.558National School Breakfast Program – 10.553National School Lunch Program – 10.555National School Snack Program – 10.557
ConditionDuring our testing of 26 Verification Reports filed, we found the following issues resulting in a Federal overclaim of $282.51:
The numbers reported on the verification report do not match the verifications performed by the District. 14 out of 26 verifications were incorrectly documented as to the verification procedures performed.
One of the verifications was calculated incorrectly based on the supporting documentation attached. The District did not properly document applications re-approved before February 15, 2013. In 2 instances after lunch applications had been verified and moved to reduced or denied due to income
requirements, the District accepted a new application with additional household members on it; without documentation as to why a person was added to the application.
Current StatusThis Condition continues to exist as finding 2013-3.
Planned Corrective ActionThe responsible officials agree with the finding and will address the matter as part of their corrective action plan.
STATE FINANCIAL ASSISTANCE PROGRAMS
None
146


