
Canadian Labour Canadian Labour CongressCongress
Department of Social and Economic Policy
Andrew Jackson, Senior [email protected]

Labour Market Labour Market Policies for Social Policies for Social
InclusionInclusion
Presentation to thePresentation to theWelfare to Work National Forum Welfare to Work National Forum
November 17, 2003November 17, 2003

Social Inclusion is Social Inclusion is About:About:
Development of individual talents, capacities, and capabilities
Active participation in societyBroad equality of ‘life chances’ Real equality of opportunity

Social Inclusion and theSocial Inclusion and theLabour MarketLabour Market
Goal: ‘Good Jobs in Good Workplaces’Two key dimensions:
– A living wage / adequate income– Opportunities for self-development

The ‘New Architecture’ The ‘New Architecture’ of Social Policyof Social Policy
Goal: social inclusion through paid work vs. ‘dependency’
Yes … but, there is critical need for:– adequate income supports (e.g., PWDs)– facilitative macro-economic context– full social recognition of household
responsibilties (child and elder care; ‘social’ working hours)

Precarious WorkPrecarious Work
Achilles heel of ‘inclusion through work’
Best defined as high combined risk of unemployment, low pay, lack of developmental opportunities
Leads to high risk of continuing relative low income, especially for single households and other ‘high-risk’ groups

Precarious Forms of Precarious Forms of WorkWork
Temporary jobs: 13% of jobs in 2002 – up about two percentage points from 1989
‘Own account’ self-employment: 9.8% of employment in 2002 from 7.2% in 1989 (stable since 1997)
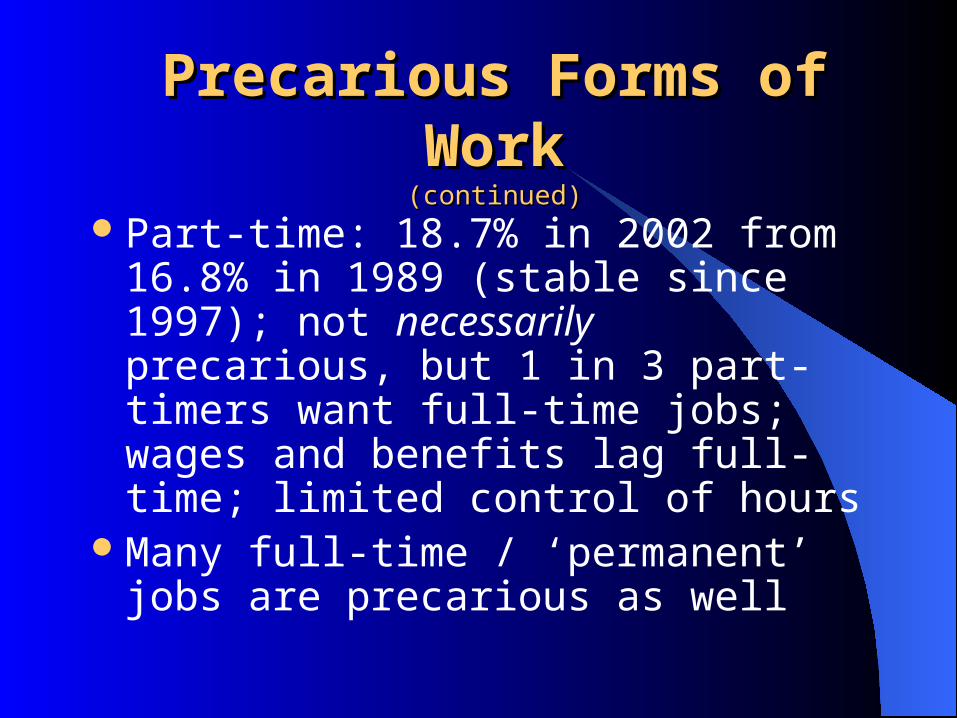
Precarious Forms of Precarious Forms of WorkWork(continued)(continued)
Part-time: 18.7% in 2002 from 16.8% in 1989 (stable since 1997); not necessarily precarious, but 1 in 3 part-timers want full-time jobs; wages and benefits lag full-time; limited control of hours
Many full-time / ‘permanent’ jobs are precarious as well

Unemployment RiskUnemployment Risk
Risk of long-term adult unemployment and labour market exclusion is low, but short-term unemployment is common
Annual incidence in 1990s – up to 25% to 33% of families – up to 1 in 6 adults

Unemployment RiskUnemployment Risk(continued)(continued)
Today – unemployment rate of 8%; average duration, 18 weeks; annual incidence about 1 in 8
Risk concentrated on young adults, recent immigrants, PWDs, ‘near elderly,’ persons with less than high school, college (four times the risk of university graduates)

Low Pay:Low Pay:Incidence of Low Pay: 2002Incidence of Low Pay: 2002
<2/3 median = <$10.23/hr<2/3 median = <$10.23/hr
All – 25.3% (vs. 25.0% in 1997)Men – 19.4% (unchanged)Women – 31.5% (vs. 31.1% in 1997)Age 25-54 – 16.0% (unchanged)Age 55+ – 19.8% (vs. 19.2% in 1997)Part-time – 57.0% (vs. 53.9% in 1997)Low relative hourly pay has persisted
despite falling unemployment
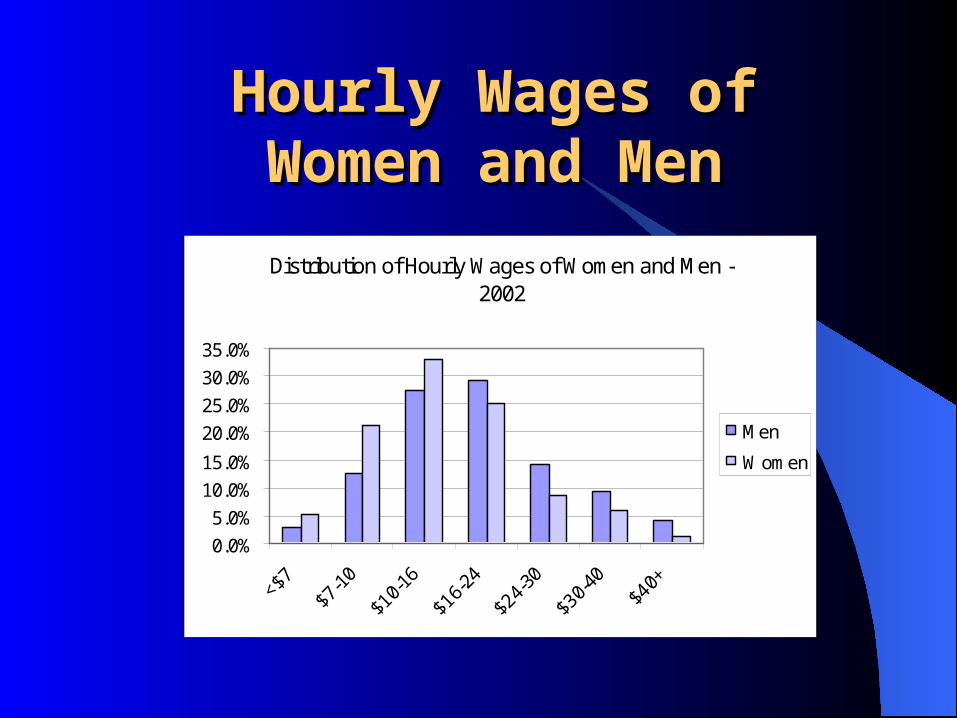
Hourly Wages ofHourly Wages ofWomen and MenWomen and Men
Distribution of Hourly Wages of Women and Men - 2002
0.0%
5.0%
10.0%
15.0%
20.0%
25.0%
30.0%
35.0%
Men
Women
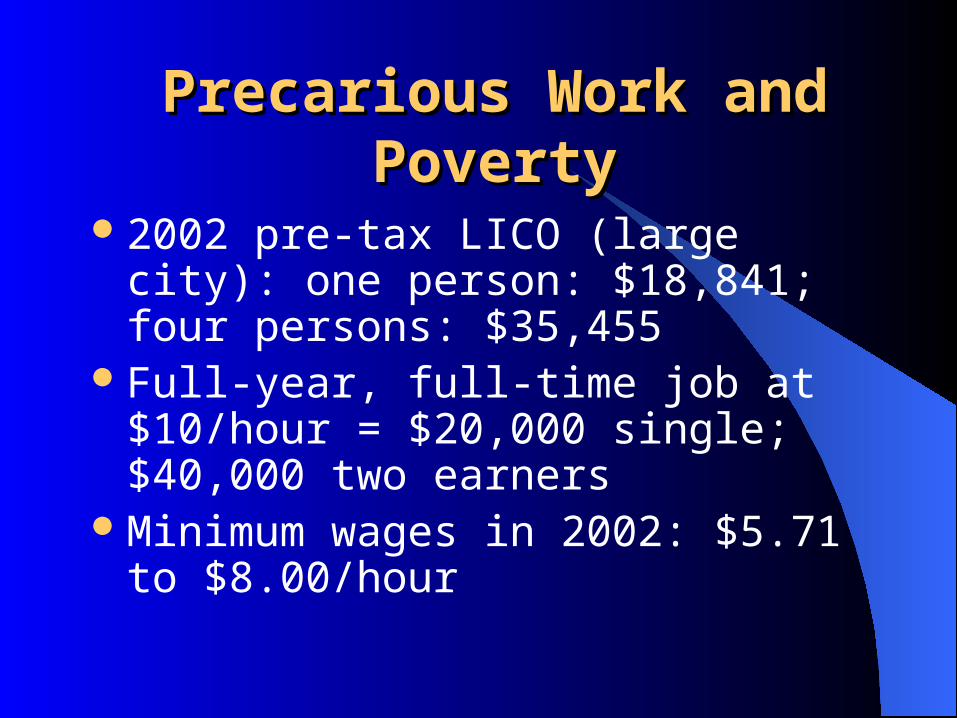
Precarious Work and Precarious Work and PovertyPoverty
2002 pre-tax LICO (large city): one person: $18,841; four persons: $35,455
Full-year, full-time job at $10/hour = $20,000 single; $40,000 two earners
Minimum wages in 2002: $5.71 to $8.00/hour

Precarious Work and Precarious Work and PovertyPoverty
(continued)(continued)
Families / singles with full-year, full-time jobs at minimum wage, plus child and tax benefits, fall below pre-tax LICO in almost all jurisdictions (Battle, 2003)
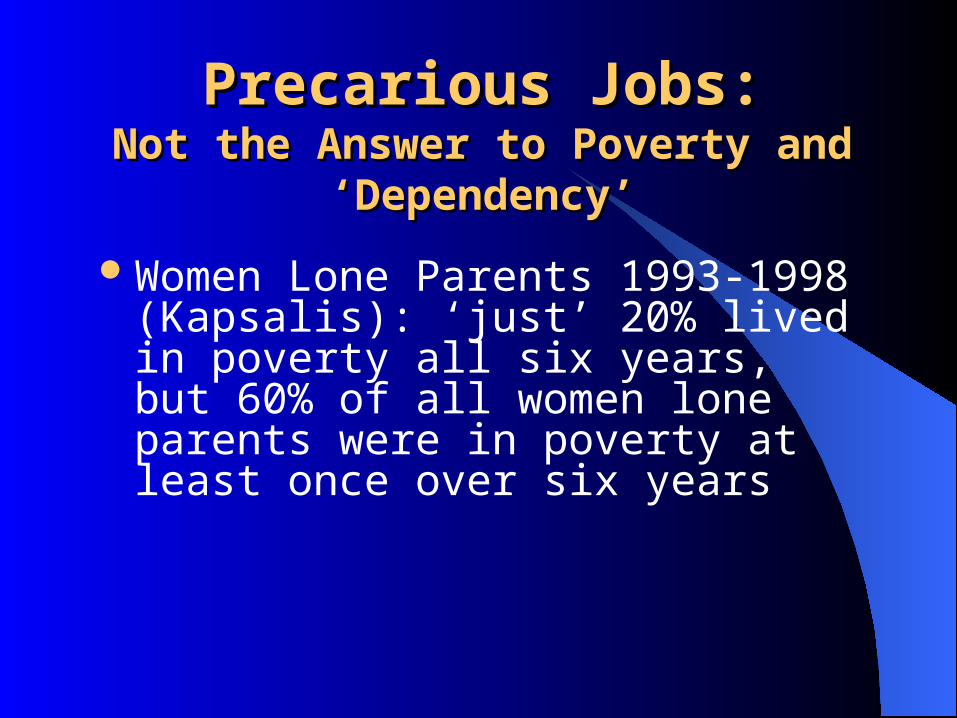
Precarious Jobs:Precarious Jobs:Not the Answer to Poverty and Not the Answer to Poverty and
‘Dependency’‘Dependency’
Women Lone Parents 1993-1998 (Kapsalis): ‘just’ 20% lived in poverty all six years, but 60% of all women lone parents were in poverty at least once over six years
Precarious Jobs:Precarious Jobs:Not the Answer to Poverty and Not the Answer to Poverty and
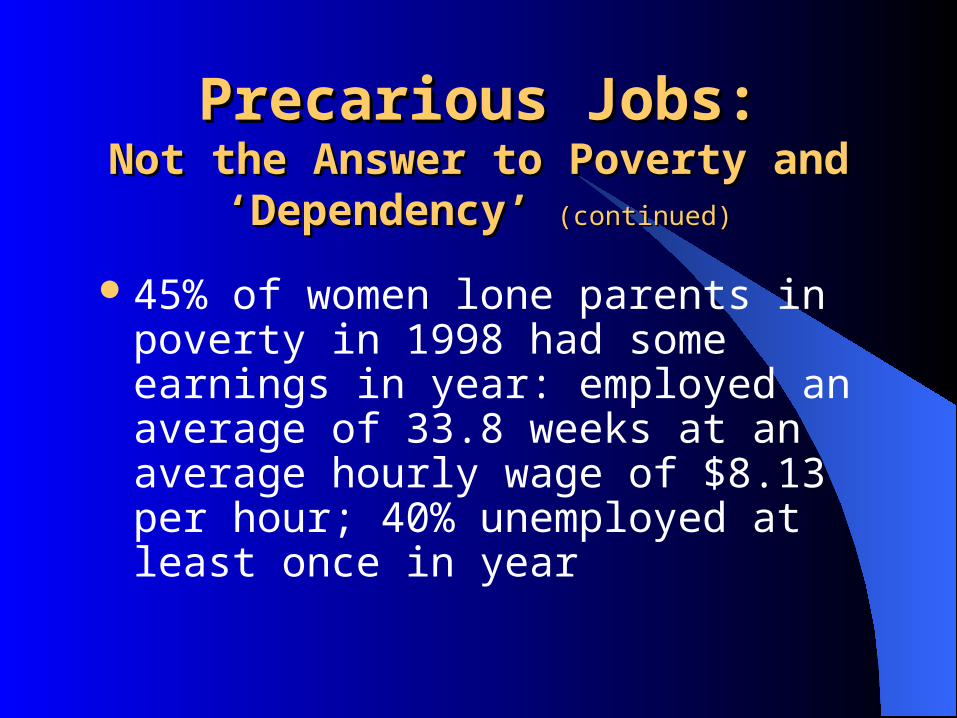
‘Dependency’‘Dependency’ (continued)(continued)
45% of women lone parents in poverty in 1998 had some earnings in year: employed an average of 33.8 weeks at an average hourly wage of $8.13 per hour; 40% unemployed at least once in year
Precarious Jobs:Precarious Jobs:Not the Answer to Poverty and Not the Answer to Poverty and
‘Dependency’‘Dependency’ (continued)(continued)
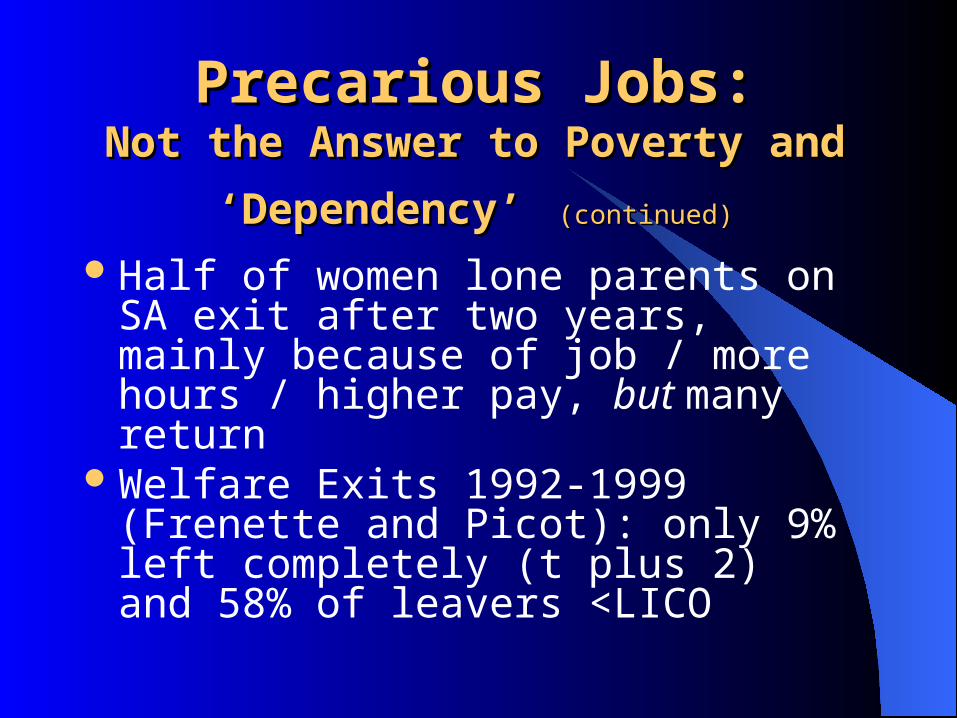
Half of women lone parents on SA exit after two years, mainly because of job / more hours / higher pay, but many return
Welfare Exits 1992-1999 (Frenette and Picot): only 9% left completely (t plus 2) and 58% of leavers <LICO

Low-Wage Jobs:Low-Wage Jobs:Traps or Ladders to Opportunity?Traps or Ladders to Opportunity?
Key research question: limited longitudinal analysis
Beach, Finnie and Gray (2003) Evidence is for significant widening of ‘life-cycle’ earnings differentials due to interaction of low pay and unemployment (and concentrated labour market risks)
Low-Wage Jobs:Low-Wage Jobs:Traps or Ladders to Opportunity?Traps or Ladders to Opportunity?
(continued)(continued)
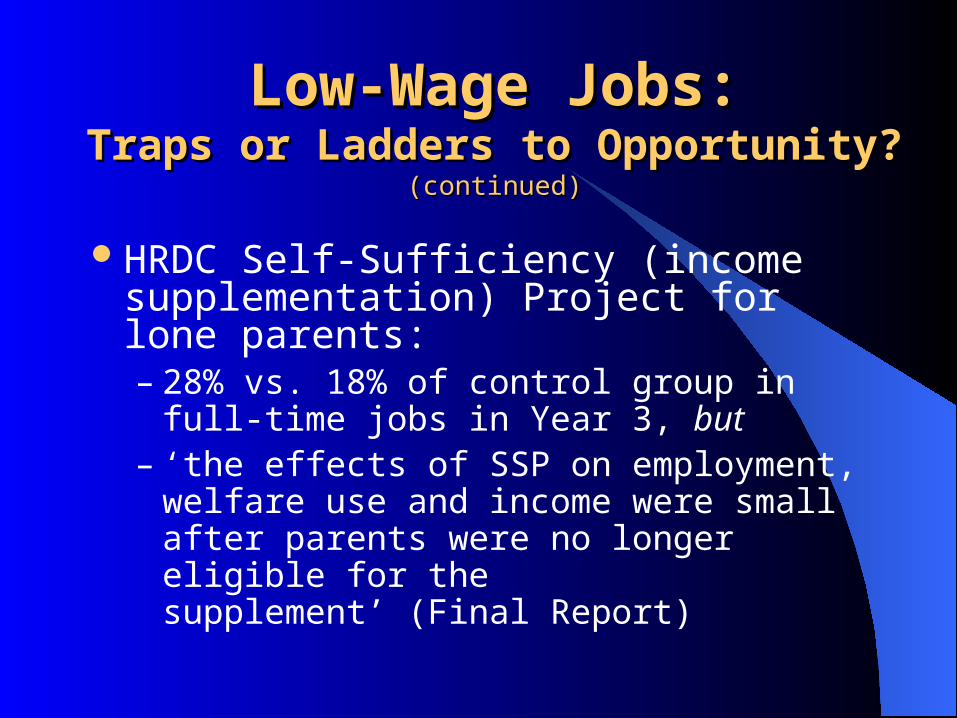
HRDC Self-Sufficiency (income supplementation) Project for lone parents:– 28% vs. 18% of control group in full-time
jobs in Year 3, but – ‘the effects of SSP on employment,
welfare use and income were small after parents were no longer eligible for the supplement’ (Final Report)
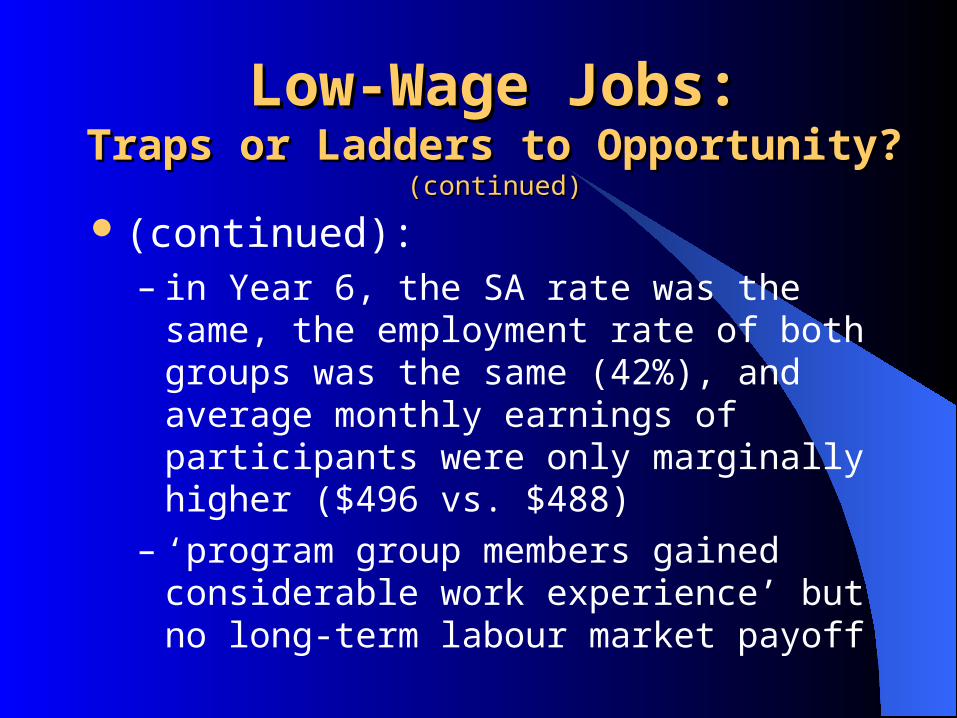
(continued):– in Year 6, the SA rate was the same, the
employment rate of both groups was the same (42%), and average monthly earnings of participants were only marginally higher ($496 vs. $488)
– ‘program group members gained considerable work experience’ but no long-term labour market payoff
Low-Wage Jobs:Low-Wage Jobs:Traps or Ladders to Opportunity?Traps or Ladders to Opportunity?
(continued)(continued)

Labour Market Dynamics Labour Market Dynamics of Growing Family Income of Growing Family Income
InequalityInequalityFamily incomes have become much
more unequal: 1989 – 2001 (structural trend)
Market income share of top quintile: 42.4% to 45.6%

Labour Market Dynamics Labour Market Dynamics of Growing Family Income of Growing Family Income
InequalityInequality(continued)(continued)
Final income share of top quintile: 36.9% to 39.2%
Top has grown away from both the middle and the bottom; taxes and transfers still equalize, but pushing against the tide
Poverty (post-tax LICO) has increased among working-age adults (persons aged 18-64: 9.3% to 10.6%), but not children (11.5% to 11.4%) because of transfers
Long-term implications for inclusion?
Labour Market Dynamics Labour Market Dynamics of Growing Family Income of Growing Family Income
InequalityInequality(continued)(continued)
Precarious Jobs vs. Precarious Jobs vs. Developmental JobsDevelopmental Jobs
Precarious work not just about unemployment and low pay
Low level of development of skills and capacities at work (‘dead-end’ jobs)
Limited access to formal training plus low skills utilization; just 30% of workforce, mainly ‘core workers,’ receive employer training

Precarious Jobs vs. Precarious Jobs vs. Developmental JobsDevelopmental Jobs
(continued)(continued)
Exclusion from ‘internal’ labour markets
Boring, monotonous, routinized work:1 in 3 men and almost half of women have very low level of job control
Atrophy of current skills (numeracy, literacy, credentials) among young adults, new immigrants
Policy ‘Solutions’Policy ‘Solutions’
Current Approach:– inclusion through work via ‘sticks’ (EI and
welfare ‘reform’ reinforce dependency on wages)
– ‘Make Work Pay’ via ‘carrots’ (Income Supplementation: CCTB, NCB for Working Families)

Policy ‘Solutions’Policy ‘Solutions’(continued)(continued)
Current Approach (continued):– income supplements have a role and
some impact, but should ANY wage be subsidized?
– training and lifelong learning in the new knowledge-based economy: rhetoric vs. reality
– what about LABOUR MARKET policy?
Living Wages:Living Wages:Creating a Wage FloorCreating a Wage Floor
Canada is a low-wage country (especially for women)
All other advanced industrial countries except US have higher wage floors / a more compressed distribution of earnings
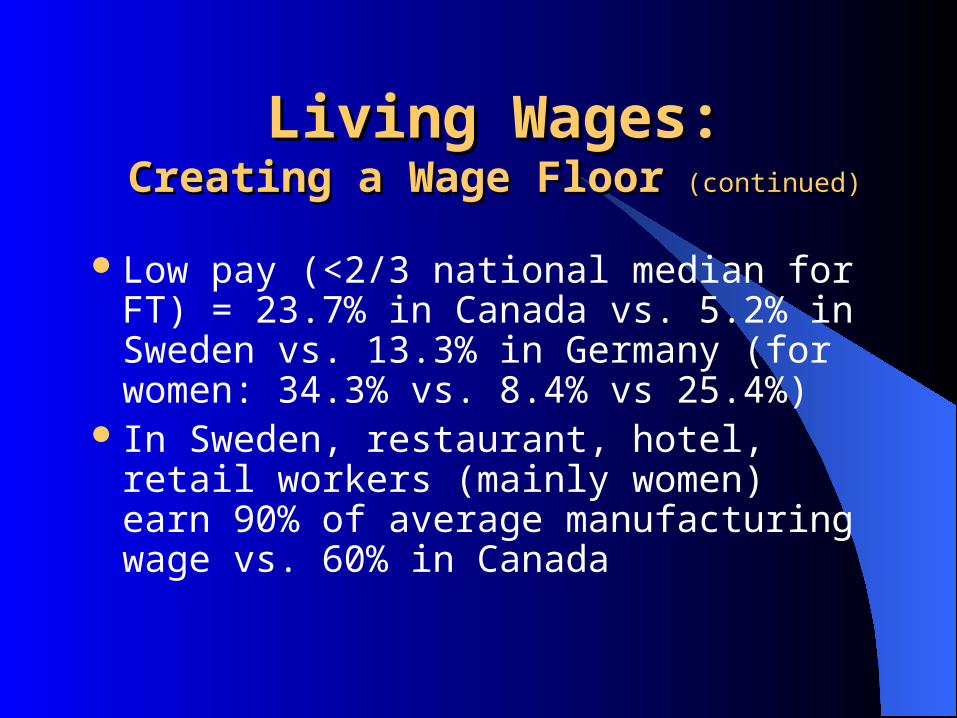
Living Wages:Living Wages:Creating a Wage FloorCreating a Wage Floor (continued)(continued)
Low pay (<2/3 national median for FT) = 23.7% in Canada vs. 5.2% in Sweden vs. 13.3% in Germany (for women: 34.3% vs. 8.4% vs 25.4%)
In Sweden, restaurant, hotel, retail workers (mainly women) earn 90% of average manufacturing wage vs. 60% in Canada
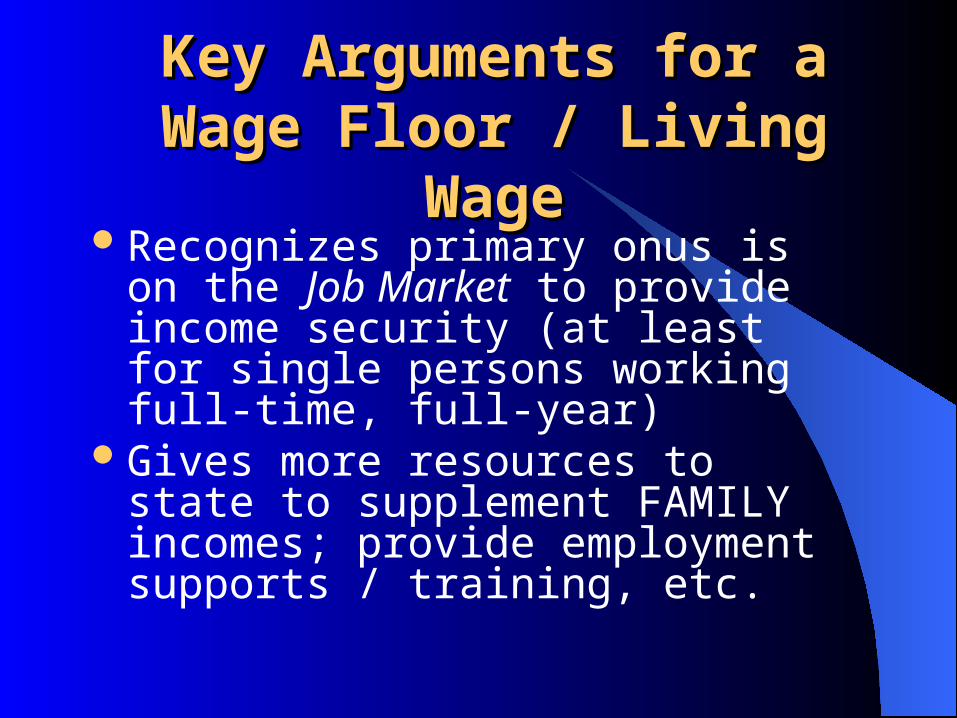
Key Arguments for aKey Arguments for aWage Floor / Living Wage Floor / Living
WageWageRecognizes primary onus is on the Job
Market to provide income security (at least for single persons working full-time, full-year)
Gives more resources to state to supplement FAMILY incomes; provide employment supports / training, etc.

Key Arguments for aKey Arguments for aWage Floor / Living Wage Floor / Living
WageWage(continued)(continued)
Protects responsible employers from unfair competition
Provides strong work incentivesLowers income inequality and poverty
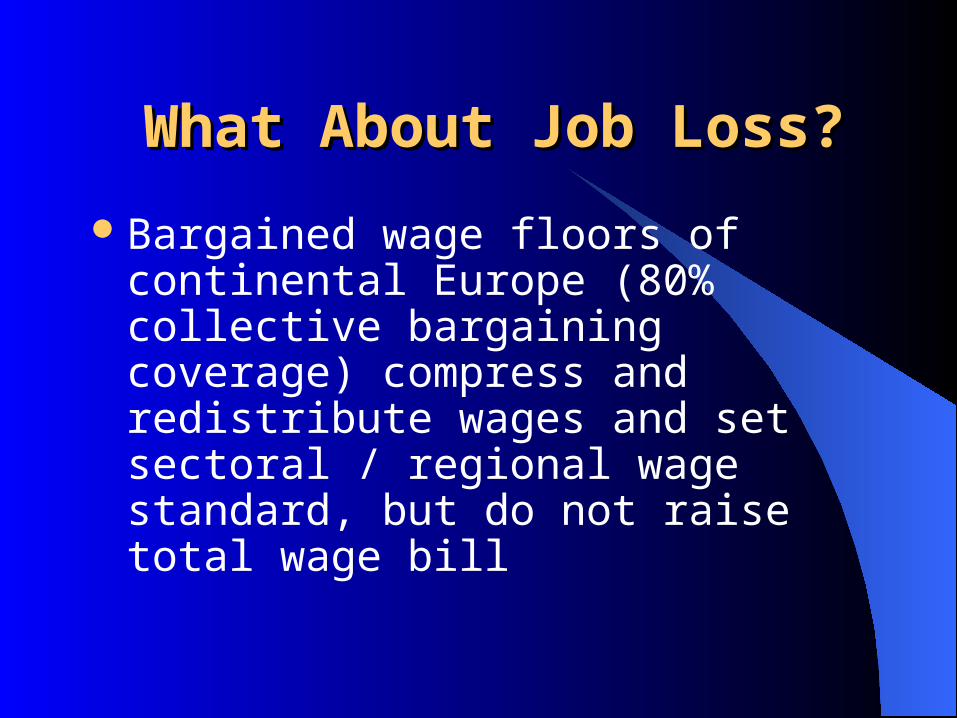
What About Job Loss?What About Job Loss?
Bargained wage floors of continental Europe (80% collective bargaining coverage) compress and redistribute wages and set sectoral / regional wage standard, but do not raise total wage bill

What About Job Loss?What About Job Loss?(continued)(continued)
Many countries with high wage floors / low earnings inequality have been good economic performers in 1990s (Denmark, Netherlands)
Denmark and Sweden have highest employment rates in OECD (75%); low unemployment rates (5%) ‘despite’ high wage floors (and ‘generous’ unemployment benefits)

Do Legislated MinimumDo Legislated MinimumWages Cost Jobs?Wages Cost Jobs?
Minimum wage is second-best solution – but private sector unionization in Canada is below 20%, less than 10% in low wage private services
In theory, some low productivity workers will lose jobs if minimum wage is too high
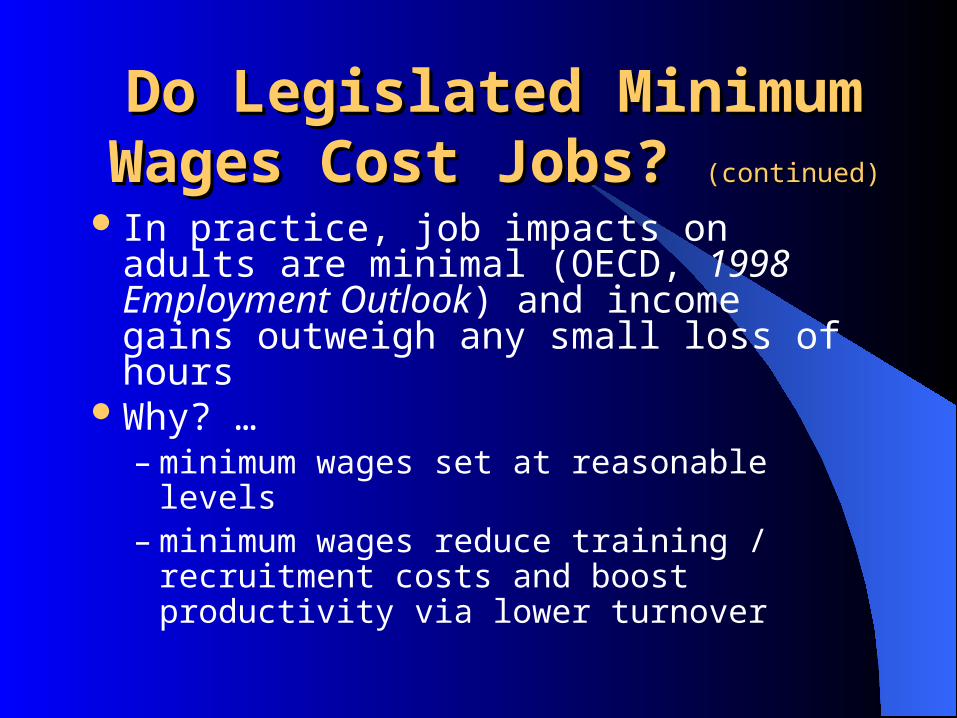
Do Legislated MinimumDo Legislated MinimumWages Cost Jobs? Wages Cost Jobs? (continued)(continued)
In practice, job impacts on adults are minimal (OECD, 1998 Employment Outlook) and income gains outweigh any small loss of hours
Why? …– minimum wages set at reasonable levels– minimum wages reduce training /
recruitment costs and boost productivity via lower turnover
Do We Have to Choose Do We Have to Choose Between Low Wage Jobs Between Low Wage Jobs
and No Jobs?and No Jobs?There is more than one labour market
and social model on offerWhat can we learn from social
democratic countries?Wage floors generalized across non-
traded sectors raise productivity and promote ‘high road’ completion

Do We Have to Choose Do We Have to Choose Between Low Wage Jobs Between Low Wage Jobs
and No Jobs?and No Jobs?(continued)(continued)Especially important in low-wage
private consumer servicesHigh social spending limits growth of
low wage services jobs (especially for women) by promoting higher skill jobs in public and social services / limiting private services consumption

Ratio of private to public sector jobs: 6 to 1 in US; 4 to 1 in Canada; 2.5:1 in Sweden / Denmark
One in six Canadians work in retail trade / restaurants / hotels vs. one in ten in Sweden / Denmark
Do We Have to Choose Do We Have to Choose Between Low Wage Jobs Between Low Wage Jobs
and No Jobs?and No Jobs?(continued)(continued)

Do We Have to Choose Do We Have to Choose Between Low Wage Jobs Between Low Wage Jobs
and No Jobs?and No Jobs?(continued)(continued)
Real investment in skills – public education; accessible PSE; worker training – can raise productivity in what would be low-wage sectors
Public expenditure on training – 0.17% GDP in Canada vs. 0.30% Sweden vs. 0.85% Denmark
Co-operation in the workplace can boost productivity

Social Dimensions of Social Dimensions of ProductivityProductivity
“A worker will be more or less productive, co-operative and innovative depending on how he or she is treated: whether the wage is seen as fair in relation to the demands of the job; whether the worker gets equal pay for work of equal value; whether training is provided; whether grievances can be voiced. In short, what the worker delivers is contingent on the terms of employment, working conditions, the work environment, collective representation, and due process.”
(Werner Sengenberger, ILO)
More than One WayMore than One Way
No consistent link from ‘liberal’ labour market and social model to high and rising employment and productivity
Yes, the US did well in 1990s, but so did, e.g., Denmark, Netherlands
Scandinavian countries have very high employment rates / high wage floors / low levels of poverty and inequality

More than One WayMore than One Way(continued)(continued)
Average annual growth of labour productivity in business sector, 1995-2002:– US: 1.6%– Canada: 1.5%– Sweden: 1.7%– Denmark: 1.8%
Social democratic labour market and social model boosts efficiency and not just equity

How to Move Forward in How to Move Forward in CanadaCanada
A federal minimum wage as a step to a national minimum wage? A benchmark for employers, unions, communities, provinces?
Level could be considered by a Commission (as in UK) to balance poverty reduction, social inclusion and employment goals

How to Move Forward in How to Move Forward in CanadaCanada
(continued)(continued)
$10/hr. = 2/3 median = LICO for singleFacilitate broader-based collective
bargaining in low wage sectors

Towards a Right to Towards a Right to TrainingTraining
Need for a ‘second chance’ and wider access for precarious workers
Need to create a training and skills development culture in the workplace
Part of solution: training leaves under EI on model of apprenticeship training / EI premium rebates for employer training effort

ConclusionsConclusions
The Labour Market and Social Inclusion

Canadian Labour Canadian Labour CongressCongress
2841 Riverside Drive2841 Riverside DriveOttawa, ON K1V 8X7Ottawa, ON K1V 8X7
(613) 521-3400(613) 521-3400
www.clc-ctc.cawww.clc-ctc.ca


