
Caneberry Tissue AnalysisMonitoring Nutritional Status in New Cultivars
Small Fruit Agent Training
August 4 and 5, 2009

Topics of Importance Cane berries background Tissue samples
How to collect How to submit Understanding the Report
New Developments Baseline K Fertilization

Blackberry Acreage in NC
1999: < 100 acres 2002: about 150 acres 2006: SunnyRidge Farm, Inc., indicated
desire to expand production by 5-700 A Blackberry and raspberry
2009: about 400 acres Future growth still expected

Blackberries – Yum!!!

Blackberry (Rubus)
Erect, semi-erect, trailing, semi-trailing
Perennial root
Biennial shoots called CANES
Primocane is vegetative; 1st year growth (no flowers or fruit)
Floricane is reproductive; 2nd year growth flowers, fruits then dies and is pruned out

• New a picture of cane types

New Cultivars
Erect and semi-erect
Thornless
Different harvest times
Navaho, Ouachita (others include Apache, Chester, Hull, Triple Crown, Arapaho, Chickasaw, Kiowa & Choctaw)
Cultivars suited to NC are currently being developed.

Cultivar Characteristics Navaho
Erect Univ. Arkansas Thornless Mid-late season Med-high yield Great postharvest
shelf life (PHSL)
Ouachita Erect Univ. Arkansas Thornless High yields Big berries, great
flavor Good PHSL
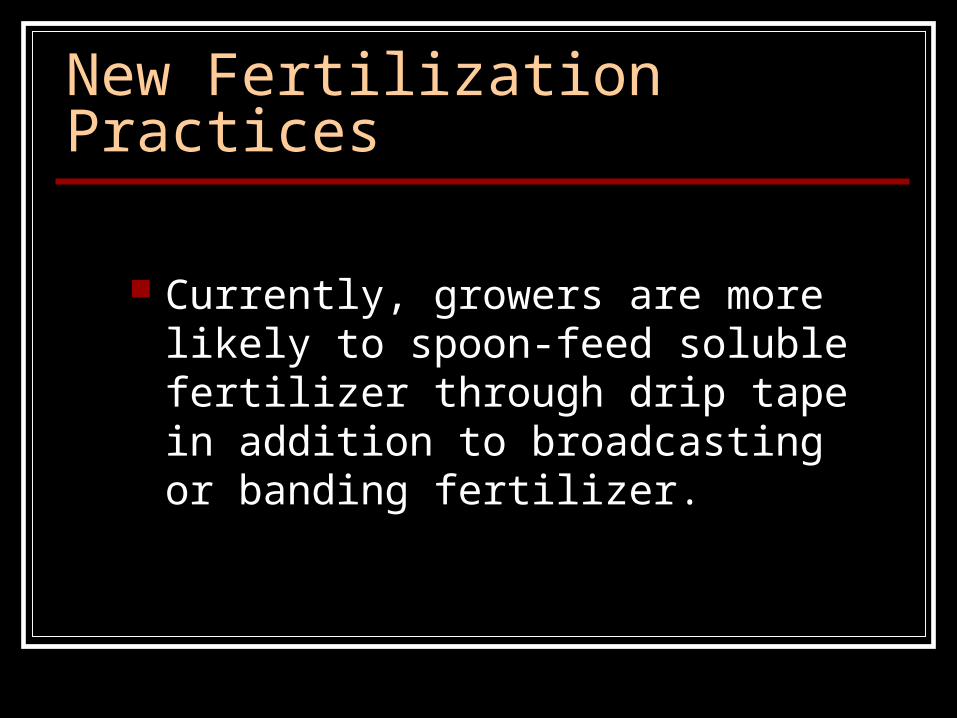
New Fertilization Practices
Currently, growers are more likely to spoon-feed soluble fertilizer through drip tape in addition to broadcasting or banding fertilizer.

Current Nitrogen Fertilizer Recommendations
For mature blackberries: 60–80 lb N Spring: drip a total of 50 lb N
15 lb N March 1 10 lb N March 15, April 1, and April 15 5 lb N early May
Post harvest: apply remainder of N Fall: no nitrogen; lime and non-
nitrogenous fertilizers as needed
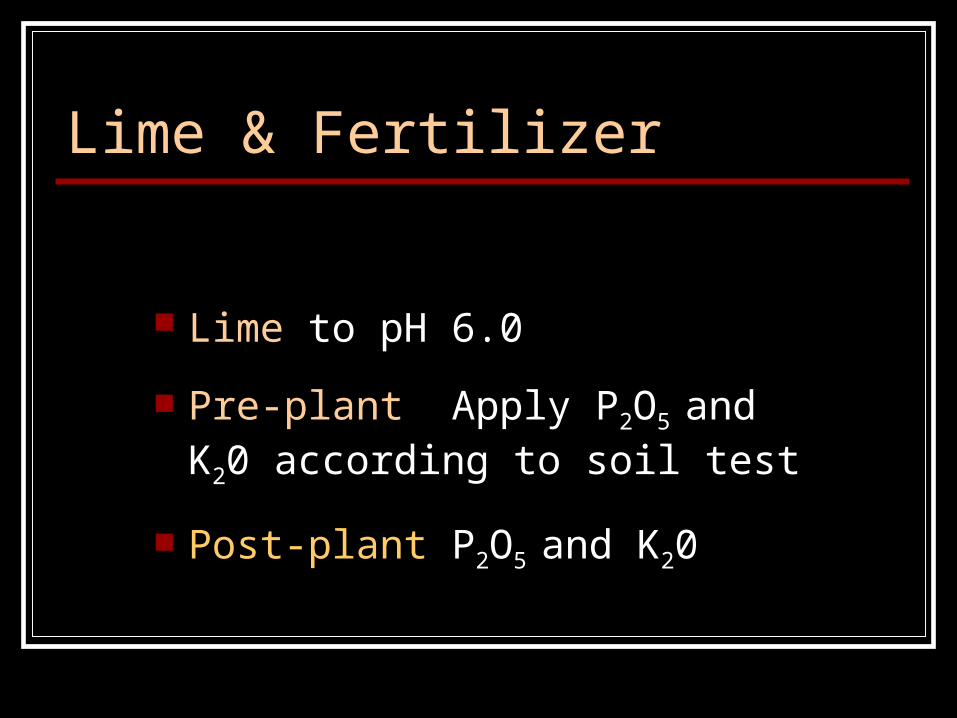
Lime & Fertilizer
Lime to pH 6.0
Pre-plant Apply P2O5 and K20 according to soil test
Post-plant P2O5 and K20
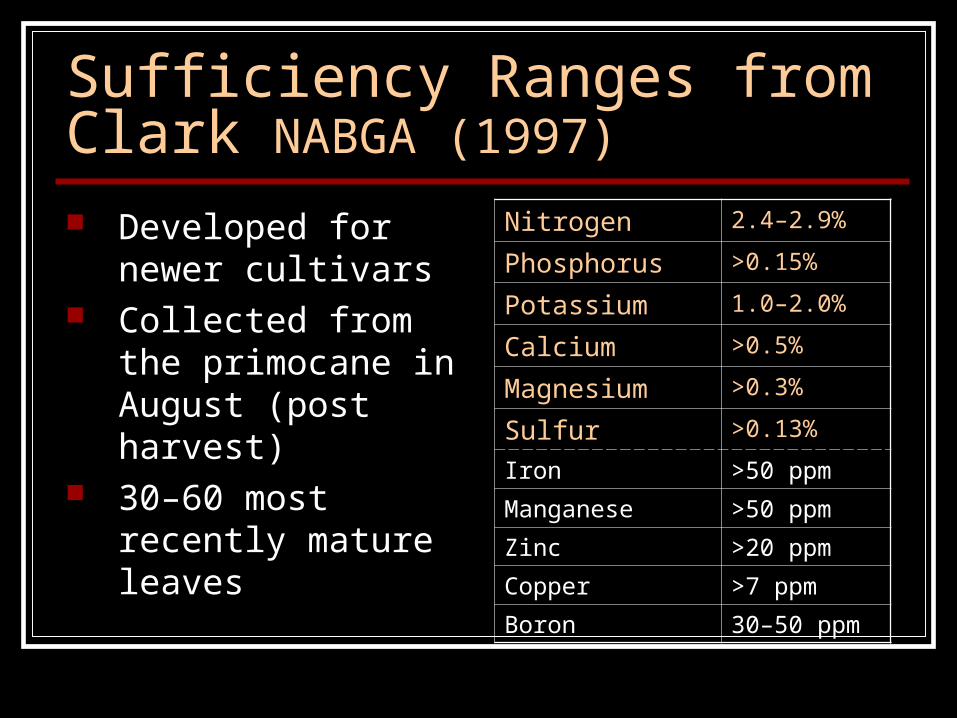
Sufficiency Ranges from Clark NABGA (1997)
Developed for newer cultivars
Collected from the primocane in August (post harvest)
30–60 most recently mature leaves
Nitrogen 2.4–2.9%
Phosphorus >0.15%
Potassium 1.0–2.0%
Calcium >0.5%
Magnesium >0.3%
Sulfur >0.13%
Iron >50 ppm
Manganese >50 ppm
Zinc >20 ppm
Copper >7 ppm
Boron 30–50 ppm

Growers want big, sweet, berries with great shelf life
Tissue analysis is a tool that will help accomplish this

How to use Plant Tissue Analysis?
Fine tune fertilization program by monitoring plant nutrient uptake
Diagnose a problem; include a healthy and unhealthy plant sample and soil samples from the healthy and unhealthy area Corrective action consider climatic conditions, yield
potential, fertilization history, disease/insect pressure, even economic return

Sample Type
Predictive – monitor nutritional status
Diagnostic – verify if problems are related to poor nutritional status

Tissue Samples What
The most recent matured leaves from the primocanes
How Many 25-30 leaves
Special Considerations Paper bags; get them to the lab quickly
When Any time you suspect a nutritional problem (diagnostic) Post harvest (predictive)

12
34
5


Sample IDCrop Name (and Variety)Growth StagePlant Part
Corresponding SamplesPlant AppearanceOther Tests

Growth Stages
Early (E): pre bloom
Bloom (B): full bloom
Fruit (F): ripe or harvesting fruit
Mature (M): 2 weeks post harvest

Sample IDCrop Name (and Variety)Growth StagePlant Part
Corresponding SamplesPlant AppearanceOther Tests
S
B
F
M
E
M U
• Early: pre bloom
• Bloom: full bloom
• Fruit: ripe or harvesting fruit
• Mature: 1-2 weeks post harvest
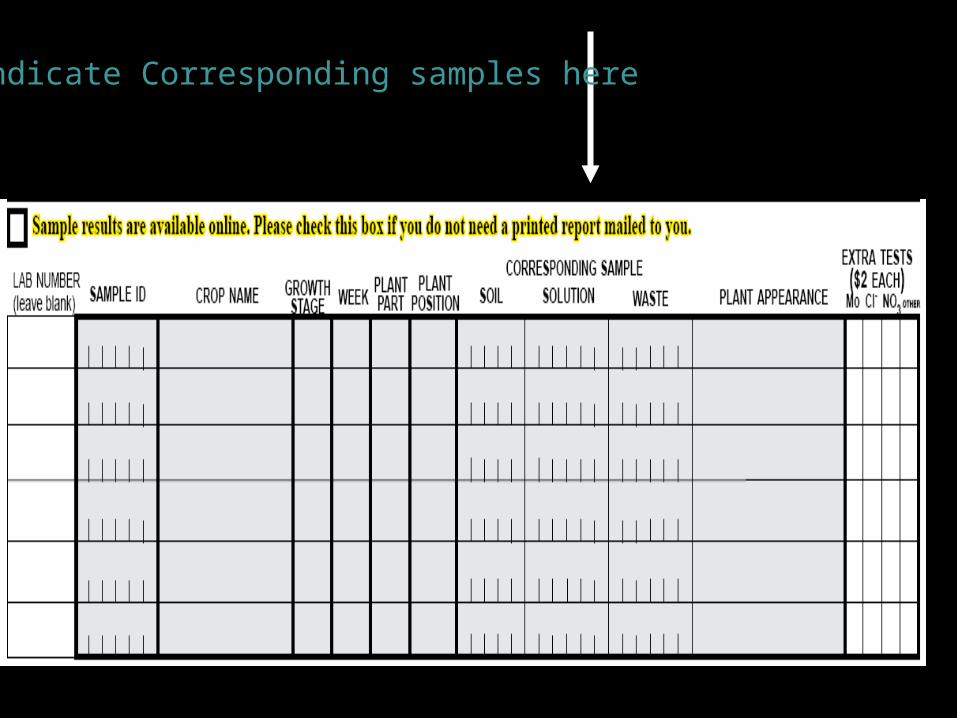
Indicate Corresponding samples here

Indicate Plant Appearance here
Interveinal yellowing
in top

There are no extra tests that we recommend for caneberries
Interveinal yellowing
in top

http://www.ncagr.gov/agronomi/pdffiles/uplant.pdf

– Header– Sample Information– Results (chemical
analysis– Interpretation Indices– Recommendations

Report Header Information
Date report completed and printed
Division name, ph # and web address Report #Grower (client) Name And Address
Farm ID (if needed)
County where sampleWas collected

Laboratory Results
• For Cane berries• Concentrations for 11 essential plant nutrients
plus sodium• Macro nutrients (N P K Ca Mg S) in percent (%)• Micro nutrients (Fe, Mn, Zn Cu, B) in ppm

Interpretation Indices
• Converts a nutrient concentration into an index value
•Desired index ranges from 50-74• Below 50 index reduced growth yield• Above 74 index excess use of fertilizer and
potential toxicity

Interpretation IndexInterpretation Index
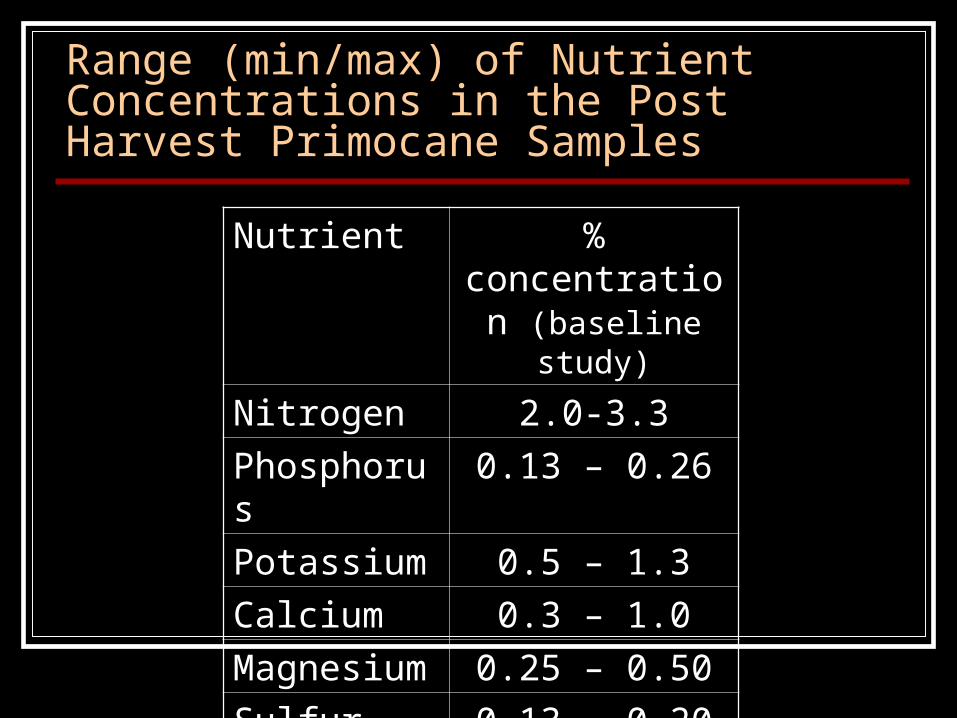
Range (min/max) of Nutrient Concentrations in the Post Harvest Primocane Samples
Nutrient % concentration (baseline study)
Nitrogen 2.0-3.3
Phosphorus 0.13 – 0.26
Potassium 0.5 – 1.3
Calcium 0.3 – 1.0
Magnesium 0.25 – 0.50
Sulfur 0.13 – 0.20

Average Nutrient Concentrations in the Post Harvest Primocane SamplesNutrient % concentration
(baseline study)% concentration (Clark,
U. Ark, 1997)Nitrogen 2.4 – 2.9 2.4 – 2.9
Phosphorus 0.17 – 0.18 >0.15
Potassium 0.77 – 0.84 1.0 – 2.0
Calcium 0.51 – 0.68 >0.5
Magnesium 0.30 – 0.38 >0.3
Sulfur 0.15 – 0.15 >0.13
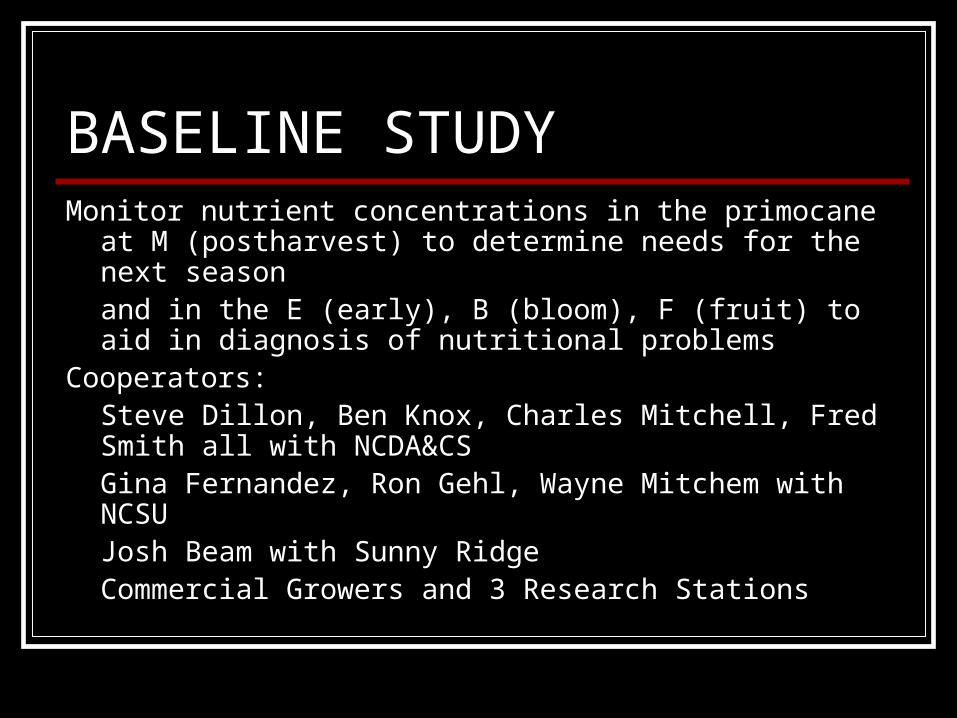
BASELINE STUDYMonitor nutrient concentrations in the primocane at M
(postharvest) to determine needs for the next seasonand in the E (early), B (bloom), F (fruit) to aid in diagnosis of nutritional problems
Cooperators: Steve Dillon, Ben Knox, Charles Mitchell, Fred Smith all with NCDA&CSGina Fernandez, Ron Gehl, Wayne Mitchem with NCSUJosh Beam with Sunny RidgeCommercial Growers and 3 Research Stations

Questions Brenda R. Cleveland
NCDA&CS Agronomic Division Plant Waste Solution and Media Section 919.733.2655 [email protected] www.ncagr.gov/agronomi/


