
POLICY RESEARCH WORKING PAPER 320
Var,ia'bl''eD' s 'm prdk cap al
Capital Structures h predictsucure in the United Sttes
in Developing Countries also precict choicesof ap .
structnfe in a sample of tn
. s , _ . ~~~~~~~~~~~- d~~eveloping::aUraies. in: Evidence from Ten Countries e i nseve -rcountries. tota.indebtednes is negatvely
Aslh Deniqga4-Kunt relatedto, net fixed assets.Voiislav M&smovic--:---- --Vsuggesting tw markets for
long4erm debt do not
function efitaely.
The World Bank
Policy Rcseach Deartment
Fmnance andi Pivate Sectr Development Divsion
July~ ~ ~~~~~~~~~~~~~~~A 199 ------
Pub
lic D
iscl
osur
e A
utho
rized
Pub
lic D
iscl
osur
e A
utho
rized
Pub
lic D
iscl
osur
e A
utho
rized
Pub
lic D
iscl
osur
e A
utho
rized
PoLicy RESEARCH WORKNG PAPER 1320
Summary findingsDemirgfiq-Kunt and Maksimovic investigate capital Still, variables that predict capital structure in thestructures in a sample of the largest publicly traded firms United States also predict choices of capital structure inin ten developing countries - Brazil, India, Jordan, the the countries sampled.Republic of Korea, Malaysia, Mexico, Pakistan, Variables suggested by agency theory explain more ofThailand, Turkey, and Zimbabwe - for 1980-91. the variation than variables suggested by tax-based
The firms in the sample are smaller than comparable theories. For both short-term and long-tern equations inU.S. finns, and the financial systems and regulations in most countries, the asset structure, liquidity, and industrythcse countries differ significanly from those in the effects have more explanatory power than firm size,United States. Not every country has well-functioning growth opportunities, and tax effectsliquid financial markets in which investors can diversify In several countries, total indebtedness is negativelyrisks. Nor do all countries have efficient legal systems in related to net fixed assets, suggesting that markets forwhich a broad range of property rights can be enforced. long-term debt do not function effectively.
This paper-a productof the Financeand Private Sector Development Division, Policy Research Department-is part of alargereffort in the department to study emerging stock markets. The sntuy was funded by the Bank's Research Support Budgct underthe research project "Stock Market Development and Financial Intermediary Growth" (RPO 678-37). Copies of the paper areavailable free from the World Bank 1818 H Street NW, Washington, DC 20433. Please contact Bill Moore, room N9-055,cxtension 35261 (38 pages). July 1994.
The Poliy Reearch Workig Paper s f lisdemnas the fhdig of work h proas to excowu the exdcang of ideas aboutdeelopment issues An obecte of dte seris is to get the findi Got qucy, ven if thepresoewatiouare kss than fidly polishe Thepapers cary the names of the asors ad shodd be usd ad cited accardingly. The findings, intepreations, and concusions are heauth'r own and sould not be attried to the Wordd Bank its Excuie Board of Diors or any of its menber counrie
Produced by the Policy Research Dissemination Center

Capital Stnrctures in Developing Countries:Evidence from Ten Couwy Cases
Ash Demirgui-Kunt Vojislav Maksimovic*
*Thc authors are at the Policy Research Department, The World Bank and the Universityof Maryland, College Park, respectively.
We thank Herb Baer, Jerry Caprio, Stijn Claessens, and Ross Levine for helpfulcomments. We are indebted to Sara Zervos for excellent research assistance and Bill Moore forhelp with the manuscript.
. .Introduction
There exists a large literature that describes and attempts to explain observed capital
structure choices in developed economies (see the survey by Harris and Raviv (1990). This
literature normally takes as given, first, the existence of well fimctioning liquid financial markets
in which investors can diversify risks and second, the existence of an efficient legal system in
which a broad range of property rights can be enforced. While appropriate for the analysis of
financing choices in the U.S., these assumptions are often not satisfied in other economies. In
many economies financial markets are at early stages of development: only a small proportion
of the risks is traded, the markets are relatively illiquid and heavily regulated. Little is known
about the effect of such conditions on the opfimal financing choices of firms.
In this paper we provide evidence on the capital structure choices of firms for a panel
of ten developing countries using annual data for 1980-1991. We describe observed financial
structure choices and compare them to U.S. financial structure choices. We ask whether models
of developed for United States institutions explain capital stucture choices in our panel of
developing countries.
While r.ar findings bear most directly on developing economies, they are of more general
interest. Models oFfinancial structure have been developed with the aim of explaining U.S. data.
They are based on U.S. institutions. Predictions often depend on specific assumptions about
institutional structure of these models. Testing the models with data from economies with less
developed financial markets and very different institutions provides a test of robustness of these
models. In this sense our paper can be viewed as a complement to the work of Bradley, Jarrell
3

and Kim (1984) and Titman and Wessels (1988) for the U.S., and Ragan and Zingales (1994)
for a sample of several developed countries.
The the paper is organized as follows. Section II discusses the principal differences
between the U.S. and the developing economies that we are analyzing. Section HII discusses the
theoretical framework. Section IV presents the empirical results and Section V concludes.
IOL Insttutions in Developing Countries
We investigate capital structure in Korea, Malaysia, Brazil, Mexico, Turkey, Jordan,
Zimbabwe, India, Thailand and Pakistan. We identify four broad reasons why developing
country capital structures may be different: differences in the level of economic and financial
development, institutional dlifferences, smaller firm size, and different tax treatment of debt and
equity.
A. Economic and Financial Develovment:
As shown in Table 1, the per capita GDP in these countries is much lower tha in the
U.S. It ranges from about 22.5% of the U.S. level in the case of Korea to justl1.9% in the case
of Pakdstan. These economies and their financial systems. differ in other significant respects from
that in the U.S. In this section we review some of these differences and discuss how they may
affect the firmn's capital structure decision.
One measure of market development is the ratio of market capitalization to Gross
Domestic Product, MCAP/GDP. As revealed in column (3) of Table 1, MCAP/GDP ranges
from 16. 1% in the case of Turkey to 70% in the case of Malaysia, with a median of 23 %. The
corresponding statistic for the U.S. is 74.5%. However, MCAP/GDP of most of the countries
4

in our sample is greater those in some developed countries, such as Germany and Italy (Pagano
(1993)). Thus, stock markets in most of the countries in the sample are consequential in their
economies.
Financial intenmediaries are another source of financing for corporatioDns. While it is
difficult to measure the development of finncial internediaries, it is likely that the availability
of financing is positively related to the size of financial intermnediary sector. Hence, the size of
the formal financial intermediary sector relative to economic activity has frequently been used
as a measure the finanial sector development.1 Column (2) of Table 1 lists the ratio of M3,
the liquid liabilities of the financial system, to GDP.' The Table reveals a wide variation iti our
sample. It reflects Jordan's role as a regional financial center and the relative sophistication of
Malaysia's financial sector.
Corporations' ability to rais external financing may be related to the stability ofT the price
level. Mean inflation f:ates over the sample period are listed in column (5). Our sample contain
countries with very high rates of inflation (Brazil, Mexico and Turkey) and very low rates
(Jordan and Malaysia). As expected, the inflation rate is negatively correlated with the ratio of
M3 to GDp. 3
B. Institutional Differences:
There are some significant institational differences between the financial system in our
sample of countries and those in the Uwited States. In capital markets, certai pricing decisions
'- See, for example. Goldsmith (1969) and McKinnon (1973).
2 Liquid liabilities arc mecasured by M3. which is defined as the currency held outside the banking systemplus demand and interest bearing liabilities of banks and nonbank fmiancial intermediaries.
3 The Spearman rank coefficient is -0f97.
5
are much frequently more heavily regulated, whereas there are often fewer protections for
investors. Table 2 summarizes some key institutional features of the markets in our sample.
A key deviation from U.S. practice is that with the exception of Brazil, Mexico and
Jordan, in all the countries in our sample there exist restrictions on the pricing or issue of bonds
or stocks. In some cases these restrictions are significant, particularly for new issues. For
example, during our sample period in Pakistan companies could not offer shares at above book
value (Mirza (1993, page 208)). Similar restrictions existed in India (Glen and Pinto (1994)).
In Malaysia, "looming over the entire industry is the feared Central Issues Committee" which,
among other powers, has the right to determine the prices of initial public offerings and which
may take up to six months to rule on a price (Seaward (1993), page 153)."
As revealed in Table 2, fimancial markets in our sample countries differ in the amount
of protection offered to investors. According to data compiled by the Intematonal Finance
Corporation, accounting standards are adequate or of internationally acceptable quality for all
countries except Jordan.' By the end of 1992 all the countries in the sample had a securities
commission or a similar- government agency. India, Korea, Malaysia Mexico and Zimbabwe also
have bond rating agencies.
Differences from U.S. practice are not confined to the regulation of capital markets.
Governments of the countries in our sample are in general more active in business affairs. Most
importntly, in some countries financial intermediaries are required to provide directed long-tenn
4Se Seward for an argumet tha thCapital Issucs Commitess pices of initial public offerings artificially low (page 152). Ritter
(1993) provides evidence that average underpricing of initial public offerings in Malaysia is 149%.
5 in some cases some requirements appear to be stricter han in the U.S In Malaysia the Central IssuesCommittee holds directors of newly floated companies rcsponsible for deviations of morc than 10% frem forecasts inprelisting prospectuses (Seaward (1993)).
6

credit to selected firms (see, for example Baer et al (1994) and their references).
C. Differences in Firm Size:
A further difference between the U.S. market and the countries studied here is in the size
of firms. As shown in Table 3, publicly traded firms in the U.S. are much larger than publicly
traded firms in our sample countries. Only in Korea does the average size of firms in the highest
quartile exceed the average size of firms in the lowest quartile in the U.S. At the other extreme,
in Zimbabwe, the average firm in the largest quartile is six times smaller than the average firm
in the lowest U.S. quartile. However, although these firms are small by U.S. standards, they
are large relative to their local economies. Hence, they may receive attention from local financial
communuities that U.S. firms of comparable size would not.
D. Tax Treatment of Debt vs. Eguity:
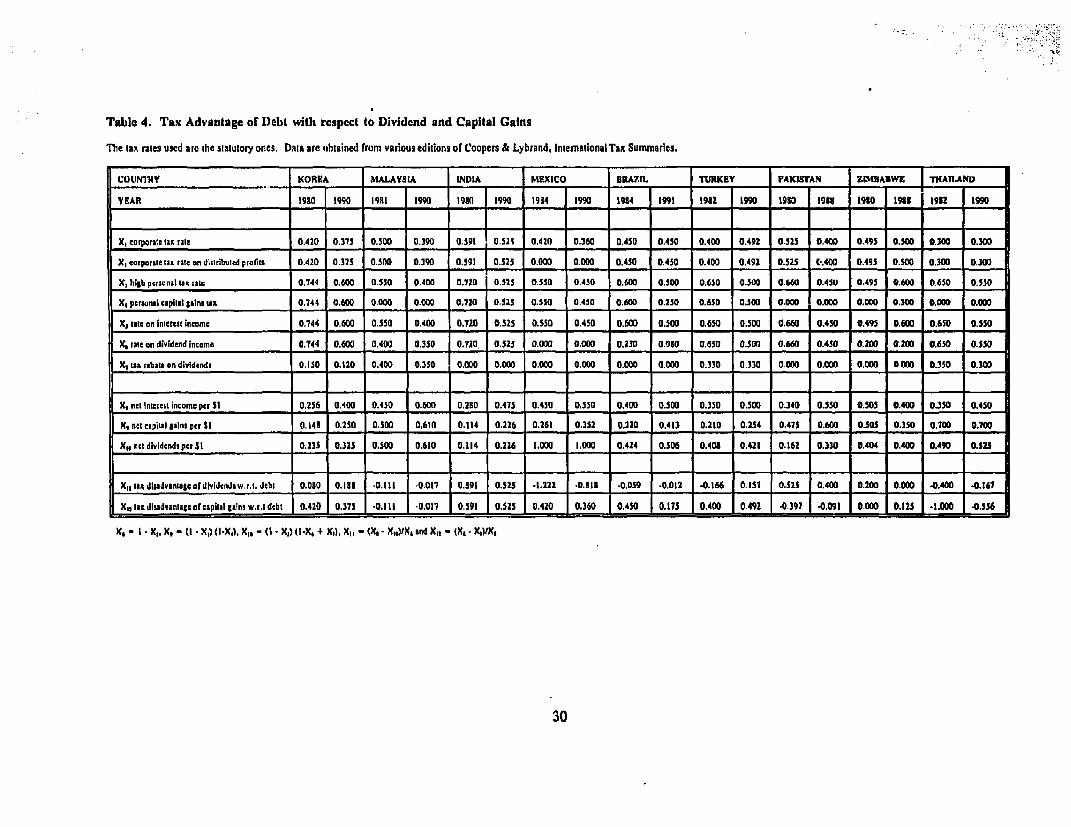
Table 4 summarizes the tax treatment of interest income, dividends and capital gains. In
most countries the personal income tax rates vary with income. To provide a consistent
comparison of tax levels across countries we have assumed that the marginal investor is a private
individual who is sufficiently wealthy to be paying personal income taxes at the highest rates.6
Using this benchmark, interest payments are clearly the most tax advantaged form of payment
in only two countries: India and Korea. In Brazil, Malaysia, Mexico, Pakistan and Thailand the
net tax burden is generally lower on equity income.
m. Detemiinants of Capital Structure
6 Rajan and Zingales (1993) make the same assumption in their comparison of tax burdens in a sample ofdeveloped economies. Similarly, when there exists multiple corporate tax rates we have assumed that firms face thehighest raze. Thresholds for the maximum rate are typically set very low.
7

In this section we fintroduce a framework for discussing the firmn's choice of financial
structure in developing economies. We review the existing literature on financial structure and
discuss its applicability to developing economies. The corporate finance literature has focused
on two broad determinants of capital structuire: agency theoretic explanations that stress conflicts
of interest between various stakeholders in the firm and explanations that stress tax consequences
of capital structure choices. We review each in turn and describe the variables that we use to
measure the predicted effects.
A. Agencv Teoretic Exuplanations of Capital Structure:
Severl distinct conflicts of interest that arise between the investors holding different
classes of securities have been identified in the literature. These conflicts arise because holders
of one class of investors (typically equityholders) act as agents for other investors and take
decisions that affect the value of the firm as a whole.' As a result, these investors have an
incentive to engage in opportunistic behavior that increases their payoffs at the expense of other
classes of investors and the firm as a whole.
The reduction in the firms value that results from opportuistic behavior by those in
-ontrol of a corporation is termed the agency cost of fiancing. If they are rational, the holders
of securities whose value is reduced by opportunistic behavior factor their expected losses into
the price that they are willing to pay for their securities. Hence, it is in the finns' residual
owners' interest to choose capital structe that minimizes agency costs, and thereby maximizes
the price at which each fiam's securiies can be sold. As a result of these choices, if agency
theoretic explanations are valid, the observed capital structure of each firm should depend on
'7 For example. die equiiyholders may make decisions chat alter the risldness of the firm's operations.
8

the potential for opportunistic behavior in that firm.
The potential for opportunistic behavior depends on the extent to which the agents'
actions affect value and the extent to which contracts that regulate actions can be written and
enforced. Thus, agency costs will depend on the firm's technology, development of financial
institutions and markets, the investors' incentives to monitor and the legal system in each
country, among other factors. The firm's optimal capital stnxcture will in general also depend
on these factors.
The corporate fmance literature has identified several conflicts of interest that arise in
many situations and analyzed fmancial structures that minimize them. The two most important
conflicts are between the firm's insiders and outside investors and the conflicts between
equityholders and debtholders.
The firms insiders frequently have opportnities to consume perquisites in ways that
cannot be easily monitored by outside investors. This creates a conflict of interest between
insiders and outside investors. This conflict can be mitigated in following ways:
* By issuing debt securities instead of equity the insiders can contractually commit
themselves to a prespecified level of payment to outside investors, thus reducing
opportunities for opporaunistic behavior.
* By issuing debt securities with shorter matuities the insiders commit themselves to
renegotiating the firm's financing at short intervals. This reduces their insiders to exploit
their creditors.
A second important conflict of interest is that between the firm's equity holders and the
9

firm's debt holders.' As leverage increases, the equityholders have an incentive to siphon funds
out of the firm through dividends and stock repurchases. This is because all the siphoned funds
go to the equityholders whereas the consequent reduction in the finn value is shared with the
debtholders. In addition, because the value of equity is a convex function of the. value of the
firm, as leverage increases equityholders have an incentive to select risky policies even if they
lead to decreases in firm value. The conflict between equityholders and debt holders can be
reduced by:
* Reducing debt levels in industries where the potential for opportunistic behavior is high.
* Securing long term investments with specific capital assets.
* Shortening the maturity of debt.
As the maturity of debt is a critical variable in agency models, we analyze the firm's
choice of long-term and short-term debt levels separately. Our measure of long term
indebtedness is the ratio of the book values of long term debt to total equity, LTDTE, and our
measure of short-term indebtedness, STDTE, is the rtio of the book value of short-term debt
to the book value of debt. The determinants of financial structure are:9
Asset Structure: The composition of the firm's assets affects its abilitry to commit not to
engage in opportunistic behavior. Fixed assets usually have collateral value. A finm with fixed
assets can issue secured debt, thereby limiting its ability to expropriate the debt-holders. Thus,
we expect firms with greater amounts of fixed assets to issue more long-term debt than finns
with fewer fixed assets. We use the ratio of net fixed assets to total assets, NFATA as our
e For a detailed analysis see Hart (1993).
9 We give below the interpretations of variables that we find most plausible. Additional interpretations of somevariables are possible, as in for example Tiunan and Wessels (1988).
10

.' lmeasure of the firm's asset structure. We expect that this ratio is positively related to LTDTE
and negatively related to STDTE.
In the absence of collateral, a greater degree of monitoring by creditors may be optimal.
Monitoring by creditors is facilitated by issuing debt with shorter maturity. Thus, we would
expect firms which do not borrow to finance fixed assets to have more short tenn debt. A
measure of the firn's financing needs, other than the need to finance fixed assets, is the Ratio
of Net Sales to Net Fixed Assets, NSNFA. Firms with a high ratio of sales to net fixed assets
have cost structures requiring more monitoring, and are therefore expected to have more short-
term debt and less long-term debt.
Leverage and Liquidity Constraints: Recent literature, following Myers-Majluf (1984) has
suggested that internal generated capital is cheaper for the firm than external financing. This
suggests that firms would finance internally first, and issue debt only when such low cost sources
of fmancing have been exhausted. We measure the finn's initial excess internal funds by
DIVCSH, the ratio of dividends paid out to shareholders to its cash flow available for
reinvestment: earnings after taxes plus depreciation. The higher this variable the less cash
constrained the firm is. Thus, we would expect both LTDTE and STDTE to be negatively
related to DIVCSH.10
An alternative variable that has been used to measure the firm's ability to generate capital
internally, by Titman and Wessels (1988) among others, is earnings before interest and taxes
over total assets, PROFIT. In studies of the U.S. economy this variable has repeatedly been
10 For some countries data on depreciation and eamnings after tax is not available. For hose countries we usethe ratio of dividends to total assets. DIVTA, to proxy for cash constraints.
11
found to be negatively correlated with leverage and we expect it to be similarly related to
financing choices in our sample.
Growh: As suggested by Myers (1977), equityholders in highly leveraged firms with
significant growth opportunities have incentives to adopt suboptimal investment policies. If this
agency cost is significant, we expect fast gro-wing firms to be financed with equity or with short-
tern debt. Our measure of growth is the rate of growth of real total assets, GROWTH. We
expect this variable to be negatively related to LTDTE and to be unrelated or positively related
to STDTE.
Firm Size: Thme is considerable evidence that firm financing patterns in developed
countries differ for firms according to size. Barclay and Smith (1993) have shown that size is
an important predictor of debt maturity in the U.S. and Baias and Hillion (1991) have shown that
the amount of short term credit is predicted by firm size. This effect may arise because access
to financial markets may be a function of firm size. Additionally, the amount of monitoring by
investors may depend on the liquidity of the market for the firm's equity, which, in tum, is
related to firm size-" We allow for these effects by segmenting our sample into quartiles by
size of total assets and icluding size dummies in our equations, SZ1-SZ4, where SZl denotes
the smallest quartile. An alternative size vaiable we also use is firm total assets to GDP,
TAGDP.
Firm Age: There are arguments supporting the prediction that younger firms will be less
indebted (Titman and Wessels (1988)). Younger firms have shorter credit histories which makes
it more difficult to judge their quality. Younger firms also tend to be riskier since they exit
As shown by Riuer (1987), there exist economies of scale in the issuance of equity.
12

more frequently. To test for thie age effect we cnst-~c twaaibe:teaeo h im
AGE, and a dummny variable, YOUNG, which t-ake the value one if AGE is less tha or equal
to five, and zero otherwise.
Indu~stry Classification: The pkoduct market structur and type of competitive interaction
across fi-rms differs from industry to industry. To the extent that capital structur affect the
incentives of firms to enter into imnplicit contracts with rivals (Maksimovic (1988)) or to maintain
reputations (Maksimovic and Titman (1990)), capital structures will differ systematically across
industries. To control for these industry effects, we include when available dummies for inLdustry
classification (at the 2 digit SIC code level)."2 These industry dummies may also pick up
differences in asset structure across industries that are not captured by NFATA and NSNFA.
Market 's Valuation of Equity: Our measures of the firm's capital structur, the ratios of
the book values of long-term and short-term debt to total equity, implicitly assume that book
values adequately measure the economic values used in determining the firm's capital structure.
However, book values do not directly measure the market's valuation of the firm's growth
opportunities. If the finn can borrow against the value of growth opportunities, firim's with
higher markcet valuations will have higher book value of debt to equity ratios (LTDTE and
STDTE).13 To contol for this we include the difference between the market's valuation of the
firm's equity and its book value, scaled by the book value, (MV-BV)IBV, as an explanatory
variable. We expect this variable to be positively related to LTDTE and STDTE.
B. Taxation and the Capital Structure:
Firms were classified into 2-digit SIC codes on the basis of descriptions of the firm's principal industry.
13 itis unalky thatdefirmn borrowagai its growth opporne in thesame way thatit an borrow
against fixed asse. For a discussion of these issues see Myers (197 and Hat and Moore (1991).
13

The second imnportant determinant of capital structure is the tax system. The fin-n's
financing choice affects. its tax liabilities because the total amount of taxes paid by the firm's
investors, at both the corporate and personal levels, differs accordinig to whether they bold equity
or debt securities. This differential treatment of investment income induces investors' preferences
for holding equity or debot securities. Firms attempt to satisfy these preferences by optimailly
altering their capital structur. Depending on the level of personal and corporate taxes, this
optimizing behavior by finns results in one of two outcomes.
First, if tax rates are such that one formn of financing (debt or equity) is unambiguously
tax advantaged, then there may exist an optimal debt-equity ratio for each firmn that minimizes
its total taxes and that depends on the firm's tax liabilities." Second, for some tax regimes the
aggregate supply of debt and equity securities in the economy may adjust so that individual
firms are indhfferent between issuing debt or equtity (Miller (1977h). In both cases individual
firms may have an incentive to chose low debt levels if they cannot utilize debt tax shields
(DeAngelo and Mastilis (1980)).
We examine the relationship between an individual firm's debt level and two measures
of non-debt tax shields, depreciation expanse over total assets, DEPTA, and estimated non-debt
tax shields over total assets, NDTS. Following Titman and Wessels (1988), we estimate the
latter as
NDTS = EBT - (EBT-EAT)/Tc
where EBT is income before taxes, EAT is income after taxes and Tc is the corporate tax rate.
14 This follows from the analysis of (Modigliani-Miller (1958)).
14

IV. Empirical Results
A. Discussion of the Data:
The data for this study were collected by the International Finance Corporation. The
description of the data set and the definition of each variable are given in the Appendix." The
means of the variables used in the study are shown in Table 5.
Inspection of Table 5 reveals that in every case for which we have data, the mean short-
term debt exceeds the mean long-tf.rm debt. India, Korea and Pakistan have the highest mean
levels of total debt and Brazil, Mexico and Zimbabwe have the lowest levels. These contrasts
are also shown by time series of aggregate levels of short-term, long-term and total debt by
country in Figure 1.
B. Regression Results:
In this subsection we examine the finnial capital structures of the firms in our sample.
We follow the literature, in regressing measures of capital structure STDTE and LTDTE on the
detenninants discussed above.16 In interpreting the results of the regressions it is necessary to
keep in mind that short-term debt and long-term debt are both components of total indebtedness.
In some cases theory predicts different determinants of long-term and short-term debt
25 We have deleted some observations from the data set when they seemed to contain obvious errors or topertain to situations not within the scope of this research. Thus, for example. observations which did not report fillfiscal year results were deleted. Likewise, observations which reported implausibly highly negative growth rates werealso eliniinated- Details arc available from the authors.
16 This is also consistent with the theoretical models on which the above list of capital structure determinantsis based. These models derive capital structure as a function oF given determinants. This suggests staistical tests inwhich the determinants are taken as exogenous. A more general approach would be to derive a strucural model offinancing in developing economies. Our approach may be viewed as an initial step towards that approach.
15

indebtedness: asset structure, for example, is predicted to affect each differently. In other cases,
only the total level of debt may matter: for example in shielding income from taxes. In the latter
case, the sign of any single component of debt may differ from that predicted by theory for the
total level of debt.'7
Consider first asset structure as a determinant of capital structure. Agency theory suggests
that firms with large fixed assets have a comparative advantage in obtaining long-term debt,
whereas finns with high sales relative to fix assets have a comparative advantage in borrowing
over shorter periods. This suggests that NFATA is positively related to long-term indebtedness
LTDTE and that NSNFA is positively related to short-term indebtedness, STDTE. By
implication, we expect that firms NFATA is negatively related to STDTE and that NSNFA is
negatively related to LTDTE.
Panels (a) and (b) of Table 6 reveals that of the eight countries for which we have data
on these variables (we do not have data on net fixed assets for Zimbabwe) the relationship
between NFATA and LTDTE is positive and significant at the 5% level or better in five of the
eight cases. The relationship between NFATA and STDTE is even more striking. In seven of
the eight countries the relationship is negative and significant- The only exception is Mexico,
where it is positive but not significant.
The signs of the coefficients of NSNFA also support the predictions, although they are
less clear cut. NSNFA is significant at the 5 % level or better and positively related to STDTE
in four cases. It is negatively related in only two cases, and they are not statistically significant.
" We have rerun the regressions reported below, normalizing debt with total assets instead of total equity.The general conclusions are unaffected.
16
Taken together, these results offer strong support for the prediction that finms with large
amounts of fixed assets have a comparative advantage in borrowing over the long-term. They
offer more qualified support for the proposition that firms with high ratios of sales over net fixed
assets have a comparative advantage in short tenn borrowing.
The finding that finns with large net fixed assets have a comparative advantage in long-
term borrowing does not imply that such firms have a comparative advantage in long-term
borrowing over equity financing. Panel 6(c) shows the results of the regression of total debt on
total equity, TDTE. NFATA in the TDTE equation is significant and negative in four cases and
significant and positive in one case, that of Mexico. NSNFA is significant and negative in two
cases. It is also significant and positive in two other cases. These results imply that, if anything,
firms with more fixed assets have less total debt than fims with fewer fixed assets. This finding
is counterintLutive in a partial equilibrium framework that abstracts from the state of
development of the market for credit- However, it may be explained as discussed by Shleifer and
Vishny (1992) and Worthington (1994), if asset specificity reduces the coliateral value of fixed
assets, or if the market for long-term debt financing in the sample countries is less developed
than the market for equity fmancing.'8
Next, consider the effect of the firms cash flow on its capital stmcture. Our preferred
measure of excess funds, DIVCSH is available for five of the nine countries. Of these five cases
it is significantly related to STDTE in three instances. The relationship is negative in all these
cases. DIVCSH is significandy related to LTDTE in three instances, all of them negatively so.
For four countries we do not have information to calculate DIVCSH. In three of these
3- This would be the case, for example, if properLy rights of long-term debt-holders are cosdy to enforce.
17

cases (Brazil, Jordan and Turkey) we proxy for excess cash flow by using the ratio of dividends
to total assets, DIVTA.19 Four of the six coafficients have the predicted negative sign.
However, only one, in the STDTE for Turkey is it statistically significant.
Inspection of Table 6 reveals an even stronger negative relationship between profitability
and leverage. PROFIT is negatively related to STDTE for all nine countries (eight of them
significantly) and also negatively related to LTDTE in eight of the nine countries (five of them
significantly).2Y The exception is Pakistan, where PROFIT is positively, but insignificantly
related to LTDTE. However, even in the case of Pakistan there is a significant negative
relationship between PROFIT and STDTE.
The signs of the liquidity and profit variables, DIVCSH, DIVTA and PROFIT, in the
TDTE equations are also consistent with a negative relationship between profitability and
leverage. The signs are significant three, two and eight times respectively and are uniformly
negative when significant.
Taken together, these results point to a strong negative relationship between internally
generated resources and indebtedness - profitable firms and firms that make large payments to
equityholders borrow less. In conjunction with the fmding above that finrs with high net fixed
assets do not take advantage of their asset structre to borrow more in total, perhaps as a result
of monitoring issues identified above, this suggests that a lack of liquidity, may be an important
determinant of debt financing in the sample countries.
21 This variable measures the ratio of cash paid out to equityholders to total assets. Thus, it is a less accuratemeasurc of the firm's voluntary payouts to cquityholders than DIVCSH, which measures the proportion of available cash-flow paid out.
20 For Jordan and Mexico profit is defined as EBT instead of EDIT. Therefore, the nregative relationship isbuilt in.
18
-A' :
The relationship between the rate of growth and leverage is weak but consistent with
predictions of agency theory, in particular Myers (1977). The theory predicts that fast growing
firms will issue short term debt in preference to long term debt in order to align the incentives
of equityholders and bondholders. For six of the nine countries in our sample the coefficient of
GROWTH in the equation explaining STDTE is positive. It is only statistically significant in two
of these cases. The coefficient is not statistically significant in either of the three cases in which
it is negativc. In the equation explaining LTDTE the pattern is even weaker. Only one of the
four positive coefficients is significant. One of the five negative coefficients is also significant.
The results for the TDTE equation are equally inconclusive: the coefficient of the growth
variable is more mixed: it is positive and significant in two of the four cases and negative and
significant in one.
The excess of market valuation to book valuation (MV-BV)IBV is predicted to be
positively related to STDTE and LTDTE.2' We have market value data for five countries.
Inspection of Table 6 shows that for all five the coefficient of (MV-BV)/BV is positive in the
STDTE equation. It is statistically significant in three of the five cases. For four out of the five
cases the coefficient of (MV-BV)/BV is positive in the LTDTE equation. However, it is only
signifcant in two of these cases. The results for the TDTE equation are similar: the coefficient
of (MV-BV)/BV is positive in each case, but is only significant in two of these cases.
Tax effects are measured by two variables. The most direct measure is the estimate of
the firm's non-debt tax shields, NDTS. Theory predicts that debt and non-debt tax shields are
21 More preisely, this variable is predicted to be positively related to dte debt level, not necessarily to eachof the components of indebtedness.
19
substitutes. The coefficient of NDTS in the STDTE equation is significant in four instances. It
is negative in each case. In the LTDTE equation the coefficient is negative in five of the eight
cases, but is significant in only two. Similarly, the coefficient of NDTS is negative in seven out
of the eight cases in the TDTE equation. However, it is significant in only three cases, and for
Mexico the coefficient is positive.
The other measure of non-debt tax shields is DEPTA, depreciation over total assets. Data
are available for five countries. Inspection of Table 6 rcveals that the coefficient of DEPTA in
the STDTE equation is significant (and negative) in three of the five cases. It is significant and
positive for only Malaysia. The relationship between LTDTE and DEPTA is significant only in
the case of Kprea, where it is negative.
Turning to the size dummies, the coefficient of SZ4 in the LTDTE equation is positive
and significapt in five of the nine cases (it is insignificant in the other four cases). The
coefficients for SZ2 are predominantly negative and all three of the significant coefficients are
negative. This suggests that largest firms find it easier to obtain long term financing compared
to smaller firms which find it more difficult. There is no similar pattern in the STDTE equation.
When we substitute size dummies with. total asset size to GDP, TAGDP, in the LTDTE equation
the coefficients are positive for seven out of nine countries and significant in four of them. The
results of the STDTE are mixed.
Finally, our age variables do not have significant coefficients in any of our regressions.
One reason for this is that the firms in our sample tend to be mostly older, over ten years of
age.
In our equations we have included industry dummies. This specification is consistent with
20

methodology used in previous cross-sectional studies of capital structure such as Bradley, Jarrell
and Kim (1984) and Titman and Wessels (1988) for the U.S. The inclusion of industry dummies
is also motivated by the considerable theoretical literature that predicts industry effects.22 In
order to investigate the effect of including industry effects we have reestimated the equations
reported in Table 6 without the industry dummies and with individual firm dummies replacing
the industry dummies.
T.he two alternative specifications have differing implications for the interpretation of the
regression equations. The specification without the industry dummies risks attributing to the
variables included in our study differences in capital structure across industries that are caused
by omitted variables. By contrast, if individual firm dummies are included, then the explanatory
power of variables de ining firm level results may be reduced because differences in firms'
capital structures are "explained" by firm specific dummies.
When industry specific dummies were dropped, R2 coefficients fell. However, the
nmber of significant coefficients increased.23 By contrast, including firm specific dummis
alters the results to a greater extent. Whereas the R2 coefficients increase, some of the
explanatory variables lose significance. In a few instances, particularly that of India, Brazil and
Turkey more variables become significant. The significant variables retain their signs.
22 Theoretical models by Tian (1984), Maksimovic (1988), Maksimovic and rrm (1990) and otherspredict industry effects. Empirical evidence on industry effects is provided by Chevalier (1993) and Phillips (1994)-
23 For example the GROWTH coefficientwhich had been insignificant become positive and significant in tWo
instances in the LTDTE equation (Malaysia and Turkey) and one instace in the STDTE equation (Brazil). The mostinterestng case was chat of (MV-BV)IBV, which gains significance in the STDTE equation in two instances (India andMalaysia). In the LTDTE equatioD (MV-BV)/BV lost significance in one case aIndia) and gained in another (Zimbabwe).
21

Our sample also includes few, publicly controlle enterprises.2 However, excluding
them from the sample does not alter the results significantly.
C. Relative Exnlanatorv Power of Different Determinants of Calpital Structure:
In this section we analyze the relative importance of different determinants of capital in
explainig the variation in debt levels for each country in the sample. We compare the
explanatory power of regressions that include all the variables identified above as determinants
of financia capital structur with regressions in which some variables are deleted. The difference
in explanatory power provides a measure of the importance of the deleted variables in explainig
sample variation.
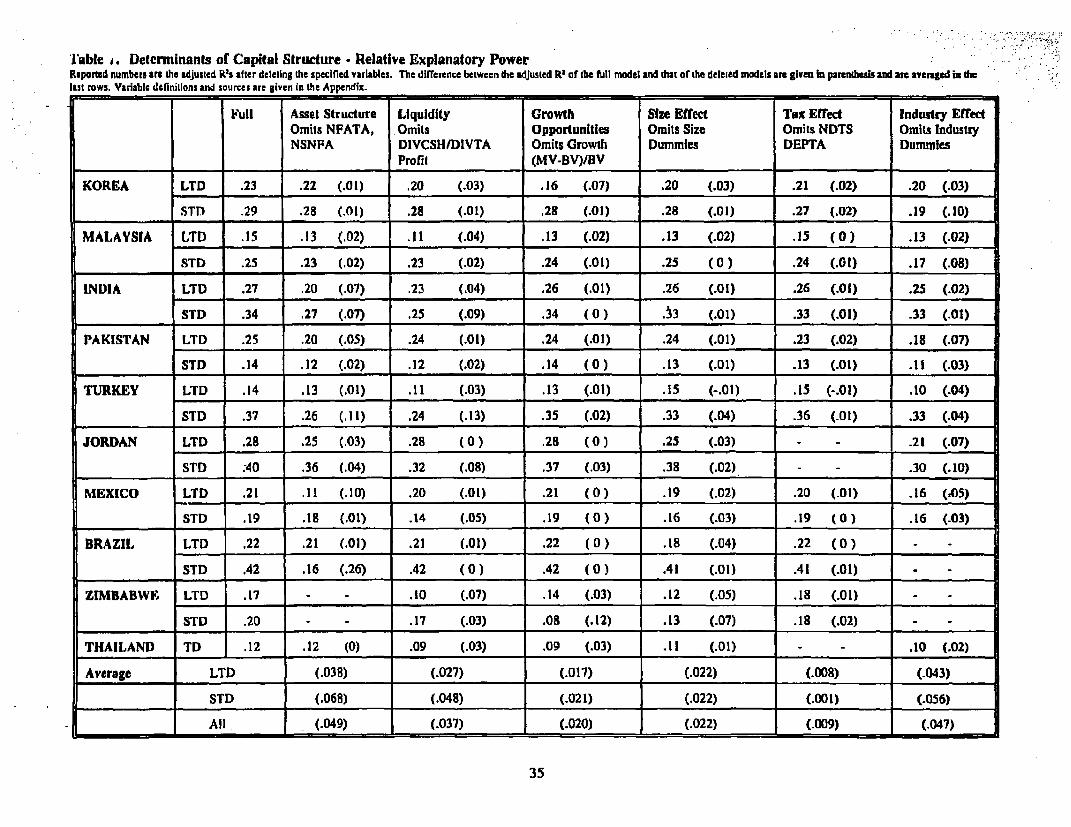
Table 7 presents the decomposition of RI for short-term and long-term debt in each
country in the sample. In accordance with the discussion above, the dtrinants of capital
structure are classified into asset structure, liqidty, growth opportunity, size effect, tax effect
and industry effect variables.
Inspection of Table 7 reveals that the rankings of the avenage explanatory power of all
the variables are very similar for short-term and long-term debt equations (last three rows), the
only difference being in the relatve importance of industry effects and asset structure. In both
of the debt equations the industry effects and the asset structur composition have the greatest
explanatory power, followed by liquidity effects, the size effect, growth opportunities and
taxes.2 This is consistent withi an inspection of individual country results, in which asset
24 One in Korea,threin TUrkey,nand onein Mexico.
2X if Brazil is omitted from short-term averages idustry effects still have the grtest explaatory power.
however thqUisiy effect becomes moe imporn th ran asset satucture.
22
structur and liquidity variables, together with industry effects usually have more explanatory
power tha growth opportuiWties, size effects and tax effects.
All the variables with the exception of the tax and size effects have on average more
explanatory power in the short-term than in the lor.g-tcnno debt equations. One interpretation of
these results is that in our sample markets for short-term financing may be functioning better
tha markets for long term capital.
V. Concusions
In this paper we have tested agency theoretic and tax-based explanations of capital
structure choice on data from a panel of developing countries. In these countries financial
markets are underdeveloped and much more heavily regulated than in the U.S. The fimns in the
sample are much smaler than U.S. fims on which financial structure models are usually tested.
Tax treatment of debt and equity also vary considerably in each country.
Despite these differences, both the agency theoretic and tax-based models of capital
structure predicted capital stuctures in our sample well. Net fixed assets are positively related
to long-term debt and negatively related to long-term debt. More profitable fims and firms that
are making large payouts to shareholders have less debt. Firms with high market to book ratios
have more debt. Finns with high non-debt tax shields have less debt.
interestingly, total indebtedness is negatively related to the ratio of net fixed assets to
total assets. Thus, even fims with assets that could serve as collateral, finance themselves by
retned earnings or equity issues rather dt by issuance of long-term debt. This suggests that
23

markets for long-term credit do not function effectively in several countries in the sample.
A comparison of the relative explanatory power of the determinants of capital structure
shows that for both short-term and long-term equations in most countries the asset structure,
liquidity and industry effects have more explanatory power tha firm size, growth opportunities
and tax effects.
The explanatory power of theory in our sample is quite strong when compared to Titman
and Wessels' (1988) study using US data. This may be in part due to differences in market
efficiency and the legal systems. If alternative contractal means of resolving agency conflicts
are not avaialable, then the relationships derived from simple agency-theoretic models are more
likely to have empircal validity.
In this paper we focused on fim level differences in capital structure within each
country. In our fuiture work we will investigate cross-country differences in capital structure in
greater depth.
24

References
Baer, H.L., Caprio, G., Demirguc-Kunt, A. and D. Vittas, 1994, Termn finance: Theory andEvidence, World Bank mimeo.
DeAngelo, H. and R. Masulis, 1980, Optimal capital structure under corporate and personalLaxation, Journal of Financial Economics 8, 3-29.
Diamond, D., 1991, Debt maturity structure and maturity risk, Quarterly Journal of Economics106, 709-737.
Glen, J. and B. Pinto, 1994, Debt or equity? How developing country firms choose, IFCmimeo.
Harris, M. and A. Raviv, 1991, The theory of capital structure, Journal of Finance 46, 297-356.
Hart, 0., 1993, Theories of optimal capital structure: a managerial perspective, in Blair M.(ed.), The Deal Decade, (The Brookings Institution, Washington DC)
Hart, 0. and J. Moore, 1989, Default and renegotiation, a dynamic model of debt, MITDepartment of Economics Working Paper No. 520.
Bradley, M., G.A. Jarrell and E.H. Kim, 1984. On the existence of an optimal capital structure:theory and evidence, Journal of Finance 39, 857-877.
Maksimovic, V., 1988, Capital structure in repeated oligopolies, Rand Journal of Economidcs 19,389-408.
Maksimovic, V. and S. Titman, 1990, Financial policy and reputation for product quality,Review of Financial Studies 4, 175-200.
Mirza, K., 1993, Pakistan: A small market with potential, in The World's Emerging StockMarkets, edited by Keith K. H. Park and Antoine W. Van Agtmael, Purbus Publisiing Co.,Chicago, Illinois.
Myeras, S., 1977, The determinants of corporate borowing, Journal of Financial Economics,147-76.
Myers, S., and N. Majluf, 1984, Corporate fmiancing and investment decisions when firms haveinformation that investors do not have, Joural of Finanaial Economics, 187-221.
25

Pagano, M., 1993, The flotation of companies on the stock market, European Economic Review,1101-1125.
Park, K. and A. Van Agtmail, 1993, The World's Emerging Stock Markets, (Probus, ChicagoIL)
Rajan, R. and L. Zingales, 1994, Is there an optimal capital structure? Evidence frominternational data, University of Chicago mimeo.
Seaward, N., 1993, Malaysia, in The World's Emerging Stock Markets, edited by Keith K. H.Park and Antoine W. Van Agtmnael, Probus Publishing Co., Chicago, Illinois.
Shleifer, A. and R. W. Vishny, 1992, Liquidation values and debt capacity; A marketequilibrium approach, Journal of Finance, 47 (4), pp. 1343-1366.
Titman S. and R. Wessels, 1988, The determinants of capital structure choice, Jounal ofFinance, 1-21.
Worthington P., 1994, Investmcnt, cash flow, and sunk costs, Federal Reserve Bank of Chicago,mimeo.
26

LTDTrE LTDrTE LTDITE
- __DCO m t:> _ cm C." D
10 -0
CD ~~~~~~~~~~ C2
CD
-~~~~~~~~~~~~~~~~~~~~~~~~~~~~~~~~~~~~~~~~~~~~-LE I TDtTE ID
- -~ E - L
m rn~
- ,,, ,I _ r _ C _CD~~~~~~~~~~~C
- , - mX~~-
Kl- ~ ~ ~ 0
LTnrrFE LTD/TE LTD/TE> coCD ~~~~~~~~CD -
CD ~~~~~~~~~~o;
0~~~~~_ _
| _ H
m- mt2 LOTELT1E TDTI .U
*~ I
_~~~~~~ _
CD CD.~~~~~~~~~~~~~~~~~~~~~~~~~~~~~~~~~~~~~~~~~~~~~~~~~~~~~~~~~~~~~~~ >-
0~~~~~~~~~~~~~~~~~~~~~~~~~~~~~~~~~~~~~ '

STDITE STD1TE STD.JTEo a' c o o'
_ -
o 0.~~~~~~ Co . o_ o .a'- h- -
,~~~~~~~~~~~~~~C _
m co- 10
>S , :>eCO >~
c ~~~-u a a
m ~ ~ ~_ ___ >10~ ~ ~ .
-~~~~~~
STDrrE STD/TE STDITEe- , o va e -
CD . ' -n 5
10. * t G
cm cm CC)
r-j-~~~~~~~~0~
c~~~~ _
_ M_ m- CDC-
M~~ ~ cm
STDITE STDITE ST D/TE
o u. 0 01 o cn
10. _D aCD -
C) , cm CD -
10C. M1C co
C.LI~~~~~~~~~C
0- 0- 0- u.m
-~~~~~~~~~~~~~~~~~~~~~~~~~~~~~C
m ~~ ZI :1- m z m'10~~~~~~~~~~~~~~~
> tD-> cm > g° _
UZ~~~ 0 *w
10 * m -~~~~~~~~0-
o ; ~~~~~~~~o o
LO ~~~~~~~~~~~~~~~~~~~~10C
m _ - ^ :
0-~~~~~~~~~~~~~~~~~~~~~~~~~~~~ 0-;*~~~~~~~~~~~~~~~~~~~~~~~~~~~~~~~~~~~~~~~~~~~~~~~~~~~~~~~~~~~~
0..~~~~~~~~~~~~~~~~~~~~~~~~~~~~~~~~~~~~~~~~~~~~~~- ..0
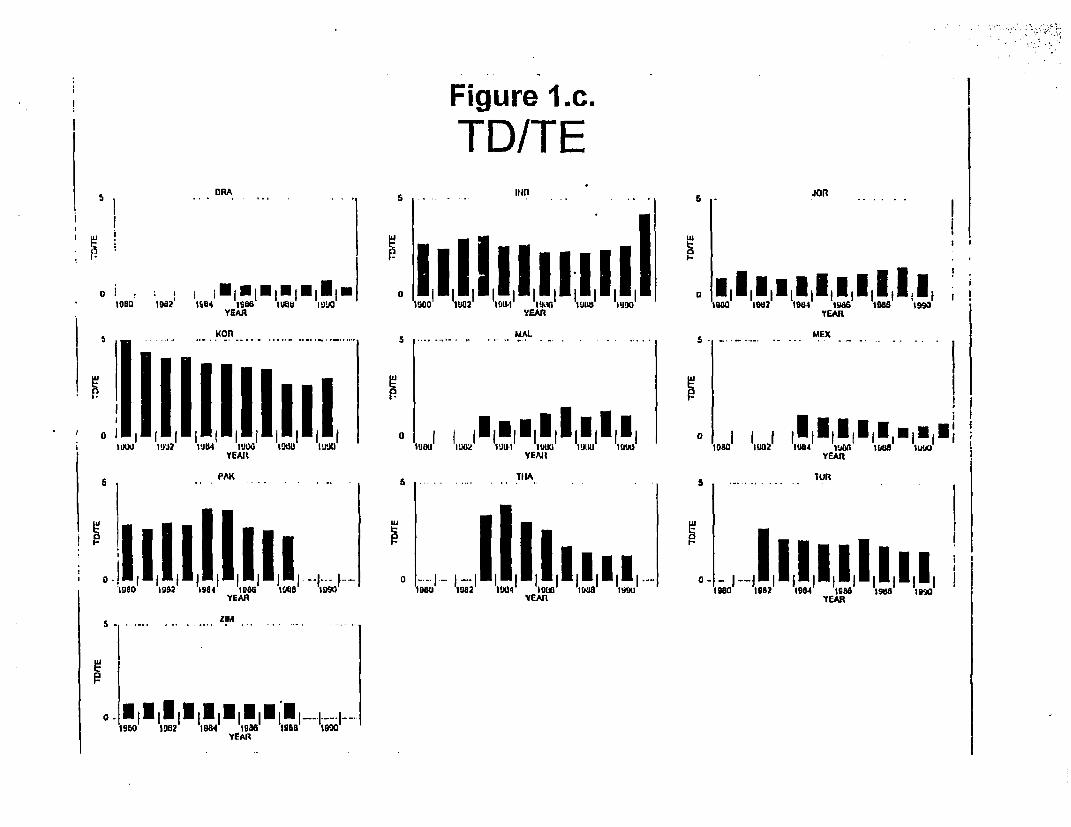
Figure l.c.
TD/TENO .io_n
D 141
* 9950 1982 10Z4 1986 luau I84 g0100 I02 1109t hI'Ji 10 IUW 980 92 IOU 1 98 199YEAR YEAn YEAR
... .. .. . . 5 ..... .... . . . . 5 ,MEX
5
IiLI 112 911 11). 013 919 0 Iil 01f~911 110 11W 914 ,
IV IIJU 1ll lll lll0 I--luau 1-0l52 ll-I 4ll l LllI lEri-- 0--1- 1942 I4 iuv IDWl§lllI
YEAR YEAA YE58 t A R 9 S
PAK TIIA. IJR
°- 10|||||lit-1-o-
ODO0 9982 998 9988 1go 990 19 132 4 9095i 91138 9900 9980 9982 9989 9966 19998 1999YEAR YEAn TEAR
ZIMt
-.980 9952 998 19aa 1965 199
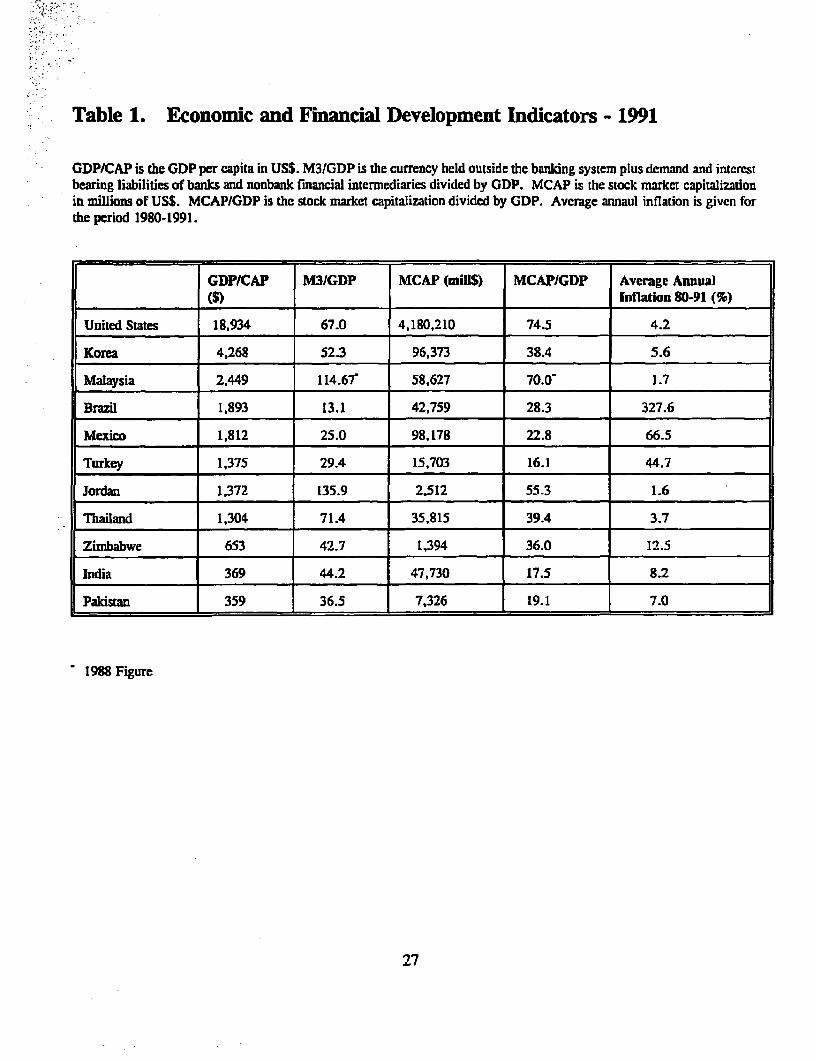
Table 1. Economic and Financial Development Indicators - 1991
GDP/CAP is the GDP per capita in US$. M3/GDP is the currency held outside the banking system plus demand and intcrestbearing liabilities of bznks and nonbank financial intermediaries divided by GDP. MCAP is the stack market capitalizationin millions of US$. MCAP/GDP is the stock market capitalization divided by GDP. Average annaul inflation is given forthe period 1980-1991.
GDPe CAP M3JGDP MCAP (tie$) MCAP/GDP Avemage Annual___________ ($) Inflation 80-91 (%)
United States 18,934 67.0 4,180,210 74.5 4.2
Korea 4,268 52.3 96,373 38.4 5.6
Malaysia 2.449 114.67' 58,627 70.0' 1.7
Brazil 1,893 13.1 42,759 28.3 327.6
Mexico 1,812 25.0 98,178 22.8 66.5
Turkey 1,375 29.4 15,703 16.1 44.7
Jordan 1,372 135.9 2.512 55.3 1.6
Thailand 1,304 71.4 35,815 39.4 3.7
Zimbabwe 653 42.7 1.394 36.0 12.5
India 369 44.2 47,730 17.5 8.2
Pakistan 359 36.5 7.326 19.1 7.0
1988 Figure
27
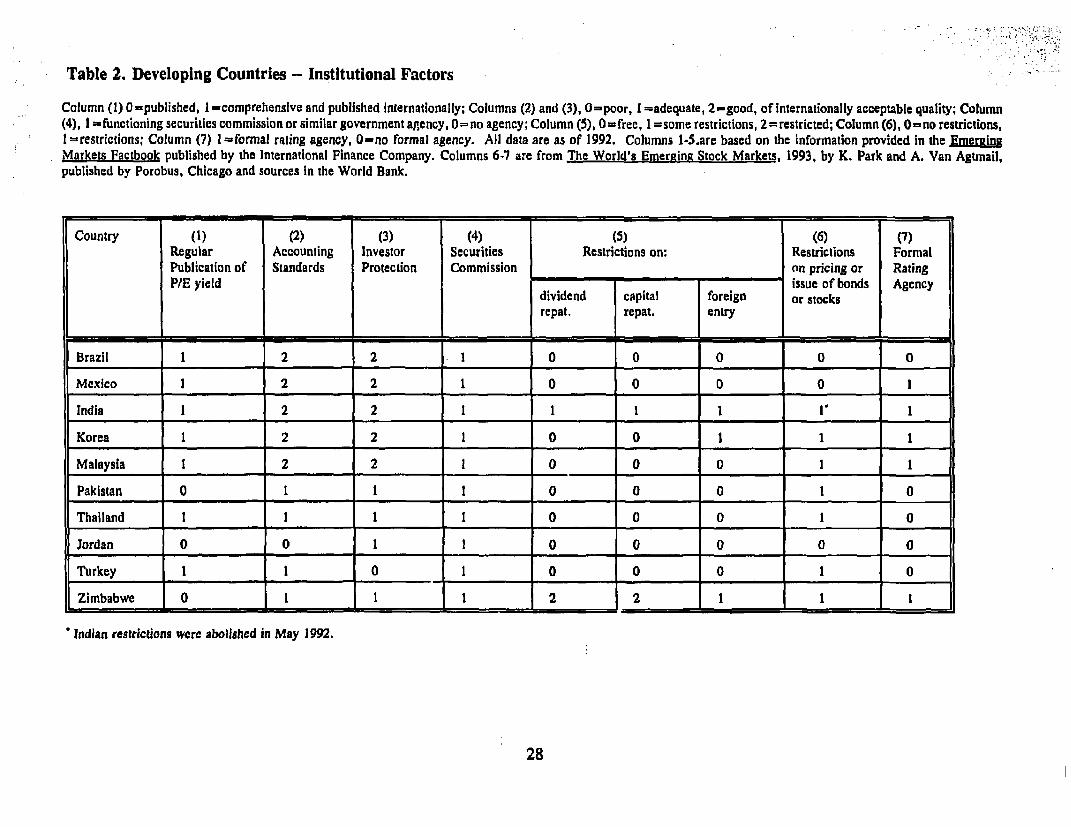
Table 2. Developing Countries -- Institutional Factors
Column (1) 0=published, I =comprehensive and published internationally; Columns (2) and (3), 0-poor, I =adequate, 2=good, of internationally acceptable quality; Column(4), 1 -functioning securities commission or similar government agency, 0=no agency; Column (5), O=free, I =some restrictions, 2=restricted; Column (6), O=no restrictions,I -restrictions; Column (7) 1 =formal rating agency, 0-no formal agency. All data are as of 1992. Columns 1-5.are based on the information provided in the EmerainEMarkets Factbook published by the International Finance Company. Columns 6-7 are from The World's Emerging Stock Markets, 1993, by K. Park and A. Van Agtmail,published by Porobus, Chicago and sources In the World Bank.
Country (1) (2) (3) (4) _ (5) (6) (7)Regular Accounting Investor Securities Restrictions on: Restrictions FormalPublication of Standards Protection Commission on pricing or RatingP/E yield i issue of bonds Agency
Idividend capital foreign or stocksrepat. repat. entry
Brazil 1 2 2 I 0 0 0 0 0
Mexico 1 2 2 1 0 0 0 0 I
India 1 2 2 I 1 1 1 I
Korea 1 2 2 1 0 0 1 1 1
Malaysia 1 2 2 1 0 0 0 1 1
Pakistan 0 1 1 1 0 0 0 1 0
Thailand I _ I 1 0 0 0 I 0
Jordan_ _ _ _ __ 0 0 0 0 0Turkey I I ° 1 0 0 0 1 0
Zimbabwe 0 1 I 2 2 11
Indian restrictions were abolished in May 1992.
28
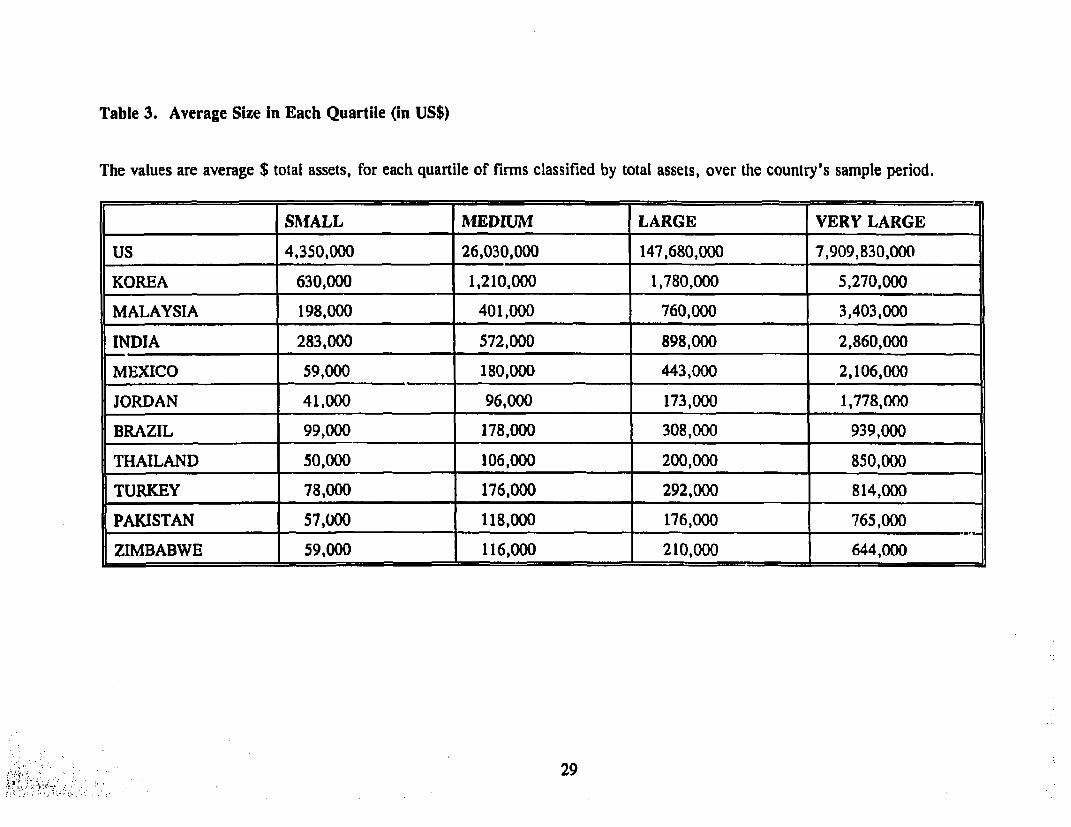
Table 3. Average Size in Each Quartile (in US$)
The values are average $ total assets, for each quartile of firms classified by total assets, over the country's sample period.
SALL AIEDIUM LARGE VERY LARGE
US 4,350,000 26,030,000 147,680,000 7,909,830,000
KOREA 630,000 1,210,000 1,780,000 5,270,000
MALAYSIA 198,000 401,000 760,000 3,403,000
INDIA 283,000 572,000 898,000 2,860,000
MEXICO 59,000 180,000 443,000 2,106,000
JORDAN 41,000 96,000 173,000 1,778,000
BRAZIL 99,000 178,000 308,000 939,000
THAILAND 50,000 106,000 200,000 850,000
TURKEY 78,000 176,000 292,000 814,000
PAKISTAN 57,000 118,000 176,000 765,000
ZIMBABWE 59,000 116,000 210,000 644,000
29
.u.
Table 4. Tax Advaniiage of Debt with rcspect to Dividend and Capital Gains
The fix rates used arc the slalulory onies. Data are obtained from various editions of Coopers & Lybrand, InlemalionalTax Summaries.
COUN1fY KOREA lUAYSIA INDIA . NEXICO BRA7.L TIURKEY PAKISTAN Z IM-AUWKr THAnAND
YEAR 1910 1990 1911 1990 1980 1990 1914 1990 19U4 1l9 19e2 1 I990 1980 19185 190 1983 19S2 1990
XI corporate tax rate 0420 0.3175 0.500 0.390 0.391 0.52i 0.420 0.360 0.450 0.450 0.400 0.492 0.525 0.400 0.495 0.500 0.300 0.300
Xl corporte tax rate on distributed profltS 0.420 0.375 0.500 0.390 0.591 0.55 0.00 0 000 0.450 0.450 0.400 0.492 0.525 1.400 0.495 0.500 0.300 0 300
XI high pcracnal tax tate 0.744 0.600 0.350 0.400 0.720 0.325 0.530 04.0 0.600 0.300 0.630 0.500 0.660 0.450 0.495 0.600 0.630 01i50
X, pOfaufal capitIz gains u; 0.744 .000 0.000 0.000 0.720 0.52S 0.510 0 450 0.600 0.250 0.650 0.500 0.000 0.0W 0.000 0.300 0.000 0.000
Xs mate on interst income 0.744 0.600 0.550 0.400 0.720 0.525 0.550 0.450 0.600 0.500 0.650 0.50a 0.660 0.450 0.495 0.600 0.650 0.550
X4 rate an dividend Income 0.744 0.600 0.400 0.350 0.720 0.525 0.oo 0.000 0.230 0.010 0.850 0.S00 0.660 0.450 0.200 0.200 0.650 0.5S0
XI tax tel ate en dIvidendr 0O.50 0.120 0.40D 0.550 0.000 0.000 0.000 0. 000 0.000 0.00 0.330 0 330 0.000 0.000 0.000 0000 0.350 0. 300
X. net intetcll income per Sl 0.255 0.400 0.450 0.600 0.230 0.475 0.410 0.5510 .400 0.500 0.350 0.500 0.340 0.550 0.505 0.400 0.350 0.*50
X, net capital salns per SI 0.141 0.250 0.500 0.610 0.114 0.226 0.261 0*352 0.230 0.413 0.210 0.254 0.475 0.600 0.505 0.350O 0.70W 0.70
X, el dividendspef SI 0.235 01S 0.500 0.610 0.114 0.226 1.00a I W 0.414 0.506 0.405 0.421 0.162 0.330 0.404 0.400 0.490 0.525
XI1 taediaa2vanialeofdividenoJaw. r.t. Jeh 0.0S0 0111 *0.111 *0.017 0.591 0.515 -1.222 .0.116 0.D59 *0.012 *0.166 0.157 0.525 0.400 0.200 0.000 .0.400 -0.167
X31laxdindvantageadcspitalgainsw.r.tdclbt 0.420 0.375 .0.111 *0.017 |0591 0.52$ 0.420 0.360 0.450 0.17S 0.400 0.492 .0.397 40.091 0.0o 0.125 -1.000 4.5*6
XII - I - X,. X - (I *-X, (I(4). X's - (- X XJ) (I.X + XI). XC - (X, - X5)/XI krid XI, - (XI - XJYX.
30

able S. Capital S4ructure - Descriplive Satistics by Country
LTD\TE ii hb book value of lonSg ter debt divided by book valu of equity. STDITE and TDITE& re the book value of short itan and otal debt divided by book value or equity. NFATA is the nct fixed aaseu divided bylotl ssets. DIVCSH Is the dividends divided by eamings afer Laxes plus deprecialion. DIVTA Is the dividerds divided by total ssets. GROWTH Is the growth te oo teal total assets. PROFIT is the incone beforc interestend taxcs divided by lotal ssets. (MV*RV)IBV is the market vAlue of equity minus book value of equity divided by book value of equity. NSNFA Is the net sales divided by net fixed *as.t NDTS is the nond :bt tas shieldwhich Is earnings before Uxes minus thc tatlo of corporate taxes paid to corporate taic rate, dclated by otalI assets. TA/GDP Is total Assets divided by the GDP of the eountry. Te value of each item is calculated as dttaverage of all lirms for tach country's sample period. Extended variable definitions and sources are given in the Appendix.
LTDITE uTrnrr TDrTE NFATA DEPTA DIVCSII DIVTA GROWFH PRtOFIT MtV-DY NSNFA NDTS TAIGDP
ERAZII. .139 .421 .560 .640 .002 .170 .057 - 1.164 517 -
friA .745 1i350 259S .411 .039 .193 .01e .109 .132 .135 5.691 023 .0006
JORDAN .274 MM 1.180 .469 . .032 .077 .065 .439 2 760 oOS7
KOREA 1.05E 2.391 3.449 .371 .053 .122 OD18 .104 .100 -.21S 4 336 002 .0023
MALAYSIA .278 .833 1.111 .465 .023 .350 .024 .170 .035 1.24? 3.025 003 .004t
MEXICO .401 .417 .818 .569 .034 .079 - 1.463 .013 -
PAKISTAN .596 2.359 2.955 .334 .03E .232 102 .010 .115 11.144 055 .0011
lURKEY .4S5 1.509 1.994 .415 - 068 .080 .238 4 231 010 .0010
ZINIMADWE .187 .615 .802 .031 .260 .028 .034 .131 -.437 033 0062
THIAIILAND = 2.332 .398 = .041 .223 2.021 5.310 0007
31

Table 6.a. Capital Structure In Developing Countries -LTD/TE
Estimated model is: LTDITR - e + p, SZ + I, IN + aJT + 0, NPATA + Os DEPTA + 5. DIVCSH (or DIVTA) + 5, GROWTH + 0, PROFrT + 0, (MV-BVIBV) + P, NSNFA + 0, NDTS e. tedependent vaiiable Is long term debt to cquit ratlo. Definitions of Independent variables are given ins ihe appendix. Regression is estimated usinB Ordinary Least Squars. Not repaited below are secgor(IN) adyear (T) dummy variablcs. White's heseroakedasticity-corrmced standard errors are giYCn in parenthesls. and * indicate dial ihe coetficilent i signinleanly different frm seto at I and 5 pereent levels respectely.
KOREA MALAYSIA INDIA MEXICO JORDAN BRAZIL TURKEY PAKISTAN Z[MBABRWE
NFATA 1,498" -.310 1.704" 6.146" .617" -.112 .297 1.992"(.409) (.176) (.233) (2.247) ( 195) (.060) (.402) (.462)
DEFrA -7.382" -.916 -1.301 -2.023 -.068(1.192) (1.526) (1.097) (1.327) (.787)
DIVCSH -.735 .033 -1.355" -.547" -.27t"(.528) (.027) (.564) (.154) (.086)
DIVTA .389 -.607 -1.175_____________ (.872) (.696) (,782)
GROWfTH -.881" .137 -.054 -.002 .051 -.008 .296 .667" -.050(.247) (.088) (.125) (.003) (.109) (.005) (.184) (.264) (.075)
PROFIT -5.607" -2.5 15" -.435 -3.389" -.181 -.445" -1.176" .464 -.466(1.386) (.532) (.345) (1.158) (.329) (.1 18) (.276) (.554) (.473)
MV IY .832' .025 .026' -.029 .173BV (.421) (.014) (.012) (.052) (.124)
NSNFA .002 -.011I' .002 .545" -.006 -.002 -.028- -.002(.010) (.003) (.002) (.209) (.009) (.008) (.012) (.002)
NDTS -4.263" .402 -I.11I 3.420 -.268 .142 -2.427" .136(1.807) (.250) (.841) (1.583) (.216) (.294) (.646) (.586)
SZ2 -.163' -.058 -.203" .163 -.088 -.023 -.117 .171 -.121"(.082) (.044) (.064) (.173) (.082) (.019) (.081) (.157) (.043)
SZ3 -.020 .187" -.046 - .050 .039 -.003 -.138 -.205 -.083"____________ (.070) (.057) (.073) (.289) (.079) (.022) (.081) (.107) (.041)
SZ4 .688" .181" -.089 .907' .241 .095 -.064 -.126 .033(.141) (.065) (.066) (.434) (.062) (.026) (.108) (.137) (.059)
Rs| .26 .20 .30 .30 .35 .24 .23 .28 .21
adj R' .23 .15 .27 .21 .28 .22 .14 .25 .17
N 982 630 743 277 320 598 . 325 809 321
32
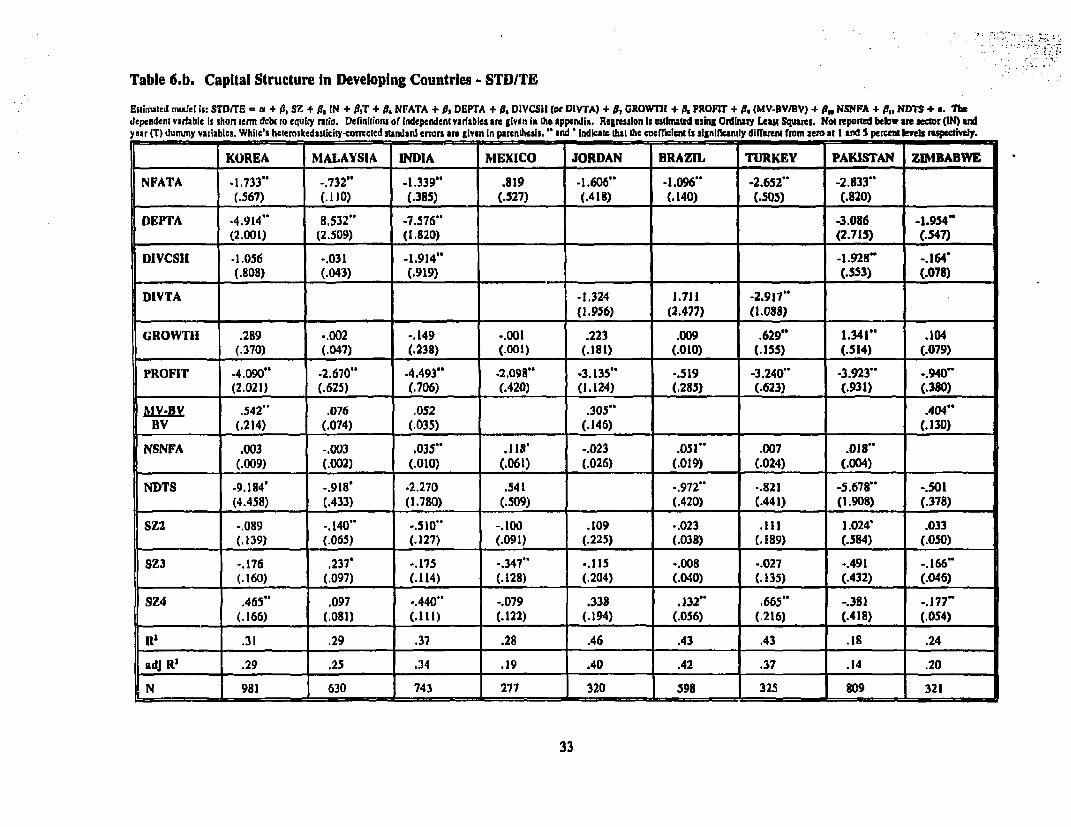
Table 6.b. Capital Structure in Developing Countries - STD/TE
Esirmatcd mulel is: STDITE - a + p SZ + B, IN + B,T + Bd Nr'ATA + B, DEPrA + 0, DIVCSII (or DIVTA) 4 p, GROWT}I + p, PROFIT + p, (MV.DVJBV) + 0,, NSfFA + pi, ND7S + * Tedependent varlabic It shon crmn dcbt (o equicy ratio. Derinilions of Independent varablcs ate given in te. appetdix. Regression Is estinuted using Ordinaiy Leust Squares. "ot reported btelow ar setor N) adyear (T) dummy variablts. White's heecroskedasticity-correcled standard errors are given In parenthesis. and * Indicate thal the coerrcient is significnly ditferenA from zero at I arid peret leves respectively.. - --
KOREA MIALAYSIA INDIA MEXICO JORDAN BRAZIL TURKEY PAKISTAN ZIMBABWE
NFATA -1.733" -.732" -1.339" .819 -1.606" -1.096" -2.652" -2.833"(.567) (. I 10) (.385) (.527) (.418) (.140) (.505) (.820)
DEPTA .4.914" 8.532" -7.576" -3.086 -1.9S54(2.001) (2.509) (1.820) (2.715) (.547)
DIVCSII -1.056 -.031 -1.914" -1.928- -.164-L____ _ (.808) (.043) (.919) _ (.553) (.078)DIVTA -1.324 1.711 -2.917"
. __________ ____________ _____ _ ___________ _(1,956) (2.477) (1.088)
GROWThI .289 -.002 -.149 -.001 .223 .009 .629" 1.341" .104(.370) (.047) (.238) (.001) (.181) (.010) (.155) (.514) (.079)
PROFIT -4.090" -2.670" -4.493" -2,098" -3.135" -.519 -3.240" -3.923" -.940(Z.021) (.625) (.706) (.420) (1.124) (.285) (.623) (.931) (.380)
MV-BV .542" .076 .052 .305"' .404"BV (.214) (.074) (.035) (.146) 0 _ (.3)
NSNFA .003 -.003 .035" .11S' .023 .051" .007 .018'(.009) (.002) (.010) (.061) (.026) (.019) (.024) (.004)
NDTS -9.184' -.918' .2.270 .541 -.972" -.821 -5.678" -.501(4.458) (.433) (1.780) (.509) (.420) (.441) (1.908) (.378)
SZ2 -.089 -.140" -.510" -. 10d .109 -.023 .111 1.024' .033(.139) (.065) (.127) (.091) (.225) (.038) (.189) (.584) (.050)
SZ3 -.176 237' -.175 -.347" -.115 -.008 -.027 -.491 -.166".____ _ (. 160U) (.097) (.114) (.128) (.204) (.040) (.135) (.432) (.046)
SZ4 .465" .097 -.440" -.079 .338 .132" .665" -.381 -.177"_ _ (.166) (.081) (.111) (.122) (.194) (.056) (.216) (.418) (.054)
R__ ._ '31 .29 .37 .28 .46 .43 .43 .19 .24
adJ R' .29 .25 .34 .19 .40 .42 .37 .14 .20
N 981 630 743 277 320 s 598 325 809 321
33

Table 6.c. Capital Structure in Developing Countries -TDITE
Eslimaled model is: TDITB = a + fit SZ + f13 IN + 13T + 13 NPATA + 1j DEPTA + p, DIVCSH (or DIVTA) + PI GROWTH + a, PROFIT + P, (MV.BV/B"j + ga. NSNFA + p1, NDTS + e. Thedependeni variable is total debt to equity ratio. Delinitions of independent variables are given In the appendix. Regressilon is estimated using Ordinary Least Squarr.. Not mrponed below are sector (IN) and year (T)dummy variables. White's heirmskedasticity-corrected slandard errors ard given in parenihesis.* and ' indicate that the coerficient is signricantly different from zer at I and 5 percent levels respectively.- - _ . ________________
|_______ KOREA MALAYSIA INDIA MEXICO JORDAN BRAZIL TURKEY PAKISTAN ZINMBARWE 1THAILAND
NFATA -.555 -1.042" .365 6.965" - .998' -1.20B" -2.355" -.856 -.2475.7S9) (.206) (.543) (2.611) (.478) (.159) (.669) (1.074) (.894)
DEPrA -10.S05" 7.616" -8.878" -5.119 -2.022"(2.781) (2.779) (2.635) (3.722) (1.023)
DIVCSH -1.845 .002 -3.270". -2.475" -.435'(1.347) (.054) (1.431) (.674) (.146)
DIVTA -.935 1.105 -4.092' -8.678"_____________ (2.177) (2.24B) (1.531) _ _ (3.411)
GROWFH -.541 .135 -.204 - .003 .273 -.001 .925" 2.009" .053 -.699"(.483) (.093) (.331) (.004) (.240) (.013) (.291) (.671) (.127) (.261)
PROFIT -10.252" -5.185" -4.928" -5.4864' -3.316' -.974" -4.417" -3.461" -1.406(2.758) (.863) (.974) (1.379) (1.185) (.311) (.729) (1.114) (.752)
MV-BV 1.341- .101 .078 .276 .577" .153DV (.619) (.074) (.045) (.170) (.221) (.089)
NSNFA .008 -.014" .037" .663" -.028 .049" -.022 -.017"* .008___________ (.015) (.004) (.012) (.241) (.032) (.022) (.029) (.005) (.026)
NDTS -14.278"' -.516 -3.384 3.961' -1.240" -.680 -8.107" -.364(5.973) (.512) (2.481) (1.828) (.545) (.493) (1.489) (.787)
SZ2 .095 .083 -.713" .063 .021 -.047 -.006 1.201 -.087 -.048(.194) (.083) (.174) (.221) (.248) (.047) (.224) (.686) (.082) (.343)
SZ3 -.237 .425" -.220 -.397 -.076 .005 -.165 -.690 -. !49" .508(.191) (.116) (.166) (.363) (.239) (.052) (.168) (.468) (.079) (.429)
SZ4 1.136" .278" -.529" .828 .580" .228" -.601i -.501 -.143 .965s|__________ (.253) (.107) (.159) (.514) (.220) (.068) (.272) (.488) (.102) (.308)
R' _.33 .32 .25 .29 .42 .42 .38 .18 .21 .19
adj R2 .31 .29 .22 .20 .35 .40 .32 .15 .17 .12
N 981 630 743 277 320 598 325 809 321 371
34
lable . Delenninanis of Capital Structure - Relative Explanatory PowerReported numbers are Oie adjusted R's after deleting the specified variables. The difference between the adjusled RI of the fill model and ihat of the deleted models are given in parmnhesis and ate avenged bi do .last rows. Variable definitions and sources arc given in the Appendix.
Full Asset Structure Liquidity Growth Size Effect Tax Effect Industry EffectOmits NFATA, Omits Opportunities Omits Size Omits NDTS Omits IndustryNSNFA DIVCSHIDIVTA Omits Growth Dummies DEPTA Dummies
_________ _______ ____________ Profit (MV-BV)/BV . _
KOREA LTD .23 .22 (.01) .20 (.03) .16 (.07) .20 (.03) .21 (.02) .20 (.03)
ST) _.29 .28 (.01) .28 (.01) .28 (.01) .28 (.01) .27 (.02) .19 (.10)
MALAYSIA LTD .15 .13 (.02) .11 (.04) .13 (.02) .13 (.02) .15 (0) .13 (.02)
STD .25 .23 (.02) .23 (.02) .24 (.01) .25 (0) .24 (.01) .17 (.08)
INDIA LTD .27 .20 (.07) .23 (.04) .26 (.01) .26 (.01) .26 (.01) .25 (.02)
STD .34 .27 (.07) .25 (.09) .34 (0) 33 (.01) .33 (.01) .33 (.01)
PAKISTAN LTD .25 .20 (.05) .24 (.01) .24 (.01) .24 (.01) .23 (.02) .18 (.07)
STD .14 .12 (.02) .12 (.02) .14 (0) .13 (.01) .13 (.01) .11 (.03)
TURKEY LTD .14 .13 (.01) .11 (.03) .13 (.01) .15 (-.01) .15 (-.01) .10 (.04)
STD .37 .26 (.11) .24 (.13) .35 (.02) .33 (.04) .36 (.01) .33 (.04)
JORDAN LTD .28 .25 (.03) .28 (0) .28 (0) .25 (.03) - .21 (.07)
STD :40 .36 (.04) .32 (.08) .37 (.03) .38 (.02) - .30 (.10)
MEXICO LTD .21 .11 (.10) .20 (.01) .21 ( 0 ) .19 (.02) .20 (.01) .16 (.05)
STD .19 .18 (.01) .14 (.05) .19 (0) .16 (.03) .19 (0 ) .16 (.03)
BRAZII, LTD .22 .21 (.01) .21 (.01) .22 (0) .18 (.04) .22 (0) -
STD .42 .16 (.26) .42 (0) .42 (0) .41 (.01) .41 (.01)
ZIMBABWE LTD .17 - .10 (.07) .14 (.03) .12 (.05) .18 (.01)
STD .20 - .17 (.03) .08 (.12) .13 (.07) .18 (.02) -
THAILAND TD .12 .12 (0) .09 (.03) .09 (.03) .11 (.01) - .10 (.02)
Average LTD (.038) (.027) (.017) (.022) (.008) (.043)
STD (.068) (.048) (.021) (.022) (.001) (.056)
All . (.049) (.037) (.020) (.022) (.009) (.047)
35

Appendix: Variablc Definitions and Sourccs
Variables:
LTD/TE
Le ng tenn debt to total equity
STD/TE,
Short term debt to total equity
TD/TE
Total debt to total equity
NFATA = NFA/TA
Net fixed assets divided by total assets
DEPTA = DEP/TA
Depreciation divided by total assets
DIVCSH = DIV/(EAT+DEP)
Dividends divided by earniings after taxes plus depreciation
DIVTA = DIV/TA
Dividends divided by total assets
GROWTH = ((TA/GDPDEF)-LAG(TA/GDPDEF))/LAG(TAIGDPDEF)
Growth rate of real total assets
PROFIT = BIT/TA
Earnings before interest and taxes divided by total assets. If EBIT is Pot availableEBT is used instead
(MV-BV)/BBV
Market value of equity minus book value of equity, divided by book value
NSNFA = NS/NFA
Net sales divided by net fixed assets
36

-NDTS = (01 - FE - (EBT-EAf)/CTR)/TA = (EBT - TAX/CTR)/TA
Non-debt tax shields equals earnings before taxes (operating income minus financial expenses)minus the ratio of corporate taxes paid to corporate tax rate, all deflated by total assets
SZ1-SZ4
Size quartile dummies. SZ1 takes the value 1 if the company is in the first asset quartile in thecountry and zero if it is not.
TAGDP = TA1GDP
Total asset size of the company relative to GDP of the country
SIC1-SIC61
Sector dummy variables for different SIC codes
AGE = YEAR - ESTYEAR
Year minus year established.
YOUNG
Dummy variable that takes the value I if AGE is less than or equal to 5 and zero otherwise.
Sources:
Firm level variables are constncted from IFC's Corporate Finance data set (see Table Al for a summary).
Tax data are from Coopers & Lybrand, International Tax Summaries, John Wiley and Sons, N.Y., variousissues.
37
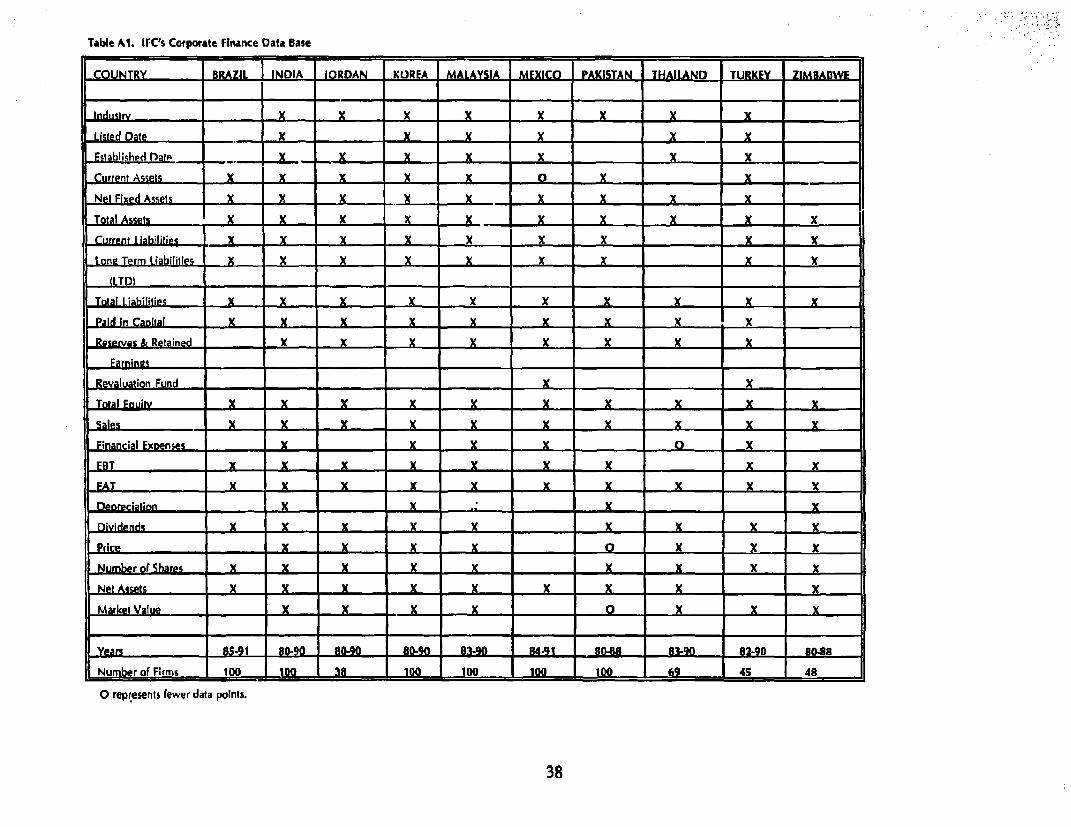
Table Al. IrC's Corporate Finance Data Base
|COUNTRY BRAZIL INDIA IORDAN KUREA .MALAYSIA MEXICO PAKISTAN. THAILAND TURKEY ZIMBADI%W
IndusIrv X X* x X x X X X
Listed Date . . X . X X X X _ X
Eslabllir,htd Dalo X __. x _ x x x x ..
Curren! Assets *.. X X X X X O X ___X__ -
Nei Fixed Assets X X _X _ _ 2 __X _ X XXX
Total Assets _ x X X x X _ x _ XX _ ._XXX
Current liabilities .- X . x X X _X XX .. XXLone TeFmn LiabTilites X X . X X X X _XX _ X
(LTD)
Total Liabilities X X. X X X X X X X X
Paid in Canital X X .X X X X X X _i
Raserves & Retained _ _ X X . X X X __ X X_a _ ines ____I
Revaluation Fund - _ . X
Total Fouilv X X X _ X X X ._ X _XX . X
Sales _ x x X X x x X X XFi'nancial Expenses - ........ L.. K. .. L... .. Q...... .. x.
F BT I X x X X % X X XX
EAT X X X -X X X X _ XXXDenreciation _ _ .. . - _LX
Dividends X -X X X
Price X K X X _ XO X X XNumber of Shares X X -X X XX X %
Market Value X * x . 0 X _ X
5 Years _ _ 80^90 80-90 80"9d 83 9a0Sam84-41 _ 0- &8 83 82-90 08
Number of Firms 100 ,J1 88 _38 100 100 . 100 100 69 45 48
O represents fewer data points.
38

Policy Research Working Paper Series
ContactTitle Author Date for paper
WPS1306 Capital Flows and Long-Term Ibrahim A. Ebadawl June 1994 R. MartinEquilibrium Real Exchange Rates Raimundo Soto 39065hI Chile
WPS1307 How Taxation Affects Foreign Direct Joosung Jun June 1994 S. King-WatsonInvestment (Country Specific Evidence) 31047
WPSI308 Ownership and Corporate Control In Brian Pinto June 1994 M. Karrm-CheongPoland: Why State Firms Defied the Sweder van Wijnbergen 39618Odds
WPS1309 Is Demand for Poliuting Goods Gunnar S. Eskeland June 1394 C. JonesManageable? An Econometric Study Tarhan N. Feyzioglu 37699of Car Ownership and Use in Mexico
WPS1310 China's Economic Reforms: Pointers Justin Yifu Lin June 1994 C. Spoonerfor Other Economies in Transition Fang Cai 30464
Zhou U
WPS1311 The Supply Response to Exchange Mustapha Rouis June 1994 J. SchwartzRate Reform in Sub-Saharan Africa Weshah Razzak 32250(Empirical Evidence) Cados Mollinedo
WPS1312 The New Wave of Private Capital Eduardo Femandez-Arias June 1994 R. TuttInflows: Push or Pull? 31047
WPS1313 New Estimates of Total Factor Vikram Nehru June 1994 M. Coleridge-Productivity Growth for Developing Ashok Dhareshwar Taylorand Industrial Countries 33704
WPS1314 The Significance of the 'Europe Bartlomiej Kaminski June 1994 M. PateniaAgreementsw for Central European 37947Industrial Exports
WPS1315 Global Tradable Carbon Permins, Bjom Larsen June 1994 C. JonesParticipation Incentives, and Anwar Shah 37754Transfers
WPS1316 Preserving the CFA Zone: Macroeco- Shantayanan Devarajan June 1994 C. Jonesnomic Coordination After the Michael Walton 37699Devaluation
WPS1317 Estimating the Efficiency Gains Jeremy Bulow July 1994 Rose Voof Debt Restructuring Kenneth Rogoff 33722
Ning S. Zhu
WPS1318 Exchange-Rate-Based Stabilization Miguel A. Kiguel July 1994 M. Divinoin Argentina and Chile: A Fresh Look Nissan Liviatan 33739

Policy Research Working Paper Series
ContactTlUe Author Date for paper
WPS1319 The Financial System and Public Ashi DemirgOu-Kunt July 1994 B. MooreEnterprise Reform: Concepts and Ross Levine 35261Cases
WPS1320 Capital Structures In Developing Asih Demirguq-Kunt July 1994 B. MooreCountries: Evidence from Ten Vojislav Maksimovic 35261Countries


