
www.cerf-jcr.org
Carbonate Coastal Aquifer of Vlora Bay andGroundwater Submarine Discharge(Southwestern Albania)
Maurizio Polemio{, Arben Pambuku{, Pier Paolo Limoni{, and Olga Petrucci1
{CNR-IRPIBari DepartmentVia Amendola 122/i70124 Bari, [email protected]@ba.irpi.cnr.it
{Albanian Geological ServiceHydrogeological DepartmentTirana, [email protected]
1CNR-IRPICosenza DepartmentVia Cavour 4/687030, Rende, [email protected]
ABSTRACT
POLEMIO, M.; PAMBUKU, A.; LIMONI, P.P., and PETRUCCI, O., 2011. Carbonate coastal aquifer of Vlora Bay andgroundwater submarine discharge (southwestern Albania). In: Tursi, A. and Corselli, C. (eds.), Coastal Research inAlbania: Vlora Gulf, Journal of Coastal Research, Special Issue No. 58, pp. 26–34. West Palm Beach (Florida), ISSN0749-0208.
The study discusses the large karstic coastal aquifer of Vlora Bay. This case is peculiar, as the submarine groundwaterdischarge has a relevant rate of terrestrial inflow in an almost closed bay that is located in an environmentally valuablearea.
The study is based on four methodological activities: geological and hydrogeological conceptualisation, climatic studyand hydrological balance, numerical modelling, and monitoring. A geodatabase was created considering hundreds of datapoints (wells, springs, rivers, lagoons, and seas) and monthly time series of rainfall, temperature, and river discharge.Monitoring activity was realised over a hydrological year, installing a rainfall network tool and using a network of tens ofsampling points, including springs, wells, lagoons, and sea. Chemical–physical and stable isotope determinations wererealised.
Two main groups of aerial springs are fed by the aquifer, one of which is of a coastal type. The total spring discharge isroughly 4 m3/s. The submarine groundwater discharge (SGD) was assessed as being equal to 1.4 m3/s on the basis of thecurrent rate of anthropic discharge and climatic conditions. The study showed the peculiarities of this carbonate coastalaquifer and the importance of its groundwater, which is the chief water source for the third-largest Albanian town.Thegroundwater quality was generally high, mainly due to the negligible presence of contamination sources on the relief inwhich the aquifer outcrops. The rate of seawater intrusion effects was also low, thanks to favourable aquifer three-dimensional geometry and high recharge levels.
The increasing anthropic activities constitute a relevant risk in the absence of the introduction of rigorous land andwater management criteria.
ADDITIONAL INDEX WORDS: Submarine groundwater discharge, seawater intrusion, karstic aquifer, Albania.
INTRODUCTION
Water and chemical fluxes across the seafloor provide an
important link between terrestrial and marine environments
(Langevin et al., 2007). Oceanographers recognise that these
fluxes may act as a source of nutrients or as other harmful
contaminants to marine systems (e.g., Valiela et al., 1990).
These fluxes may also act as a beneficial source of freshwater
for coastal marine, wetland, and lagoon environments.
Hydrogeologists recognise that fluxes across the seafloor are
an important part of the water balance for coastal aquifers
(Zektser and Loaicuga, 1993).
Submarine groundwater discharge (SGD) has become a
popular term in the literature; Burnett et al. (2003) define SGD
as the discharge of groundwater across the seafloor into the
sea. Using a combined hydrological and hydrogeological
method, the mean annual contribution to the Mediterranean
Sea was estimated to be about equal to 1700 m3/s (Zektser and
Loaicuga, 1993). In terms of linear mean contribution, 8 km of
European coast feed the Mediterranean Sea at levels of 1 m3/s.
Around the world, the runoff yield that is discharged in the
sea is up to 10 times greater than groundwater discharge
(UNESCO, 2004a) except in karstic areas, where the latter
prevails. This is the case in numerous Mediterranean karstic
coastal aquifers, such as the Apulian karstic aquifers, which
are wide coastal aquifers located in southern Italy, where the
SGD is more than the double the discharge of surface runoff,
notwithstanding the current overexploitation by wells (Po-
lemio, Dragone, and Limoni, 2009a). In total, 62 study cases
were recognised along the European coast of the Mediterra-
nean Sea, not considering the Albanian coast (COST, 2005).
Many wide coastal karstic aquifers are located in Albania as
well; between these, the case of the large karstic coastal
aquifer of Vlora Bay (southwestern Albania), which is
discussed in this article, is peculiar worldwide, as the SGDDOI:10.2112/SI_58_4 received and accepted in revision 12 April 2010.E Coastal Education & Research Foundation 2011
Journal of Coastal Research SI 58 26–34 West Palm Beach, Florida Winter 2011

is a relevant rate of terrestrial inflow in a mostly closed bay
(Figure 1). In these cases, the modifications of the quality and
quantity of current coastal karstic groundwater discharge can
provoke severe effects on the hydrological and ecological
equilibrium of the sea and in coastal areas (UNESCO, 2004a).
It is well known that karstic aquifers are highly vulnerable
to contamination because of their particular characteristics
such as thin soils, point recharge in dolines and swallow holes,
and high hydraulic conductivity (COST, 2003). Karstic
groundwater contamination is widespread because of direct
pollution from agricultural activities and houses, but also very
often because of a wide range of anthropogenic modifications,
as is the case for the Apulian aquifers (Polemio, Dragone, and
Limoni, 2009b). In this case, forest and stone clearing, which
have been undertaken widely because of the advent of
machinery to provide land suitable for farming; quarrying,
which destroyed the epikarst; and poor management of water
resources are relevant. The unplanned enlargement of urban
and rural areas is another widespread phenomenon, as seen in
the recent history of Albania.
Coastal karstic aquifers are also vulnerable to salinisation
caused by seawater intrusion, including upconing effects,
which is also a common problem in the Mediterranean coasts
(COST 2005).The sustainable management of coastal aquifers
is a key goal that requires careful estimates of recharge and
other hydrological components, such as groundwater dis-
charge. Oceanographers, marine scientists, and those study-
ing and managing saltwater intrusion in coastal aquifers
pursue the common goal of quantifying and understanding
the interactions of groundwater and seawater (Langevin et
al., 2007). The case of the Vlora Bay aquifer was selected to
contribute to these efforts.
METHODS
In the case of coastal aquifers, a wide range of methodolog-
ical approaches can be used to quantify the groundwater
resources and to define the groundwater quality and degrada-
tion risks (Bear and Verrujt, 1987; Davis and De Wiest, 1991;
UNESCO, 2004b). For each case study, the methodological
choice should reflect the main goals, hydrogeological peculiar-
ities of the case, the type of available data, the technologies,
time, and economical resources. We proposed a reliable
approach for a karstic coastal aquifer for which the availability
of historical monitoring data is low and for which it was
possible to realise a monitoring program for not less than one
hydrological year. The method applied can be schematically
described as a succession of four activities, some of which can
be realised simultaneously: these are conceptualisation,
hydrological balance, modelling, and monitoring.
The first activity is the geological and hydrogeological
conceptualisation of the aquifer. Any available geological and
hydrogeological data, which were collected in disparate
formats and scales, were integrated into a geodatabase that
included geographic, geologic, and hydrogeological data (San
Juan and Kolm, 1996). Each data set was analysed in a
geographic information system (GIS) environment to char-
acterise surface and subsurface conditions and the hydrologic
system. Specific layers considered data on geological forma-
tions, tectonical information, geomorphological and karstic
features, rivers, lakes, lagoons, wells, including piezometric
heads, and springs, including spring outflow yields. The data
set was also analysed and validated by specific on-site
surveys. The groundwater flow system, conceptualised as a
three-dimensional (3-D) interconnected system, was so
defined by distinguishing hydrogeological complexes, which
include lithotypes, with similar hydrogeological characteris-
tics. For this purpose, the assessment of complexes considered
piezometric values, landforms, surface water features, geol-
ogy (depositional patterns, faulting, etc…), and hydraulic
conductivity data, if available. The main output of this
activity was the hydrogeological map and the sections
(Figure 2) that form the basis for the hydrological balance
and modelling activities. The conceptualisation was consid-
ered as validated if the results of the hydrological balance and
modelling activities, at the end of the second and third
activities, were consistent with the monitored data and
hypotheses on the basis of the assumption of the conceptual-
isation.
The climate characterisation and hydrological balance
activity (Johansson 1987) was realised using monthly
rainfall, temperature, and river flow yield time series in
concert with the assessment of the infiltration rate of net
Figure 1. Albania and study area map, including main national rivers
and lakes.
Groundwater of Vlora Bay 27
Journal of Coastal Research, Special Issue No. 58, 2011

rainfall of outcropping hydrogeological complexes, as ex-
plained in detail when discussing the case study. The main
output is the assessment of the mean total groundwater
outflow. The reliability of the hydrological balance is
preliminarily calibrated considering the balance of a moni-
tored drainage basin that includes a part of the studied
hydrogeological basin. The final validation considers the
amount of calculated SGD, using both hydrological balance
and modelling.
The numerical modelling utilised a variable-density
groundwater flow and solute transport model, which are
usually used to simulate saltwater intrusion (Langevin et al.,
2007). In this case, these same models can also be used to
provide quantitative estimates of SGD. Numerical modelling
is a reliable tool of distributing aquifer recharge, in space and
time, to the outflow boundaries. Use of numerical models is
appealing because a simulation can provide spatially and
temporally detailed estimates of SGD rates. Numerical
models can also be used to predict future SGD rates or rates
for other hydrological conditions, such as increasing anthrop-
ic discharge, climate change, and processes of quality
degradation.
The groundwater flow was numerically simulated on the
basis of a model the core of which is the MODFLOW model, a
freeware code from the U.S. Geological Survey (McDonald
and Harbaugh, 1988). The model is the 3-D numerical model
that is the most used in the world. The seawater intrusion
was simulated using the SEAWAT code, which is combined
with the very famous flow code MODFLOW and the transport
code MT3DMS (Zheng and Wang, 1999). The main outputs
were the assessment of GSD and, second, the aquifer
piezometric map and the groundwater salinity map. The
final validation is based on the results’ coherence with the
hydrogeological measurements.
The fourth activity is a monitoring program that concerned
rainfall, rivers, lagoons, wells, springs, and seawaters during
a hydrological year with seasonal frequency. In situ chemi-
cal–-physical measurements, water sampling, and analyses of
physical, chemical, and isotopic data were used on all types of
waters. Quantitative measurements of rainfall and of spring
discharge were also undertaken. The main output is the
physical, chemical, and isotopic characteristics of waters.
These data validate the conceptualisation and the modelling
from a hydrological and geochemical point of view.
STUDY CASE
Albania has a surface of 28,748 km2 and a perimeter of
720 km (Figure 1). The coasts along the Adriatic and Ionian
seas extend for 362 km. Along the coast, the alluvial plains,
which are 16 km in width, as per the mean value, represent
the unique flat areas. Despite the massive land reclamation
for agricultural purposes, about 109 km2 of coastal wetlands
or lagoons still exist, especially along the Adriatic coast
(Cullhaj et al. 2005).
The Albanian climate is subtropical Mediterranean. The
mean annual temperature ranges from 7 to 15uC, whereas the
mean annual rainfall ranges from less than 600 mm to more
than 3000 mm (the mean national value is about 1500 mm).
Groundwater is the only source for drinking water in the
entire country (Ministry of Environment, 2002). A lack of
detailed knowledge on the availability of groundwater and its
recharge, and the nonsystematic monitoring causes manage-
ment problems where discharge is high and localised, like in
some coastal areas in which seawater intrusion can also be
observed.
The paper describes the study of the large karstic coastal
aquifer of Vlora Bay, which is dominated by Oyramanges Mt.
(1864 m above sea level [asl]) (Figures 1 and 2). Two main
groups of springs are fed by the aquifer, one of which is of a
coastal type. Spring groundwater feeds the drinking supply of
the town of Vlora, which is one of the most important in the
country (Polemio, Pambuku, and Petrucci, 2008).
Geological and Hydrogeological Conceptualisation
Approximately 70% of the territory is mountainous, with
peaks higher than 2700 m asl; reliefs, called Albanides, are
constituted mainly by the S branch of the Mediterranean
Alpine Belt. Two major paleogeographic domains can be
distinguished: the Internal Albanides to the east, and the
External Albanides in the west sector, where the study area is
located (Figure 1). The External Albanides, characterised by
Figure 2. Geological and hydrogeological schematic map and section.
Main aquifer: Cr, J, T3, Pg1, and Pg21–2 are Cretaceous fissured and
karstified limestones, dolomitic limestones and dolostones, Triassic
fissured dolostones, and Paleogene–Eocene limestones and limestones
with cherts, respectively. Impervious formations: Pg and N are Paleogenic
and Neogenic soils, respectively, and rocks, mainly claystones, silts, and
marlstones. Secondary aquifer: Qp-h and Qh respectively are Quaternary
gravel, sand, and poorly consolidated boulders, covered by shallow clay in
the former case.
28 Polemio et al.
Journal of Coastal Research, Special Issue No. 58, 2011

regular structural belts, which are associated with thrust and
tectonic cover, developed alongside the west passive margin
and continental shelf of the Adriatic plate. The External
Albanides are affected only by the latest paleotectonic stages,
and are characterised by regular structural belts, which are
associated with thrust and tectonic cover (Pano and Flasheri
2007). Some of these belts are bordered by tectonic lines along
which Mesozoic carbonate rocks are bounded by tertiary
sediments.
In the Vlora area, this is the case for the so-called Logora,
Selenica, and Tepelena lines that determined the valleys of
the Dukati, Shushica, and Dhrino rivers, respectively
(Figures 1 and 2). The Logora line (Dukati River, Figure 2)
is particularly important as it corresponds to the limit
between the two southernmost tectonic zones of the country
(called Sazani and Jonic zones). The Vlora coastal area is
dominated by mountains of so-called Epirotes Chains in
which anticline folds create parallel belts that are oriented
NW-SE. Along these anticlines, Mesozoic limestone outcrops,
as well as, in the synclines, youngest flysch complexes, can be
found (Figure 1). The peak width of Vlora Bay, which is
partially closed by the relief of the Karaburuni Peninsula, is
9.5 km.
The studied aquifer is formed by carbonatic rocks of the
large Tragjasi anticline, the periclinal of which is located in
the S and SW portions of the study zone. The anticline is
about 22 km in length and 6–10 km in width, with an
asymmetric structure that is inverted toward the west.
Moving from the core, the anticline is composed of Upper
Triassic (T3) dolostone and limestone, Jurassic (J), Creta-
ceous (Cr), and Paleocene–Eocene (Pg1–Pg21–2) limestones,
dolostones, and limestones with cherts. The carbonatic
aquifer is bounded on the E, N and NW sides by Paleogene–
Neogene flysch formations (claystones, siltstones, and sand-
stones) (Meco and Aliaj, 2000), and the area in which the
aquifer outcrops is 147 km2. There is no leakage from the
aquifer, which is also due to a continuous outcrop of
quaternary clayey soils, locally including sands and gravels,
which extend along almost the entire W side of the aquifer.
The inland portion of the aquifer shows karstic features
(Figure 2).
On the W side, the carbonatic rocks and flysch come into
transgressive contact with angle discordance placed in the
Dukati Valley. The relief of the left valley side constitutes the
Acrocerauni belt, which includes the carbonatic cretaceous
reliefs of the Karaburuni and Mali I Kanalit Mountains. In
the Dukati Plain, a shallow aquifer of Quaternary gravel,
sand, and poorly consolidated boulders can be distinguished.
This aquifer, about 10 m thick, lies on hundreds of metres of
impervious soils and rocks. The recharge is mainly due to the
leakage of the Dukati River. On the left side of the coastal
plain, the Orikumi Lagoon completes the environmentally
valuable bay. On the other side of the aquifer, we come across
the hilly Shushica River valley, where Neogenic soil outcrop-
pings are composed mainly of claystones, siltstones, and
marlstones that are hundreds of meters thick. The discharge
from the aquifer occurs as a result of the springs located near
or immediately below the margin of outcropping limestone.
There are no wells in the area where limestone outcrops, as
these are only found in the valley of the Dukati River or
where Quaternary soils outcrop.
Two main flow paths go from the high karstic plateau of Mt.
Oyramanges to two spring areas. These areas are found at a
distance of 10 km on the W side of the aquifer, where it
outcrops at the lowest altitude.
The former is the group of coastal springs of Uji i Ftohte,
which is located at sea level. This group includes three
springs tapped by short tunnels and is used for the Vlora
aqueduct. The tunnel of I Jonufres Cape, which is 1700 m in
length, connects the outflow of 32 coastal springs, which taps
in different sectors along the coastal line. Moving from N to S,
the first sector includes tapping from the tunnel road, which
is 185 m in length. The mean annual discharge is roughly
0.40 m3/s. Unexploited springs, some of which are submarine,
are located from the end the of tunnel road to a maximum
distance of about 300 m. From this point to the lighthouse,
another tunnel is able to tap a mean discharge equal to
0.64 m3/s. From the lighthouse to the Castle, about 400 m,
four unexploited small springs can be observed. The last
sector includes the old road tunnel where 11 tapped springs
are placed, for a mean total discharge of 0.94 m3/s. The mean
spring yield discharged in this group is roughly equal to
2.0 m3/s.
The second group of springs are known as Izvorit and are
located at about 40 m asl in the Tragjasi Village. The springs
are placed along the mostly straight outcropping limit
between carbonatic rocks (J-T3) and Neogene clays. The
springs of both groups are roughly found along a straight N-
NW S-SE tectonic line. A low percentage of the Izvorit spring
outflow rises up to some villages; the rest was measured using
tracer tests. The whole mean outflow of the spring group is
roughly equal to 1.8 m3/s. The total discharge of subaerial
spring discharge is roughly equal to 3.8 m3/s.
Climate Characterisation and Hydrological Balance
Monthly data describing rainfall and temperature from six
gauges were considered (Table 1 and Figure 3). In addition,
the time series of the monthly river flow yield of Drashvice
Bridge on Shusica River was used to define the hydrological
balance. All these data were collected by the national
monitoring system. It is assumed that, in terms of mean
hydrological year, the hydrological balance of a hydrological
basin is described by the relationship:
P ~ I z R z Er
Table 1. Characteristics of rain and temperature gauges and time series
used for the hydrological balance.
Gauge
Altitude
(m asl)
Mean Annual
Rainfall (mm)
Mean Annual
Temperature (uC)
Monitoring
Period (years)
Brataj 270 2085.3 14.4 20
Dukat-Ferme 85 1419.3 15.8 20
Dukat-Fshat 375 2270.8 14.2 21
Kuc 610 2335.7 15.5 20
Llakatund 27 1049.4 16.7 25
Vlore 1 984.4 27
Groundwater of Vlora Bay 29
Journal of Coastal Research, Special Issue No. 58, 2011

where P, I, R, and Er are precipitation, infiltration, runoff,
and real or actual evapotranspiration, respectively.
Both P and T showed a statistically relevant straight-line
correlation with altitude. On the basis of the digital elevation
model (DEM), determined in the GIS environment studying
cell sizes with a width of 40 m, the spatial variability of P and
temperature was assessed. Er was calculated in each cell
using Turc’s formula (1954) and the modified temperature, as
defined by Santoro (1970) for Mediterranean areas. The
amount of mean annual net rainfall Pn was thus calculated as
Pn 5 P 2 Er.
In the Shushica River drainage basin and in the outcrop-
ping karstic aquifer (Figures 2 and 3) 21 hydrogeological
complexes were distinguished, from claystones (very low
hydraulic conductivity) to stratified, fissured, and karstic
limestones (very high hydraulic conductivity).
The net infiltration coefficient Ci, defined as I/Pn, for each
outcropping hydrogeological complex was assessed. The
preliminary Ci assessment was based on the previous
experiences of certain authors and considered the peculiar
hydrogeological characteristics of the complexes (Cotecchia,
D’Ecclesiis, and Polemio, 1990; Polemio, Casarano, and
Limoni, 2009). The infiltration I was assessed in each cell
as I 5 PnCi.
The basin of the Shushica River was used to calibrate the
hydrologic model, including Ci values. At the Drashovice
gauge, where the Shushica drainage basin is 587 km2, the
mean river yield R9 was assessed as being equal to 19.8 m3/s
on the basis of the monitoring.
The mean spatial annual rainfall was 1840 mm in the
Shushica drainage basin. On the basis of the hydrologic
balance relationship, the mean river yield, R0, can be also
assessed as P, I, and Er were known. Calibrating Ci values to
reduce to zero R9 2 R0, Ci ranged from 0.10 to 0.80. On this
basis, the mean annual recharge on cells of the outcropping
karstic aquifer was in the range of 63–1910 mm (Figure 3B).
The mean spatial annual infiltration or recharge of the
karstic aquifer outcrop was equal to 1127 mm, which
corresponds to 5.2 m3/s. The difference between recharge
and total aerial spring outflow, roughly equal to 1.4 m3/s, can
be preliminarily considered to be equal to the groundwater
submarine discharge, since the well discharge is almost zero.
The SGD should be reasonably concentrated near the Uji i
Ftohte spring area, where the carbonate aquifer is directly
bordered by the sea (Figure 2). The reliability of these
hypotheses was tested using the modelling activity.
Numerical Modelling
Because of the steep nature of the outcropping aquifer, the
population lives mainly at the bottom of the karstic relief,
where impervious complex outcrops and high spring dis-
charges are freely available. An effect of this is that
discharging wells in karstic aquifers do not exist and the
creation of monitoring wells would require hundred-meter
boring to be created far from secondary roads. For this
reasons, hydrogeological data on the karstic rocks cannot be
measured in situ.
Realistic values were defined for the hydraulic conductivity
(1024 m/s) and the specific yield (0.15) to be spatially
calibrated using numerical tools. The basic numerical model
was based on a grid with a width of 250 m, and considering up
to 11 levels, or strata (Figure 4 and Figure 5). The boundary
conditions were assigned using the following type of boundary
conditions: general head boundary conditions where lime-
stone outcrops in proximity of the coast and recharge
conditions in the rest of limestone outcropping area, using
as an input the spatial output of the hydrological balance
application (Figure 3B).
An automatic calibration procedure, called PEST, was used
(Doherty, 2001). This procedure minimises an objective
function related to the square difference between a number
Figure 3. Hydrological balance map (rectangle A) and aquifer infiltration
or recharge map (rectangle B, mm). A: (1) Drashovice River discharge
gauge of national network (hydrometer), (2) rain gauge of study monitoring
program, (3) rain and temperature gauge of the national network, (4) main
springs and other sampling points, (5) spring or well, (6) river, (7) lagoon,
(8) outcropping karstic aquifer, (9) Shushica River drainage basin at
Drashovice gauge.
Figure 4. 3-D view of aquifer (grey) and of the surrounding area as
discretised for hydrogeological modelling. The view is from S to N; Vlora
Bay is in the upper left corner.
30 Polemio et al.
Journal of Coastal Research, Special Issue No. 58, 2011

of observed and simulated variables, such as piezometric
heads. The calibration was based on two assumptions to test
their reliability. The first was that some springs with low
discharge and at high altitude, located to SE of Tragjiasi,
were due to the main groundwater flow domain; the latter
considered that these are due to perched groundwater flow.
The results of the former calibration were completely
unrealistic, so the first hypothesis was rejected, whereas in
the latter case the results were completely coherent with all
of the available information.
The SGD was confirmed to be equal to 1.4 m3/s. The SGD is
located at the bottom of the area surrounding the Uji i Ftohte
area.
The SEAWAT code was used to simulate numerically the
effects of seawater intrusion in terms of salinity variations
and groundwater quality degradation. This code uses a
density-driven flow effect coupled to a MODFLOW flow code
and to a MT3DMS transport code (Zheng and Wang, 1999).
The mesh was ticked, using cells up to 100 m in width in the
coastal area, thus improving the reliability of the results.
Recently, the effects of seawater intrusion are bounded by a
coastal strip of hundreds of metres in width. The spatial
salinity variability was coherent with the monitoring results,
which are discussed below.
Monitoring and Groundwater Characteristics
The first phase of this study was the collection of chemical–
physical groundwater data in about 200 wells and springs in
the study area (Figure 3). These data were validated and
uploaded in the geodatabase system.
Many springs were placed in the data set; the majority of
these showed discharges of less than a litre per second, but
the entire range was from 0.1 to about 2000 L/s. The wells are
located in the valleys of the Dukatit and Shushica rivers,
where aquifer Quaternary soils have discharge yields of
generally less than 10 L/s.
The preliminary analysis of ion concentration confirmed
from a geochemical point of view the results of the
conceptualisation.
The monitoring program was defined after some surveys,
and was used to define a monitoring network. Up to 30 water
sampling points were selected (Figure 3). They were mainly
springs, but wells, rivers, lagoons, and the sea were also
considered. In addition, rainfall monitoring was undertaken.
Five rain gauges were installed to measure monthly rainfall
and two for the monthly sampling for analyses of stable
isotopes, namely, oxygen-18 and deuterium. Four rain gauges
were located in the study area (Figure 3), defining the
altitude range as 18–1055 m asl. The remaining rain gauge
was installed close to the Italian Adriatic coast, inside the
Bari CNR-IRPI building (located in Apulia, about 200 km W-
NW from the study area) to obtain a reference point for the
discussion of isotopic data.
Water sampling of springs, wells, rivers, lagoons, and the
sea were undertaken seasonally from October 2007 to July
2008, covering one hydrological year (altitude ranging from
sea level to 310 m asl). Some parameters were measured on
site (specific electrical conductivity [EC], pH, oxidation-
reduction potential [Eh], and total dissolved solids [TDS],
with the remaining results measured in a laboratory
(Table 2).
The chemical and physical characteristics of groundwater
tapped springs are almost identical, except for some minor
spring feeds in Quaternary secondary aquifers. The ground-
water of Vlora Bay is generally weakly alkaline (mean
pH 7.6), almost fresh (mean TDS 0.3 mg/L), and cold (mean
temperature about 15uC).
By analysing the data set from the groundwater in greater
detail, it was found that the temperature variations were due
to well-known seasonal effects of atmospheric temperature
but were due also to spatial variations. The latter effect was
the progressive temperature increase due to heat exchange
between flowing water and rocks. It was a low increase
observed from main recharge areas, located from the highest
altitude to the main spring areas. The correlation between
temperature and spring altitude was found to be very low or
negligible. All these results suggest that the groundwater
flow is fast and concentrated in the main paths, such as
fissured and karstic discontinuities.
EC and TDS were mostly steady and homogenous. The
maximum salinity (0.9 g/L), considering also observation
points near the coast, is, in any case, low if the potential effect
of seawater intrusion is considered. So, the salt degradation
for seawater intrusion is low in recent years.
The pH variations are very low in time and space. It
slightly increases when in closer proximity to the coast,
rivers, and lagoons. Eh is mostly high and generally positive.
Main exceptions at this schematic view of pH and Eh are due
to secondary springs.
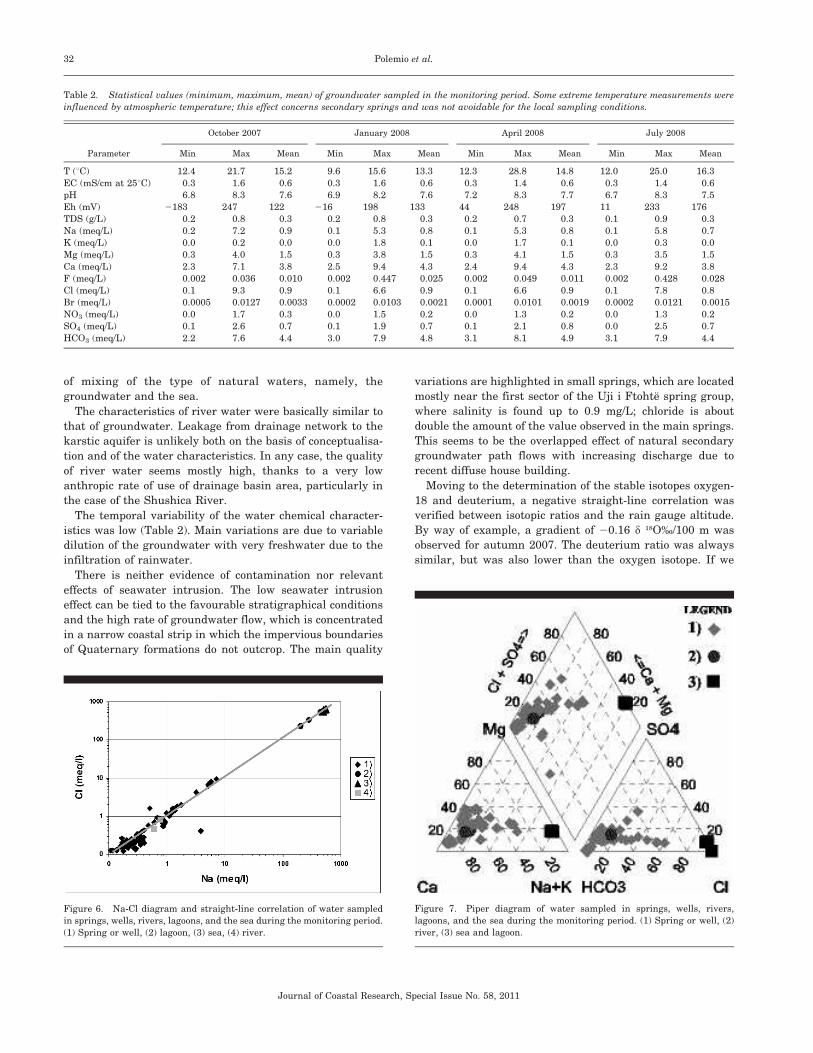
If the Na-Cl concentrations are plotted (Figure 6), it is
evident that the dilution of pure fresh groundwater with
water is due to seawater intrusion. If the threshold criterion
defined by Polemio, Dragone, and Limoni (2009b) for the
Apulian coastal karstic aquifer is adopted, pure fresh
groundwater should show up to 44 mg/L of chloride, equal
to 1.26 meq/L (Figure 6). In this case, we indentify a group of
points in which the groundwater is degraded by seawater
intrusion.
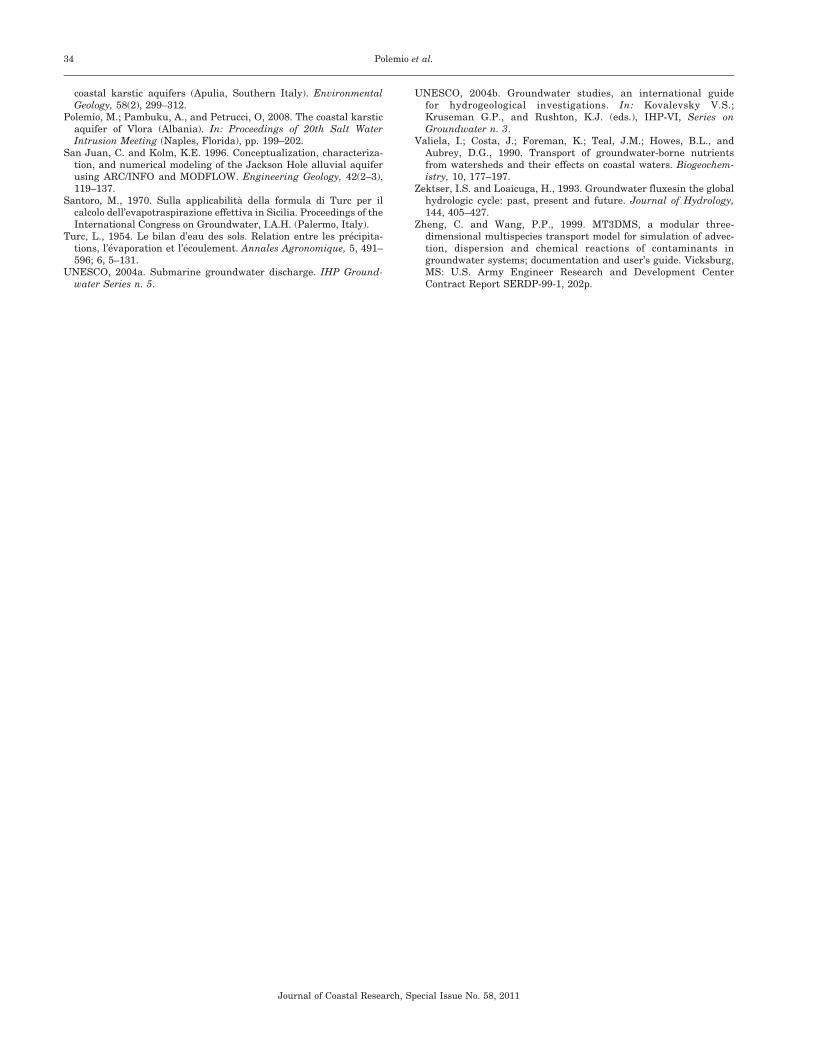
The hydrochemical type is HCO3-Ca-Mg, which was
consistent with the carbonate nature of aquifer rocks
(Figure 7). The Piper diagram showed also the evident effect
Figure 5. Strata and vertical aquifer discretisation for modelling.
Groundwater of Vlora Bay 31
Journal of Coastal Research, Special Issue No. 58, 2011
of mixing of the type of natural waters, namely, the
groundwater and the sea.
The characteristics of river water were basically similar to
that of groundwater. Leakage from drainage network to the
karstic aquifer is unlikely both on the basis of conceptualisa-
tion and of the water characteristics. In any case, the quality
of river water seems mostly high, thanks to a very low
anthropic rate of use of drainage basin area, particularly in
the case of the Shushica River.
The temporal variability of the water chemical character-
istics was low (Table 2). Main variations are due to variable
dilution of the groundwater with very freshwater due to the
infiltration of rainwater.
There is neither evidence of contamination nor relevant
effects of seawater intrusion. The low seawater intrusion
effect can be tied to the favourable stratigraphical conditions
and the high rate of groundwater flow, which is concentrated
in a narrow coastal strip in which the impervious boundaries
of Quaternary formations do not outcrop. The main quality
variations are highlighted in small springs, which are located
mostly near the first sector of the Uji i Ftohte spring group,
where salinity is found up to 0.9 mg/L; chloride is about
double the amount of the value observed in the main springs.
This seems to be the overlapped effect of natural secondary
groundwater path flows with increasing discharge due to
recent diffuse house building.
Moving to the determination of the stable isotopes oxygen-
18 and deuterium, a negative straight-line correlation was
verified between isotopic ratios and the rain gauge altitude.
By way of example, a gradient of 20.16 d 18O%/100 m was
observed for autumn 2007. The deuterium ratio was always
similar, but was also lower than the oxygen isotope. If we
Table 2. Statistical values (minimum, maximum, mean) of groundwater sampled in the monitoring period. Some extreme temperature measurements were
influenced by atmospheric temperature; this effect concerns secondary springs and was not avoidable for the local sampling conditions.
Parameter
October 2007 January 2008 April 2008 July 2008
Min Max Mean Min Max Mean Min Max Mean Min Max Mean
T (uC) 12.4 21.7 15.2 9.6 15.6 13.3 12.3 28.8 14.8 12.0 25.0 16.3
EC (mS/cm at 25uC) 0.3 1.6 0.6 0.3 1.6 0.6 0.3 1.4 0.6 0.3 1.4 0.6
pH 6.8 8.3 7.6 6.9 8.2 7.6 7.2 8.3 7.7 6.7 8.3 7.5
Eh (mV) 2183 247 122 216 198 133 44 248 197 11 233 176
TDS (g/L) 0.2 0.8 0.3 0.2 0.8 0.3 0.2 0.7 0.3 0.1 0.9 0.3
Na (meq/L) 0.2 7.2 0.9 0.1 5.3 0.8 0.1 5.3 0.8 0.1 5.8 0.7
K (meq/L) 0.0 0.2 0.0 0.0 1.8 0.1 0.0 1.7 0.1 0.0 0.3 0.0
Mg (meq/L) 0.3 4.0 1.5 0.3 3.8 1.5 0.3 4.1 1.5 0.3 3.5 1.5
Ca (meq/L) 2.3 7.1 3.8 2.5 9.4 4.3 2.4 9.4 4.3 2.3 9.2 3.8
F (meq/L) 0.002 0.036 0.010 0.002 0.447 0.025 0.002 0.049 0.011 0.002 0.428 0.028
Cl (meq/L) 0.1 9.3 0.9 0.1 6.6 0.9 0.1 6.6 0.9 0.1 7.8 0.8
Br (meq/L) 0.0005 0.0127 0.0033 0.0002 0.0103 0.0021 0.0001 0.0101 0.0019 0.0002 0.0121 0.0015
NO3 (meq/L) 0.0 1.7 0.3 0.0 1.5 0.2 0.0 1.3 0.2 0.0 1.3 0.2
SO4 (meq/L) 0.1 2.6 0.7 0.1 1.9 0.7 0.1 2.1 0.8 0.0 2.5 0.7
HCO3 (meq/L) 2.2 7.6 4.4 3.0 7.9 4.8 3.1 8.1 4.9 3.1 7.9 4.4
Figure 6. Na-Cl diagram and straight-line correlation of water sampled
in springs, wells, rivers, lagoons, and the sea during the monitoring period.
(1) Spring or well, (2) lagoon, (3) sea, (4) river.
Figure 7. Piper diagram of water sampled in springs, wells, rivers,
lagoons, and the sea during the monitoring period. (1) Spring or well, (2)
river, (3) sea and lagoon.
32 Polemio et al.
Journal of Coastal Research, Special Issue No. 58, 2011

focus on the spring located closest to the sea, the d 18O%value, which was about 28, shows that the recharge area is
located at altitudes greater than 800 m asl.
There was a generally high positive correlation between
oxygen-18 and deuterium ratios (Figure 8). If we consider
only groundwater samples, the straight-line correlation was
particularly high (R2 5 0.99), as it is typical of Mediterranean
aquifers located in the proximity of the sea. The correlation
between isotope ratios and spring altitude was very low or
negligible. As in the case of temperature, this suggests that
the flow is concentrated in main flow paths.
All of the results of water characteristics discussed here
confirmed the results of previous studies.
Conclusions
The study showed the peculiarities of this carbonate coastal
aquifer and the importance of its groundwater, which is the
chief water resource for the third largest Albanian town. The
amount of aquifer recharge and GSD assessment were
assessed with a double activity based on hydrological balance
and numerical modelling, notwithstanding the very complex
geological framework and the practical difficulties to com-
plete on-site hydrogeological tests. The GSD was assessed as
being equal to 1.4 m3/s on the basis of the current rate of
anthropic groundwater discharge and the climatic conditions.
The quality of the groundwater was generally high. The
rate of seawater intrusion effects is still low thanks to
favourable aquifer 3-D geometry and high recharge levels. At
the same time, the main flow paths were very rapid, which
indirectly confirms the extreme vulnerability of these types of
aquifers. The qualitative positive results can be explained by
considering the negligible presence of contamination sources
on the relief in which the aquifer outcrops.
Groundwater is the main natural source of direct conti-
nental inflow for Vlora Bay. The enlargement of urban areas
of Vlora and of the surrounding villages, promoted by tourism
and by the very high economic growth rate of the local
population, was basically unplanned. The social–economical
development also causes an increase in water demand. Both
these qualitative trends and the intrinsic vulnerable nature
of Vlora groundwater resources suggest the application of
rigorous land and water management criteria. The deficien-
cies of these practical criteria will cause a rapid decrease in
groundwater quality and availability, with delayed, but not
negligible, effects on the quality of the Vlora Bay water.
In the meantime, the regular monitoring that began with
this study should be continued to characterise the risks to
groundwater quality and availability degradation and for the
entire environmentally valuable Vlora area.
LITERATURE CITED
Bear, J. and Verrujt, A., 1987. Modelling Groundwater Flow andPollution. Dordrecht, The Netherlands: D. Reidel PublishingCompany, 414p.
Burnett, W.C.; Bokuniewicz, H.; Huettel, M.; Moore, W.S., andTaniguchi, M., 2003. Groundwater and pore water inputs to thecoastal zone. Biogeochemistry, 66, 3–33.
COST, 2003. COST Action 620, Vulnerability and risk mapping forthe protection of carbonate (karst) aquifers. European Commission,Directorate-General for Research, Report EUR 20912, Luxemburg.
COST, 2005. COST Action 621, Groundwater management of coastalkarstic aquifers. European Commission, Directorate-General forResearch, Report EUR 21366, Luxemburg.
Cotecchia, V.; D’Ecclesiis, G., and Polemio, M., 1990. Geological andhydrogeological study of Maratea Mountains. Geologia Applicata eIdrogeologia, 25, 139–179 [in Italian].
Cullaj, A.; Hasko, A.; Miho, A.; Schanz, F.; Brandl, H., and Bachofen,R., 2005. The quality of Albanian natural waters and the humanimpact. Environmental International, 31, 133–146.
Davis, S.N. and De Wiest, R.J.M., 1991. Hydrogeology. KriegerPublishing Company, 463p.
Doherty, J., 2001. PEST-ASP Users’ Manual. Brisbane, Australia:Watermark Numerical Computing.
Johansson, P.O., 1987. Methods for estimation of natural groundwa-ter recharge directly from precipitation—comparative studies insandy till. In: Simmers, I. (ed.), Estimation of Natural Recharge ofGroundwater. NATO Science Series C, 222, 239–270.
Langevin, C.; Sanford, W.; Polemio, M., and Povinec, P., 2007.Background and summary: a new focus on groundwater–seawaterinteractions. In: A New Focus on Groundwater–Seawater Interac-tions IAHS, 312, 3–10.
McDonald, M.G. and Harbaugh, A.W., 1988. A modular three-dimensional finite-difference ground-water flow model. Reston,Virginia: U.S. Geological Survey Techniques of Water-ResourcesInvestigations, 6, Chapter A1, 586p.
Meco, S. and Aliaj, Sh., 2000. Geology of Albania. Stuttgart: GebruderBorntrager Berlin.
Ministry of Environment, 2002. The First National Communication ofAlbania to the United Nations Framework Convention on ClimateChange (UNFCCC). Repubblica di Albania, Tirana, Albania, 2002.
Pano, N. and Frasheri, A., 2007. Principal aspects of the ecosystemVlora bay—Narta lagoon—Vjosa river mouth. CISM Project, www.cismalbania.it (accessed December 2007).
Polemio, M.; Casarano, D., and Limoni, P. P., 2009. Karstic aquifervulnerability assessment methods and results at a test site (Apulia,Southern Italy). Natural Hazards and Earth System Sciences, 9(4),1461–1470.
Polemio, M.; Dragone, V., and Limoni, P.P., 2009a. The piezometricstress in the coastal aquifers of a karstic region (Apulia, Italy). In:Makoto T.; Dausman A.; Howard K.; Lakshmanan E.; Polemio M.,and Schmid. W. (eds.), Sustainability of Groundwater in HighlyStressed Aquifers. IAHS Publ., Red book n. 329, 138–144.
Polemio, M.; Dragone, V., and Limoni, P.P., 2009b. Monitoring andmethods to analyse the groundwater quality degradation risk in
Figure 8. Diagram of isotopic ratios of water sampled in springs, wells,
rivers, lagoons, and the sea during the monitoring period. (1) Spring or
well, (2) lagoon, (3) sea, (4) rain, (5) river. The straight-line correlation is
based on groundwater samples.
Groundwater of Vlora Bay 33
Journal of Coastal Research, Special Issue No. 58, 2011
coastal karstic aquifers (Apulia, Southern Italy). EnvironmentalGeology, 58(2), 299–312.
Polemio, M.; Pambuku, A., and Petrucci, O, 2008. The coastal karsticaquifer of Vlora (Albania). In: Proceedings of 20th Salt WaterIntrusion Meeting (Naples, Florida), pp. 199–202.
San Juan, C. and Kolm, K.E. 1996. Conceptualization, characteriza-tion, and numerical modeling of the Jackson Hole alluvial aquiferusing ARC/INFO and MODFLOW. Engineering Geology, 42(2–3),119–137.
Santoro, M., 1970. Sulla applicabilita della formula di Turc per ilcalcolo dell’evapotraspirazione effettiva in Sicilia. Proceedings of theInternational Congress on Groundwater, I.A.H. (Palermo, Italy).
Turc, L., 1954. Le bilan d’eau des sols. Relation entre les precipita-tions, l’evaporation et l’ecoulement. Annales Agronomique, 5, 491–596; 6, 5–131.
UNESCO, 2004a. Submarine groundwater discharge. IHP Ground-water Series n. 5.
UNESCO, 2004b. Groundwater studies, an international guidefor hydrogeological investigations. In: Kovalevsky V.S.;Kruseman G.P., and Rushton, K.J. (eds.), IHP-VI, Series onGroundwater n. 3.
Valiela, I.; Costa, J.; Foreman, K.; Teal, J.M.; Howes, B.L., andAubrey, D.G., 1990. Transport of groundwater-borne nutrientsfrom watersheds and their effects on coastal waters. Biogeochem-istry, 10, 177–197.
Zektser, I.S. and Loaicuga, H., 1993. Groundwater fluxesin the globalhydrologic cycle: past, present and future. Journal of Hydrology,144, 405–427.
Zheng, C. and Wang, P.P., 1999. MT3DMS, a modular three-dimensional multispecies transport model for simulation of advec-tion, dispersion and chemical reactions of contaminants ingroundwater systems; documentation and user’s guide. Vicksburg,MS: U.S. Army Engineer Research and Development CenterContract Report SERDP-99-1, 202p.
34 Polemio et al.
Journal of Coastal Research, Special Issue No. 58, 2011


