
108
Case Studies of Using Flowline for ProductionPlanning and Control
Russell KenleyUnitec New Zealand (email [email protected])
Olli SeppänenDynamic System Solutions Ltd. (email: [email protected])
Abstract
Flowline, or LineofBalance, has recently gained attention in Lean Construction literaturebecause of its capacity for facilitating control of production flow and planning of continuouswork. In the broader technical literature, previous work has concentrated on the analyticproperties of flowline, such as learning curves, and is generally silent on how the method shouldbe used to improve productivity. This is because internationally the technique has receivedrelatively little application. However, in Finland, flowline has been used as the principalscheduling method since 1980s.
This paper takes a practical approach and describes the use of flowline based planning andcontrol in two real case projects. One of the projects is a large residential construction project inSydney, Australia. The other project is a Finnish retail park construction project. These pilotprojects were done at the same time and the projects were able to learn from the experiences ofthe other. The cases highlight the differences between the Finnish way of planning a schedule withbuffers between activities with synchronized production rates and the Australian way of driving aschedule with a tightly constrained CPM schedule.
A methodology using flowline as a visual planning tool but using familiar CPM logic as theunderlying engine was appropriate in the Australian case. In this methodology the objective is toimprove site control by including information about location and to be able to plan continuouswork for subcontractors and to visualize the effects of planning decisions. The result is muchclearer communication to the trade contractors about the timing and location of their work,improved control systems and better work flow. The Finnish project team was already familiarwith the basic use of flowline so the more advanced risk management based approach was used.The risk management based approach includes using quantities estimated by location as thestarting point and optimizes the crews so that the risk of schedule disturbances is minimized. Theplanning happens on two levels: the master schedule has less detail and the task plans are detailedplans of individual tasks which are done by persons responsible for the work when all thenecessary information about implementation is available. The results from the Finnish caseinclude a methodology for effectively controlling production flow and how to include thesubcontractors in the process.
109
Comparison of the two different strategies reveals important knowledge about the role of customin scheduling, and reveals potential barriers to adopting innovative approaches.
Keywords: Flowline, line of balance, scheduling, implementation
1. Introduction
1.1 Flowline and its Applications
There are two main methodologies for scheduling work: activitybased scheduling and locationbased scheduling. These two methodologies in turn have many methods and techniques, oftendesigned to achieve the same purposes in different ways [1].
The dominant scheduling technique is activitybased scheduling and it was first developed in the1950s [2]. The technique relies on the construction of a logical network of activities in threevisual forms; activity on the arrow, activity on the node and logical dependency constraints [3],with four levels of complexity; deterministic (for example: CPM), probabilistic (for examplePERT) generalized activity networks [3] and arguably the more recent criticalchain method [4].
A familiar to many, but relatively little used, alternative scheduling technique is that of locationbased scheduling, more frequently known as repetitive scheduling. Originally developed by theGood Year Company in the 1940s and expanded by the US Navy in the 1950s [5], the suite oftechniques has found strong support in continuous production systems (more typical inengineering construction) but only limited support in commercial construction. Finland is anotable exception to this, as the technique is the dominant method in the Finnish constructionindustry. Harris & Ioannou [6] summarize the various names (and sources) given to thevariations in the method, including ‘Lineofbalance’, ‘Construction planning technique’,‘Vertical Production Method’, ‘TimeLocation Matrix model’, ‘Time Space Scheduling method’,‘Disturbance scheduling’ and ‘Horizontal and vertical logic scheduling for multistory projects’.Interestingly they do not identify perhaps the most evocative term, that of ‘FlowLine’ [7]. Harris& Ioannou [6] also identify the terms used in engineering construction such as highways,pipelines and tunnels, as ‘Time versus distance diagrams’ (TD charts), ‘Linear balance charts’,‘Velocity diagrams’ and ‘Linear scheduling’. [8] also identify ‘Horizontal and verticalscheduling’, and ‘Multiple repetitive construction process’–but aims these at the specific case ofvertical replication repeated in multiple buildings.
All these methods involve repetitive activities and for this Harris and Ioannou suggest a newgeneric term ‘Repetitive scheduling method (RSM)’. However the methods also strongly suggestlocation or place, and thus the use of the term ‘Locationbased scheduling’ proposed by Kenley[1].
110
1.2 Background
Activitybased scheduling dominates most of the world’s construction industries. This is certainlythe case in the Australian industrial context. Little needs to be said to describe the commonmethods for planning projects, as they will be familiar to most. Essentially they are driven bysoftware such as Primavera (the most commonly used package), Microsoft Project and equivalentCPM tools.
The education system in Australia generated students with a deep understanding of the underlyingmechanisms of CPM planning until the mid 1980s. These students were also generally exposed toalternative manual methods such as Flowline [7]. Students of Walter Mohr [7] were moreexposed than many. The advent of powerful software on microcomputers subsequently lead to areliance on packages for the teaching of planning. It is fair to say that nowadays, constructionmanagement courses teach the use of software, paying only a cursory interest in the underlyingprinciples and methods. A consequence of this is a lowering of planning skills, except in the useof software, and a reliance on common approaches. Accordingly, it would be extremely rare tosee application of locationbased scheduling in Australia, indeed few people would have the skillsto understand the method.
Furthermore, locationbased scheduling is best driven by locationbased measurement (BOQ).The standard method of measurement in the Australian industry does not allow for locationbasedmeasurement. The industry has also substantially moved away from measurement of commercialbuilding projects, particularly those procured using Design and Construct methods, and manycommercial contractors simply do not have adequate measurements to support locationbasedtechniques properly.
In contrast, locationbased planning methods have been used widely in Finnish construction sincethe 1980s. The methods were brought to Finland and adapted to commercial construction byprofessors Kankainen and Kiiras from Helsinki University of Technology [9], [10]. In researchtests it was established that the use of modified flowline planning increased productivity anddecreased waiting hours for own workers and for subcontractors [11].
Finland suffered from severe economic recession during 1990s during which many constructioncompanies went bankrupt and the value of real estate plummeted. During the recession, trainingof construction management professionals and construction engineers practically stopped becausejobs were not available. This has resulted in a lack of skilled engineers in the field when theeconomy began to recover. During the recession the flowline scheduling skills were forgotten andthe industry reverted back to using gantt charts which could be easily drawn by using computers.The only available flowline software was a drawing tool and wasn’t suitable for complexplanning.
New research efforts to improve the scheduling skills of the industry were started at the end of1990s by professor Kankainen’s research group. The results included tools such as task planning[12], project control charts, checklists to assess schedule’s feasibility [11] and new contracts to

111
support locationbased control. The research results were used in a software development projectto design a new software able to be used as a planning and control tool. The features of thesoftware DynaProject™ have been described [13].
Because of popularity of the locationbased graphical methods, Finnish construction companieshad never really adopted CPM –based methods. Activities which are linked by precedence logicare rare in Finnish schedules. The schedule is used as a visual planning tool and the plannerscheck for logic errors by examining lines which cross in the flowline diagram.
It is clear, therefore, that a comparison between the Australian industry and the Finnish industry,the methods and practices of planning, would cast valuable light on the culture of planning inboth countries. In this paper, the experience of planning using locationbased schedulingtechniques on a specific project case study from each country is discussed; allowing comparisonsto be made and conclusions drawn about the differences in the culture of planning in eachcountry.
2. Case 1: Residential Construction Project in Sydney
2.1 Description of the Project
Victoria Park stage 302 is a residential complex in inner Sydney. It comprises four residentialtowers of varying heights, joined through a common podium. The largest tower was fifteenfloors, the next nine, then eight and four. There were approximately 300 apartments in total. Theschedule was from May 2004 to June 2005.
2.2 Available Starting Data
Walter Construction Group was totally new to flowline based production control systems. Alltheir systems revolved around CPM and Primavera. As this was a trial to develop more efficientmanagement systems, both CPM schedules and flowline schedules were developed.
There was no quantity takeoff done corresponding to the physical locations of the building. Norwas there any available database of production rates. This is common within the Australianindustry, where subcontract packages are generally allocated a number of days of work for eachtask, in precedence logic, and no attempt is made to ensure continuity of work flow.
2.3 Scheduling Process
Because of the poor starting data, it was difficult to schedule the project using locationbasedmethods. It was necessary to take the CPM schedule and artificially apply it to a locationbased

112
methodology. This presented the first significant barrier to implementation: the automatic systemsdesigned into the software could not be used and the inability to use quantities and productivitydata exposed the shortcomings of CPM only systems which are not sensitive to designedproductivity changes.
The CPM schedule was never fully completed due to the complexity and scale of the projects.Therefore, the CPM schedule calculated a typical floor in detail, then replicated this for eachfloor. This is understandable, as with 300 apartments and with approximately 50 activities toschedule, it would be necessary to schedule around 15,000 activities. In contrast, the locationbased methodology required only 50 activities, with the approximation of quantity in each of 300locations. A simple trick was employed to achieve this: The unit of quantity measured was astandard shift, with the number of days of work being the actual measurement. This roughapproximation allowed reproduction of the CPM schedule, but exposed the problem ofmanipulating the productivity to improve the schedule (and indeed the problem of a culture offixed durations existent within the industry – a topic for future research).
One important lesson is that this sort of power leads to extremely rich and complex schedules.The loss of dominance of the critical path, replaced by dominance of workflow, results in projectmodels with large quantities of information – all very powerful for managing the project. Toillustrate the complexity, a small section of the finishes schedule for one part of one building isdisplayed in figure 1.

113
Figure 1: Section of finishes schedule for Victoria Park.
The initial schedule resulted in a duration far in excess of the required duration. In order tosimulate alteration of workcrew productivity (the normal method), activities were resourced withworkcrews with 1/10th productivity – and a base multiple of 10 units. Thus 20 units woulddouble productivity and 5 would halve the productivity.
After manipulation, a schedule was developed which conformed to the duration requirements, butwhich ensured that each workcrew was able to work continuously, without interruption, fromstart to end of the project. In the words of one site manager on a later project, “Do you mean tosay that we can not only finish on time, but also have continuous work?”
In contrast to the finnish methods described below, the contractor wanted to continue their use ofscheduling in extreme detail. This may be termed micromanagement [1] and scheduling to suchdetail was considered most unusual by our Finnish colleagues. Their risk management approachresults in less detail and simpler schedules. The detailed approach dictated by a CPM cultureresults in much more detailed schedules, more complex models but powerful management toolswhen used correctly.

114
2.4 Control Process
The project schedule was completed prior to commencement of the finishes work onsite. Theplanned control process was to work with the subcontractors to ensure their productivity ratesmatched with the plan. Once this was done, each workcrew would be able to work continuously,systematically and without interruption – this greatly enhancing their financial performance andthat of the project.
The reality was very different. A competing process was being employed on the project in thedesign stage and unfortunately spilled over into the sitework phase. This process, called ProjectBlue [14] involved intensive focus on team work and integration – very valuable aims. However,the methodology for site work was strictly CPM – and followed the original CPM planningmethod. A typical floor was worked out according to the original plan and trades were told to“pass work on” to following trades. Unfortunately, this method fails due to the conflict between atypical floor schedule and the need to flow resources through multiple floors and buildings. Theresult was largely chaos, work out of sequence and a loss of control. Such performance waslargely accepted however, because this is unfortunately normal practice on any Australianproject.
The result of this conflict is that the locationbased control system was never implemented. Thecompany subsequently reviewed the project and determined that on future projects the methodwould be implemented rigorously and not be sabotaged. A special project team was initiated tofollow this through.
Unfortunately, it must be reported that, due to the failure of the German parent company, WalterConstruction Group failed in February 2005 and this implementation project has now stopped.
2.5 Lessons
This project highlighted that CPM scheduling done in the traditional way presents majorproblems for site management which are generally managed by the site staff though working outof sequence, discontinuous work and work interruptions.
In contrast, a locationbased approach such as flowline has the capacity to deliver more efficientsite work. However, successful implementation requires significant cultural change before it canbe successful. Even with senior management support, the project management team must supportthe innovation.
115
3. Case 2: Business Park Project in Helsinki
3.1 Description of the Project
Opus business park is a 14 500 m2 office building in eastern Helsinki. It is composed of twosections, which can be built independently of each other and of parking hall below the mainbuilding. Both sections have six floors. The total schedule is from August 2004 to December2005.
3.2 Available Starting Data
NCC Construction has devoted a lot of resources to implement flowline based production controlsystems [15]. The quantity takeoff is done corresponding to the physical locations of thebuilding. In this example, all the quantities had been distributed to sections and floors so that theycould be directly utilized in flowline planning. Labour consumption information has also beenstandardized within the company allowing for a very fast planning of first drafts of the schedule.Also the building services quantities are estimated based on project characteristics and size. Theproductivity and quantity databases include information about subcontracted work. The mainprinciple is that subcontracted work should be planned as if it were done with own resourcesbecause otherwise effective control is impossible.
3.3 Scheduling Process
Because of good starting data, it was possible to create many different alternative schedules in ashort period of time. Two main alternatives were examined:
• Completely continuous schedule
• Work continuous in sections but a break between two sections
Completely continuous schedule would have had the same end date as partially continuousschedule but both sections would have been finished at approximately the same time. Partiallycontinuous schedule achieved much of the same benefit but enabled the first section to be finishedearlier thus reducing the risk of exceeding the total duration. The project team decided toimplement the partially continuous alternative and take the break between sections into account incontracts with subcontractors.
It was not possible to change the sequence of sections because the parking hall had to be handedover before the second section could be started. This was because the second section was used asa temporary parking lot for customers of the neighboring supermarket. If the second section couldhave been built first, the project duration would have decreased by one month.
116
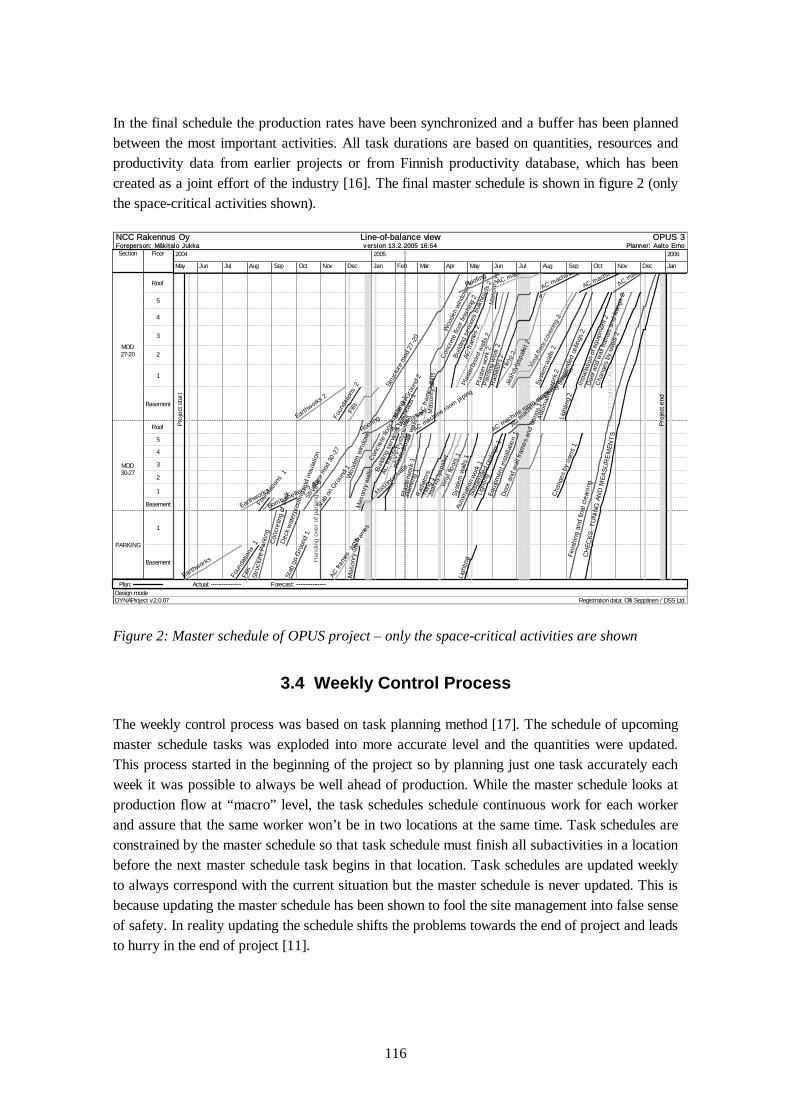
In the final schedule the production rates have been synchronized and a buffer has been plannedbetween the most important activities. All task durations are based on quantities, resources andproductivity data from earlier projects or from Finnish productivity database, which has beencreated as a joint effort of the industry [16]. The final master schedule is shown in figure 2 (onlythe spacecritical activities shown).
NCC Rakennus Oy Lineofbalance view OPUS 3Foreperson: Mäkitalo Jukka v ersion 13.2.2005 16:54 Planner: Aalto Erno
Design modeDYNAProject v2.0.07 Registration data: Olli Seppänen / DSS Ltd.
PÖLY
TTÖ
MYY
S AL
KAA
MO
D 2
027
PÖLY
TTÖ
MYY
S AL
KAA
MO
D 2
735
Section Floor
MOD2720
MOD3027
PARKING
Roof
5
4
3
2
1
Basement
Roof
5
4
3
2
1
Basement
1
Basement
Plan: Actual: Forecast:
2004
May Jun Jul Aug Sep Oct Nov Dec
2005
Jan Feb Mar Apr May Jun Jul Aug Sep Oct Nov Dec
2006
Jan
Proj
ect s
tart
Proj
ect e
nd
Han
ding
ove
r of p
arkin
g de
ck
CH
ECKS
, TU
NING
AN
D M
EASU
REM
ENTS
Earthworks
Earthworks
Earthworks
2
Foun
datio
ns 1
Foun
datio
ns 1
Foun
datio
ns 2
Fills
Fills
Bomb shelters 5 & 6
Slab
on
Gro
und
1
Slab
on G
roun
d 1
Slab
on
Grou
nd 2
Mas
onry
wal
ls
Mas
onry
wal
ls
Mas
onry
wal
ls
Mas
onry
wal
ls
Mason
ry wallsBu
ildin
g se
rvic
es b
ulkhe
ads
1
Build
ing s
ervi
ces
bulkh
eads
2
Plas
terb
oard
wal
ls 1
Plas
terb
oard
wall
s 2
Pain
ting
1
Plas
terw
ork
1
Pain
ting
wor
k 2
Plas
ter w
ork
2
Tilin
g 1
Tilin
g 2
Viny
l flo
ors
1
Viny
l floo
r cov
ering
2
Syst
em w
alls
1
Syst
em w
alls
2
Susp
ende
d ce
ilings
1
Susp
ende
d ce
ilings
2
Equi
pmen
t ins
talla
tion
1
Inst
alla
tion
of e
quip
men
t 2
Door
and
wal
l fra
mes
and
fittin
gs 1
Doo
r and
wal
l fra
mes
and
fitti
ngs
2
Fini
shin
g an
d fin
al c
lean
ing
Cha
nges
by
user
s 1
Cha
nges
by
user
s 2
Stru
ctur
e Pa
rkin
g
Stru
ctur
e m
od 30
27
Stru
ctur
e m
od 2
720
Woo
den
wind
ows
Woo
den
wind
ows
2
Conc
rete
floor
finis
hing
1
Conc
rete
floo
r fini
shing
2
Roofing
Roofing
1
LVV
Pyst
ynou
sut
Rad
iator
s
AC machine room piping
AC machine room piping
4
Rad
iato
rs 2
AC fr
ames
AC fr
ames
AC fr
ames
AC machinery
AC machineryAC fr
ames
2
AC fr
ames
2
Jääh
dytys
palki
t
Jääh
dytys
palki
t 2
Ligh
ting
Ligh
ting
AC machine room electricity
AC machine room electricity
Ligh
ting
2
Auto
mat
ion
work
1
Auto
mat
ion
work
2
AC machine room automation
AC mac
hine r
oom au
tomati
on
Con
cret
ing
of d
eck
Dec
k wat
erpr
oofin
g an
d in
sula
tion
Figure 2: Master schedule of OPUS project – only the spacecritical activities are shown
3.4 Weekly Control Process
The weekly control process was based on task planning method [17]. The schedule of upcomingmaster schedule tasks was exploded into more accurate level and the quantities were updated.This process started in the beginning of the project so by planning just one task accurately eachweek it was possible to always be well ahead of production. While the master schedule looks atproduction flow at “macro” level, the task schedules schedule continuous work for each workerand assure that the same worker won’t be in two locations at the same time. Task schedules areconstrained by the master schedule so that task schedule must finish all subactivities in a locationbefore the next master schedule task begins in that location. Task schedules are updated weeklyto always correspond with the current situation but the master schedule is never updated. This isbecause updating the master schedule has been shown to fool the site management into false senseof safety. In reality updating the schedule shifts the problems towards the end of project and leadsto hurry in the end of project [11].
117
Every week on Tuesday, the actuals from the last week were compared with the weeklyassignments derived from all of the task schedules. The data was collected from site by using thecontrol chart, a matrix of locations and tasks which shows with color codes the status of eachlocation [13]. The reliability of task plans was measured by calculating the percentage ofplanned assignments completed (PPC) during the week. This measure is the same as in the LastPlanner™ system of production control (e.g. [18]) but the assignments are the result of flowlinebased task planning process.
All existing task schedules were updated next to take changed circumstances and actualproduction into account. Actual production rates were used in task schedule updates to makeschedules more accurate and to show increased resource needs. The master schedule sets theboundaries for planning so the problems couldn’t be pushed farther than the end of masterschedule task in a location. All the updating was done using best possible information. The aimwas to make best possible forecasts for the rest of the task while preserving continuousproduction for as many workers as possible. Most effort was expended on updating the nextweek’s plan because the next week’s task schedules were commitments by the planners.
If there was sufficient information on a master schedule task which was about to begin in the nextfew weeks, new task schedule was planned. The first draft of the task schedule used accuratequantities taken from current drawings and estimated production rates. It was planned by the siteengineer. Before beginning of production, the task schedule went through multiple rounds ofcomments by the subcontractor, the superintendent and procurement people.
After updating the task schedules the status of master schedule was evaluated based on computercalculated forecasts. [19] If the delay of a task endangered the continuous flow of another task,control actions were planned by updating the task schedules to minimize the risk of interference.Actual situation and resource availability of the subcontractor as well as the cost effects ofacceleration were evaluated to arrive at the best solution. If interference couldn’t be avoided, taskplanning was used to estimate the optimal time to continue production for the disturbed trade.
The resulting set of task schedules were uptodate, took into account the availability of resourcesand were based on actual circumstances. From these task schedules the production objectives forthe next week were established. These objectives were communicated to the subcontractors andsuperintendents. Their success was evaluated in the next Tuesday’s schedule update bycalculating the PPC.
This weekly control process took two to four hours time from the project engineer and one of theauthors (OS). In addition, the project engineer used time in communicating the plan, assessing thecircumstances and getting the actual data from site.

118
3.5 Results
The project was still on way during the writing of this paper. The structure of the first section andthe parking hall were finished and the interior works of the first section were on way. In spite ofmany deviations from the plan, the project was overall on schedule. Main problems includedearthworks and structure. Structure had too tight a schedule in the master schedule, a fact takeninto account in risk analysis. Because of the buffers between structure and interior work, thedelay of structure didn’t have an impact on the interior works and their flow wasn’t disturbed.However, the structure of the second section started late because it was using the same towercrane. Control actions are needed in the immediate future, or there will be interference in thesecond section. Figure 3 shows actuals (dotted lines) and forecasts (dashed lines) on top of theoriginal schedule (solid lines). Master schedule hasn’t been updated and can still be used tocontrol production. The results indicate that the master schedule was on sufficiently rough levelof detail that it could accurately forecast how the project would be carried out.
NCC Rakennus Oy Lineofbalance view OPUS 3Foreperson: Mäkitalo Jukka v ersion 13.2.2005 19:54 Planner: Aalto Erno
Control modeDYNAProject v2.0.07 Registration data: Olli Seppänen / DSS Ltd.
PÖLY
TTÖ
MYY
S AL
KAA
MO
D 2
027
PÖLY
TTÖ
MYY
S AL
KAA
MO
D 2
735
Section Floor
MOD2720
MOD3027
PARKING
Roof
5
4
3
2
1
Basement
Roof
5
4
3
2
1
Basement
1
Basement
Plan: Actual: Forecast:
2004
May Jun Jul Aug Sep Oct Nov Dec
2005
Jan Feb Mar Apr May Jun Jul Aug Sep Oct Nov Dec
2006
Jan
Proj
ect s
tart
Proj
ect e
nd
Han
ding
ove
r of p
arkin
g de
ck
CH
ECKS
, TU
NING
AN
D M
EASU
RE
MEN
TS
Earthworks
Earthworks
Earthworks
2
Foun
datio
ns 1
Found
ation
s 1
Foun
datio
ns 2
Fills
Fills
Bomb shelters 5 & 6
Slab
on
Gro
und
1
Slab
on G
roun
d 1
Slab
on
Grou
nd 2
Masonry
walls
Mason
ry wall
s
Mas
onry
wal
ls p
art 2
Build
ing
serv
ices
bulkh
eads
1
Build
ing s
ervi
ces
bulkh
eads
2
Plas
terb
oard
wal
ls 1
Plas
terb
oard
wall
s 2
Pain
ting
1
Plas
terw
ork
1
Pain
ting
wor
k 2
Plas
ter w
ork
2
Tilin
g 1
Tilin
g 2
Viny
l flo
ors
1
Viny
l floo
r cov
ering
2
Syst
em w
alls
1
Syste
m w
alls
2
Susp
ende
d ce
ilings
1
Susp
ende
d ce
ilings
2
Equi
pmen
t ins
talla
tion
1
Inst
alla
tion
of e
quip
men
t 2
Doo
r and
wal
l fram
es a
nd fi
tting
s 1
Door
and
wal
l fra
mes
and
fittin
gs 2
Fini
shin
g an
d fin
al c
lean
ing
Cha
nges
by
user
s 1
Chan
ges b
y us
ers
2
Stru
ctur
e Pa
rkin
g
Stru
ctur
e m
od 3
027
Stru
ctur
e m
od 2
720
Woo
den
wind
ows
Woo
den
wind
ows 2
Conc
rete
floo r
finis
hing
1
Conc
rete
floor
finish
ing 2
Roofing
Roofing
Radi
ator
s
AC machine room piping
AC machine room piping
4R
adia
tors
2
4
AC machinery
AC machineryAC fr
ames
2
AC fr
ames
2
Jääh
dytys
palki
t
Jääh
dytys
palki
t 2
Ligh
ting
Ligh
ting
AC machine room electricity
AC machine room electricity
Light
ing
2
Auto
mat
ion
work
1
Auto
mat
ion
work
2
AC machine room automation
AC mach
ine ro
om auto
mation
TaSu
: Kan
nenb
et.
Dec
k w
ater
proo
fing
and
insu
latio
n
Figure 3: Master schedule of the Opus project planned lines (solid), actuals (dotted lines) andforecasts (dashed lines)
Systematic weekly control process improved the project team’s feeling of control. Measuring thepercentage of weekly assignments completed (PPC) was found to motivate the team to takeplanning more seriously and to strive for best possible results. This showed in an increase of thePPC from 50 % level to near 80 % level during the initial stages of the project. Improvement inPPC correlated with the catch up of the schedule.

119
Combining task planning with master schedule based schedule forecasts worked well because ifthe site set too relaxed weekly targets, the master schedule forecasts alarmed that there will beproblems in the future. If the site set too tight, unrealistic objectives, the PPC value plummeted.Catch up can be planned to be incremental by updating the task plans. By combining the systems,the site can set realistic objectives, commit to them and maintain control of the overall schedule.
4. Discussion
There are very significant cultural differences between the methods, despite the fact that the samesoftware tool was being employed. Indeed, it was realised that neither group could reallyunderstand the schedules generated by the other.
The Australian planners, while they liked the idea of the risk management schedules and the rapidconstruction of schedules from quantities and templates, could not accept their validity in theircontext and insisted on their detailed CPMlike, micromanaged, flowline schedules. They didn’tunderstand the concept of buffers, preferring instead a fixed lag (delay) between activities in thenetwork.
The Finnish planners, in contrast, had never seen such large and complex models, and werefascinated by the complexity, but equally could not justify the approach, fearing that suchprecision and detail without buffers in time or location, would lead to problems inimplementation.
This illustrates that the risk management approach and the CPM approach provide twocompletely different planning systems. Improving our understanding these differences, nowidentified, will be an important research project for the future.
5. Conclusion
Flowline, as a technique, and DYNAProjectTM as a software tool, have demonstrated theircapacity to be used in completely different ways according to the underlying planning culture.This project demonstrated that flowline can provide a powerful planning and control tool forprojects, with two completely different methodologies available.
References
[1] Kenley, R. (2004). Project Micromanagement: Practical Site Planning And Management OfWork Flow. 12th Annual Lean Construction Conference. Copengagen. 194205.
[2] Gordon, J. &Tulip, A. (1997). Resource scheduling. International Journal of ProjectManagement. 15, 359370.

120
[3] Dawson, C.W. &Dawson, R.J. (1995). Generalised activityonthenode networks formanaging uncertainty on projects. International Journal of Project Management. 13, 353362.
[4] Herroelen, W., et al. (2002). Critical Chain project scheduling: Do not oversimplify. ProjectManagement journal. 33, 4860.
[5] Arditi, D., et al. (2001). Effect of learning on lineofbalance scheduling. International Journalof Project Management. 19, 265277.
[6] Harris, R.B. &Ioannou, P.G. (1998). Scheduling projects with repeating activities. Journal ofConstruction Engineering and Management. 124, 269278.
[7] Mohr, W.E. (1991). Project Management and Control, pp. Department of Architecture andBuilding, University of Melbourne, Melbourne.
[8] Kang, L.S., et al. (2001). Optimal schedule planning for multiple, repetitive constructionprocesses. Journal of Construction Engineering and Management. 127, 382390.
[9] Kiiras, J. (1989). OPAS ja TURVA, Erityiskohteiden työnaikaista ohjausta palvelevaaikataulu ja resurssisuunnittelu. (A schedule and resource planning system for theimplementation phase of special projects), pp. Helsinki University of Technology. ConstructionEconomics and Management Publications, Helsinki.
[10] Kankainen, J. &Sandvik, T. (1993). Rakennushankkeen ohjaus. (Controlling a constructionproject), pp. Confederation of Finnish Construction Industries, Rakennustieto Oy, Helsinki.Finland.
[11] Kankainen, J. &Kolhonen, R. (2005). Rakennushankkeen aikataulusuunnittelu ja valvonta.(The schedule planning and control of a construction project). pp. Rakennustieto Oy., Helsinki.
[12] Junnonen, J.M. (1998). Tehtäväsuunnittelu ja laatupiiriohjattu tuotannonohjaus. (Taskplanning and quality circles in production control). In: Department of Civil and EnvironmentalEngineering Ed.^Eds.), Vol. p.^pp. Helsinki University of Technology, Espoo, Finland.
[13] Kankainen, J. &Seppänen, O. (2003). A lineofbalance based schedule planning and controlsystem. The 11th Annual Conference on Lean Construction. Blacksburg, Virginia. 132143.
[14] Crow, T. &Barda, P. (2004). Project strategic planning: A prerequisite to lean construction.12th Annual Lean Construction Conference. Copengagen. 913923.
[15] Soini, M., et al. (2004). Implementation of LineofBalance based scheduling and projectcontrol system in a large construction company. The 12th international conference of LeanConstruction. Elsinore, Denmark. 725735.

121
[16] Olenius, A., et al. (2000). Ratu aikataulukirja 2001, pp. Conferederation of FinnishConstruction Industries RT and Rakennustietosäätiö, Tampere, Finland.
[17] Junnonen, J.M. &Seppänen, O. (2004). Task planning as a part of production control. The12th international conference of Lean Construction. Elsinore, Denmark. 183193.
[18] Ballard, G. (2000). The Last Planner™ system of production control. In: School of CivilEngineering Ed.^Eds.), Vol. p.^pp. The University of Birmingham, Birmingham.
[19] Seppänen, O. &Kankainen, J. (2004). An empirical research on deviations in production andcurrent state of project control. The 12th international conference of Lean Construction. Elsinore,Denmark. 206219.

![Britt Kenley - [Guardians of the Gray Tower 7] - Guardian's Hope](https://cdn.vdocument.in/doc/165x107/577c81291a28abe054abb84f/britt-kenley-guardians-of-the-gray-tower-7-guardians-hope.jpg)


