
HAL Id: hal-00318979https://hal.archives-ouvertes.fr/hal-00318979
Submitted on 5 Sep 2008
HAL is a multi-disciplinary open accessarchive for the deposit and dissemination of sci-entific research documents, whether they are pub-lished or not. The documents may come fromteaching and research institutions in France orabroad, or from public or private research centers.
L’archive ouverte pluridisciplinaire HAL, estdestinée au dépôt et à la diffusion de documentsscientifiques de niveau recherche, publiés ou non,émanant des établissements d’enseignement et derecherche français ou étrangers, des laboratoirespublics ou privés.
Cell surface detection of membrane protein interactionwith homogeneous time-resolved fluorescence resonance
energy transfer technology.Damien Maurel, Julie Kniazeff, Gérard Mathis, Eric Trinquet, Jean-Philippe
Pin, Hervé Ansanay
To cite this version:Damien Maurel, Julie Kniazeff, Gérard Mathis, Eric Trinquet, Jean-Philippe Pin, et al.. Cell surfacedetection of membrane protein interaction with homogeneous time-resolved fluorescence resonanceenergy transfer technology.. Analytical Biochemistry, Elsevier Masson, 2004, 329 (2), pp.253-62.<10.1016/j.ab.2004.02.013>. <hal-00318979>
1
Running title: HTRF® technology for detection of cell surface protein
interaction
Cell surface detection of membrane protein interaction with HTRF®
technology
Maurel Damien, Kniazeff Julie*, Mathis Gérard, Trinquet Eric, Pin Jean-Philippe*
and Ansanay Hervé§
Cis Bio International, BP 84175, 30204 Bagnols sur Ceze Cedex, France
* UPR 2580 CNRS, 141, Rue de la Cardonille, 34094 Montpellier Cedex 5, France
§Correspondence should be addressed to Dr Hervé Ansanay, Cis Bio International,
BP84175 30204 Bagnols sur Ceze, Cedex, France.
Email: [email protected]
2
Abstract:
Direct or indirect interactions between membrane proteins at the cell surface
play a central role in numerous cell processes, including possible synergistic effects
between different types of receptors. Here we describe a method and tools to
analyze membrane protein interaction at the surface of living cells. This technology is
based on the use of specific antibodies directed against each partner and labeled
either with europium cryptate or Alexa Fluor® 647. This allows the measurement of a
FRET signal in a time resolved manner if both antibodies are in close proximity. This
approach is here validated using the heterodimeric GABAB receptor as a model. We
show that after washing out the unbound antibodies, the time-resolved FRET (TR-
FRET) signal can be measured together with the expression level of both partners via
the quantification of the donor and acceptor fluorophores bound to the cells. Thanks
to the high sensitivity of this method and to the low concentration of antibodies
required, we show that the signal can also be measured directly after the incubation
period without washing out the unbound antibody (Homogeneous Time Resolved FRET,
HTRF®). As such this method is highly sensitive, reproducible and compatible with
the development of high throughput screening protocols.
3
Introduction
Protein-protein interactions, either direct or indirect, play a central role in
numerous cellular processes. Although this is the subject of intense research for
intracellular proteins, less is known for the membrane proteins at the cell surface.
Indeed, a number of regulatory processes have been recently shown to result from
the direct association of membrane proteins, either via their direct interaction or
through intracellular scaffolding proteins [1-6]. Such interactions likely have
important consequences in the integration of simultaneous extracellular signals via
synergistic effects between the activities of these interacting proteins. It is
therefore of importance to develop tools and technologies that can be used to
analyze selectively interactions between membrane proteins at the cell surface.
Up to now, interactions between membrane proteins have been examined
through biochemical approaches such as migration of protein complexes in SDS page,
or co-immunoprecipitation studies [7]. Enzyme complementation assays have also been
used successfully to demonstrate protein-protein interaction in living cells [8]. Within
the last few years, FRET methodologies are being commonly used to measure
molecular proximity. These methods need labeling of target proteins with a pair of
donor and acceptor fluorophores. This can be achieved either by genetic fusion of a
cDNA encoding a fluorescent protein [9, 10], or direct chemical labeling of the
proteins [11]. So far, the most commonly used methods take advantage of either the
cyan and yellow variants of the green fluorescent protein (GFP) for FRET (FRET-GFP)
[12], or luciferase and GFP for Bioluminescence Resonance Energy Transfer (BRET)
[13]. Although the FRET-GFP assay is well suited for imaging [14], it is not sensitive
enough for direct measurement in culture wells, as requested for high throughput
screening (HTS) protocols. Whereas the BRET assay can be used in such a multi-well
plate format, the addition of coelenterazin to stimulate luciferase at a precise time
before reading the signal impairs the use of this method in HTS. Finally, all these
4
methodologies measured the association of the studied proteins in all cell
compartments, leading to the possible observation of membrane protein-protein
association resulting from their clustering during their trafficking to or from the
plasma membrane, but not necessarily from their association at the cell surface.
Recently, fluorophore-conjugated antibodies specific for extracellular epitopes
(either native or engineered) of membrane proteins were used to visualize protein
interaction at the cell surface of intact cells. Patel's group used antibodies labeled
with fluorescein and rhodamine to monitor the association of various types of GPCRs
at the cell surface [15, 16]. However, FRET between these two fluorophores could
only be measured using photobleaching of the acceptor molecule, a technique not
suitable for rapid measurements in a multi-well plate format. A second group used
europium-chelate and an allophycocyanin protein (XL665) conjugated antibodies [17].
The long emission lifetime allows a time-resolved measurement of the FRET signal
(TR-FRET). This avoids any signal contamination generated by shorter-lived signals
and makes this system very sensitive. However the washing steps needed to extract
the specific signals from the large background resulting from the use of high
concentration of antibodies, limited its usefulness in high-throughput analysis of
membrane protein interaction.
In the present study, we examined whether the Homogenous Time Resolved
FRET (HTRF®) technology [18] (measurement of the TR-FRET signal at the end of
the incubation period without washing out the unbound antibodies) using europium
cryptate and Alexa Fluor® 647, or europium cryptate and XL665-anti tag labeled
antibodies can be used to visualize membrane proteins interactions at the surface of
living cells. To that aim we used the γ-aminobutyrate B (GABAB) receptor as a model
system since this GPCR has been reported to form obligatory heterodimers composed
of the GABAB1 and GABAB2 subunits [19]. Indeed, the GABAB1 subunit involved in
agonist binding [20, 21] is naturally retained in the endoplasmic reticulum (ER) when
expressed alone. The GABAB2 subunit, responsible for the G-protein activation [22,
5
23], unmasks the ER retention of GABAB1 and thus allows the expression of the
heterodimer at the cell surface [24, 25].
We show here the reproducibility and the specificity of the TR-FRET method
that allows the quantification of the FRET signal and the expression level of both
partners in the same well. We also show that the method is sensitive enough for
HTRF® measurements, making it compatible with the development of HTS assays.
Recently, this technology has been used to elucidate the molecular determinants
involved in the allosteric control of agonist affinity within the dimeric GABAB
receptor [26].
6
Materials and Methods
Culture and Transfection of Human Embryonic Kidney (HEK 293) cells
Cells were cultured in Dulbecco’s modified Eagle’s medium (DMEM; Invitrogen
SARL) supplemented with 10% fetal calf serum and antibiotics (penicillin and
streptomycin, 100 U/ml final). The plasmids expressing the rat V2 vasopressin
receptor [27], the GABAB1 and GABAB2 receptor subunits [22, 23] carrying either a
Haemagglutin (HA) or a myc epitope at their N-termini were described previously.
Electroporation was performed in a volume of 300 µl with a total of 10 µg of DNA
(GABAB-subunits 1 and 2 plasmid DNA (2 µg each), V2 receptor (1 µg) and carrier DNA
(pRK6 to a final amount of 10 µg)), and 10 million cells in electroporation buffer (50
mM K2HPO4, 20 mM CH3COOK, 20 mM KOH, pH 7.4). After electroporation (260 V, 1
mF, Bio-Rad Gene Pulser electroporator; Bio-Rad Laboratories, Hercules, CA), cells
were resuspended in DMEM supplemented with 10% fetal calf serum and antibiotics in
culture dishes for 24 hrs.
Antibodies and labeling
The monoclonal anti-myc antibody, 9E10 (ATCC no. CRL-1729) and monoclonal anti-HA
antibody, 12CA5 mAb provided by Cis Bio Intl Research were labeled in house with
the different fluorescent donors or acceptors. The donor was a Pyridine-BiPyridine
europium cryptate (europium cryptate-PBP). Such europium cryptate allows the
development of HTRF assays without the addition of fluoride ions in the reaction
buffer. Such ions prevent any potential fluorescence quenching effect from media
[28]. However, they have to be avoided in cellular assays to ensure a perfect cellular
integrity. A maleimide derivative of the europium cryptate-PBP was used to label the
different antibodies as the following.
Both anti-HA and anti-myc antibodies were activated with 8 equivalents of N-
Succidimidyl 3-[2-pyridylthio]propionate (SPDP) (Pierce) previously dissolved in

7
ethanol (FLUKA). After a 30 min incubation at room temperature, DTT (Sigma) was
added at the final concentration of 10 mM in the antibody solution. Reduction step
was incubated 15 min at room temperature, followed by an activated antibody
purification on a Sephadex-G25 SF HR10/10 column (Pharmacia) pre-equilibrated with
a 0.1 M phosphate buffer pH 7.0. An antibodies labeling with europium cryptate-PBP
was done with a 12 fold excess of europium cryptate-PBP per antibody. Coupling
reactions were incubated for 24 hrs at +4°C. Europium cryptate–PBP conjugates were
purified on a G25 SF HR10/30 column (Amersham Pharmacia Biotech) pre-
equilibrated with a 0.1 M phosphate buffer pH 7.0. The number of europium cryptate-
PBP per antibody (molar ratio) was determined spectrophotometrically by measuring
their absorbance at 280 nm and 317 nm, and inserting the measured values into the
following equation:
Molar ratio = (OD317nm/εEuropium cryptate-PBP)/[(OD280nm-(OD317nm/A))/εantibody]
where the molar extinction coefficients of the europium cryptate-PBP (εeuropium cryptate-
PBP) was taken as 18,000 M-1.cm-1, the molar extinction coefficients of the antibodies
was taken to be 210,000 M-1.cm-1. The factor A expressed the ratio
(OD317nm/OD280nm) for europium cryptate-PBP and was determined to be 2. Molar ratio
was determined to be 7 for the anti-HA.
The acceptors used were Alexa Fluor® 647 (Molecular Probes) [29] or XL665.
XL665 conjugates were synthesized as previously described [30]. A N-
hydroxysuccinimide ester (NHS) derivative of the Alexa Fluor® 647 was used to
label the different antibodies previously dissolved in a carbonate buffer 0.1 M pH=9.
An excess of 6 Alexa Fluor® 647 per antibody was used in the labeling reaction
during 30 min at room temperature. Final conjugates were purified using a G25 SF
HR10/10 column (Amersham Pharmacia Biotech). The final number of dyes per
antibodies was determined spectrophotometrically as described above for the
8
europium cryptate PBP conjugates. OD at 317 nm was replaced by an OD at 650 nm,
which is the maximum of absorption for Alexa Fluor® 647. The molar extinction
coefficient of the Alexa Fluor® 647 at 650 nm was taken as 240,000 M-1.cm-1 and the
factor A expressed the ratio (OD650nm/OD280nm) for Alexa Fluor® 647 and was
determined to be 30. Molar ratios were determined to be 3 for the anti-HA
conjugate and 3 for the anti-myc conjugate.
Time-resolved Fluorescence measurements and Data analysis
Fluorescence Emissions were monitored both at 620 nm and at 665 nm. A 400
µsec integration time was used after a 50 µsec delay to remove from the specific
signal the short-lived fluorescence background. These were measured on a dual
wavelength (665/620 nm) time-resolved fluorimeter (RubyStar, BMG
Labtechnologies) equipped with a nitrogen laser as excitation source (337 nm).
Fluorescence collected at 620 nm in the TR-FRET assay was defined as to be the
total europium cryptate signal. For TR-FRET or HTRF assays, the Ratio
R=[(fluorescence 665 nm/ fluorescence 620 nm) x 104] was computed. Assay signals
were expressed using two parameters: Delta 665 or Delta F.
Delta 665=(Positive energy transfer signal at 665 nm) – (negative signal at 665
nm). It represents the signal released by the acceptor after the FRET process.
The specific signal over background called Delta F was calculated using the
following formula: Delta F=(Rpos - Rneg)/(Rneg). Rneg corresponded to the ratio for
the negative energy transfer control whereas Rpos corresponded to the ratio for the
positive energy transfer control. Two types of negative controls were used when two
distinct antibodies (anti-HA and anti-myc, for example) were used. First, 1 µM of
unlabeled anti-myc monoclonal antibodies (9E10) was added. Second, HEK293 cells
were incubated with the donor-labeled antibodies only. When both controls were
performed in parallel, ratios of the fluorescence measured at 665 nm over that
measured at 620 nm after excitation at 337 nm were similar. Only the second type of

9
negative control was then performed in every experiments thereafter. When FRET
signals were measured with a single type of antibody (a 1:1 mixture of anti-HA
antibody labeled with the donor fluorophore, and anti-HA antibody labeled with the
acceptor fluorophore), the negative control was measured using a 1:1 mixture of
donor-labeled and unlabeled antibodies.
Ro calculation for the FRET pair europium cryptate-PBP and the Alexa Fluor® 647
was done as described [30], and determined as to be ~65Å.
Measurement of the Alexa Fluor® 647 fluorescence
The total fluorescence emitted by the Alexa Fluor® 647 conjugates in the TR-
FRET assay was measured using an AnalystTM reader (Molecular Devices) equipped
with the appropriate filters set (XF47 from Omega Optical). The Alexa Fluor® 647
fluorescence was detected at 682 nm using a 640 nm excitation.
TR-FRET experiments
Cells were harvested 24 h after transfection using dissociation solution
(SIGMA). Trypan blue viability test and counting were routinely performed after
resuspension of transfected cells. An incubation under circle rotator (different time
performed and described in the figure 2) was performed at 4°C with 200,000 cells in
a total volume of 200 µl containing 1 nM europium cryptate-PBP-labeled antibody and
3 nM Alexa Fluor® 647-labeled antibody in PBS supplemented with SVF 25%. Cells
were then washed, resuspended in 100 µl PBS and distributed into a 96 well
microtiter plate. The different fluorescence measurements were determined as
described above.
HTRF® measurement
Twenty four hrs after transfection, 200,000 cells resuspended in 100 µl PBS
supplemented with SVF 25% and containing 1 nM europium cryptate-PBP- and 3 nM

10
Alexa Fluor® 647-labeled antibodies were dispatched into 96 well microtiter plates.
After the indicated time at 4°C (to prevent protein clustering and to limit the
antibodies aspecific fixation) the FRET signal was directly measured as described
above.
Ligand-binding assay
A ligand-binding assay on intact HEK293 cells was performed as described
previously using 0.1 nM of [125I]-CGP64213 [23] with 1 mM GABA being used to
determined the non specific binding.
Determination of inositol phosphate accumulation
Determination of inositol phosphate (IP) accumulation in transfected cells was
performed in a 96 well plate format after labeling the cells overnight with myo-
[3H]inositol (23.4 Ci/mol) as previously described [31].
11
Results
As a protein model system, we choose the GABAB receptor because of its
heteromeric nature, allowing the unambiguous labeling of each subunit (Fig. 1). The
formation of this heterodimer was previously demonstrated after transient
expression of these two subunits in HEK 293 cells as shown by co-
immunoprecipitation experiments and functional coupling of the reconstituted
receptor to G-proteins [23]. Moreover, the wild-type GABAB1 does not reach the cell
surface in HEK 293 cells unless co-expressed with GABAB2 or mutated in its ER
retention signal (GABAB1-ASA) offering the additional possibility to check that only
surface proteins are detected [24, 25]. Finally, insertion of either a myc or HA
epitope after the signal peptide did not affect the expression and function of these
subunits [23].
TR-FRET experiments
In a first set of experiments we examined whether the TR-FRET technology
could be applied with the chosen tools to monitor the existence of GABAB
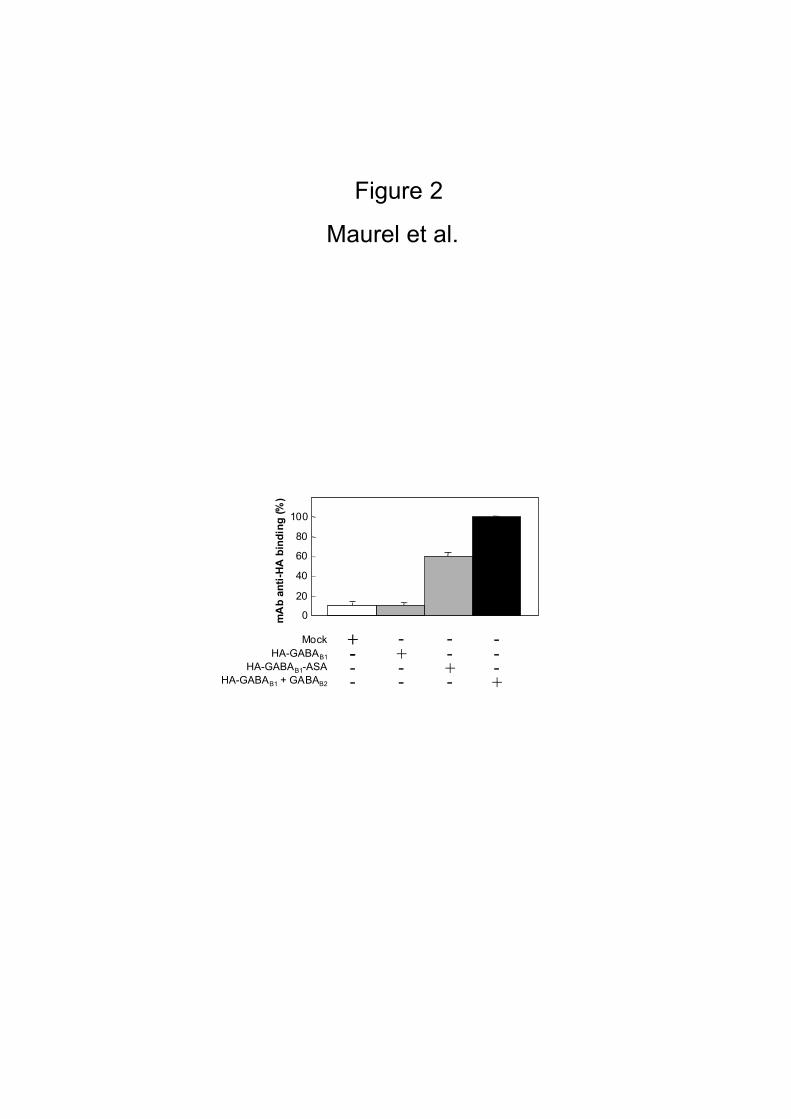
heterodimers. No specific fixation of the HA antibody was observed on cells
expressing the HA-GABAB1 subunit alone, as expected since this subunit is known not
to reach the cell surface in the absence of GABAB2 (Fig. 2). In agreement with this
conclusion, specific labeling of the cells with the anti-HA-europium cryptate-PBP
antibody was obtained in the absence of GABAB2 with a HA-GABAB1 mutant
(GABAB1–ASA) in which the ER retention signal (RSRR) is mutated into ASAR [24].
This confirms binding of the antibody relies on the presence of an extracellular
epitope, such that only cell surface proteins can be detected (Fig. 2). Cells transiently
expressing HA-GABAB1 and myc-GABAB 2 were used to determine the binding
conditions for the antibodies. We found that concentrations as low as 1 and 3 nM for
the anti-HA-europium cryptate-PBP (donor) and anti-myc-Alexa Fluor® 647
12
(acceptor) antibodies, respectively, were sufficient to get a large and specific signal
for each fluorophore on intact cells at 4°C. The detected fluorescence reached a
plateau after 8 hrs incubation followed by cell washing, suggesting the saturation of
the specific recognition sites of the conjugates (Fig. 3A, 3B). Moreover, the specific
signal over background Delta F generated between the donor and the acceptor (Fig.
3C) in close proximity remains stable for at least 24 hrs at 4°C. Similar data were
obtained if XL665 was used as an acceptor fluorophore instead of Alexa Fluor® 647
(data not shown).
We then compared the quantity of fluorescently labeled antibodies HA-GABAB1
at the cell surface, with the binding of the non-permeant GABAB1 radioligand [125I]-
CGP64213. The amount of HA-GABAB1 at the cell surface was controlled by the
quantity of GABAB2. For this reason we co-expressed various amount of myc-GABAB2
subunit with a fixed amount of HA-GABAB1. As shown in Fig. 4, a perfect correlation
was found between both signals indicating that the signal generated by the bound
antibody is directly proportional to the amount of GABAB receptors at the cell
surface.
Under similar conditions, the FRET signal between the bound HA-europium
cryptate-PBP and anti-myc-Alexa Fluor® 647, as determined either by the Delta F
(Fig 5), or by the fluorescent signal at 665 nM (data not shown), was directly
proportional to the amount of GABAB1 at the cell surface measured with [125I]-
CGP64213 binding on intact cells. This confirms that the GABAB receptor is a
heteromer at the cell surface, and that this heteromer formation is not dependent on
the amount of subunits at the cell surface, at least within the range of receptor
density examined here.
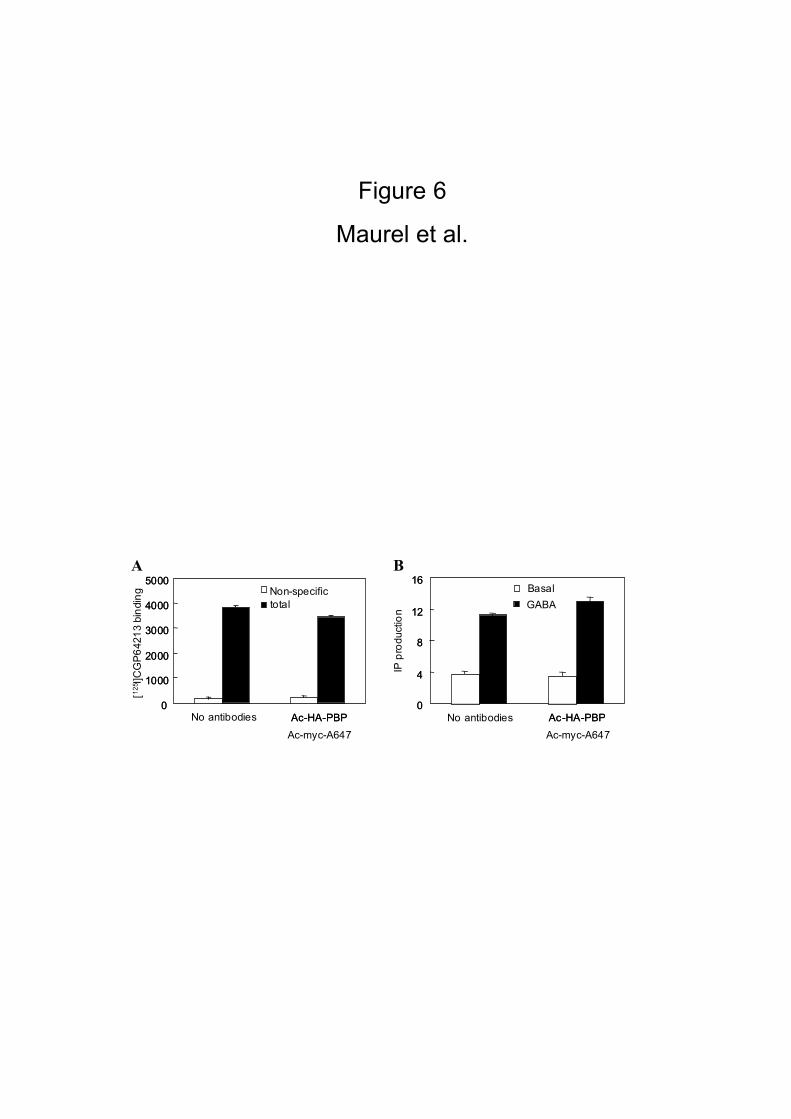
The presence of both anti-HA and anti-myc antibodies on the GABAB receptor
subunits may possibly affect the changes in conformation required for ligand binding
or activation of the receptor. However this is very unlikely since the same amount of
[125I]-CGP64213 binding was measured on intact cells expressing both subunits before

13
or after pre-incubation with saturating concentrations of both antibodies (each at 45
nM incubated overnight at 4°C) (Fig. 6A). Moreover, such a cell treatment did not
prevent the GABAB receptor from activating the chimeric G-protein Gαqi9 that
allows it to stimulate IP formation (Fig. 6B).
In order to verify further the specificity of the FRET signal, we examined
whether such a signal can be generated with antibodies recognizing two membrane
proteins that do not interact. In a first experiment, HA-GABAB1 and non-tagged
GABAB2 were co-expressed in a first set of cells, and non-tagged GABAB1 was co-
expressed with myc-GABAB2 in a second set of cells. No FRET signal was measured
when both populations of cells where co-cultured in the same wells (data not shown).
Moreover, we also co-expressed the HA-GABAB1-ASA mutant that can reach the cell
surface alone, and the vasopressin V2 receptor tagged at its N-terminal end with a
myc epitope, since these two receptors have been reported not to heterodimerize
[32]. As shown in Fig. 7, a very small FRET signal was measured when these two
receptors are co-expressed in the same cells. Indeed, a 10 fold higher signal was
obtained in cells expressing both HA-GABAB1-ASA and myc-GABAB2. This difference
did not result from a differential expression level at the cell surface of these
different constructs, since myc-V2 and myc-GABAB2 proteins were expressed at a
similar level as revealed by measurement of the acceptor fluorescent signal bound to
the cells (Fig. 7B et 7C). This small signal may well be the consequence of a possible
interaction of these two receptors expressed at a high level (cell densitity estimates
for both receptors is 500,000 receptors per transfected cell). Alternatively, this
may be the consequence of random transfer resulting from the relatively high
probability that the two receptors can be close enough due to their high cell surface
density even though they do not physically interact with each other.Our previous
study using chimeric GABAB subunits in which the extracellular domains were swapped
suggested that the 7TM region of GABAB2 could form homodimers [23, 33]. We
therefore examined whether the GABAB1 and GABAB2 subunits homo-oligomerize. To
14
that aim, FRET signals were measured in cells expressing either HA-GABAB1-ASA, or
HA-GABAB2 using an equimolar mixture of HA-antibodies labeled either with
europium cryptate-PBP or Alexa Fluor® 647. As shown in Fig. 8, a FRET signal could
be detected in both cases, though smaller than that measured in cells expressing HA-
GABAB1 and HA-GABAB2. This suggests that both GABAB1-ASA and GABAB2, when
expressed alone, can exist as homo-oligomers at the cell surface. These experiments
demonstrate that membrane protein association can be detected using time-resolved
FRET, after labeling each protein with a specific antibody and washing out the excess
of free antibodies. However, this washing step is a strong limitation in a systematic
approach for detection of membrane protein association.
HTRF Experiments
According to the high sensitivity of the TR-FRET signal generated, and to the
low concentration of the antibodies required for labeling the target proteins, we
examine if the same information could be obtained in a HTRF® assay, reading the
signal at the end of the incubation without removing the free antibodies. To that aim,
the assay signal was measured in cells transfected with HA-GABAB1 and various
amounts of myc-GABAB2 plasmids, before (HTRF® mode) or after washing the free
antibodies (TR-FRET mode). Fig. 9 shows that the HTRF® signal measured with Delta
F within the homogeneous assay is directly proportional to the signal measured after
washing. One can argue that the signal in the TR-FRET mode was found to be twice as
large than in the HTRF® mode. This may be due to the removal of free residual
antibodies during the washing steps in the heterogeneous assay that may increase the
background. Even though the high background due to the presence of europium
cryptate-PBP antibodies, the HTRF® signal was found to be directly proportional to
the amount of GABAB heterodimers at the cell surface (Fig. 10), and also to be
specific since only a small HTRF® signal could be measured (10 fold lower signal)
15
between the myc-V2 and HA-GABAB1-ASA receptors (Fig. 11). For these HTRF
experiments, similar data were also obtained using XL665 as acceptor molecule
instead of Alexa Fluor® 647 (data not shown).

16
Discussion
In the present study, we examined whether a HTRF® assay could be adapted
to examine any possible interaction (direct or indirect) between plasma membrane
proteins at the surface of living cells. For that purpose we used antibodies
conjugated with europium cryptate-PBP or Alexa Fluor® 647 (or XL665) as donor and
acceptor fluorophores, respectively. The intrinsic fluorescence properties of these
fluorophores allow monitoring of a FRET signal at 665 nm in a time-resolved manner,
making this system very sensitive. Moreover, the method described below requires
only nanomolar quantities of antibodies allowing the measurement of the FRET signal
in an homogenous way (HTRF®), making it compatible with the development of HTS
assays.
In a first series of experiments, the TR-FRET signal was measured after
washing out the unbound antibodies, as previously reported by others [17]. Using
europium-cryptate PBP labeled HA-antibodies and Alexa Fluor® 647 labeled myc
antibodies, we were able to detect oligomerization of HA-GABAB1 and myc-GABAB2
subunits in living cells in a 96 well plate format. The TR-FRET signal was observed
only when the two partners were expressed in the same cells, and a 10-20 fold lower
signal was measured when antibodies were directed against two transmembrane
proteins known not to interact, the GABAB1-ASA subunit and the vasopressin V2
receptor [32]. This clearly demonstrates the specificity of this approach. Moreover,
no binding of the HA antibodies could be detected with the wild-type HA-GABAB1
subunit expressed alone. Since this subunit is known not to reach the plasma
membrane alone, this further demonstrates that the assay is specific for the
detection of extracellular epitopes.
The TR-FRET signal measured between the GABAB1 and GABAB2 subunits was
found to be directly proportional to the amount of GABAB1 proteins at the cell
surface. This indicates that the proportion of these subunits in a dimer is not

17
dependent on their density in the plasma membrane, at least in the range of
expression levels examined here. Such an observation would be consistent with the
two subunits forming constitutive and stable dimers, in agreement with their
association early after their synthesis, likely in the ER [24, 25]. Such an analysis also
revealed a specific signal can be detected with as low as 500 cpm of [125I]–CGP64213
bound to the cells, indicative of 10 fmol of receptors per well, demonstrating the
sensitivity of this method.
Not only can heteromers be analyzed, but also homodimers. In that case we
used equal amount of europium-cryptate PBP- and Alexa Fluor® 647 labeled anti-HA
antibodies. This allowed us to show that GABAB1-ASA (the GABAB1 mutant that can
reach the cell surface alone), as well as GABAB2 can both form homodimers at the cell
surface. Since no consistent functioning of the GABAB1-ASA was reported [24, 25],
our data show that this is not due to the inability of this subunit to exist in a
homodimeric form in the plasma membrane.
Our data also revealed that bound antibodies do not affect the ligand binding
and G-protein coupling of the GABAB receptor. However, the FRET signal measured on
intact cells was affected neither by agonists nor antagonists (data not shown),
consistent with the notion that the GABAB receptor is a constitutive dimer, and that
ligand binding does not affect this process. Although agonist binding unlikely modifies
the proportion of dimers at the cell surface, a possible large change in conformation
may also result in a change in FRET signal, either due to a change in the distance
between the two fluorophores, or to a change in their relative orientation. Based on
the crystal structure of the dimer of ligand binding domain of the metabotropic
glutamate receptor 1 (a receptor homologous to the GABAB receptor), a large change
in conformation of the dimer of extracellular domains of the GABAB subunits is
expected [34]. However, such a change in conformation is unlikely to be detected by
our approach for several reasons. Firstly, several (3-7) fluorophores are usually linked
to each antibody molecules, such that a positive change in the transfer efficacy

18
between one donor and one acceptor molecule, can be compensated by a negative
change for another donor/acceptor pair. Secondly, the position of the antibody on
each subunit is likely highly variable during time, making more difficult the detection
of conformational changes. Thirdly, the position of the fluorophore is not known, and
is unlikely the same for all antibody molecules. Finally, the change in conformation
may be too small compare to the Foster's radius (R0) of the fluorophore pair to be
detected by such an approach.
Taking advantage of the high sensitivity of this assay, and to the low
concentration of antibodies required for saturation of the recognized epitopes, the
TR-FRET signal can also be measured in an homogeneous assay – i.e. without washing
out the unbound antibodies (HTRF® assay). Indeed, our data revealed that the signal
measured under these conditions is even higher than that measured after washing,
likely because some cells as well as some bound antibodies are lost during the washing
step. Again, our data show that the signal is specific and the technique sensitive.
Such a technology is therefore well suited for the rapid examination of protein-
protein interaction, and is compatible with an HTS format. Such an assay may prove
to be useful for the screening of mutant subunits no longer interacting with each
other, and for the screening of other transmembrane or extracellular partners of
these subunits. Other biological processes such as a dynamic association of membrane
proteins upon activation of specific cellular pathways or ligand occupation of any of
the studied partners can also be rapidly examined with this technique. This assay may
also be of interest to search for molecules able to modify the oligomerization state
of transmembrane proteins. The issue of such methodology has many potential fields
of applications, as illustrated by the recent elucidation of the molecular determinants
involved in the allosteric control of agonist affinity within the dimeric GABAB
receptor [26]. With the help of powerful and well-designed antibodies raised against
extracellular epitopes of two putative partners, this HTRF® technology may be
reasonably extended to wild-type native proteins. This will undoubtedly lead many

19
researchers to investigate the mechanisms underlying numerous oligomeric
assemblies.
Acknowledgements
This work was supported by grants from the Centre National de la Recherche
Scientifique (CNRS) ; the Action Concertée Incitative "Molécules et Cibles
Thérapeutiques" from the french government and Cis Bio International (DIVT 2035 –
CNRS 751869/00) (Marcoule, France). The authors whish also to thank K. Kaupmann
and W. Froestl (Novartis Pharma, Basel, Switzerland) who allowed us to use [125I]-
CGP64213. We thank Drs. L. Prézeau and T. Durroux for constructive discussions and
constant support throughout this work, and C. Vannier for her technical assistance.

20
Figure Legends
Figure 1
1A: Model system used for the TR-FRET and HTRF® protein-protein interaction
format assays. Two subunits constitute the dimeric protein and they carry epitope
tags at their N-extracellular termini. Two conjugated antibodies were used to
generate a FRET signal if the tandem pair is in close proximity. Finally, the energy
transfer from europium cryptate-labeled anti-tag A antibodies to Alexa Fluor® 647-
labeled anti-tag B antibodies was evaluated (see Materials and Methods).
1B: Incubation of the antibodies with cells in TR-FRET and HTRF® assays.
1C: FRET signal in HTRF® assays was measured without washing steps, making it
compatible with the development of HTS assays.
1D: FRET signal in TR-FRET assays was measured after washing steps.The
fluorescence generated by the bound antibody is directly proportional to the amount
of receptors at the cell surface.
Figure 2
The binding of the HA mAb was performed on HEK 293 cells transiently transfected
(mock, HA-GABAB1 alone, HA-GABAB1-ASA or HA-GABAB1 and GABAB2). The maximal
binding (100%) corresponds to the heterodimeric GABAB format and the nonspecific
binding is revealed on the mock. No specific fixation of the HA antibody was
detected on cells expressing only the HA-GABAB1 subunit, whereas the HA-GABAB1-
ASA mutant, able to reach the cell surface alone, was unambiguously detected.
Histobars represent the mean +/- SD of quadruplicate of a representative
experiment from three distinct experiments
21
Figure 3
Time course of binding of the two conjugated antibodies was measured as described
in Materials and Methods in the TR-FRET format assay. We performed binding of
europium cryptate-labeled HA antibodies and Alexa Fluor® 647-labeled myc
antibodies on the heterodimer GABAB receptor at the HEK 293 cell surface. The
fluorescence of the donor (europium cryptate-PBP) (3A) and the fluorescence of the
acceptor (Alexa Fluor® 647) (3B) were measured respectively at different times
after washes. Finally, the FRET signal over background, which is assessed by the
Delta F and represents the energy transfer between the two fluorophores, is
determined (3C). Equilibrium is reached after 8 hrs. Each point represents the mean
+/- SD of quadruplicate of a representative experiment from at least four
independent transfections. The lines shown through these points were calculated non-
linear regression analysis of the data points using the Prism Software package.
Figure 4
Binding was determined as described in Materials and Methods with the non-
permeant GABAB1 radioligand [125I]-CGP64213. HEK 293 cells were transiently co-
transfected for 24 hrs with fixed amount of HA-tagged GABAB1 subunits and an
increased of myc-tagged GABAB2 subunits. A perfect linear correlation (R2 = 0.9987)
was found between binding and fluorescence signals.
Figure 5
5a, 5b: FRET signal was calculated with two different ratio methods and compared to
the binding on GABAB1 at the cell surface. HEK 293 cells were transiently co-
transfected for 24 hrs with HA-tagged GABAB1 subunits and various amounts of myc-
tagged GABAB2 subunits. Anti-HA-europium cryptate-PBP and anti-myc-Alexa Fluor®

22
647 antibodies were used as performed in figure 2. Delta F was calculated as
described in Materials and Methods. Linear correlation was calculated (R2 = 0.9733)
and reflected a direct proportion between binding on HA-GABAB1 with the non-
permeant radioligand [125I]-CGP64213 and fluorescence energy transfer signals
between the two fluorophore on HA-GABAB1 and myc-GABAB2 in the TR-FRET format
assay.
Figure 6
6A: HEK 293 cells expressing HA-GABAB1 and myc-GABAB2 were pre-incubated or not
overnight at 4°C with saturating concentrations of anti-HA-europium cryptate-PBP
and anti-myc-Alexa Fluor® 647 antibodies (each at 45 nM). Then the amount of
[125I]-CGP64213 binding was measured on intact cells as described in Materials and
Methods. Histobars represent the mean +/- SD of quadruplicate of a representative
experiment from three distinct experiments.
6B: The effect of one saturating concentration of GABA on IP formation in HEK 293
cells co-expressing the HA-GABAB1 and myc-GABAB2 and Gαqi9 is shown. Data are
expressed as the IP production over the radioactivity remaining in the membrane and
are means +/- SD of triplicate determinations from a typical experiment. Histobars
represent IP production from pre-incubated cells as described in 6A, with or without
stimulation and in presence or absence of antibodies pre-incubation.
Figure 7
7A: HEK 293 cells were transiently mock-transfected (only carrier DNA, pRK6) or
co-transfected with HA-GABAB1–ASA and myc-GABAB2, or with HA-GABAB1-ASA and
myc-V2. Percentage of Delta F witch represent the FRET signal over background in
the TR-FRET format assay was measured in these respective transfected cells

23
revealing specificity of the fluorescence resonance energy transfer on the GABAB
receptor.
7B: Estimation of the receptor level carrying the HA epitope at cell surface in the
co-transfected cells was performed by fluorescence measurement for the donor
alone (europium cryptate-PBP coupled with HA mAb).
7C: Estimation of the receptor level carrying the myc epitope at cell surface in the
co-transfected cells was performed by fluorescence measurement for the acceptor
alone (Alexa Fluor® 647 coupled with myc mAb).
Figure 8
HEK 293 cells were transiently mock-transfected (pRK6) or transfected with only
HA-GABAB1–ASA or HA-GABAB2 alone. An equimolar mixture (3 nM) of HA-antibodies
labeled either with europium cryptate-PBP or Alexa Fluor® 647 was applied on
transfected cells. In the homodimeric format, we attempt to loose logically 50% of
the fluorescent signal because 50% of the closed combined antibodies are engaged
with two donors or two acceptors. As described in the figure 7, FRET signals
represented by the Delta F and fluorescence estimation of the binding of each
antibodies on the HA epitope were measured. Histobars represent the mean +/- SD
of quadruplicate from three independent experiments.
Figure 9
HEK 293 cells were co-transfected with HA-GABAB1 and various amounts of myc-
GABAB2 plasmids. After 24 hrs, the HTRF® signal was measured as described in
Materials and Methods, and in the same way, after washing, the TR-FRET was
performed. Correlation was performed in parallel between Delta F (R2 = 0.9809) in
these two methods.
24
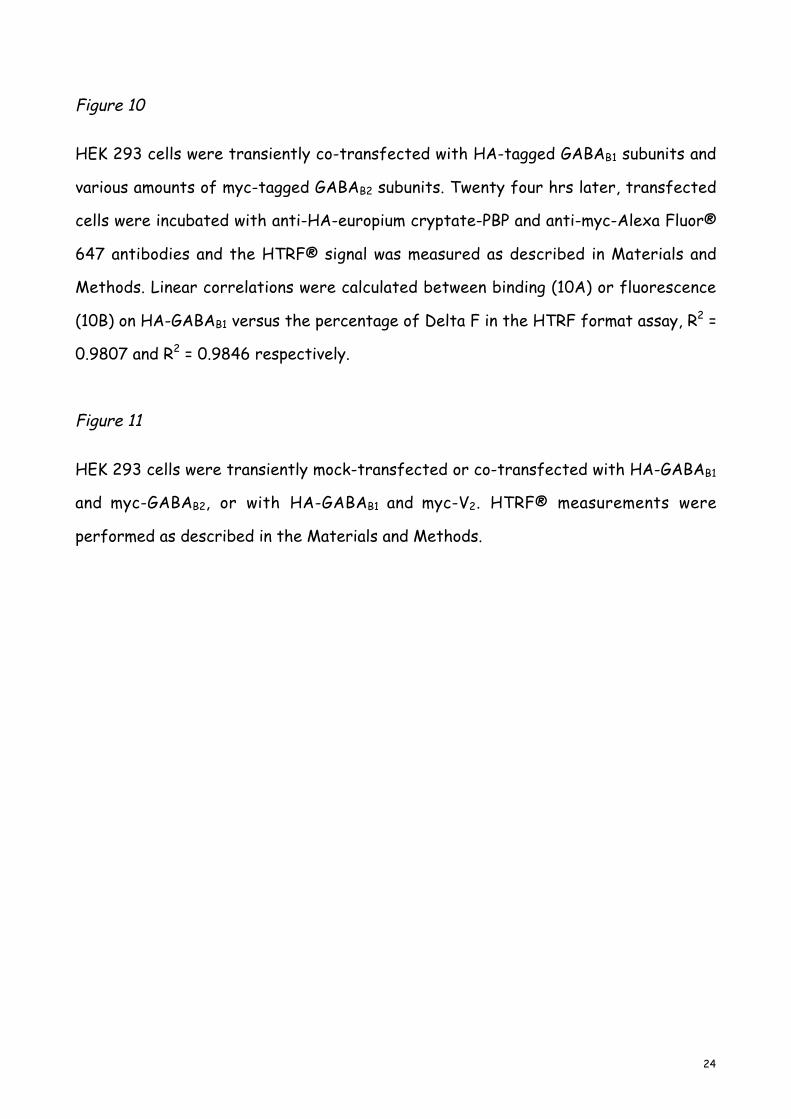
Figure 10
HEK 293 cells were transiently co-transfected with HA-tagged GABAB1 subunits and
various amounts of myc-tagged GABAB2 subunits. Twenty four hrs later, transfected
cells were incubated with anti-HA-europium cryptate-PBP and anti-myc-Alexa Fluor®
647 antibodies and the HTRF® signal was measured as described in Materials and
Methods. Linear correlations were calculated between binding (10A) or fluorescence
(10B) on HA-GABAB1 versus the percentage of Delta F in the HTRF format assay, R2 =
0.9807 and R2 = 0.9846 respectively.
Figure 11
HEK 293 cells were transiently mock-transfected or co-transfected with HA-GABAB1
and myc-GABAB2, or with HA-GABAB1 and myc-V2. HTRF® measurements were
performed as described in the Materials and Methods.
25
References
[1] S.G. Grant, T.J. O'Dell, Multiprotein complex signaling and the plasticity problem, Curr Opin Neurobiol 11
(2001) 363-368.
[2] H.J. Kreienkamp, Organisation of G-protein-coupled receptor signalling complexes by scaffolding proteins,
Curr Opin Pharmacol 2 (2002) 581-586.
[3] H. Gu, B.G. Neel, The 'Gab' in signal transduction, Trends Cell Biol 13 (2003) 122-130.
[4] C. Nourry, S.G. Grant, J.P. Borg, PDZ domain proteins: plug and play!, Sci STKE 2003 (2003) RE7.
[5] M. Sheng, M.J. Kim, Postsynaptic signaling and plasticity mechanisms, Science 298 (2002) 776-780.
[6] M. Bouvier, Oligomerization of G-protein-coupled transmitter receptors, Nature Rev. 2 (2001) 274-286.
[7] A. Salahpour, S. Angers, M. Bouvier, Functional Significance of Oligomerization of G-protein-coupled
Receptors, Trends Endocrinol Metab 11 (2000) 163-168.
[8] I. Remy, I.A. Wilson, S.W. Michnick, Erythropoietin receptor activation by a ligand-induced conformation
change, Science 283 (1999) 990-993.
[9] S. Angers, A. Salahpour, E. Joly, S. Hilairet, D. Chelsky, M. Dennis, M. Bouvier, Detection of beta 2-
adrenergic receptor dimerization in living cells using bioluminescence resonance energy transfer (BRET), Proc
Natl Acad Sci U S A 97 (2000) 3684-3689.
[10] B. Pollock, R. Heim, Using GFP in FRET-based applications, Trends Cell Biol 9 (1999) 57-60.
[11] F.S. Wouters, P.J. Verveer, P.I.H. Bastiaens, Imaging biochemistry inside cells, Trends Cell Biol. 11 (2001)
203-211.
[12] A. Miyawaki, Visualization of the spatial and temporal dynamics of intracellular signaling, Developmental
Cell 4 (2003) 295-305.
[13] Y. Xu, D.W. Piston, C.H. Johnson, A bioluminescence resonance energy transfer (BRET) system: application
to interacting circadian clock proteins, Proc Natl Acad Sci U S A 96 (1999) 151-156.
[14] I. Majoul, M. Straub, R. Duden, S.W. Hell, H.D. Soling, Fluorescence resonance energy transfer analysis of
protein-protein interactions in single living cells by multifocal multiphoton microscopy, J Biotechnol 82
(2002) 267-277.
[15] M. Rocheville, D.C. Lange, U. Kumar, S.C. Patel, R.C. Patel, Y.C. Patel, Receptors for dopamine and
somatostatin: formation of hetero-oligomers with enhanced functional activity, Science 288 (2000) 154-157.
[16] M. Rocheville, D.C. Lange, U. Kumar, R. Sasi, R.C. Patel, Y.C. Patel, Subtypes of the somatostatin receptor
assemble as functional homo- and heterodimers, J Biol Chem 275 (2000) 7862-7869.
[17] M. McVey, D. Ramsay, E. Kellett, S. Rees, S. Wilson, A.J. Pope, G. Milligan, Monitoring Receptor
Oligomerization Using Time-resolved Fluorescence Resonance Energy Transfer and Bioluminescence
Resonance Energy Transfer. THE HUMAN delta -OPIOID RECEPTOR DISPLAYS CONSTITUTIVE
OLIGOMERIZATION AT THE CELL SURFACE, WHICH IS NOT REGULATED BY RECEPTOR
OCCUPANCY, J Biol Chem 276 (2001) 14092-14099.
[18] G. Mathis, Probing molecular interactions with homogeneous techniques based on rare earth cryptates and
fluorescence energy transfer, Clin. Chem. 41 (1995) 1391-1397.
[19] F.H. Marshall, K.A. Jones, K. Kaupmann, B. Bettler, GABAB receptors - the first 7TM heterodimers, Trends
Pharmacol Sci 20 (1999) 396-399.
[20] J. Kniazeff, T. Galvez, G. Labesse, J.-P. Pin, No ligand binding in the GB2 subunit of the GABAB receptor is
required for activation and allosteric interaction between the subunits, J. Neurosci. 22 (2002) 7352-7361.
[21] T. Galvez, L. Prézeau, G. Milioti, M. Franek, C. Joly, W. Froestl, B. Bettler, H.-O. Bertrand, J. Blahos, J.-P.
Pin, Mapping the agonist binding site of GABAB type 1 subunit sheds light on the activation process of
GABAB receptors, J. Biol. Chem. 275 (2000) 41166-41174.
[22] B. Duthey, S. Caudron, J. Perroy, B. Bettler, L. Fagni, J.-P. Pin, L. Prézeau, A single subunit (GB2) is required
for G-protein activation by the heterodimeric GABAB receptor, J. Biol. Chem. 277 (2002) 3236-3241.
[23] T. Galvez, B. Duthey, J. Kniazeff, J. Blahos, G. Rovelli, B. Bettler, L. Prézeau, J.-P. Pin, Allosteric
interactions between GB1 and GB2 subunits are required for optimal GABAB receptor function, EMBO J. 20
(2001) 2152-2159.
[24] A. Pagano, G. Rovelli, J. Mosbacher, T. Lohmann, B. Duthey, D. Stauffer, D. Ristig, V. Schuler, I. Meigel, C.
Lampert, T. Stein, L. Prézeau, J. Blahos, J.-P. Pin, W. Froestl, R. Kuhn, J. Heid, K. Kaupmann, B. Bettler, C-
terminal interaction is essential for surface trafficking but not for heteromeric assembly of GABAB receptors,
J. Neurosci. 21 (2001) 1189–1202.
[25] M. Margeta-Mitrovic, Y.N. Jan, L.Y. Jan, A trafficking checkpoint controls GABA(B) receptor
heterodimerization, Neuron 27 (2000) 97-106.
26
[26] J. Liu, D. Maurel, S. Etzol, I. Brabet, H. Ansanay, J.-P. Pin, P. Rondard, Molecular determinants involved in
the allosteric control of agonist affinity in GABAB receptor by the GABAB2 subunit, J. Biol. Chem. (2004) in
press.
[27] Y. Ala, D. Morin, B. Mouillac, N. Sabatier, R. Vargas, N. Cotte, M. Dechaux, C. Antignac, M.F. Arthus, M.
Lonergan, M.S. Turner, M.-N. Balestre, G. Alonso, M. Hibert, C. Barberis, G.N. Hendy, D.G. Bichet, S. Jard,
Functional studies of twelve mutant V2 vasopressin receptors related to nephrogenic diabetes insipidus:
molecular basis of a mild clinical phenotype., J Am Soc Nephrol. 9 (1998) 1861-1872.
[28] H. Bazin, E. Trinquet, G. Mathis, Time resolved amplification of cryptate emission: a versatile technology to
trace biomolecular interactions, Reviews in Molecular Biotechnology 82 (2002) 233-250.
[29] G. Anderson, N. Nerurkar, Improved fluoroimmunoassays using the dye Alexa Fluor 647 with the RAPTOR, a
fiber optic biosensor, J. Immunol. Meth. 271 (2002) 17– 24.
[30] E. Trinquet, F. Maurin, M. Preaudat, G. Mathis, Allophycocyanin 1 as a near-infrared fluorescent tracer:
isolation, characterization, chemical modification, and use in a homogeneous fluorescence resonance energy
transfer system, Anal Biochem 296 (2001) 232-244.
[31] J. Kniazeff, P.-P. Saintot, C. Goudet, J. Liu, A. Charnet, G. Guillon, J.-P. Pin, Locking the dimeric GABAB G-
protein coupled receptor in its active state, J. Neurosci. (2003) in press.
[32] S. Terrillon, T. Durroux, B. Mouillac, A. Breit, M.A. Ayoub, M. Taulan, R. Jockers, C. Barberis, M. Bouvier,
Oxytocin and Vasopressin V1a and V2 Receptors Form Constitutive Homo- and Heterodimers during
Biosynthesis, Mol Endocrinol 17 (2003) 677-691.
[33] M. Havlickova, L. Prezeau, B. Duthey, B. Bettler, J.-P. Pin, J. Blahos, The intracellular loops of the GB2
subunit are crucial for G-protein coupling of the heteromeric gamma-aminobutyrate B receptor, Mol.
Pharmacol. 62 (2002) 343-350.
[34] N. Kunishima, Y. Shimada, Y. Tsuji, T. Sato, M. Yamamoto, T. Kumasaka, S. Nakanishi, H. Jingami, K.
Morikawa, Structural basis of glutamate recognition by a dimeric metabotropic glutamate receptor, Nature 407
(2000) 971-977.
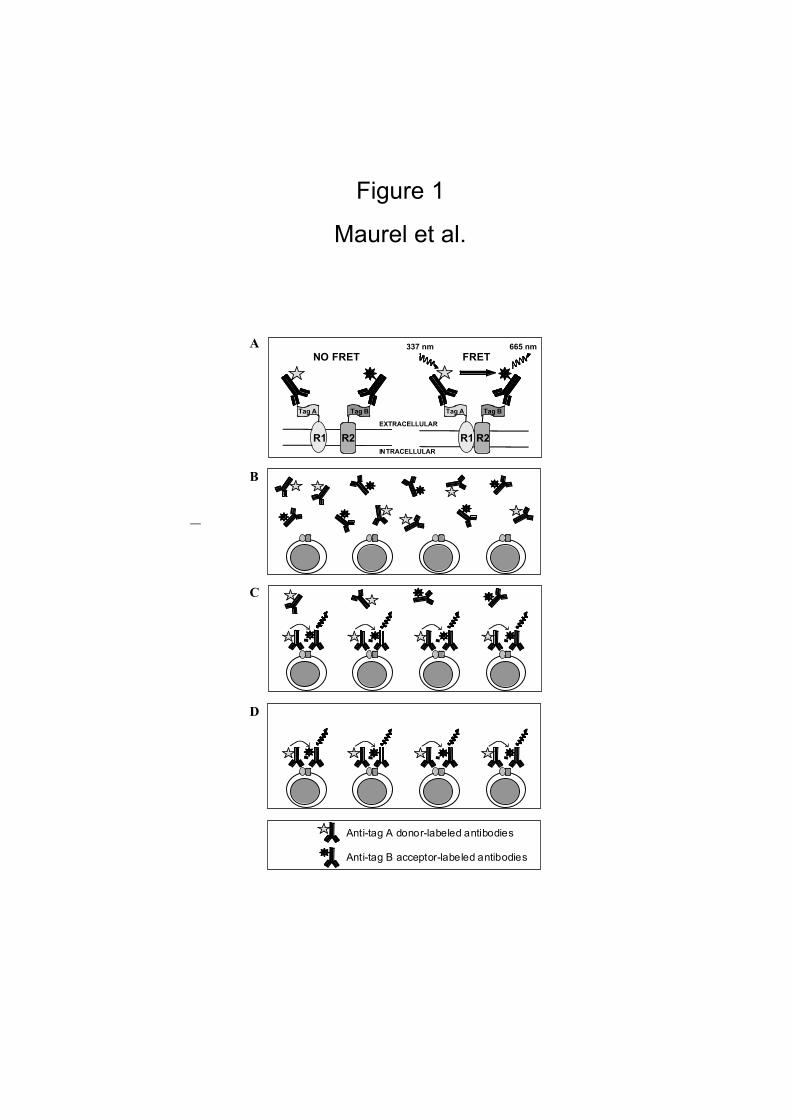
Figure 1
Maurel et al.
A
R1 R1
Tag A Tag ATag B Tag B
EXTRACELLULAR
INTRACELLULAR
NO FRET FRET337 nm 665 nm
R2 R2
B
C
D
Anti-tag A donor-labeled antibodies
Anti-tag B acceptor-labeled antibodies
0
20
40
60
80
100
+--
-
+-
-
-+-
+- - - +
--
-
Figure 2
Maurel et al.
mAb anti-HA binding (%)
Mock
HA-GABAB1
HA-GABAB1-ASA
HA-GABAB1 + GABAB2

Fluorescence at620 nm
(x103)
0 2 4 6 80 2 4 6 8
0
10
20
30
40A
B
0 2 4 6 80 2 4 6 8
0
50
100
150
200
Fluorescence at 682 nm
(x103)
C
Time (hrs)Time (hrs)
Delta F (%)
0
250
500
750
0 244 8
Figure 3
Maurel et al.

Figure 4
Maurel et al.
[125
I]CGP64213 specific binding
Fluorescence at 620 nm (x 103)
0 10 20 30 400
1000
3000
5000
[125
I]CGP64213 specific binding
Fluorescence at 620 nm (x 103)
0 10 20 30 400
1000
3000
5000

Figure 5
Maurel et al.
0 200 400 600
0
1000
3000
5000
Delta F (%)
[125I]CGP64213 binding
Ac-HA-PBPAc-HA-PBP
Ac-myc-A647
No antibodies
5000
0
1000
2000
3000
4000
5000
0
1000
2000
3000
4000
Non-specific
total
IP production
Ac-HA-PBPAc-HA-PBPNo antibodies0
4
8
12
16
0
4
8
12
16Basal
GABA
[125 I]CGP64213 binding
A B
Figure 6
Maurel et al.
Ac-myc-A647
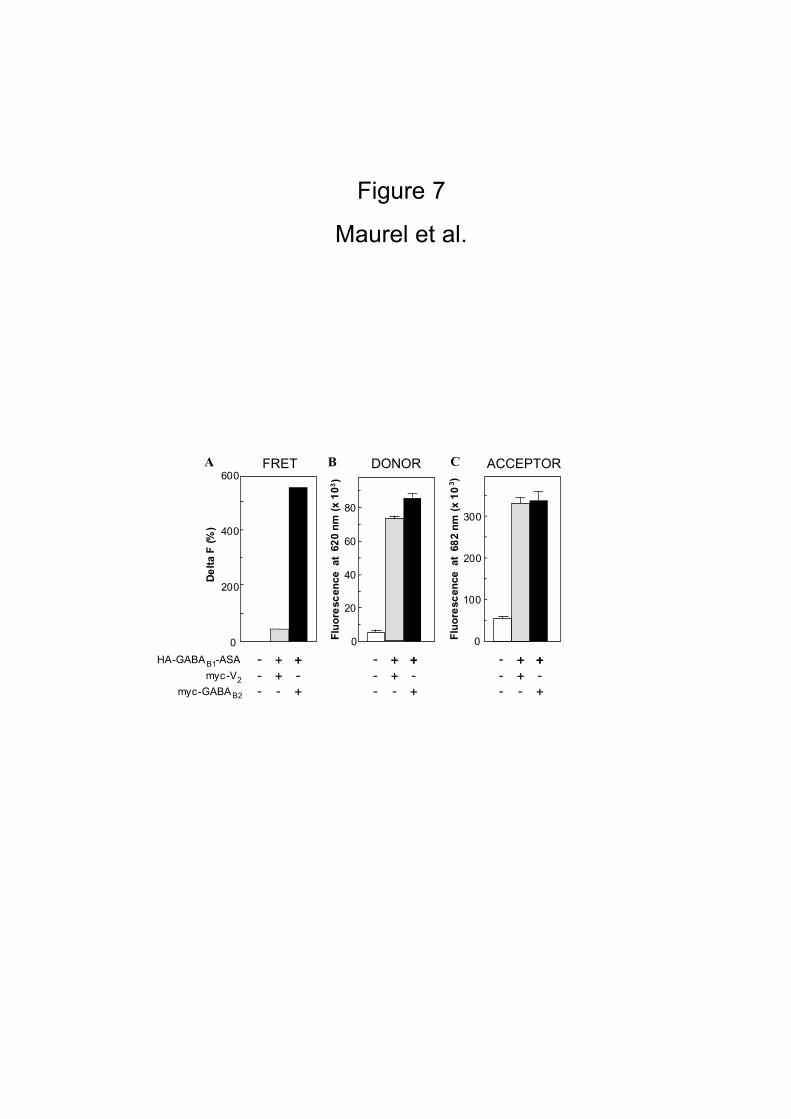
Figure 7
Maurel et al.
Delta F (%)
0
200
400
600
A B
Fluorescence at 620 nm (x 103)
0
20
40
60
80
CFluorescence at 682 nm (x 103)
0
100
200
300
HA-GABAB1-ASA
myc-V2
myc-GABAB2
+
+-
FRET
-
--
+-
+
+ +
+-
-
--
+-
+
+ ++ +
+-
-
--
+-
+
+ ++
DONOR ACCEPTOR
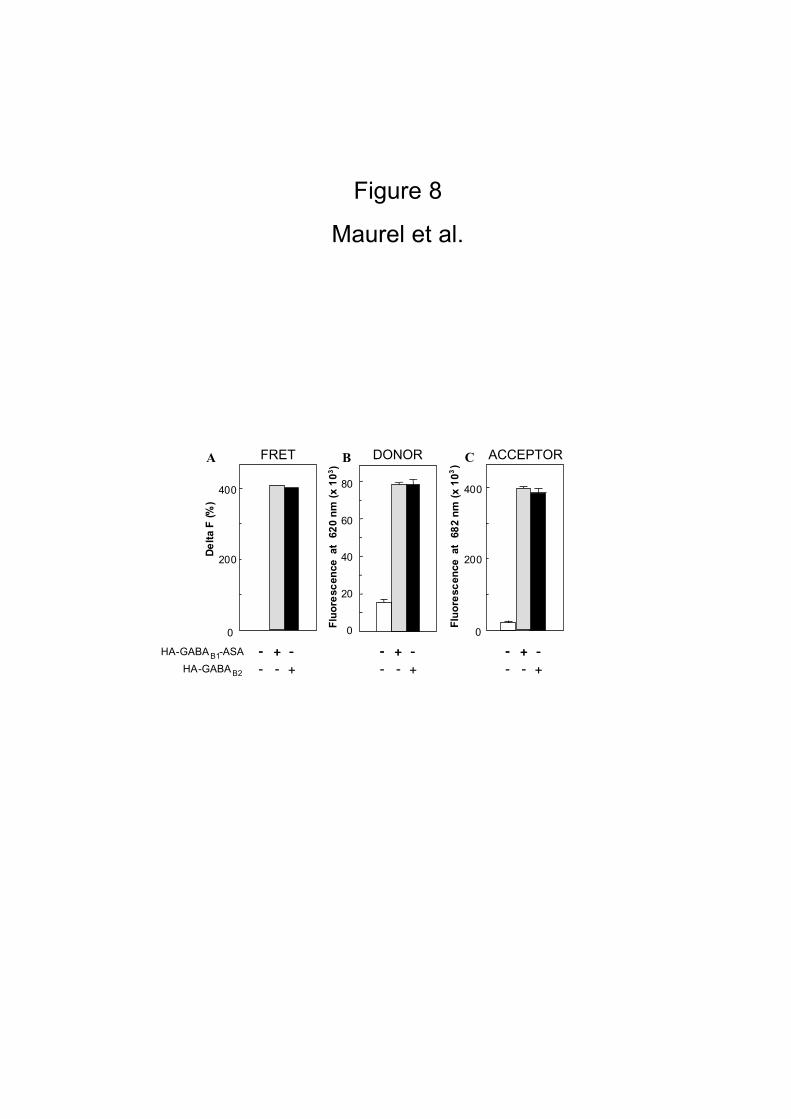
Figure 8
Maurel et al.
Delta F (%)
0
200
400
0
20
40
60
80
0
Fluorescence at 620 nm (x 103)
Fluorescence at 682 nm (x 103)
A B CFRET
HA-GABAB1-ASA
HA-GABAB2
+-
-
-
+-
+- -+-
-
-
+-
+- -+-
-
-
+-
+- -
200
400
DONOR ACCEPTOR
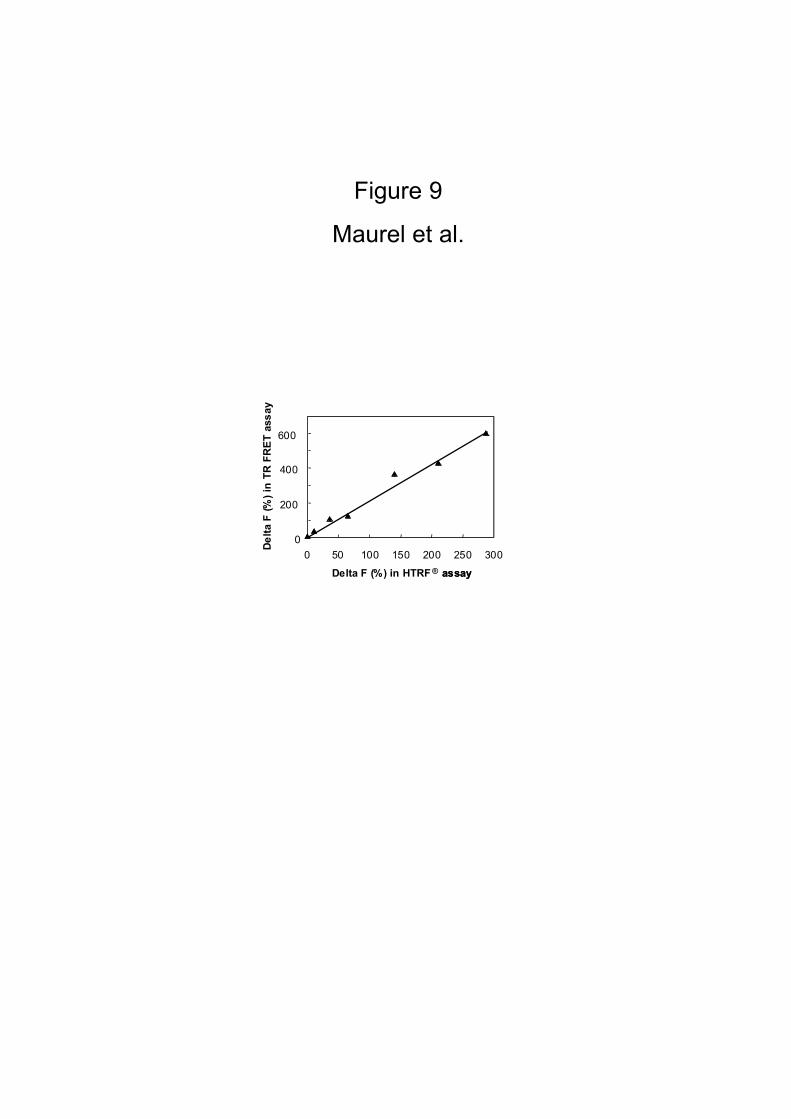
Figure 9
Maurel et al.
Delta F (%) in HTRF® assayassay
Delta F (%) in TR FRET assay
0
200
400
600
0 50 100 150 200 250 300
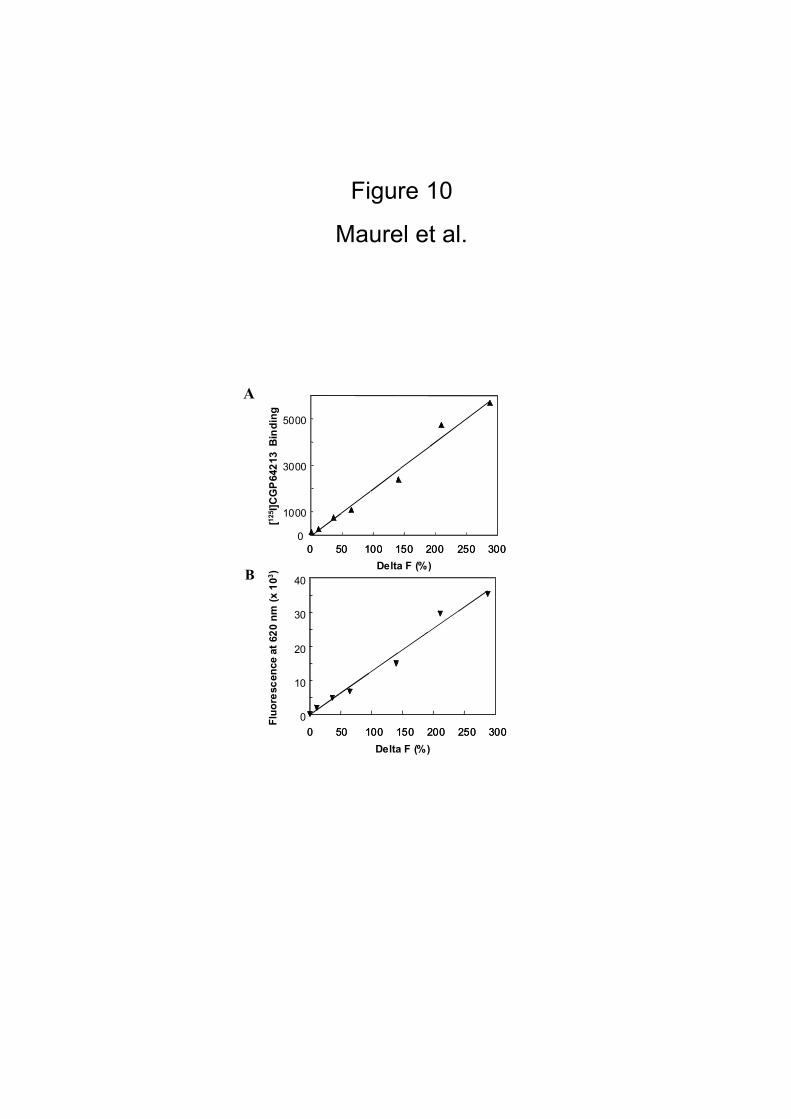
Figure 10
Maurel et al.
Delta F (%)
0
1000
3000
5000
0 50 100 150 200 250 3000 50 100 150 200 250 300
A
0
10
20
30
40
0 50 100 150 200 250 3000 50 100 150 200 250 300
Delta F (%)
[125I]CGP64213 Binding
Fluorescence at620 nm (x 103)
B
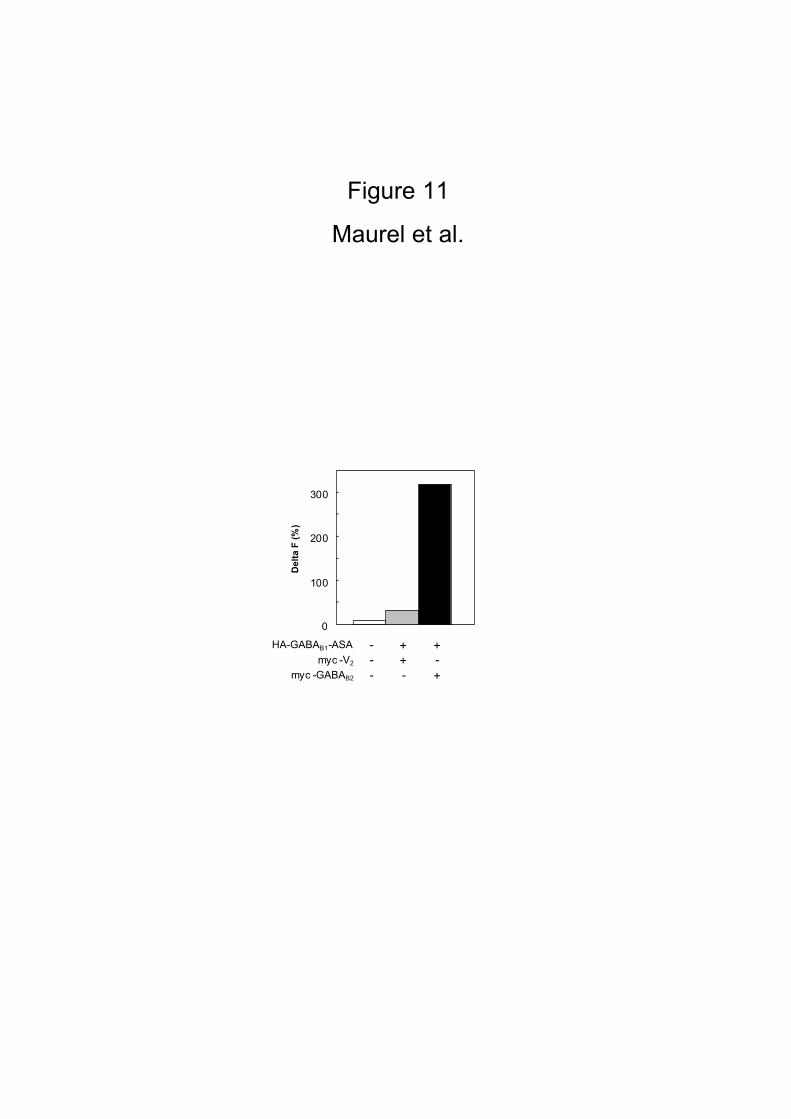
Figure 11
Maurel et al.
0
100
200
300
Delta F (%)
HA-GABAB1-ASA
myc -V2
myc -GABAB2
- + +- + -
- - +


