AD-A257 453
MEMORANDUM REPORT BRL-MR-4002
CENTIMETER WAVE ABSORPTIONIN MOLECULAR CRYSTALS
STEVE G. CORNELISONARTHUR GAUSS, JR.ROBERT B. BOSSOLI
U.S. ARMY BALLISTIC RESEARCH LABORATORY
. DTICJ. R. HARDY ftSi'LECTE
UNIVERSITY OF NEBRASKA v 23 &mGI
SEPTEMBER 1992 1
APPROVED FOR PUBLIC RELEASE; DISTRIBUTION IS UNLIMITED.
U.S. ARMY LABORATORY COMMAND
BALLISTIC RESEARCH LABORATORYABERDEEN PROVING GROUND, MARYLAND
92-30034'•".• --•. • llll !! M IIII~l!!llIi

NOTICES
Destroy this report when it is no longer needed. DO NOT return it to the originator.
Additional copies of this report may be obtained from the National Technical Information Service,U.S. Department of Commerce, 5285 Port Royal Road, Springfield, VA 22161.
The findings of this report are not to be construed as an official Department of the Army position,unless so designated by other authorized documents.
The use of trade names or manufacturers' names in this report does not constitute indorsementof any 'commercial product.

Form Approved
REPORT DOCUMENTATION PAGE OMB No. 074-08o
Pubic recorting burden for this COllection Of information is estimated to average I hour Per resf orse, inciuding the time for reviewing instructions. Searching existing data Sources.gathering and maintaining the data needed, and completing and reviewing the Collection of information Send comments regarding this burden estimate or any other asped of thiscollection of information, including suggestions for reducing this burden, to Washington HeaOGuarters Services. Directorate for information Op~erations and Reoorts. 12IS JetfersonDavis mighjway. Suite 1204. Alhngton. VA 22202-4302. and to the Office of Management and Budget. PaperworK Reduction Project (0704-0188). Washingtofn. DC 20503
1. AGENCY USE ONLY (Leave blank) I 2. REPORT DATE I 3. REPORT TYPE AND DATES COVERED
I September 1992 Final, Jan 90-Jun 914. TITLE AND SUBTITLE S. FUNDING NUMBERS
Centimeter Wave Absorption in Molecular Crystals PR: 1L16212213622
6. AUTHOR(S)
Steve G. Comelison, Arthur Gauss, Jr., Robert B. Bossoli, H. M. Lu,and J. R. Hardy'
7. PERFORMING ORGANIZATION NAME(S) AND ADDRESS(ES) B. PERFORMING ORGANIZATIONREPORT NUMBER
9. SPONSORING /MONITORING AGENCY NAME(S) AND ADDRESS(ES) 10. SPONSORING/ MONITORING
AGENCY REPORT NUMBER
U.S. Army Ballistic Research Laboratory BRL-MR-4002ATTN: SLCBR-DD-TAberdeen Proving Ground, MD 21005-5066
11. SUPPLEMENTARY NOTES
"'Department of Physics and Center for Electro-Optics, University of Nebraska, Lincoln, NE
12a. DISTRIBUTION/AVAILABILITY STATEMENT 1Zb. DISTRIBUTION CODE
Approved for public release; distribution is unlimited.
13. ABSTRACT (Maximum 200 words)
Molecular dynamics calculations performed at the University of Nebraska predict thattemperature-dependent microwave activity is present in some ionic molecular crystals. This activity is due tothe excitation of "hindered rotations" or thermally activated "hopping" modes for the molecular ions.Microwave reflectometer measurements performed at the BRL show temperature-dependent microwavelosses occur in several Ionic molecular crystals at or near the calculated order/disorder transitiontemperatures. These measurements, performed from 2 to 20 GHz from room temperature to about 300C Con the BRL "arch," were made on powder samples of the nitrates and nitrites of potassium, sodium, andother materials. Potassium nitrate displays an Interesting temperature dependence with the absorption"tuming on" at about 120° C, near the calculated order/disorder transition temperature. Measurements werealso performed on selected ionic salts which uniformly show small microwave losses at any of thetemperatures measured.
14. SUBJECT TERMS 15. NUMBER OF PAGES26
dielectric properties; ionic nolecular solids; microwaves 16. PRICE CODE
17. SECURITY CLASSIFICATION 18. SECURITY CLASSIFICATION 19. SECURITY CLASSIFICATION 20. LIMITATION OF ABSTRACTOF REPORT OF THIS PAGE OF ABSTRACT
UNCLASSIFIED UNCLASSIFIED UNCLASSIFIED SARNSN 7540-01-280-5500 Standard Form 298 (Rev 2-89)
Prescribed by ANSI Std Z-9-111
191 '02
INTENTIONALLY LEFT BLANK.

TABLE OF CONTENTS
LIST OF FIGURES ........................................... v
1. INTRODUCTION ............................................. 1
2. EXPERIMENT ............................................... 1
3. THEORY ................................................... 3
4. RESULTS AND DISCUSSION ................................... 4
5. SUMMARY ................................................. 5
6. REFERENCES .............................................. 19
DISTRIBUTION LIST .......................................... 21
Accession ForNTIS GRA&I iDTIC TAB 0Unanuounced 0Just .f ication
By.. . .
Distribution/
Availability Codos _
Avail nd/orDiat Special
INTENTIONALLY LEFT BLANK.
Iv
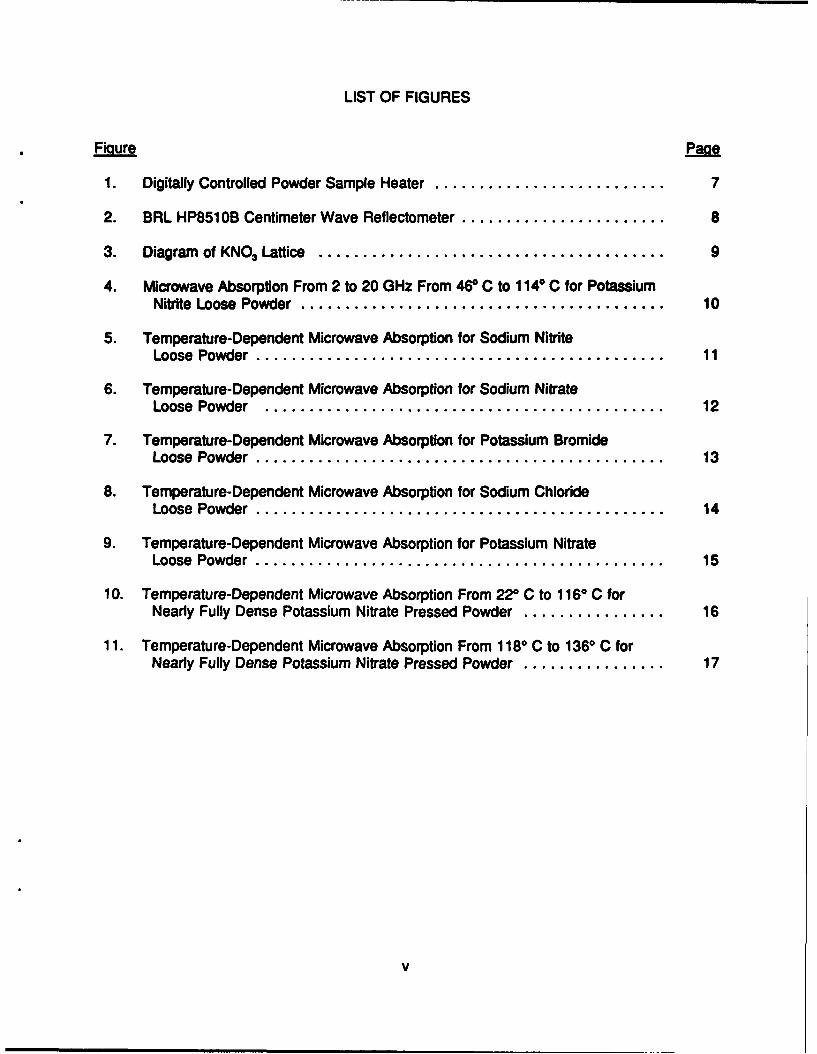
LIST OF FIGURES
Figure
1. Digitally Controlled Powder Sample Heater .......................... 7
2. BRL HP851 OB Centimeter Wave Reflectometer ....................... 8
3. Diagram of KNO 3 Lattice ....................................... 9
4. Microwave Absorption From 2 to 20 GHz From 460 C to 1140 C for PotassiumNitrite Loose Powder ......................................... 10
5. Temperature-Dependent Microwave Absorption for Sodium NitriteLoose Powder .............................................. 11
6. Temperature-Dependent Microwave Absorption for Sodium NitrateLoose Powder ............................................. 12
7. Temperature-Dependent Microwave Absorption for Potassium BromideLoose Powder .............................................. 13
8. Temperature-Dependent Microwave Absorption for Sodium ChlorideLoose Powder .............................................. 14
9. Temperature-Dependent Microwave Absorption for Potassium NitrateLoose Powder .............................................. 15
10. Temperature-Dependent Microwave Absorption From 220 C to 1160 C forNearly Fully Dense Potassium Nitrate Pressed Powder ................ 16
11. Temperature-Dependent Microwave Absorption From 1180 C to 1360 C forNearly Fully Dense Potassium Nitrate Pressed Powder ................ 17
v
INTENTIONALLY LEFT BLANK.
vi
1. INTRODUCTION
There have been many studies of the dielectric properties of materials at very high (i.e.,
optical) frequencies and at relatively low (megahertz or less) frequencies. Relatively few have
been performed on materials at centimeter or millimeter wave frequencies (Megaw 1973;
Von Hippel 1954). In this paper we report the results of centimeter wave absorption
measurements performed from 2 to 20 GHz on several ionic molecular solids and two ionic
salts from room temperature up to about 2500 C. The ionic salts potassium bromide and
sodium chloride were chosen for study because they are expected to show mainly high
frequency lonic/electronic dielectric losses and to have no dipolar contribution to their dielectric
polarizability (Kittel 1971; Blakemore 1969). The Ionic molecular solids studied were
potassium nitrate, potassium nitrite, sodium nitrate, and sodium nitrite. In the frequency range
studied, most of the dielectric losses in these media are expected to be dipolar. In the nitrites,
the losses are expected to be due to the permanent dipole moments of the nitrite Ions
(Megaw 1973; Jona and Shirane 1962) which are excited to "hopping modes" when the
temperature is increased. In sodium nitrate, where there Is no permanent dipole moment, the
centimeter wave absorption is found to be similar to that seen in ionic salts. In potassium
nitrate, the development of a dynamically induced dipole moment at elevated temperatures
(Lu and Hardy 1990, 1991; Jona and Shirane 1962) leads to interesting absorption
characteristics In this frequency regime. The theoretical section briefly discusses the
mechanisms underlying the dielectric behavior of these classes of Ionic molecular solids.
2. EXPERIMENT
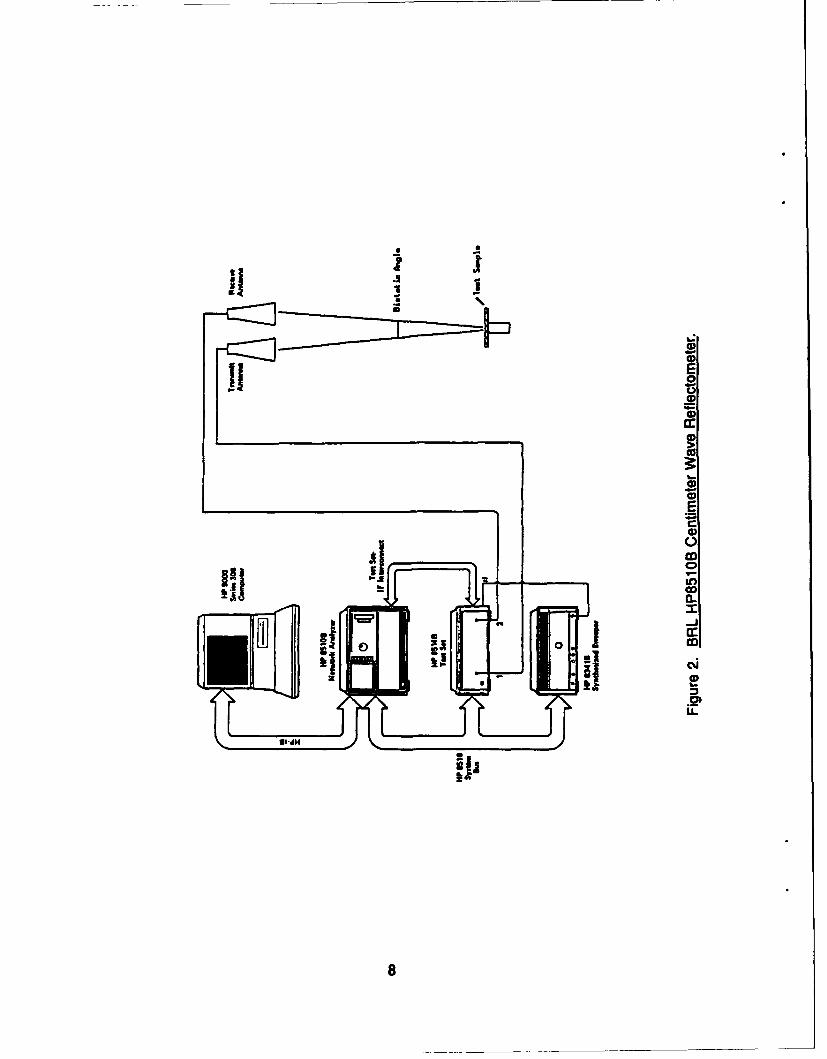
Figure 1 shows a schematic diagram of the powder sample heater used In the
reflectometer for the "loose" powder sample measurements. The salts to be measured were
first ground to a fine powder with an analytical mill. Since some of these materials may
absorb moisture from the air, the powders were then heated In a drying oven for 4-6 hours at
1350 C. The sample material was then packed loosely in the powder sample heater tray to a
thickness of about 1.1 cm (7/16 In) and the surface smoothed off. A thermocouple set into the
base plate measured the temperature of the bottom of the powder sample while other
thermocouples monitored the temperatures at different heights within the sample. Since the
samples are relatively thick, variations in the temperatures from the bottom to the top of the
1

samples of 100 C or so are common. During the experiment, while the sample is being
heated to higher temperatures, 20 to 30 minutes are required between temperature
measurements in order to minimize the temperature differences throughout the sample. The
reported temperature is an average of temperatures from TC1, TC2, and TC3 and was usually
within a couple of degrees of TC3, the thermocouple located at 0.64 cm (1/4 in) above the
base plate.
In the compressed potassium nitrate sample, the experiment Is somewhat different. This
sample was produced by pressing potassium nitrate powder in a 15.2-cm by 152-cm (6-in by
6-in) mold to a thickness of 8.1 mm with a heavy hydraulic (180 metric ton) press. This
resulted in a hard, nearly fully dense tile of KNO 3 without the use of a binder. During
reflection measurements, the sample was attached to a 0.64-cm (1/4-in) aluminum plate by
thermally conducting paste and then placed directly on top of the 15.2-cm2 (6-in by 6-in) top
plate of the heater. Another 0.64-cm-thick (1/4-in) aluminum plate was then placed on top of
the sample during the heating process. Thermocouples were located in the plates below and
above the sample so the temperature could be monitored. When the temperatures of the
plates above and below the KNO 3 tile sample were within about 50 C, the top plate was
quickly removed and a reflection measurement was made. In this way, the sample
temperature was more accurately known than in the loose powder samples.
The radar reflection measurements were made from 2 to 20 GHz on the Ballistic Research
Laboratory (BRL) HP851 OB Centimeter Wave Reflectometer as diagrammed in Figure 2. This
reflectometer is in the form of an "arch" with the sample resting on a 30.5-cm (12-in) high
pedestal surrounded by radar-absorbing material. The bistatic angle for these tests is 50. For
the loose powder samples, the powder sample heater assembly is first placed into the
reflectometer without the powder and a baseline reflection measurement is made. The
powder is then added to the powder sample tray and reflection measurements are made at
vwious temperatures. Once the desired temperature is attained, the swept frequency
measurement from 2 to 20 GHz takes about 45 seconds to complete. The powder samples
are measured through several temperature cycles to ensure that the data are reproducible.
2

3. THEORY
The microwave dielectric behavior of the sodium and potassium nitrites and nitrates
reported in this section provides substantial evidence of two generic loss mechanisms for ionic
molecular solids.
In the nitrites, the charges making up the nitrite ion lie on the vertices of an isosceles
triangle. This geometrical arrangement of charges produces a permanent dipole moment
(Megaw 1973). Since it is known that in potassium nitrite the nitrite ions are dynamically
disordered and undergo quasi-free rotation at 300 K and above, an external microwave field
will couple directly to the dipole moment, drive the rotations, and thus experience loss
(Adams, Pogson, and Sharma 1988). The temperature dependence of this loss will be weak.
In the case of sodium nitrite, the nitrite ions are ordered well below 440 K and will show little
microwave activity (Megaw 1973). However, as the temperature is raised towards 440 K, the
nitrite ions begin thermally activated 1800 hopping, and this motion again begins to couple
strongly to the microwave field. At and above 440 K, the nitrite ions go collectively (Lu and
Hardy 1992) into quasi-free rotations; and the behavior is qualitatively similar to that of
potassium nitrite.
In the nitrates, the situation is more subtle. The nitrate ion, being an equilateral triangle,
has no permanent dipole moment (Megaw 1973). As a consequence, when nitrate ions in
sodium nitrate begin to rotate, they do not, to lowest order, couple to a microwave field. This
is not only because they are nonpolar, but also because the sodium ions lie exactly between
the centroids of the nitrate ion triangles, and thus (again to lowest order) are unaffected by the
nitrate rotation.
Figure 3 shows a representation of the KNO 3 lattice. When potassium nitrate is in the
room temperature phase (below about 117r C), the potassium ions lie off the nitrate ion
centroid line as indicated by position 1 in the diagram (Megaw 1973; Lu and Hardy 1990,
1991). This loss of symmetry means that, should the nitrate ions become free to rotate, their
comers (and centroids) will successively be displaced normal to the nitrate ion planes as each
oxygen ion in turn is closest to the potassium ion. Since the potassium ions must, by
Newton's third law, move in the opposite direction, a dipole moment which fluctuates
3
synchronously with the rotational motion results. Since the order/disorder transition in this
system results from just this nitrate ion transition to quasi-free rotation, the observed
microwave loss will rise steeply to a maximum at the transition, exactly as is observed.
However, above the transition the potassium ions begin to move along the arrow towards
position 2 and approach the nitrate ion centroid line. This movement causes an increase in
the symmetry of charges about the potassium ion and thereby a reduction of the effective
dipole moment and the mechanism which produces microwave losses in this material. Thus,
the losses will begin to drop off above the temperature of the order/disorder transition.
4. RESULTS AND DISCUSSION
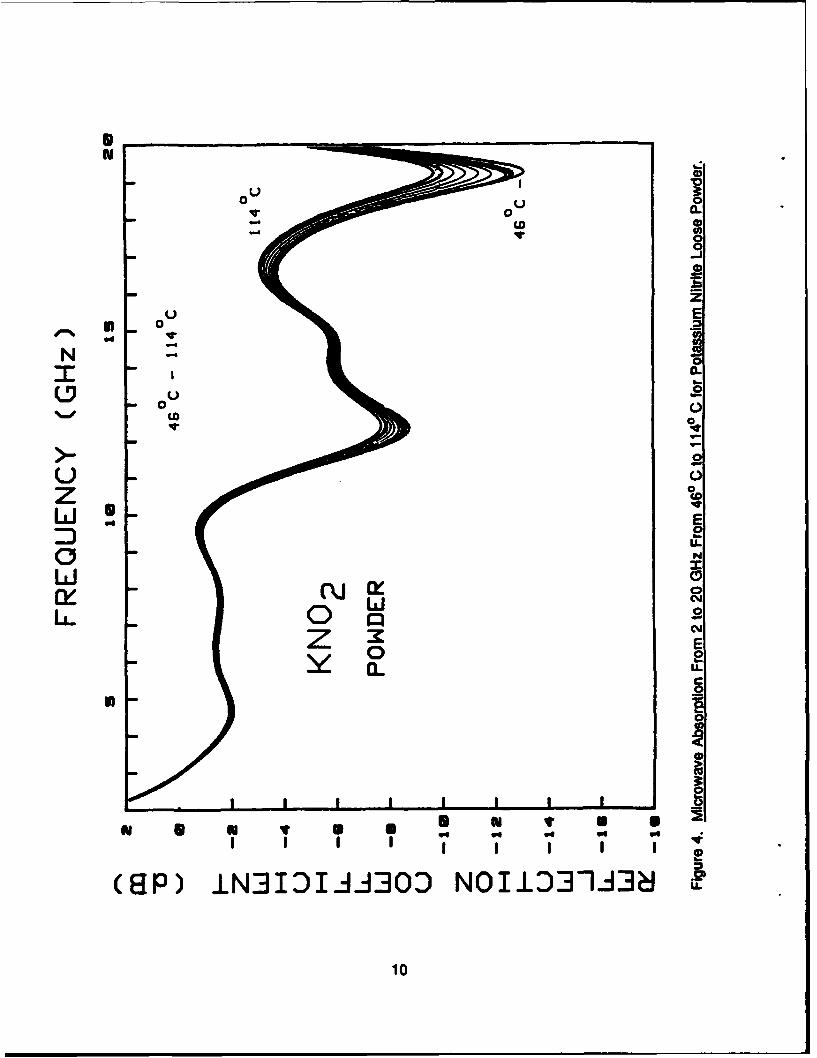
Figure 4 shows results of measurements on potassium nitrite from 460 C to 1140 C. As
expected from the above discussion, this material shows significant losses above room
temperature and up to at least 1140 C. The temperature variation of the loss is relatively
weak with the losses slightly decreasing as the temperature is raised. This Debye-like
temperature dependence is in agreement with what is expected for a polar solid of this type
(Kittel 1971; Blakemore 1969). Figure 5 shows the reflectometer results for sodium nitrite
from room temperature to above 1500 C. Measurements taken from room temperature up to
700 C show no increase in absorption over the baseline measurement. At about 1000 C,
losses begin to take place and rapidly increase as the temperature is raised to above 1500 C.
This result is interesting since the temperature at which thermally activated hopping is
expected to occur is around 440 K (167r C). This implies that some dipolar reorientation does
occur below 440 K and that nitrite ion hindered rotations or "hopping" may be occurring over a
range of temperatures up to 440 K.
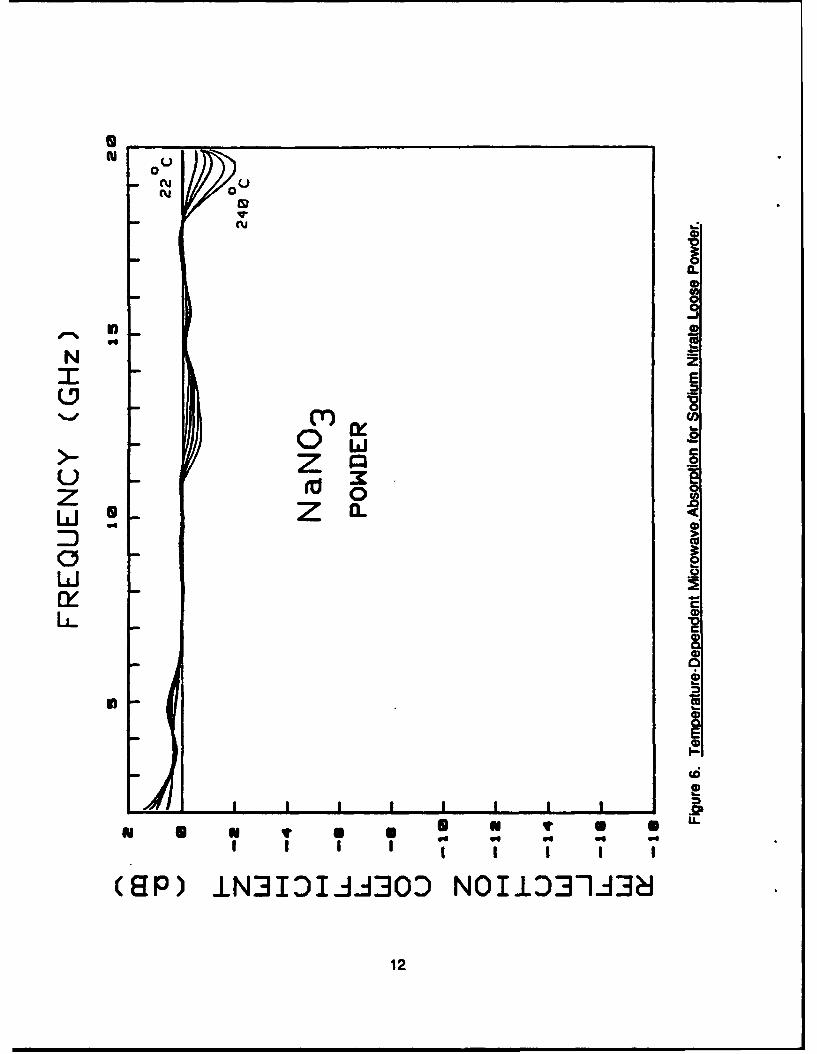
The results of measurements on sodium nitrate are shown on Figure 6. In this case, the
losses are small even as the sample is heated to about 2400 C which is above the order/
disorder transition temperature. This is expected because of the high symmetry of this system
and the lack of the development of a dynamically induced dipolar loss mechanism. These
results are similar to results for the ionic salts potassium bromide and sodium chloride shown
in Figures 7 and 8, respectively. In each of these salts, the losses are very small at
microwave frequencies as would be expected for salts containing no dipolar contributions to
their dielectric polarizability (Kittel 1971; Blakemore 1969).
4

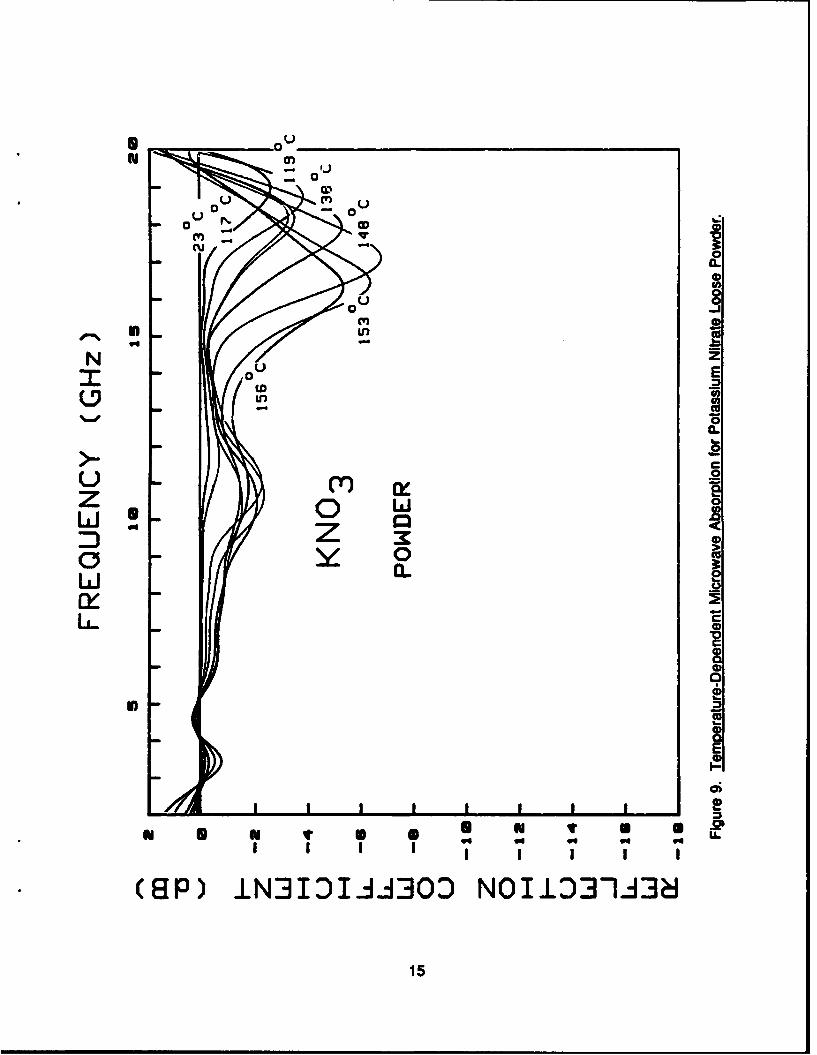
Figure 9 shows the results of measurements on a loose powder sample of potassium
nitrate. Here the sample was heated from room temperature to 1560 C. From room
temperature to about 1000 C, reflection measurements show no appreciable losses. At
1170 C, however, the losses begin to occur with the absorption peak moving to lower
frequencies as the temperature is increased. The loss mechanism seems to be weakening as
the temperature is raised above 1480 C, as is indicated in the figure by the 1530 C and 1560 C
data. Such a result would be in alignment with the previous theoretical discussion which
predicts the losses to drop off above the transition temperature of about 1280 C.
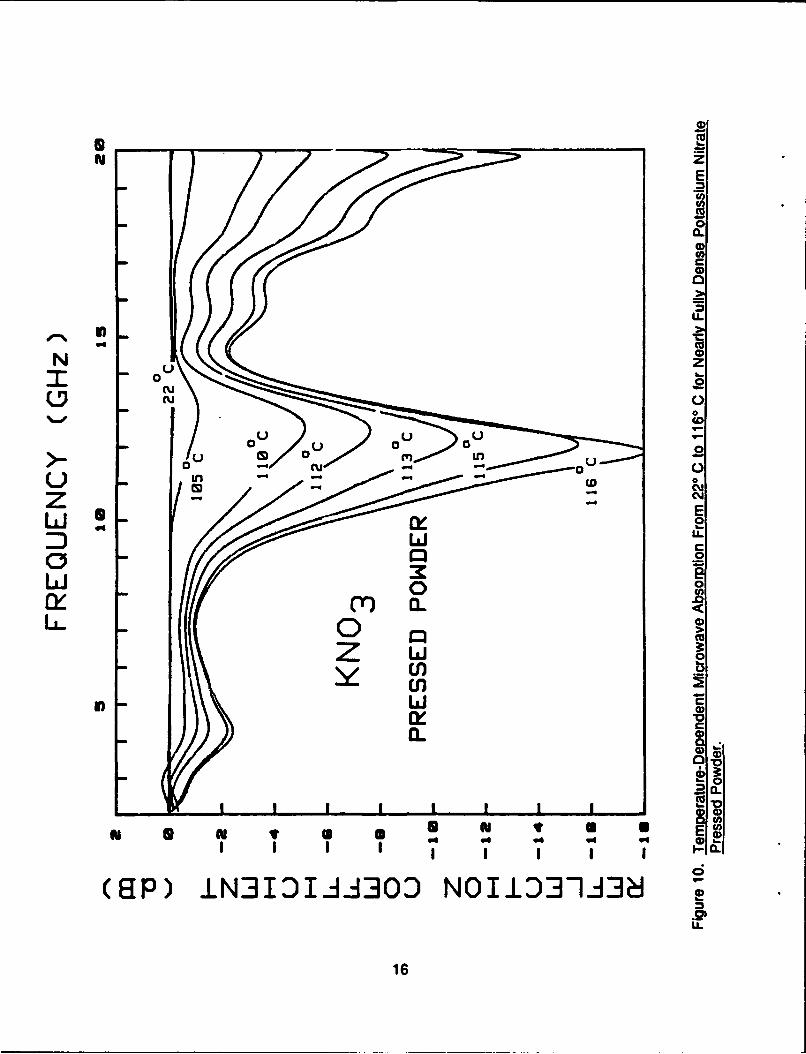
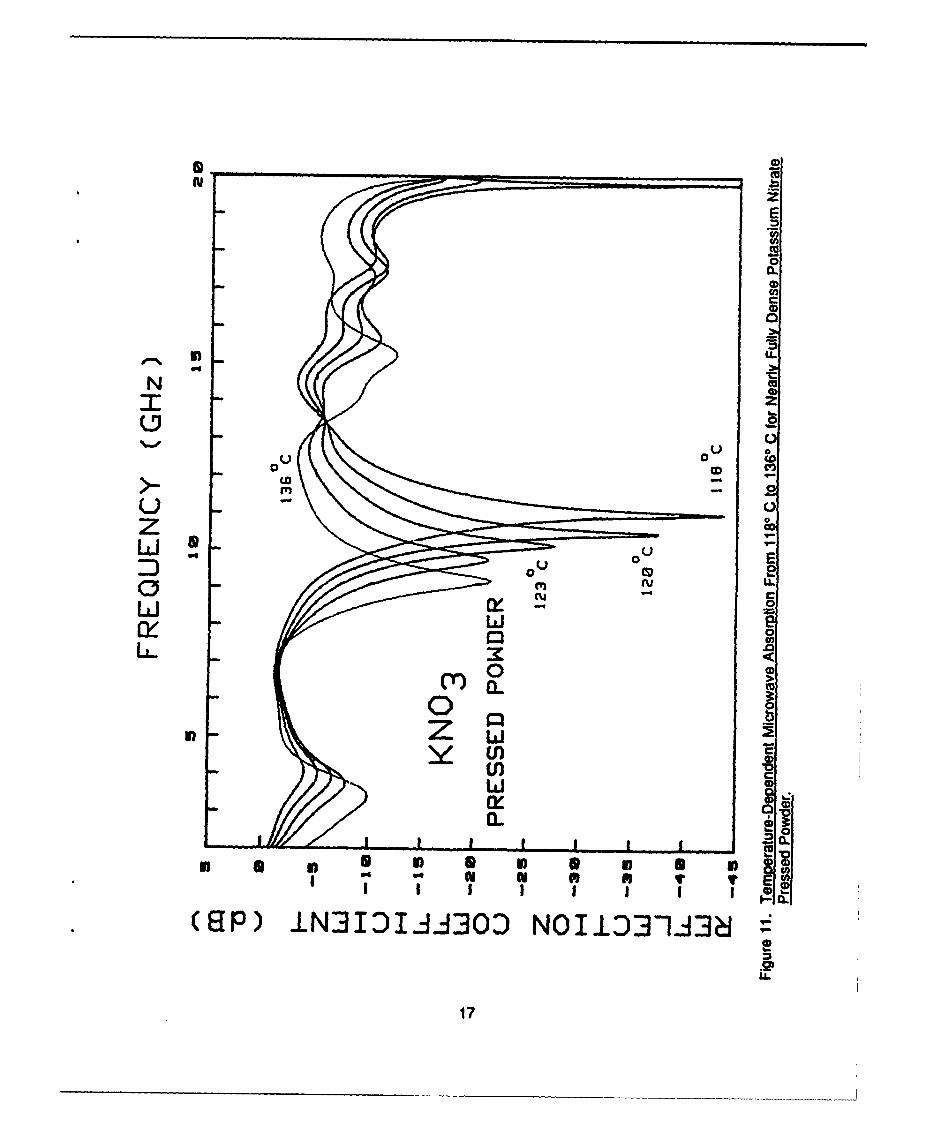
Results of measurements on a nearly fully dense, 8.1-mm-thick, pressed powder sample
of potassium nitrate are shown in Figures 10 and 11. As in the loose powder sample, the
losses do not begin to occur until the temperature is raised above 1000 C. Above this
temperature, a rapid increase in the absorption peaks occur until the temperature is raised to
1180 C. Above this temperature, the two large absorption peaks move to lower frequencies
and become weaker. A weaker, low-frequency peak (below 5 GHz) continues to grow as the
temperature is raised to above 1360 C. The same behavior was seen in the loose powder
potassium nitrate sample for a weak, low-frequency absorption peak. All the results for
potassium nitrate are strong evidence for the development of a dipolar loss mechanism above
about 1000 C as discussed above. The weakening of the losses above the transition
temperature can be explained by the movement of the potassium ions towards the centroid
line joining the nitrate ions. This results in a decrease in the dynamically induced dipole
moment and thus the mechanism for loss in this material.
5. SUMMARY
We have studied the temperature-dependent centimeter wave absorption characteristics of
several inorganic salts. Some were ionic salts and some were ionic molecular crystals. The
ionic salts behaved as expected, with very low losses at the temperatures measured. This is
clearly due to the fact that a strong dipolar loss mechanism is not present in these materials.
Several ionic molecular crystals were studied. The nitrites, which have a permanent dipolemoment, showed absorption only at temperatures high enough to excite "hopping" modes.
For potassium nitrite, losses were seen at all the temperatures measured and for sodium
nitrite they were seen above about 1000 C. The nitrates exhibited interesting behavior with
5
sodium nitrate showing very little loss at the temperatures measured and potassium nitrate
showing strong temperature-dependent absorptions above about 1050 C. The centimeter
wave absorption observed in potassium nitrate near the order/disorder transition temperature
is likely caused by a dynamically induced dipolar loss mechanism.
6

F-
-LJ
LLJ CL
ci: 0
LU
z a-
2E
a0
a:
E
CDC-)a
I-J
iii: U-
8c

.Qal
0L
0
in 0.
00
z locow IVE
0-4-
C3
U CU
LL-0 0
Z xE0 0
CL U-c0
100

InIN 04
U 0
040
zz
C3I
C~C
0 L0
zz- 0
aU
LLL
(Y m , V) ID 0
El Pi N3'ID I J.J3 0D NO113-1 3c0
uUu
0j
N('5
UC
0 L0
uiz 0~
Z0
(3 5
(T)iNI)IJ0 N010)I~
12

U01
U,
Cuu0 0
00 1u EN 00e
CCu
Cu Ez .2
w 0 0
L L
cyc
UjU.
(9P iNIDIA30 NOiD0J3
131

16
(UD
w z00
U 0.
C3o
w0
U.
(SP -NIIA0 N~D13
Z rdl 10
0 I
0 CD
0CL
Nu 80 E
Un0
CL
- 0
z 0 w
0 0A
CLC
w0
LL- 0)
115
N zE
0i~0-0
U.
0
0 ru 0
cm
Li 2UU
bi!i
LLJ 0
0 -
Z wi 0En,En
CDa. 0
0
a S a tv a U S
(SP) iN3IDIAi3OD NOIi33-ld38U.
16
E
U 0
0 a 0
0 E
0
0u 0-o 0
0-0
Z 9P 0NIIJ0 O 3I3
:J L170
INTENTIONALLY LEFT BLANK.
18
6. REFERENCES
Adams, D. M., M. Pogson, and S. K. Sharma. "Spectroscopy at Very High Pressures:Part 51. A Ramon and Infared Study of the Polymorphs of KNO 2 ." J. Phys. Chem: SolidState Phys. vol. 21, 1988.
Blakemore, J. S. Solid State Physics. Philadelphia, PA: W. B. Saunders, 1969.
Jona, F., and G. Shirane. Ferroelectric Crystals. New York: The Macmillan Company, 1962.
Kitalgorodsky, A. I. Molecular Crystals and Molecules. New York and London: AcademicPress, 1973.
Kittel, C. Introduction to Solid State Physics. Fourth Edition, New York, NY: John Wiley andSons, 1971.
Lu, H. M., and J. R. Hardy. "Ab Initio Simulations of Phase Transitions in KNO 3."Ferroelectrics vol. 111, pp. 43-47, 1990.
Lu, H. M., and J. R. Hardy. "First Principles Study of Phase Transitions in KNO 3 ." Submittedto Physical Review B, 1991.
Lu, H. M., and J. R. Hardy. Ferroelectrics. In press, 1992.
Megaw, H. D. Crystal Structures: A Working Approach. Philadelphia, PA: W. B. Saunders,1973.
Von Hippel, A. R. Dielectric Materials and Applications. Massachusetts Institute ofTechnology Press, 1954.
19

INTENTIONALLY LEFT BLANK.
20

No. of No. ofCopies Organization Copies Oroanization
2 Administrator 1 CommanderDefense Technical Info Center U.S. Army Tank-Automotive CommandATTN: DTIC-DDA ATTN: ASONC-TAC-DIT (TechnicalCameron Station Information Center)Alexandria, VA 22304-6145 Warren, MI 48397-5000
Commander 1 DirectorU.S. Army Materiel Command U.S. Army TRADOC Analysis CommandATTN: AMCAM ATTN: ATRC-WSR5001 Eisenhower Ave. White Sands Missile Range, NM 88002-5502Alexandria, VA 22333-0001
1 CommandantCommander U.S. Army Field Artillery SchoolU.S. Army Laboratory Command ATTN: ATSF-CSIATTN: AMSLC-DL Ft. Sill, OK 73503-50002800 Powder Mill Rd.Adelphi, MD 20783-1145 (cw.. mW)1 Commandant
U.S. Army Infantry School2 Commander ATTN: ATSH-CD (Security Mgr.)
U.S. Army Armament Research, Fort Benning, GA 31905-5660Development, and Engineering Center
ATTN: SMCAR-IMI-I (ummi. mdY)1 CommandantPicatinny Arsenal, NJ 07806-5000 U.S. Army Infantry School
ATTN: ATSH-CD-CSO-OR2 Commander Fort Benning, GA 31905-5660
U.S. Army Armament Research,Development, and Engineering Center 1 WL/MNOI
ATTN: SMCAR-TDC Eglin AFB, FL 32542-5000Picatinny Arsenal, NJ 07806-5000
Aberdeen Proving GroundDirectorBenet Weapons Laboratory 2 Dir, USAMSAAU.S. Army Armament Research, ATTN: AMXSY-D
Development, and Engineering Center AMXSY-MP, H. CohenATTN: SMCAR-CCB-TLWatervliet, NY 12189-4050 1 Cdr, USATECOM
ATTN: AMSTE-TC(unc•m. oni)l Commander
U.S. Army Rock Island Arsenal 3 Cdr, CRDEC, AMCCOMATTN: SMCRI-TIJTechnical Library ATTN: SMCCR-RSP-ARock Island, IL 61299-5000 SMCCR-MU
SMCCR-MSIDirectorU.S. Army Aviation Research 1 Dir, VLAMO
and Technology Activity A'TN: AMSLC-VL-DATTN: SAVRT-R (Library)M/S 219-3 10 Dir, USABRLAmes Research Center ATTN: SLCBR-DD-TMoffett Field, CA 94035-1000
CommanderU.S. Army Missile CommandATTN: AMSMI-RD-CS-R (DOC)Redstone Arsenal, AL 35898-5010
21
No. of No. ofCopies Organization Copies Organization
Commander 1 CommanderU.S. Army Armament Research U.S. Army Belvoir Research & Engineering Center
Development, and Engineering Center ATTN: STRBE-JDR, Grayson WalkerATTN: SMCAR-FSP-A(2), Paul Kisatsky Fort Belvoir, VA 22060-5606Picatinny Arsenal, NJ 07806-5000
I Commander3 Commander U.S. Army Natick RD&E Center
U.S. Army Laboratory Command ATTN: STRNC-ITC, Therese R. CommerfordATTN: SLCLT, Natick, MA 01760-5019
Robert WeinraubMichael Mattie 1 CommanderDon Woodbury U.S. Army Foreign Science & Technology Center
2800 Powder Mill Road ATTN: AIFREA, Stephen EitelmanAdelphi, MD 20783-1145 220 7th St. NE
Charlottesville, VA 22901-53962 Director
U.S. Army Materials Technology Laboratory 2 DirectorATTN: SLCMT-EMC, U.S. Army Research Office
William Spurgeon ATTN: John PraterThomas Hynes Kailasam lyer
Arsenal Street Box 12211Watertown, MA 02172-0001 Research Triangle Park, NC 27709
Director 1 CommanderU.S. Army Vulnerability Assessment HO Laboratory Command
Laboratory ATTN: SLCSM, LTC Walt ProbkaATTN: SLCVA-TAC, Joy Arthur 2800 Powder Mill RoadWhite Sands Missile Range, NM Adelphi, MD 20783
88002-55131 Commander
Director U.S. Army Laboratory CommandU.S. Army Harry Diamond Laboratories ATTN: SLCTO, Steven KovelATTN: SLCHD-ST-RC, Arthur J. Kendall 2800 Powder Mill Road2800 Powder Mill Road Adelphi, MD 20783Adelphi, MD 20783-1197
2 University of Nebraska at LincolnCommander Department of Physics and Center forU.S. Army Missile Command Electro-OpticsATTN: AMSMI-RD-ST, Larry C. Mixon ATTN: Dr. John HardyRedstone Arsenal H.M. LuHuntsville, AL 35898-5000 Lincoln, NE 68588-0111
CommanderU.S. Army Tank-Automotive CommandATTN: AMSTA-RSC, John BennetWarren, MI 48397-5000
22

No. of
Copies Organization
Aberdeen Proving Ground
2 Cdr, CRDEC, AMCCOMATrN: SMCCR-RSP-B,
E. RileyJ. Embry
1 Cdr, USACSTAATTN: STECS-EN-PH, Frank Carlen
23
INTENTIONALLY LEFT BLANK.
24

USER EVALUATION SHEET/CHANGE OF ADDRESS
This Laboratory undertakes a continuing effort to improve the quality of the reports it publishes. Yourcomments/answers to the items/questions below will aid us in our efforts.
1. BRLReponNumber BRL-MR-4002 DateofReport September 1992
2. Date Report Received
3. Does this report satisfy a need? (Comment on purpose, related project., or other area of interest for
which the report will be used.)
4. Specifically, how is the report being used? (Information source, design data, procedure, source of
ideas, etc.)
5. Has the information in this report led to any quantitative savings as far as man-hours or dollars saved,
operating costs avoided, or efficiencies achieved, etc? If so, please elaborate.
6. General Comments. What do you think should be changed to improve future reports? (Indicatechanges to organization, technical content, format, etc.)
Name
CURRENT CrganizationADDRESS
Address
City, State, Zip Code
7. If indicating a Change of Address or Address Correction, please provide the New or Correct Addressin Block 6 above and the Old or Incorrect address below.
Name
OLD OrganizationADDRESS
Address
City, State, Zip Code
(Remove this sheet, fold as indicated, staple or tape closed, and mail.)


