CGIAR Research Program on
Climate Change, Agriculture and Food Security (CCAFS)
Summary of Baseline Household Survey
Results:
Makueni, Kenya
December 2012
Muoti Mwangangi, Ianetta Mutie, Joash Mango

1
Correct citation:
Mwangangi M, Mutie M, Mango J. 2012. Summary of Baseline Household Survey Results: Makueni,
Kenya. CGIAR Research Program on Climate Change, Agriculture and Food Security (CCAFS).
Copenhagen, Denmark. Available online at: www.ccafs.cgiar.org.
Published by the CGIAR Research Program on Climate Change, Agriculture and Food Security
(CCAFS).
CCAFS Coordinating Unit - Department of Agriculture and Ecology, Faculty of Life Sciences,
University of Copenhagen, Rolighedsvej 21, DK-1958 Frederiksberg C, Denmark. Tel: +45
35331046; Email: [email protected].
Creative Commons License
This Report is licensed under a Creative Commons Attribution – Non Commercial–NoDerivs 3.0
Unported License.
This publication may be freely quoted and reproduced provided the source is acknowledged. No use
of this publication may be made for resale or other commercial purposes.
© 2012 CGIAR Research Program on Climate Change, Agriculture and Food Security (CCAFS).
DISCLAIMER:
This report has been prepared as an output for Theme 4/baseline under the CCAFS program and has
not been peer reviewed. Any opinions stated herein are those of the author(s) and do not necessarily
reflect the policies or opinions of CCAFS.
All images remain the sole property of their source and may not be used for any purpose without
written permission of the source.
2
Abstract
This report presents a summary of the main results of a survey carried out between April 2012 and
June 2012 in seven (7) villages with 140 households (HHs) in Wote, a benchmark site of the CGIAR
Research Program on Climate Change, Agriculture, and Food Security (CCAFS)1. Wote is located in
Makueni County in South Eastern Kenya. The survey was carried out using the standardised CCAFS
household baseline tool.
The results show that the majority of the surveyed households in the area are male-headed and less
than 2% are child-headed, with an average of 6 persons per household. Education is highly valued in
the area as a majority have received formal education. A majority of surveyed households produce
food crops, fruits (mango and citrus) and keep livestock and hence the major livelihood is mixed
farming. However, the farming is subsistence as most of the crops produced are consumed at the
household level. More than 50% of fruits, livestock products and small livestock are usually sold.
Also sold are the cash crops.
Off-farm produce and products are not common in the area as land is privately owned and there is no
communal land. The most important crops for consumption in the area are maize, cowpeas and pigeon
peas and most important livestock currently is chicken. Fertilizer use in the area is very low. For our
surveyed households only 2% are ‘food secure’ all year long. Only 1% have enough food for their
families for at least 10 months of the year, and 97% of the households struggle to get enough food to
feed their family for more than 2 months out of a year. All the households have made changes to their
crops and livestock as a result of climate and market-related reasons.
The radio is the major source of weather and climate related information in the area. This information
in most cases is received by women. Most of the information received had some advice on what to do
in weather aspects. The most changed aspects of farming upon receipt of all the information were crop
type, crop variety, land management and change in timing of farming activities. The least changed
aspects of farming upon receipt of relevant information were land area, field allocation, water
management, livestock type and livestock breeds
Keywords
Kenya, baseline, household survey, livelihoods, agriculture products
1 For more information about CCAFS, see: http://www.ccafs.cgiar.org. A complementary community-level survey was also
conducted in Wote and those survey guidelines and reports will also be available on the website.

3
About the authors
Ms. Muoti Mwangangi, Ministry of Agriculture, P.O. Box 2562-90100, Machakos, Kenya
Ms. Ianetta Mutie, International Livestock Research Institute (ILRI), P.O. Box 30709-00100, Nairobi,
Kenya
Mr. Joash Mango, World Agroforestry Centre (ICRAF), P.O. Box 2389-40100, Kisumu, Kenya
4
Table of contents
Abstract ............................................................................................................................................ 2
Keywords .......................................................................................................................................... 2
About the authors .............................................................................................................................. 3
Table of contents ............................................................................................................................... 4
1.0 Introduction ................................................................................................................................. 5
1.1 Household types and respondents ................................................................................................. 5
2.0 Household demographics ............................................................................................................. 7
2.1 Education levels .......................................................................................................................... 7
3.0 Sources of livelihoods .................................................................................................................. 8
3.1 On-farm livelihood sources .......................................................................................................... 8
3.2 Off-farm livelihood sources ......................................................................................................... 9
3.3 Diversification indices ............................................................................................................... 10
3.4 Who does most of the work for on- and off-farm products? ........................................................ 10
3.5 Sources of cash income .............................................................................................................. 12
3.6 Discussion ................................................................................................................................. 12
4.0 Crop, farm animals/fish, tree, soil, land, and water management changes ................................... 13
4.1 Crop-related changes ................................................................................................................. 13
4.2 Reasons for crop-related changes ............................................................................................... 14
4.3 Livestock-related changes .......................................................................................................... 15
4.4 Adaptability/Innovation index .................................................................................................... 17
4.5 Mitigation indices ...................................................................................................................... 17
4.6 Discussion ................................................................................................................................. 18
5.0 Food security ............................................................................................................................. 18
5.1 Food security index ................................................................................................................... 20
5.2 Discussion ................................................................................................................................. 20
6.0 Land and Water ......................................................................................................................... 20
6.1 Water for agriculture .................................................................................................................. 20
6.2 Land use .................................................................................................................................... 21
6.3 Discussion ................................................................................................................................. 21
7.0 Input and credit .......................................................................................................................... 21
7.1 Fertilizer use .............................................................................................................................. 22
7.2 Discussion ................................................................................................................................. 22
8.0 Climate and weather information ............................................................................................... 23
8.1 Who is receiving information? ................................................................................................... 23
8.2 Types of weather-related information ......................................................................................... 23
8.3 Discussion ................................................................................................................................. 25
9.0 Community groups .................................................................................................................... 26
9.1 Climate related crises ................................................................................................................. 26
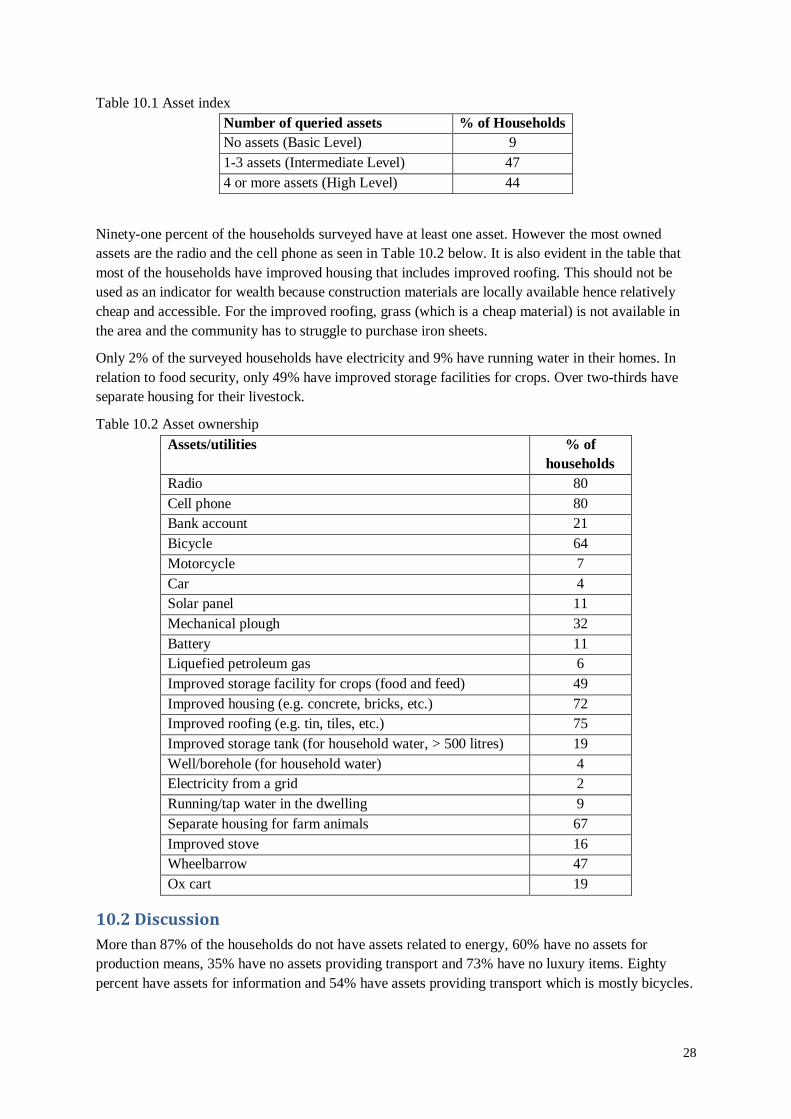
10.0 Assets ...................................................................................................................................... 27
10.1 Asset indicator ......................................................................................................................... 27
10.2 Discussion ............................................................................................................................... 28
Appendix 1: Survey Process and Implementation............................................................................. 30
Appendix 2: Sampling Frame – List of Villages ............................................................................... 31
5
1.0 Introduction
This is a report of a baseline household level survey which was carried out from April to June 2012 in
7 (out of 53) villages with 140 households in Wote, Kenya. The CCAFS research site is a block of
10km x 10km located in Makueni County, with Kwa Kathoka KARI substation as the benchmark.
The site is about 7km from Wote town along Wote-Makindu tarmac road.
The Wote site has two distinct rainy seasons: the long rains which are experienced between April and
June and the short rains between October and December. The short rains however are the most
reliable. The elevation is between 900-1000 m above sea level.
The objective of this survey was to gather baseline information at the household-level about some
basic indicators of welfare, information sources, livelihood/agriculture/natural resource management
strategies, needs and uses of climate and agricultural-related information and current risk
management, mitigation and adaptation practices. The aim was to capture some of the diversity in the
landscape, across communities and households, with sufficient precision in some of these indicators to
encapsulate changes that occur over time, as these same households will be revisited in 5-10 years and
these changes observed. For full details of survey team members and villages surveyed see
Appendices 1 and 2. The questionnaire and training materials associated with it, including data entry
and management guidelines, can be found at www.ccafs.cgiar.org/resources/baseline-surveys. The
questionnaire was divided into ten sections, as follows:
Household respondent and type
Demography
Sources of livelihood
Crop, farm animals/fish, tree, soil, land and water management changes
Food security
Land and water
Input and credits
Climate and weather information
Community groups
Assets
This report provides a summary of the main findings of the analysis of the household survey data.
Figure 1 shows the location of the Wote site in Makueni in eastern Kenya. The red dots show the 140
sampled households. We now turn to a summary of the main findings of the analysis of the survey
data, reported on according to each section of the questionnaire.
1.1 Household types and respondents
Of the surveyed households, 66% were male-headed, 33% female headed and others 1%. It is rare to
find child-headed households as in such cases the children are shared among relatives who act as their
guardians or adopt them. Of the respondents, 39% were male and 61% female. The high number of
the female respondents could be attributed to the fact that mostly males either work in urban areas or
leave the homes in the morning to look for casual jobs while the women are left in the farm to carry
out the domestic cores.
Fifteen percent of the households in the area have between 1-3 persons, 71% between 4-7 persons,
10% with more than 8-9 persons and 3% with between 10-13 persons. This data agrees with the 2009
census which indicated that a household in the area has an average of 5.5 persons.

Figure 1 Wote research site map and location of sampled villages
2.0 Household demographics
In household demography the following data was collected and tabulated as below.
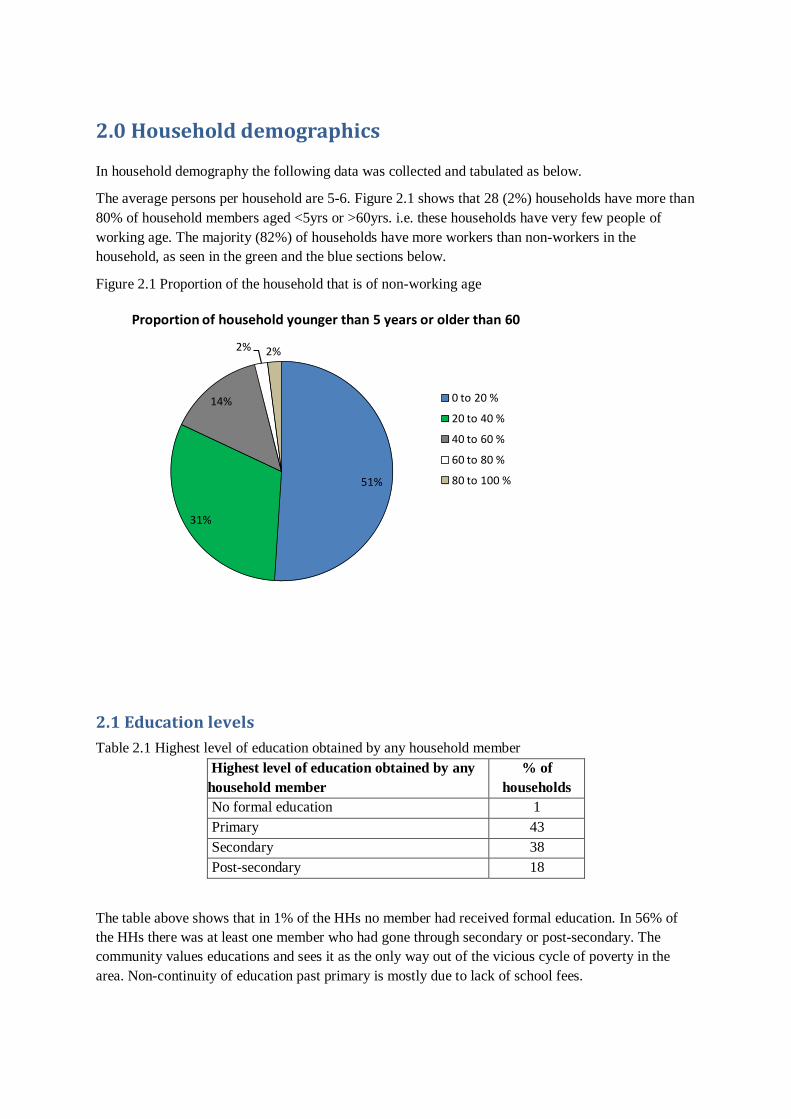
The average persons per household are 5-6. Figure 2.1 shows that 28 (2%) households have more than
80% of household members aged <5yrs or >60yrs. i.e. these households have very few people of
working age. The majority (82%) of households have more workers than non-workers in the
household, as seen in the green and the blue sections below.
Figure 2.1 Proportion of the household that is of non-working age
51%
31%
14%
2% 2%
Proportion of household younger than 5 years or older than 60
0 to 20 %
20 to 40 %
40 to 60 %
60 to 80 %
80 to 100 %
2.1 Education levels
Table 2.1 Highest level of education obtained by any household member
Highest level of education obtained by any
household member
% of
households
No formal education 1
Primary 43
Secondary 38
Post-secondary 18
The table above shows that in 1% of the HHs no member had received formal education. In 56% of
the HHs there was at least one member who had gone through secondary or post-secondary. The
community values educations and sees it as the only way out of the vicious cycle of poverty in the
area. Non-continuity of education past primary is mostly due to lack of school fees.
8
3.0 Sources of livelihoods
3.1 On-farm livelihood sources
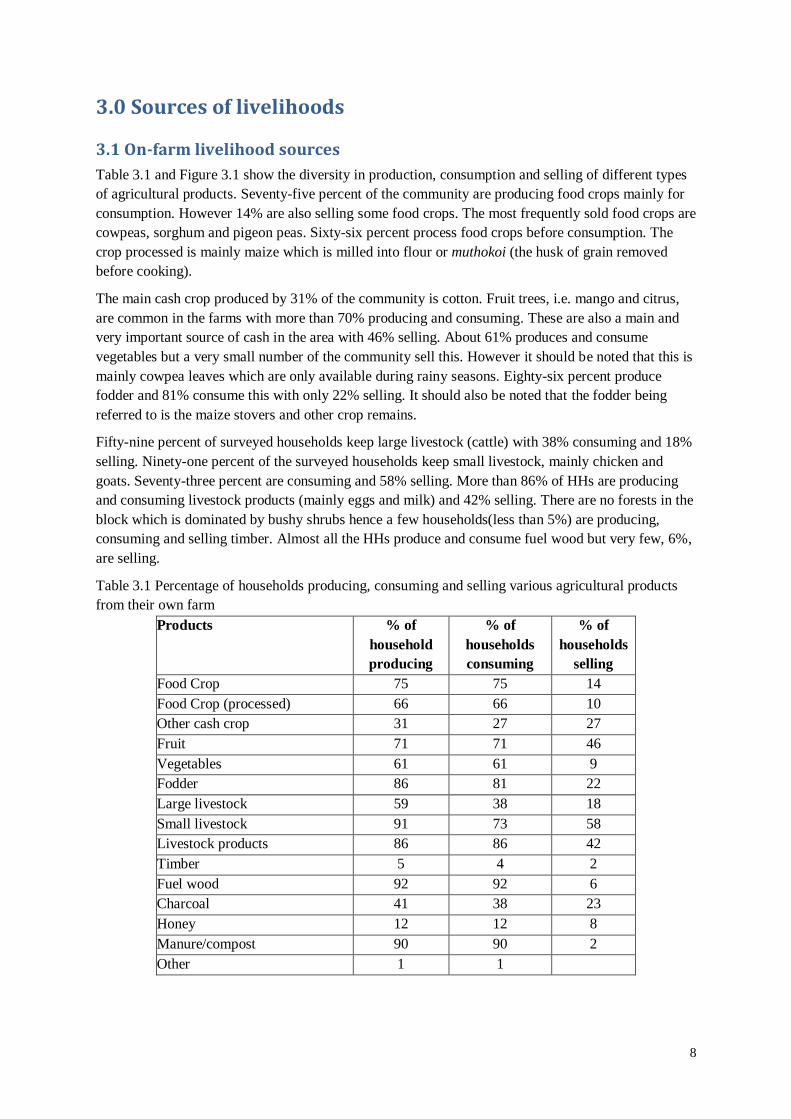
Table 3.1 and Figure 3.1 show the diversity in production, consumption and selling of different types
of agricultural products. Seventy-five percent of the community are producing food crops mainly for
consumption. However 14% are also selling some food crops. The most frequently sold food crops are
cowpeas, sorghum and pigeon peas. Sixty-six percent process food crops before consumption. The
crop processed is mainly maize which is milled into flour or muthokoi (the husk of grain removed
before cooking).
The main cash crop produced by 31% of the community is cotton. Fruit trees, i.e. mango and citrus,
are common in the farms with more than 70% producing and consuming. These are also a main and
very important source of cash in the area with 46% selling. About 61% produces and consume
vegetables but a very small number of the community sell this. However it should be noted that this is
mainly cowpea leaves which are only available during rainy seasons. Eighty-six percent produce
fodder and 81% consume this with only 22% selling. It should also be noted that the fodder being
referred to is the maize stovers and other crop remains.
Fifty-nine percent of surveyed households keep large livestock (cattle) with 38% consuming and 18%
selling. Ninety-one percent of the surveyed households keep small livestock, mainly chicken and
goats. Seventy-three percent are consuming and 58% selling. More than 86% of HHs are producing
and consuming livestock products (mainly eggs and milk) and 42% selling. There are no forests in the
block which is dominated by bushy shrubs hence a few households(less than 5%) are producing,
consuming and selling timber. Almost all the HHs produce and consume fuel wood but very few, 6%,
are selling.
Table 3.1 Percentage of households producing, consuming and selling various agricultural products
from their own farm
Products % of
household
producing
% of
households
consuming
% of
households
selling
Food Crop 75 75 14
Food Crop (processed) 66 66 10
Other cash crop 31 27 27
Fruit 71 71 46
Vegetables 61 61 9
Fodder 86 81 22
Large livestock 59 38 18
Small livestock 91 73 58
Livestock products 86 86 42
Timber 5 4 2
Fuel wood 92 92 6
Charcoal 41 38 23
Honey 12 12 8
Manure/compost 90 90 2
Other 1 1
9
Figure 3.1 On-farm diversity in products produced, consumed and sold
3.2 Off-farm livelihood sources
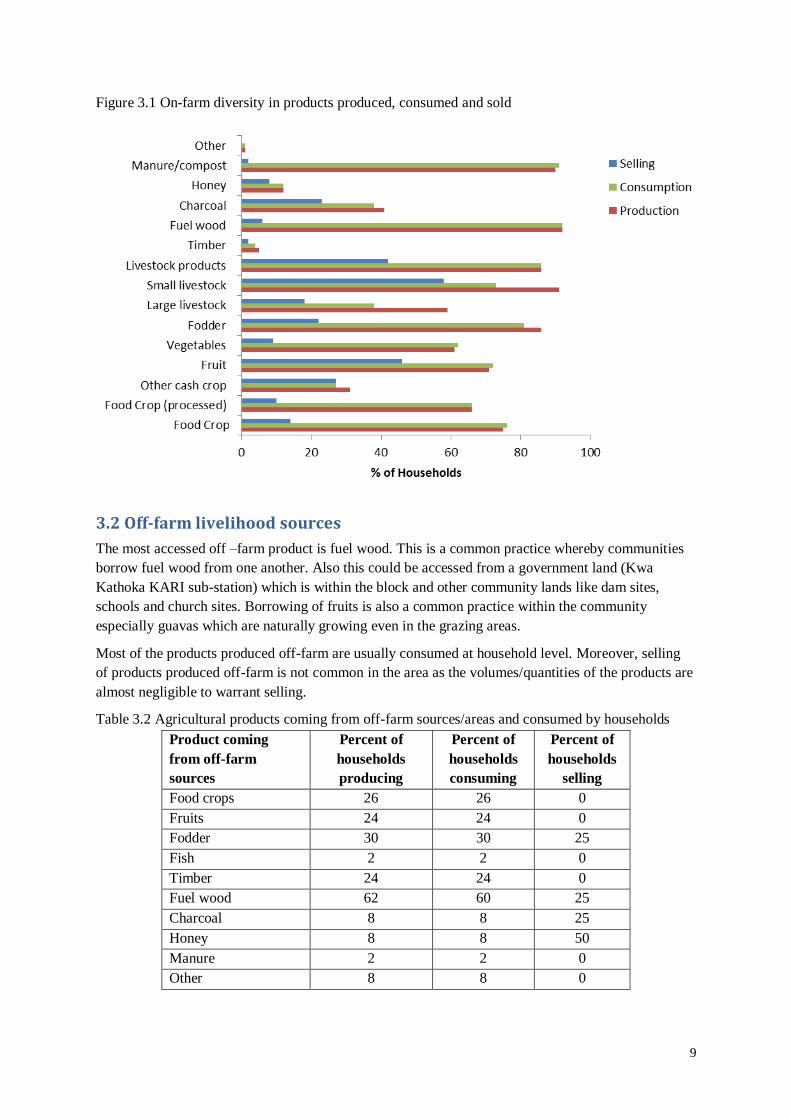
The most accessed off –farm product is fuel wood. This is a common practice whereby communities
borrow fuel wood from one another. Also this could be accessed from a government land (Kwa
Kathoka KARI sub-station) which is within the block and other community lands like dam sites,
schools and church sites. Borrowing of fruits is also a common practice within the community
especially guavas which are naturally growing even in the grazing areas.
Most of the products produced off-farm are usually consumed at household level. Moreover, selling
of products produced off-farm is not common in the area as the volumes/quantities of the products are
almost negligible to warrant selling.
Table 3.2 Agricultural products coming from off-farm sources/areas and consumed by households
Product coming
from off-farm
sources
Percent of
households
producing
Percent of
households
consuming
Percent of
households
selling
Food crops 26 26 0
Fruits 24 24 0
Fodder 30 30 25
Fish 2 2 0
Timber 24 24 0
Fuel wood 62 60 25
Charcoal 8 8 25
Honey 8 8 50
Manure 2 2 0
Other 8 8 0

10
3.3 Diversification indices
A production diversification index was created by adding up the total number of agricultural products
produced on-farm:
1=1-4 products (low production diversification)
2=5-8 products (intermediate production diversification)
3=more than 8 products (high production diversification)
On the selling/commercialization side, the total numbers of agricultural products produced on their
own farms, with some of the products sold were added up:
0=no products sold (no commercialization)
1=1-2 products sold (low commercialization)
2=3-5 products sold (intermediate commercialization)
3=more than 5 products sold (high commercialization)
The results of these diversification indices for our surveyed households in Wote are shown in Table
3.3.
Table 3.3 indicates that the surveyed households mostly fall under the high production diversification
category as 60% are classified as such, 35% on intermediate production diversification and only 5%
on low production diversification. This is the true picture on the ground as the households plant
several crops to spread the risks associated with farming and can also reflect the high practise of
subsistence farming.
Only a small number (8%) of the households have a high commercialization index. Most households
sell 1-2 products (low commercialization) while 11% show no evidence of commercialisation, selling
none of their agricultural produce.
Table 3.3 Products produced/harvested on-farm– in the last 12 months
Product Diversification:
% of
households
1-4 products (low product diversification) 5
5-8 products (intermediate product diversification) 35
9 or more products (high production diversification) 60
Selling/Commercialization Diversification:
No products sold (no commercialization) 11
1-2 products sold (low commercialization) 47
3-5 products sold (intermediate commercialization) 34
6 or more products sold (high commercialization) 8
3.4 Who does most of the work for on- and off-farm products?
With respect to workload on-farm (Figure 3.2), the results show that work is mostly done by several
people (85%). However the woman, who is mostly at home, does most of the work within the farm
(36%).
Most of the work off-farm is almost equally shared among the family members. However, the girl
child is more tasked than the male counterpart, and this can be attributed to the fact that fuel wood
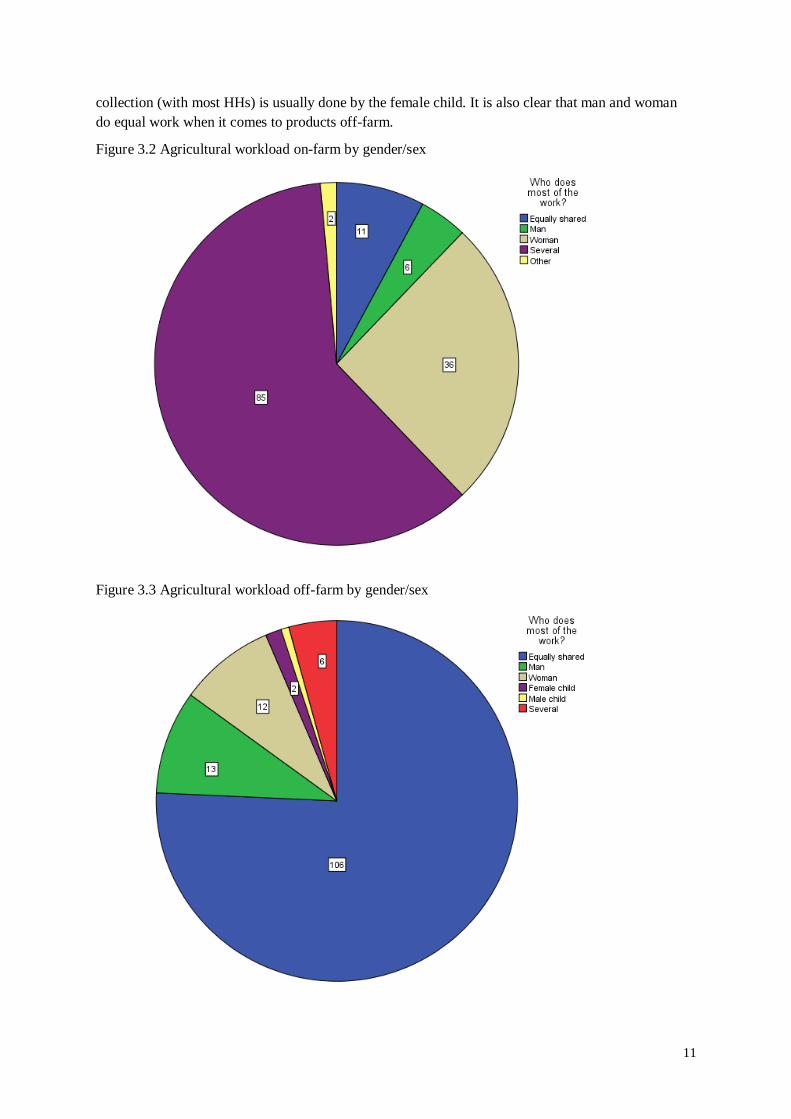
11
collection (with most HHs) is usually done by the female child. It is also clear that man and woman
do equal work when it comes to products off-farm.
Figure 3.2 Agricultural workload on-farm by gender/sex
Figure 3.3 Agricultural workload off-farm by gender/sex

12
3.5 Sources of cash income
At least 97% of the households have a source of cash income. Also 66% of the households have no
new source of income and 29% have at least one new source. Thirty-four percent is receiving cash
from at least one new source in the last 12 months, 48% no longer receiving cash income from at least
one source that they did previously and in 37% there is no change from previous year.
From Table 3.5 below, 53% of the households received cash from employment on someone else’s
farm and this could mean that is just casual wages which is available seasonally. Thirty-six percent of
the HHs obtain loan or credit from an informal source, 29% from business and 22% from remittances
or gifts.
Table 3.5 Sources of cash income other than from own farm
Sources of Cash Income % of
households
Employment on someone else’s farm 53
Other paid employment 34
Business 30
Remittances/gifts 22
Payments for environmental services 14
Payments from government or other
projects/programs
12
Loan or credit from a formal institution 9
Informal loan or credit 36
Renting out farm machinery 7
Renting out your own land 9
No off-farm cash source 3
3.6 Discussion
The area is situated outside the main towns and the available source of income other than from selling
of farm produce is mainly from employment on other farms. However, this is not readily available
hence not a guarantee to get it when needed.
Informal loan or credit is also an important source and this is usually from merry go rounds (groups
that lend money to each member in turn) and table banking2 by groups. Other paid employment
includes charcoal burning/selling, brick making, etc. Remittances/gifts are mainly from children or
relatives working in the urban centres.
Payments for environmental services and payments from government or other projects/programs can
be combined as there are projects which pay the community to do soil and water conservation
activities in their farms, e.g. food for assets (FFA) programme.
The machinery usually rented out is the oxen plough and/or the oxen. Others include brick making
box and oxen drawn cart.
2 Group members’ periodical contributions are put in a basket from where a member in need can borrow at relatively small interest and usually no collateral needed. The group’s money need not be banked as it is usually
in circulation among the members. Dividends are also availed to members.
13
4.0 Crop, farm animals/fish, tree, soil, land, and water
management changes
4.1 Crop-related changes
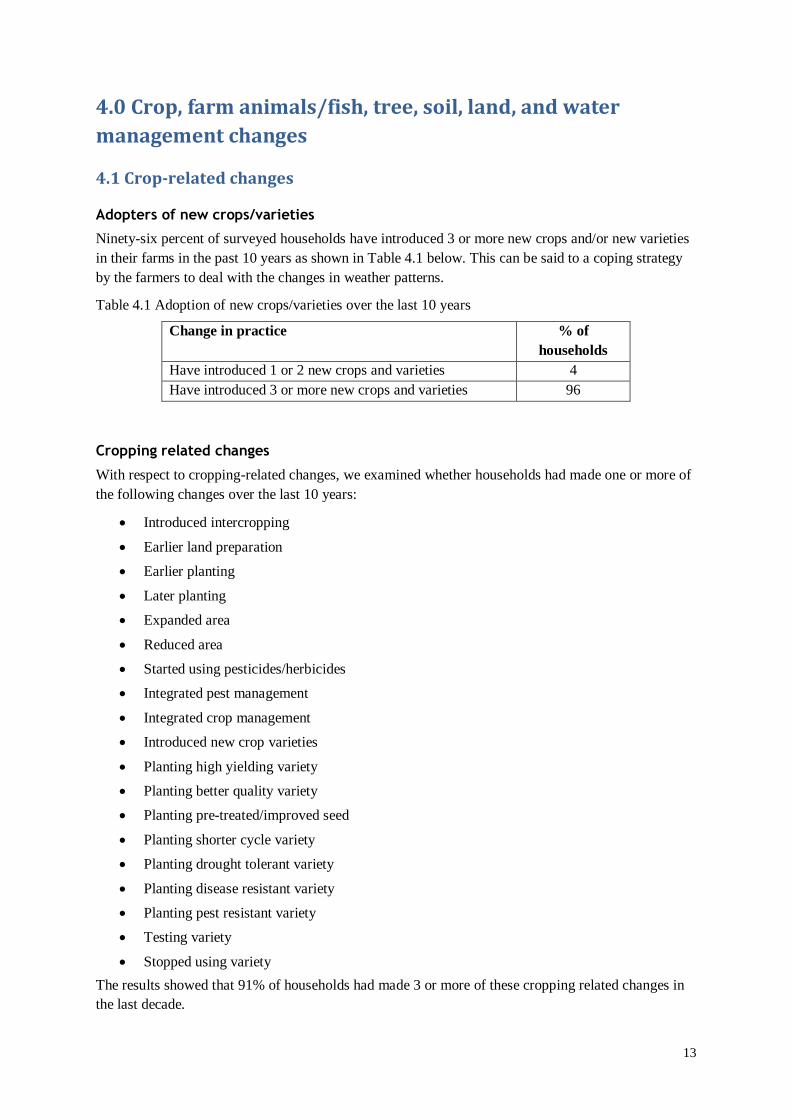
Adopters of new crops/varieties
Ninety-six percent of surveyed households have introduced 3 or more new crops and/or new varieties
in their farms in the past 10 years as shown in Table 4.1 below. This can be said to a coping strategy
by the farmers to deal with the changes in weather patterns.
Table 4.1 Adoption of new crops/varieties over the last 10 years
Change in practice % of
households
Have introduced 1 or 2 new crops and varieties 4
Have introduced 3 or more new crops and varieties 96
Cropping related changes
With respect to cropping-related changes, we examined whether households had made one or more of
the following changes over the last 10 years:
Introduced intercropping
Earlier land preparation
Earlier planting
Later planting
Expanded area
Reduced area
Started using pesticides/herbicides
Integrated pest management
Integrated crop management
Introduced new crop varieties
Planting high yielding variety
Planting better quality variety
Planting pre-treated/improved seed
Planting shorter cycle variety
Planting drought tolerant variety
Planting disease resistant variety
Planting pest resistant variety
Testing variety
Stopped using variety
The results showed that 91% of households had made 3 or more of these cropping related changes in
the last decade.

14
Water management related changes
For the water management-related changes, the following changes in practice were considered:
Started irrigating
Introduced micro-catchments
Introduced improved irrigation
Introduced improved drainage
Introduced mulching
Here, we found that 90% of households had made two or more water management-related changes
Soil management related changes
The possible management changes considered were:
Stopped burning
Introduced intercropping
Introduced cover crop
Introduced micro-catchments
Introduced/built ridges or bunds
Introduced terraces
Introduced stone lines
Introduced hedges
Introduced contour ploughing
Introduced rotation
Started using more mineral/chemical fertilizers
Started using manure/composite
The results show that 100% of households reported having made two or more soil management
related changes in the last 10 years.
Tree/agroforestry management related changes
The results show that 97% of households have made some tree/agroforestry management related
changes in the last decade. Here we considered whether households have either:
Planted trees within the last year
Protected trees within the last year
Other changes
We also looked at whether households have made any other changes to crops not specified in the
questionnaire. Our findings show that no households reported making any additional changes.
4.2 Reasons for crop-related changes
Several factors were cited as reasons for change. These include markets, climate, land, labour,
pests/diseases and projects. All the households sampled cited these factors except in projects, where
only 1% said projects were a reason for change.

15
Table 4.2 Reasons for changing cropping practices, by category
Reason for changing cropping
practices, related to:
% of households
citing
Markets 97
Weather/climate 64
Land 91
Labour 65
Pests/diseases 34
Projects 1
On markets, farmers are growing green grams as a result of new opportunities to sell. Green grams
have been unpopular but are becoming a cash crop in the area. On marketing factors, cotton has been
abandoned due to poor prices as compared to the cost of production. Also the crop is labour intensive
during harvesting and sorting and pests and disease management. It is also highly pest infested. In
order to realise economical/meaningful output cotton production requires growing under large areas
hence land is also limiting.
Gadham sorghum is being promoted in the area but is not taken up because of the birds menace. Bird
scaring is usually done by young children, and they are all in school. Sorghum is a traditional crop in
the area but has been dropped because of this problem.
Climate-related reasons
Ninety percent of the households have made changes to their most important crops because of climate
reasons. The most important crops in the area were cited as maize, cowpeas, green grams and pigeon
peas.
Table 4.3 Weather/Climate-related reasons for changes in cropping practices
Weather/Climate related
Reason
% of the households that
cited at least one weather-
related reason
Earlier start of rains 2
Less overall rainfall 84
More frequent droughts 19
Later start of rains 3
More frequent floods 20
Higher temperatures 2
Strong winds 3
Lower groundwater table 49
4.3 Livestock-related changes
The results show that 94% of the households have livestock whereby 54% have more than three types
of animals, 26% have two types and 14% have only one type of animal. With respect to changes over
the last 10 years, we see that the majority of households (66%) have 2 or 3 animal types and either
these are all the same as 10 years ago or they have only changed one type of animal.
The most important/common animals are beef cattle, chicken, goats and oxen in that order. Ten years
ago the order was beef cattle, goats and chicken.
Eighty-seven percent of the households have made changes to their most important animals. On
average the changes made affected 3 animal types.
16
Adopters of new animal types/breeds
The results suggest that 90% of the households introduced 3 or more new animal types and/or new
breeds. Only 10% of households have not introduced any new types of animals/breeds
Herd related changes
For herd related changes the following indicators were considered:
Reduction in herd size
Increase in herd size
Change in herd composition
126 households (90%) made 3 or more herd-related changes over the past 10 years.
Animal management related changes
For animal management related changes we consider the following changes:
Stall keeping introduced
Fencing introduced
Cut and carry introduced
126 households (90%) made animal management related changes in the past decade.
Feed related changes
For feed related changes we consider the following:
Growing fodder crops
Improved pastures
Fodder storage
Ninety percent of the surveyed households made feed-related changes in the last 10 years.
However it should be known that no new animals have been introduced in the area and the changes
are purely on breeds. The community is introducing improved breeds and reducing the number of the
herd for cattle as grazing area is being cleared for crops. During the dry season it becomes quite hard
to keep a large herd.
Chicken have increased in number as a result of good prices and a ready market. There have been
massive campaigns on poultry vaccination and diseases–which were a threat to poultry–and these can
presently be contained.
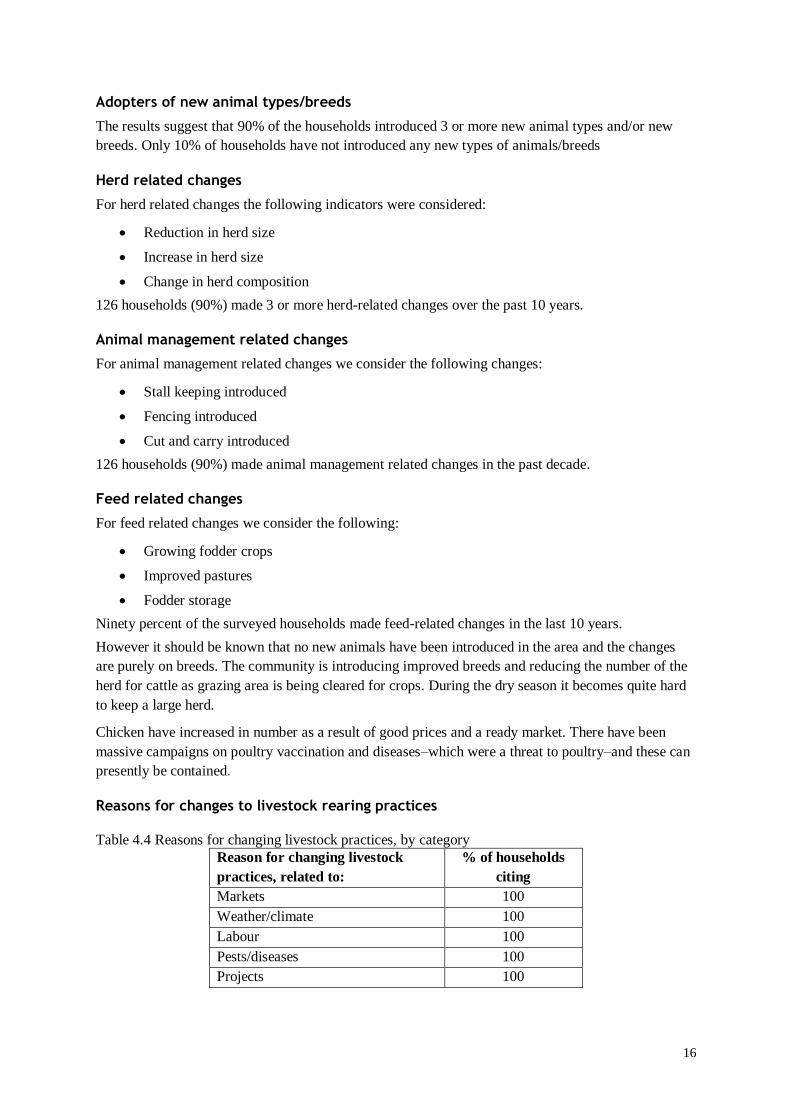
Reasons for changes to livestock rearing practices
Table 4.4 Reasons for changing livestock practices, by category
Reason for changing livestock
practices, related to:
% of households
citing
Markets 100
Weather/climate 100
Labour 100
Pests/diseases 100
Projects 100

17
One hundred percent of the households cited markets, climate, labour, pests/diseases and projects as
the reasons for changes. Labour is a contributing factor to change especially when it comes to goats.
The young children who usually look after them have been absorbed in schools/learning institutions.
The number has then been reduced to remain with a few animals which can be tethered or zero grazed
comfortably.
Land is also a contributing factor to change as the grazing areas have reduced in number and size as
more land is opened for crop production.
4.4 Adaptability/Innovation index
An adaptability/innovation index was defined as the following:
0-1=zero or one change made in farming practices over last 10 years (low level)
1=2-10 changes made in farming practices (intermediate level)
2=11 or more changes made in farming practices (high level)
We see in Table 4.5 that 25% of households made zero or only one change in what and how they farm
over the last 10 years, 20% of households made between 2 and 10 changes, and 55% made 11 or more
changes. Further analysis, particularly of these more adaptive households, is needed to better
understand exactly what adaptations they have made and why.
Table 4.4 Adaptability/Innovation index
Number of changes made in farming
practices in last 10 years:
% of households
citing
Zero or one (low) 25
2-10 changes (intermediate) 20
11 or more changes (high) 55
4.5 Mitigation indices
Several climate mitigation-related behavioural changes were used to create the following indices:
Tree management:
This index shows whether a household has either protected or planted trees within the last year.
Soil amendments:
This index shows if the household has used fertilizer in the last year, or has started using fertilizer or
manure on at least one crop.
Input intensification
There are 7 ‘changes in agricultural practices/behaviour over the last 10 years’ considered here to
create an index with 3 levels - no intensification (none of the following), low intensification (1-3 of
the following), and high intensification (4-7 of the following). They are:
Purchased fertilizer
Started to irrigate
Started using manure/compost
Started using mineral/chemical fertilizers
Started using pesticides/herbicides
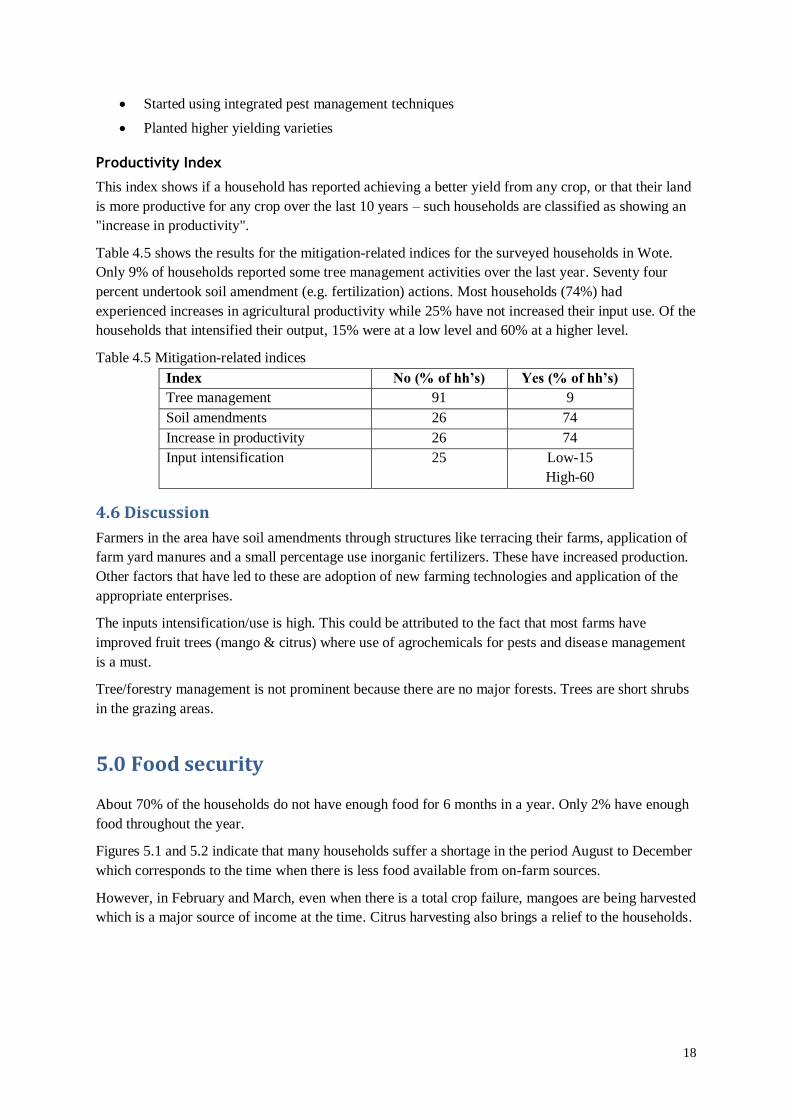
18
Started using integrated pest management techniques
Planted higher yielding varieties
Productivity Index
This index shows if a household has reported achieving a better yield from any crop, or that their land
is more productive for any crop over the last 10 years – such households are classified as showing an
"increase in productivity".
Table 4.5 shows the results for the mitigation-related indices for the surveyed households in Wote.
Only 9% of households reported some tree management activities over the last year. Seventy four
percent undertook soil amendment (e.g. fertilization) actions. Most households (74%) had
experienced increases in agricultural productivity while 25% have not increased their input use. Of the
households that intensified their output, 15% were at a low level and 60% at a higher level.
Table 4.5 Mitigation-related indices
Index No (% of hh’s) Yes (% of hh’s)
Tree management 91 9
Soil amendments 26 74
Increase in productivity 26 74
Input intensification 25 Low-15
High-60
4.6 Discussion
Farmers in the area have soil amendments through structures like terracing their farms, application of
farm yard manures and a small percentage use inorganic fertilizers. These have increased production.
Other factors that have led to these are adoption of new farming technologies and application of the
appropriate enterprises.
The inputs intensification/use is high. This could be attributed to the fact that most farms have
improved fruit trees (mango & citrus) where use of agrochemicals for pests and disease management
is a must.
Tree/forestry management is not prominent because there are no major forests. Trees are short shrubs
in the grazing areas.
5.0 Food security
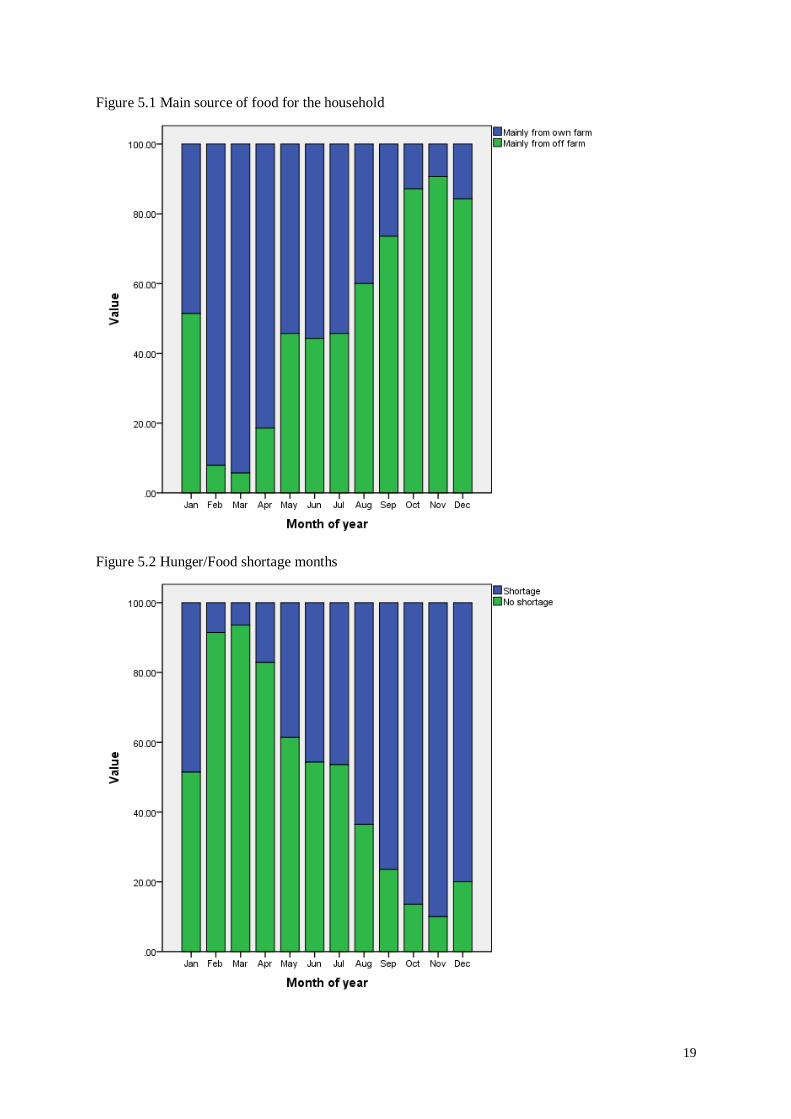
About 70% of the households do not have enough food for 6 months in a year. Only 2% have enough
food throughout the year.
Figures 5.1 and 5.2 indicate that many households suffer a shortage in the period August to December
which corresponds to the time when there is less food available from on-farm sources.
However, in February and March, even when there is a total crop failure, mangoes are being harvested
which is a major source of income at the time. Citrus harvesting also brings a relief to the households.
19
Figure 5.1 Main source of food for the household
Figure 5.2 Hunger/Food shortage months

20
5.1 Food security index
The food security index we created is based upon the number of months that the household has
difficulty getting food from any source (i.e. from their own farm or off-farm, from stores, gifts,
purchases or transfers).
For our surveyed households in Wote, only 2% are ‘food secure’ all year long. Only 1% has enough
food for their families for at least 10 months of the year, and 97% of these households struggle to get
enough food to feed their family for more than 2 months out of a year (Table 5.1).
Table 5.1 Food Security Index
Percent of households reporting:
More than 6
hunger months
5-6 hunger
months
3-4 hunger
months
1-2 hunger
months
Food all year
round/No hungry
period
44 34 19 1 2
5.2 Discussion
In a year, harvesting for the short rains (the most reliable season in the area) starts late December and
peaks in February and March hence the availability of food from own farm. The long rains season is
not reliable and the harvest, if any, starts in June throughout July. From then the stocks in the stores
start being depleted until the month of December when there is harvesting of cowpea leaves
(vegetable) and beans (green) and the cycle continues. This explains the two graphs, i.e. Figures 5.1
and 5.2, which follow a similar pattern.
6.0 Land and Water
6.1 Water for agriculture
Water is very scarce in the area, and only 9% of the households are practising irrigation most of which
is under kitchen garden. Seventeen percent have tanks for water harvesting, 34% have dams or water
ponds, 4% have boreholes/shallow well, and less than 1% have either water pumps (other type) or
inlet/water gate.
Fifty eight percent of the households have none of those mentioned above. These households get
water from communally owned sources namely dams, boreholes and rivers
Table 6.1 Water sources for agriculture on-farm
On-farm water sources % of households
Irrigation 9
Tanks for water harvesting 17
Dams or water ponds 34
Boreholes 4
Water pumps (other type) 1
Inlet/water gate 1
None of the above 58
21
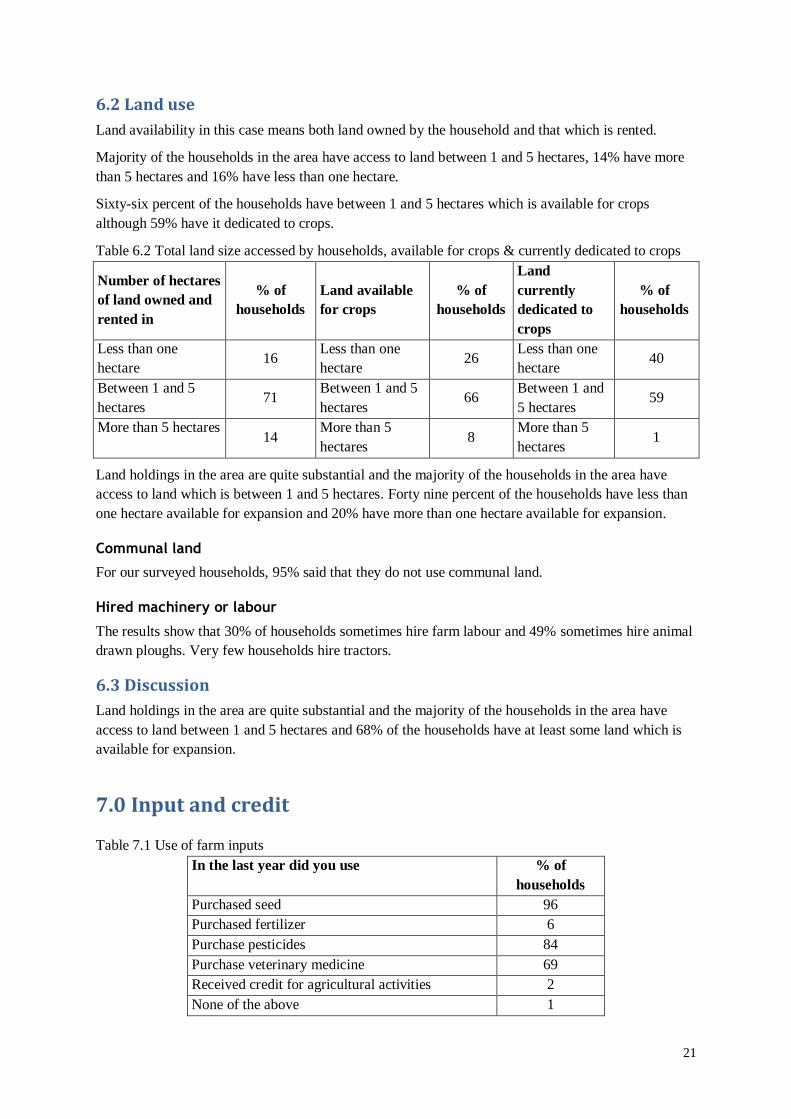
6.2 Land use
Land availability in this case means both land owned by the household and that which is rented.
Majority of the households in the area have access to land between 1 and 5 hectares, 14% have more
than 5 hectares and 16% have less than one hectare.
Sixty-six percent of the households have between 1 and 5 hectares which is available for crops
although 59% have it dedicated to crops.
Table 6.2 Total land size accessed by households, available for crops & currently dedicated to crops
Number of hectares
of land owned and
rented in
% of
households
Land available
for crops
% of
households
Land
currently
dedicated to
crops
% of
households
Less than one
hectare 16
Less than one
hectare 26
Less than one
hectare 40
Between 1 and 5
hectares 71
Between 1 and 5
hectares 66
Between 1 and
5 hectares 59
More than 5 hectares 14
More than 5
hectares 8
More than 5
hectares 1
Land holdings in the area are quite substantial and the majority of the households in the area have
access to land which is between 1 and 5 hectares. Forty nine percent of the households have less than
one hectare available for expansion and 20% have more than one hectare available for expansion.
Communal land
For our surveyed households, 95% said that they do not use communal land.
Hired machinery or labour
The results show that 30% of households sometimes hire farm labour and 49% sometimes hire animal
drawn ploughs. Very few households hire tractors.
6.3 Discussion
Land holdings in the area are quite substantial and the majority of the households in the area have
access to land between 1 and 5 hectares and 68% of the households have at least some land which is
available for expansion.
7.0 Input and credit
Table 7.1 Use of farm inputs
In the last year did you use % of
households
Purchased seed 96
Purchased fertilizer 6
Purchase pesticides 84
Purchase veterinary medicine 69
Received credit for agricultural activities 2
None of the above 1

22
The data in Table 7.1 indicate that 96% of the community used/purchased certified seeds in the last 12
months. However, it should be understood that the certified seed used is usually relief seed distributed
by the government. Only a very small percentage (if any) purchase seed and even when they do it is
small quantities not for every crop. In other cases, farmers buy seeds from other farmers (farmers’
seed) or grains being sold as food and use them as seed especially when there has been progressive
crop failure and the farmers’ seed is unavailable. Without government and other institutions assistance
in certified seed, its use would not be very different from that of fertilizer.
Fertilizer/manure purchase is not common as evidenced by only 6% of the households purchasing. In
the use of pesticides, 84% are said to have used/purchased the same. The use of pesticides in the area
can be attributed to the fact that mango (improved/grafted) and citrus are major crops in the area and
use of pesticides is a must if meaningful yields are to be realised. Use of dust for dressing grains
against weevils and grain borers is a common practise in the area. Also in the last 12 months there
was infestation of bollworm in crops and the government issued pesticides to farmers and these also
could have raised the percentage of households which used the same.
Use of veterinary medicine is common in the area and this is so through periodical government
vaccinations of livestock. Vaccination of chicken is also common especially carried out by private
service providers.
Credit acquisition is not common due to the risks associated with farming because rains are not
reliable. Also the credit facilities do not give a substantial grace period enough to have realised
yields/products.
7.1 Fertilizer use
More than 94% of the households do not use fertilizer.
Table 7.2 Type of fertilizers used
Fertiliser Type % of Households
Urea 13
Nitrogen Phosphorous Potassium (NPK) 13
Di-Ammonium Phosphate (DAP) 38
Calcium Ammonium Nitrate (CAN) 88
As in Table 7.2 above, of the few households (less than 6% of the HHs) who use fertilizer, 88%
usually use CAN for top dressing. At this stage the crop looks promising and the farmers are almost
sure it will be harvested. DAP; NPK and Urea are also used by 38%, 13% and 13% respectively. One
hundred percent of these HHs said the fertilizers are used in maize (the most important crop).
7.2 Discussion
Fertilizer use in the area is not common probably because rain is not reliable and farmers do not risk
investing a lot in rainfed seasonal crops. However, farm yard manure is applied to fruit trees and
irrigated vegetables which are a major source of income in the farms where they are present.
The manure is also used in the farm and mainly applied where maize is planted.
23
8.0 Climate and weather information
8.1 Who is receiving information?
An analysis of which households are receiving any type of climate- or weather-related information
shows that almost all households (97%) are receiving some type of weather or climate-related
information. We next looked at who is receiving what kinds of weather-related information within the
households.
8.2 Types of weather-related information
Next we examine the different types of weather-related information that households are using and
who is receiving it and if is being used (and for what).
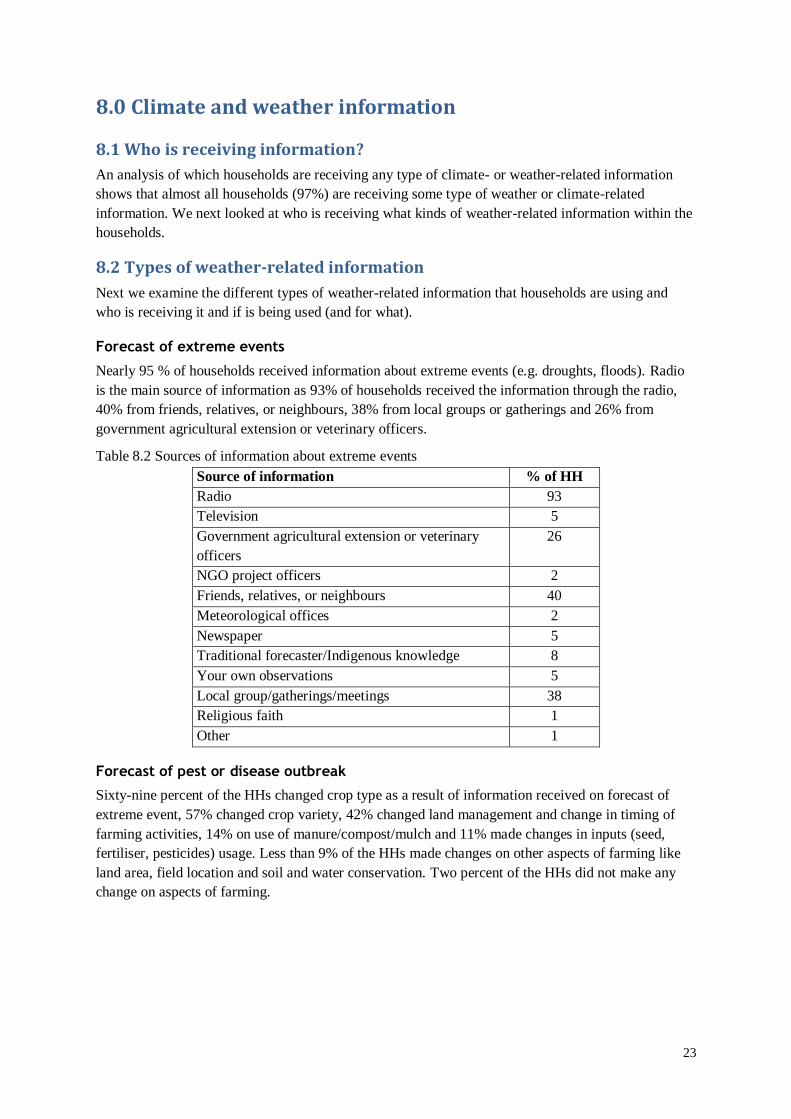
Forecast of extreme events
Nearly 95 % of households received information about extreme events (e.g. droughts, floods). Radio
is the main source of information as 93% of households received the information through the radio,
40% from friends, relatives, or neighbours, 38% from local groups or gatherings and 26% from
government agricultural extension or veterinary officers.
Table 8.2 Sources of information about extreme events
Source of information % of HH
Radio 93
Television 5
Government agricultural extension or veterinary
officers
26
NGO project officers 2
Friends, relatives, or neighbours 40
Meteorological offices 2
Newspaper 5
Traditional forecaster/Indigenous knowledge 8
Your own observations 5
Local group/gatherings/meetings 38
Religious faith 1
Other 1
Forecast of pest or disease outbreak
Sixty-nine percent of the HHs changed crop type as a result of information received on forecast of
extreme event, 57% changed crop variety, 42% changed land management and change in timing of
farming activities, 14% on use of manure/compost/mulch and 11% made changes in inputs (seed,
fertiliser, pesticides) usage. Less than 9% of the HHs made changes on other aspects of farming like
land area, field location and soil and water conservation. Two percent of the HHs did not make any
change on aspects of farming.

24
Table 8.3 Actions taken upon receipt of pest/disease outbreak forecasts
Aspects of farming changed % of HH
None 2
Land management 42
Crop type 69
Crop variety 57
Change in inputs (seed, fertiliser, pesticides) 11
Use of manure/compost/mulch 14
Land area 2
Field location 4
Change in timing farming activities 42
Soil and water conservation 8
Irrigation 1
Water management 1
Tree planting 7
Livestock type 1
Feed management 7
Forecast of the start of the rains
This information in most cases includes the onset and distribution in both time and space and
cessation time.
More than 97% of the households have received information on forecast of the start of the rains.
Radio is the main source of information as 90% of households received the information through the
radio, 42% through friends, relatives, or neighbours, 30% through local group/gatherings/meetings,
21% government agricultural extension or veterinary officers and 15% through their own observation.
Other sources could be considered as minor as less than 5% of the HHs received information through
them. Forecast of the start of the rains is important to farmers as it influences land preparation and
planting time. It also influences/determines the crop varieties and or crops that a household cultivates.
Table 8.4 Sources of information on the predicted timing of the start of the rains
Source of information % of HH
Radio 90
Television 2
Government agricultural extension or veterinary officers 21
NGO project officers 4
Friends, relatives, or neighbours 42
Meteorological offices 2
Newspaper 5
Traditional forecaster/Indigenous knowledge 18
Your own observations 15
Local group/gatherings/meetings 30
Religious faith 1
Other 1
Weather forecast for the next 2-3 months
Forty-nine percent of the HHs changed crop type as a result of information received on forecast of
weather for next 2-3 months, 24% changed crop variety, 27% changed land management, 41%
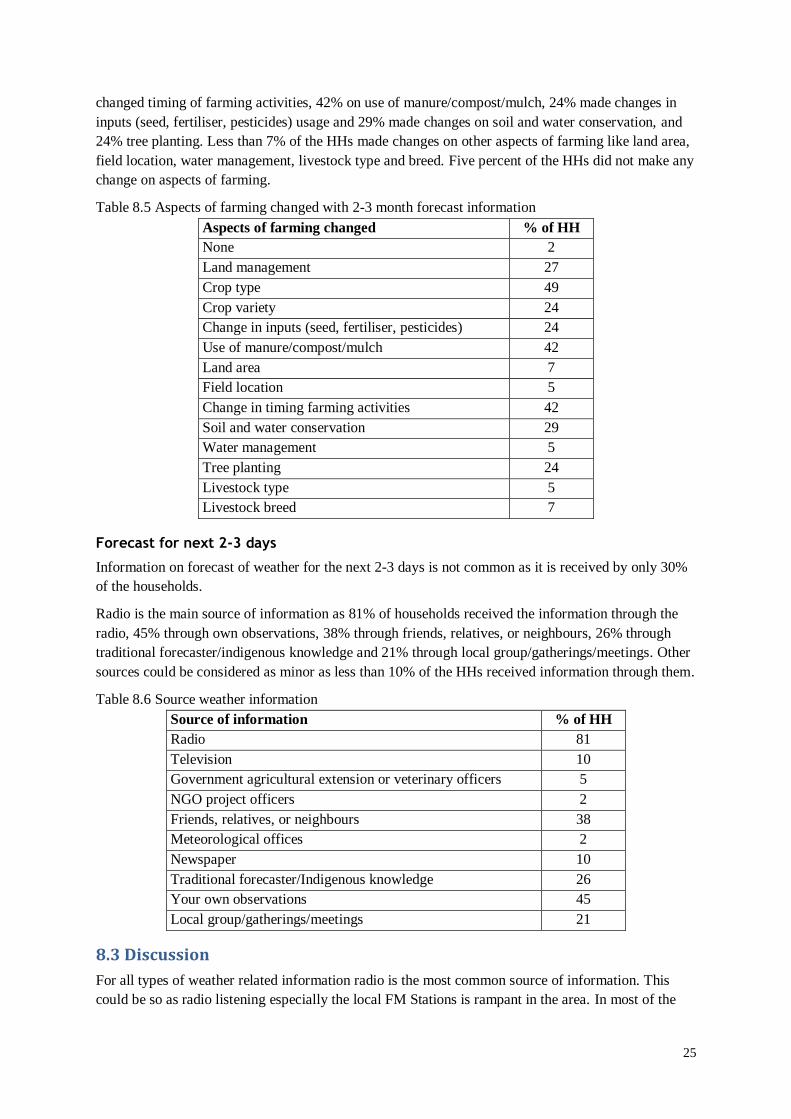
25
changed timing of farming activities, 42% on use of manure/compost/mulch, 24% made changes in
inputs (seed, fertiliser, pesticides) usage and 29% made changes on soil and water conservation, and
24% tree planting. Less than 7% of the HHs made changes on other aspects of farming like land area,
field location, water management, livestock type and breed. Five percent of the HHs did not make any
change on aspects of farming.
Table 8.5 Aspects of farming changed with 2-3 month forecast information
Aspects of farming changed % of HH
None 2
Land management 27
Crop type 49
Crop variety 24
Change in inputs (seed, fertiliser, pesticides) 24
Use of manure/compost/mulch 42
Land area 7
Field location 5
Change in timing farming activities 42
Soil and water conservation 29
Water management 5
Tree planting 24
Livestock type 5
Livestock breed 7
Forecast for next 2-3 days
Information on forecast of weather for the next 2-3 days is not common as it is received by only 30%
of the households.
Radio is the main source of information as 81% of households received the information through the
radio, 45% through own observations, 38% through friends, relatives, or neighbours, 26% through
traditional forecaster/indigenous knowledge and 21% through local group/gatherings/meetings. Other
sources could be considered as minor as less than 10% of the HHs received information through them.
Table 8.6 Source weather information
Source of information % of HH
Radio 81
Television 10
Government agricultural extension or veterinary officers 5
NGO project officers 2
Friends, relatives, or neighbours 38
Meteorological offices 2
Newspaper 10
Traditional forecaster/Indigenous knowledge 26
Your own observations 45
Local group/gatherings/meetings 21
8.3 Discussion
For all types of weather related information radio is the most common source of information. This
could be so as radio listening especially the local FM Stations is rampant in the area. In most of the
26
cases women tend to receive more weather related information than men, which may reflect their day
to day involvement in the farm as compared to men. With the exception of the short term weather
information, the rest of the information received included some advice on what to do in such cases.
The most changed aspects of farming upon receipt of all the information were crop type, crop variety,
land management and change in timing of farming activities.
The least changed aspects of farming upon receipt of relevant information were land area, field
allocation, water management, livestock type and livestock breed.
9.0 Community groups
Group membership is common with at least 88% of the households with a member who is a member
of a group(s). Only 11% of the households are not in any group.
Most of the government and NGO activities target groups, and farmers have joined/formed groups to
benefit from such services.
Also farmers are in groups so that they can assist one another especially the merry go round groups.
Most of the household members in groups are women. Table banking is popular in this group and that
is where the credit/loans are accessed from.
Seventy-seven percent of HHs are in a savings or credit group, 20% in tree nursery/planting group and
20% in productivity enhancement group.
Table 9.1 Group membership
Does someone in your household belong to the following groups % of HH
Tree nursery/planting group 20
Water catchment management group 3
Soil improvement activities group 2
Crop introduction/substitution group 6
Irrigation group 6
Savings or credit group 77
Agricultural product marketing group 2
Productivity enhancement group 20
Vegetables production group 2
Not a member of any group 11
9.1 Climate related crises
We looked at whether households have faced a climate related crisis in the last 5 years and whether or
not they received help to deal with the impacts of such a crisis. For those who received help we
inquired as to the source of this help.
More than 99% of the households confirmed having faced a climate related crisis in the last 5 years
and 91% said they had received assistance to combat the crisis or its effects. Ninety-eight percent of
the households who received assistance got it from government agencies, 85% from NGOs and 41%
from friends and other minor sources as per Table 9.2 below. Eighty percent of households surveyed
got assistance from savings and credit groups, 20% from tree nursery groups and 20% from water
catchments management as per Table 9.3 below.

27
Table 9.2 Sources of assistance for climate related crises
From where did you receive assistance? % of households
Got help from friends 41
Received help from government agencies 98
Receive help from politicians 2
Received help from NGOs 85
Received help from church organizations 4
Received help from a group that you are a member of 4
Table 9.3 Types of groups that give help for climate related crises
From which group did you receive assistance? % of households
Tree nursery 20
Water catchment management 20
Savings and credit 80
The area falls in the arid and semi-arid lands (ASALs) of Kenya and weather related crises are very
common. For this reason the government and NGOs usually assist the community in such times
through several programmes. Some of the assistances are water trucking, fuel subsidy for water
pumps, relief seeds, relief food, food for assets, livestock off-take, relief feeds, cash for food and other
aids.
10.0 Assets
10.1 Asset indicator
Households were asked about what assets they owned, from a set list. The assets they were asked
about include the following:
Energy: generator (electric or diesel), solar panel, biogas digester, battery (large, e.g. car battery for
power);
Information: radio, television, cell phone, internet access, computer;
Production means: tractor, mechanical plough, thresher, and mill;
Transport: bicycle, motorbike, car or truck;
Luxury items: refrigerator, air conditioning, fan, bank account, improved stove.
The total number of assets in all categories was added up and the following asset indicator created:
0= No assets (basic level)
1=1-3 assets (intermediate level)
2=4 or more assets (high level)
28
Table 10.1 Asset index
Number of queried assets % of Households
No assets (Basic Level) 9
1-3 assets (Intermediate Level) 47
4 or more assets (High Level) 44
Ninety-one percent of the households surveyed have at least one asset. However the most owned
assets are the radio and the cell phone as seen in Table 10.2 below. It is also evident in the table that
most of the households have improved housing that includes improved roofing. This should not be
used as an indicator for wealth because construction materials are locally available hence relatively
cheap and accessible. For the improved roofing, grass (which is a cheap material) is not available in
the area and the community has to struggle to purchase iron sheets.
Only 2% of the surveyed households have electricity and 9% have running water in their homes. In
relation to food security, only 49% have improved storage facilities for crops. Over two-thirds have
separate housing for their livestock.
Table 10.2 Asset ownership
Assets/utilities % of
households
Radio 80
Cell phone 80
Bank account 21
Bicycle 64
Motorcycle 7
Car 4
Solar panel 11
Mechanical plough 32
Battery 11
Liquefied petroleum gas 6
Improved storage facility for crops (food and feed) 49
Improved housing (e.g. concrete, bricks, etc.) 72
Improved roofing (e.g. tin, tiles, etc.) 75
Improved storage tank (for household water, > 500 litres) 19
Well/borehole (for household water) 4
Electricity from a grid 2
Running/tap water in the dwelling 9
Separate housing for farm animals 67
Improved stove 16
Wheelbarrow 47
Ox cart 19
10.2 Discussion
More than 87% of the households do not have assets related to energy, 60% have no assets for
production means, 35% have no assets providing transport and 73% have no luxury items. Eighty
percent have assets for information and 54% have assets providing transport which is mostly bicycles.
29
Information assets are cell phones and radio which are common in the area as the main source of
communication. The cell phone has become popular as it is also a means of money transfer.
Bicycles have been the main source of transport to the interior although they are being replaced by the
motorcycles popularly referred to as boda boda.

30
Appendix 1: Survey Process and Implementation
The survey team was led by Muoti Mwangangi of the Ministry of Agriculture based in Makueni
district, Makueni County. The team was comprised of three experienced enumerators, Rosemary
Kyalo, Justus Ngesu and Benson Mutua. We all took part in a 5-day training that included a field test
of the questionnaire at the end of April 2012. The questionnaire was translated from English into
Kamba and then back translated. In the field, we worked closely with the respective village elders and
chiefs/sub-chiefs to identify the survey respondents, following the sampling frame as per the training
we had undergone. As the supervisor I went through each questionnaire upon completion to check for
errors, which were corrected immediately while still in the village.
Before the questionnaire was administered, a sensitization meeting was convened within each sub-
location will all village elders and the assistant chiefs. The survey’s objectives of better understanding
households’ farming practices, how they have changed and why particular practices have changed
were discussed at this time. A list of all the villages identified to be within the 10KM x10KM block
was drawn.
A total of 53 villages was identified and subjected to randomization where 7 villages for the survey
were selected. A further list was made for all the households within each village. It was at this stage
when we realised that in one of the 7 villages all the households were falling within a shopping centre
where the traders came during the day and went back (to other villages) in the evening. Since it was
not possible to get the required information from such a village, it was discarded and another village
randomly chosen. The households per village were then randomized and a total of 20 HHs per village
chosen giving a total of 140 HHs for the survey. However, during the actual survey one household
declined to be interviewed, absented herself for three days and later she advised the village elder to
select another household. Another household was randomly selected from the village and the exercise
continued smoothly.
The village authorities then informed community members as to the procedures and forthcoming
household visits by the team, so as to avoid suspicion or conflict as to the household listing procedure
and enhance cooperation with the team.
The community was very receptive and cooperative and there were no major challenges encountered.
Household Structured Interviews
The activity was carried out from 16th April to 11
th May 2012. Data entry started one week later and
continued four weeks after which the data was cleaned. First cleaning was done with the use of CS-
Pro software and a second cleaning using SPSS.

31
Appendix 2: Sampling Frame – List of Villages
Kiliani
Sinai
Makutano
Kikeneani
Kitandamboo
Kiumoni
Kituneni
Kwa mboo
Kilaani
Kyemole (Shopping centre Kiumoni Sub
Location)
Noman
Kiuani
Kasambani
Yumbuni
Matithini
Muusini
Matulani
Harambee
Kiatineni
Ndivuni
Itulani
Kiluluini
Manyanzaani
Sikia
Itunguni
Corner Baridi
Kiusini
Lower west
Upper West A
Upper West B
Mwinga
Kampi Mawe
Kithoni
Kivani
Kyemole (Kambi Mawe Sub Location)
Muambani (Kambi Mawe Sub location)
Kwa Kathoka
Mulaani
Iviani
Nguumo
Senda
Nthembe
Muvau
Ngunu
Soweto
Kathoka
Kasalani
Nzaai
Kaseve
Ndukuma
Nyunzu (Mubau Sub Location)
Muambani (Kamunyolo Sub Location)
Nyunzu (Unoa Sub Location)
List of sampled villages
Kikeneani
Sinai
Itunguni
Corner Baridi
Soweto
Kithoni
Kwa Mboo


![Welcome to the 7th edition of the...7th Annual CHALE WOTE Street Art Festival Day of ReMembering: Opening CHALE WOTE 2017 Ceremony ACCRA [dot] ALT Brazil House, James Town 5 – 7pm](https://cdn.vdocument.in/doc/165x107/5fd04e3a83bb3b799a56e6aa/welcome-to-the-7th-edition-of-the-7th-annual-chale-wote-street-art-festival.jpg)

