Download - Ch17-Ppt-Financial Planning and Control

1
Financial Planning and Control
© 2007 Thomson/South-Western

3
Financial Planning and Control
Financial Planning:The projection of sales, income, and
assets based on alternative production and marketing strategies, as well as the determination of the resources needed to achieve these projections

4
Financial Planning and Control
Financial ControlThe phase in which financial plans
are implemented, control deals with the feedback and adjustment process required to ensure adherence to plans and modification of plans because of unforeseen changes.

5
Financial Planning: The Sales Forecast
A forecast of a firm’s unit and dollar sales for some future period, generally based on recent sales trends plus forecasts of the economic prospects for the nation, region, industry, etc.

6
$0
$500
$1,000
$1,500
2005 2006 2007 2008 2009 2010
Unilate Textiles: 2010 Sales Projection

7
Projected (Pro Forma)Financial Statements
A method of forecasting financial requirements based on forecasted financial statements
AFN = additional funds needed to support the level of forecasted operations

8
Projected Financial Statements
Determine how much money the firm will need in a given period.
Determine how much money the firm will generate internally during the same period.
Subtract the funds generated internally from the funds required to determine the external financial requirements.

9
Step 1. Forecast the 2010 Income Statement: Unilate Textiles
Assumptions:
Unilate operated at full capacity in 2009.
Sales are expected to grow by 10 percent.
The variable cost ratio remains at 82 percent (same as 2009).
2010 dividend per share will be the same as in 2009.

10
Unilate Textiles2009 2010 Initial
Results Forecast Basis ForecastNet Sales 1,500.0$ x 1.10 1,650.0$ Cost of Goods Sold (1,230.0) x 1.10 (1,353.0)
Gross Profit 270.0 297.0 Fixed operating Costs (90.0) x 1.10 (99.0) Depreciation (50.0) x 1.10 (55.0)
EBIT 130.0 143.0 Less Interest (40.0) (40.0)
EBT 90.0 103.0 Taxes (40%) (36.0) (41.2)
Net Income 54.0$ 61.8$ Common Dividends (29.0) (29.0)
Addition to Retained Earnings 25.0$ 32.8$
Earnings per Share 2.16$ 2.47$ Dividends per Share 1.16$ 1.16$ Number Common Shares (millions) 25.0 25.0
Step 1. Forecast the 2010 Income Statement

11
20102009 Forecast Initial
Balances Basis ForecastCash 15.0$ x 1.10 16.5$ Accounts Receivable 180.0 x 1.10 198.0 Inventory 270.0 x 1.10 297.0
Total Current Assets 465.5 511.5 Net Plant & Equipment 380.0 x 1.10 418.0
Total Assets 845.0$ 929.5$
Accounts Payable 30.0 x 1.10 33.0 Accruals 60.0 x 1.10 66.0 Notes Payable 40.0 40.0
Total Current Liabilities 130.0 139.0 Long-Term Bonds 300.0 300.0
Total Liabilities 430.0$ 439.0$ Common Stock 130.0 130.0 Retained Earnings 285.0 +$32.8 317.8
Owner's Equity 415.0$ 447.8$ Total Liabilites & Equity 845.0$ 886.8$
Additional Funds Needed 42.7$
Step 2. Forecast the 2010 Balance Sheet
Unilate Textiles

12
Step 3. Raising the Additional Funds Needed
Higher sales must be supported by higher assets.
Asset increase can be financed by spontaneous increases in accounts payable and accruals and by retained earnings.
Any short fall must be financed from external sources--by borrowing or by selling new stock.

13
The effects on the income statement and balance sheet of actions taken to finance forecasted increases in assets
Step 4. Financing Feedbacks

14
Unilate TextilesInitial Adjusted Financing
Forecast Forecast AdjustmentCash 16.5$ 16.5$ Accounts Receivable 198.0 198.0 Inventory 297.0 297.0
Total Current Assets 511.5 511.5 Net Plant & Equipment 418.0 418.0
Total Assets 929.5$ 929.5$ Accounts Payable 33.0$ 33.0$
Accruals 66.0 66.0 Notes Payable 40.0 46.8 6.8$
Total Current Liabilities 139.0 145.8 Long-Term Bonds 300.0 309.0 9.0
Total Liabilities 439.0 454.8 Common Stock 130.0 159.3 29.3 Retained Earnings 317.8 315.5 (2.3)
Owner's Equity 447.8 474.8
Total Liabilites & Equity 886.8$ 929.5$ Additional Funds Needed 42.7 - 42.8$
2010 Adjusted Forecast of Balance Sheet

15
Initial Adjusted FinancingForecast Forecast Adjustment
Net Sales 1,650.0$ 1,650.0$ Cost of Goods Sold (1,353.0) (1,353.0) Gross Profit 297.0 297.0
Fixed operating Costs 99.0 99.0 Depreciation (55.0) (55.0)
EBIT 143.0 143.0 Less Interest (40.0) (41.4) (1.4)$
EBT 103.0 101.6 (1.4) Taxes (40%) (41.2) (40.6) 0.6
Net Income 61.8$ 61.0$ (0.8) Common Dividends (29.0) (30.5) (1.5)
Addition to Retained Earnings 32.8$ 30.5$ (2.3)$ Earnings per Share 2.47$ 2.32$ Dividends per Share 1.16$ 1.16$ Number Common Shares 25.0 26.3
Unilate Textiles
2010 Adjusted Forecast of Income Statement
16
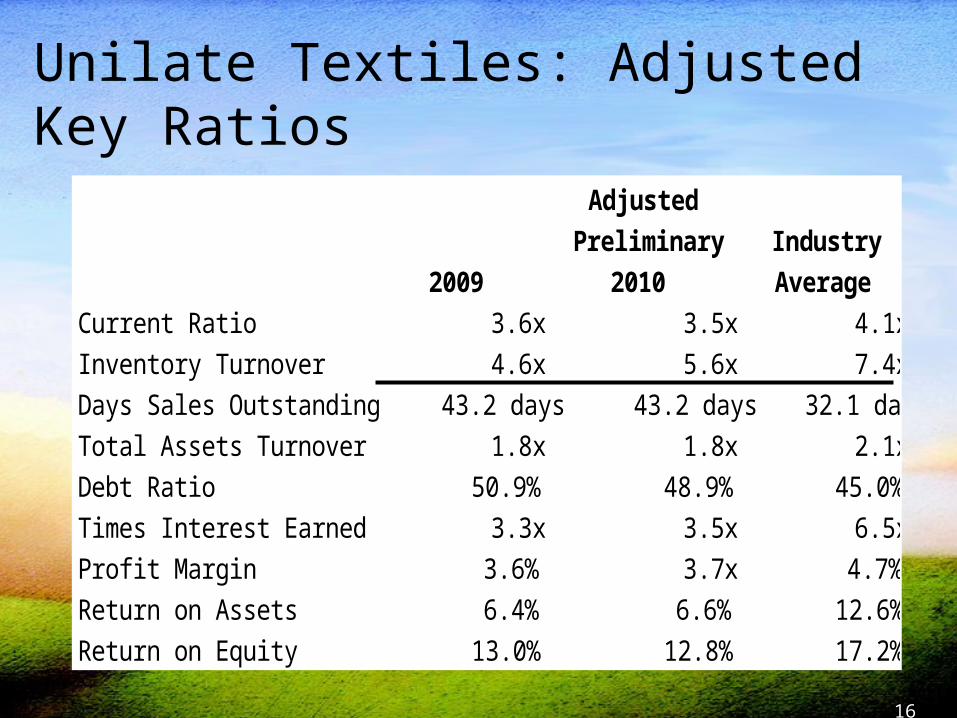
Adjusted
Preliminary Industry
2009 2010 Average
Current Ratio 3.6x 3.5x 4.1x
Inventory Turnover 4.6x 5.6x 7.4x
Days Sales Outstanding 43.2 days 43.2 days 32.1 days
Total Assets Turnover 1.8x 1.8x 2.1x
Debt Ratio 50.9% 48.9% 45.0%
Times Interest Earned 3.3x 3.5x 6.5x
Profit Margin 3.6% 3.7x 4.7%
Return on Assets 6.4% 6.6% 12.6%
Return on Equity 13.0% 12.8% 17.2%
Unilate Textiles: Adjusted Key Ratios

17
Full Capacity SalesActual sal
es
% of capacity
= =$1,
.$1, million.
5000 80
875
Other Considerations in Forecasting: Excess Capacity
Suppose in 2009 fixed assets had been operated at only 80% of capacity:

18
Changes in variable cost ratio affect the addition to retained earnings which affects the amount of AFN.
Other Considerations in Forecasting: Economies of Scale
Unilate’s variable cost ratio is 82% of sales.
Ratio might decrease to 80% if operations increase significantly.
19
Other Considerations in Forecasting: Lumpy Assets
Assets that cannot be acquired in small increments, but must be obtained in large, discrete amounts

20
How different factors affect the AFN forecast.
Dividend payout ratio changes. If reduced, more RE, reduce AFN.
Profit margin changes. If increases, total and retained earnings increase, reduce
AFN.
Plant capacity changes.Less capacity used, less need for AFN.
Payment terms increased to 60 days.Accounts payable would double, increasing liabilities,
reduce AFN.

21
Financial Control - Budgeting and Leverage
The phase in which financial plans are implemented; control deals with the feedback and adjustment processes required to ensure the firm is following the right financial path to accomplish its goals, and, if not, to make necessary corrections.

22
Operating Breakeven Analysis
An analytical technique for studying the relationship between sales revenues, operating costs, and profits
Operating breakeven analysis deals only with the upper portion of the income statement - the portion from sales to NOI

23
Unilate’s 2010 Forecasted Operating Income
Sales (S)--(110 million units) 1,650.00$ Variable cost of goods sold (VC) (1,353.00) Gross profit (GP) 297.00 Fixed operating costs (F) (154.00) Net operating income (NOI = EBIT) 143.00$

24
0 20 40 57 60 80 100 120
1,400
1,200
1,000
600
400
0
Units QOpBE
Revenues & Costs
Total Fixed Costs (F)
Total OperatingCosts (F + Q x V)
Total Sales Revenues (P x Q)
SOpBE =
200154
856800
Operating BreakevenPoint (EBIT = 0)
Operating Profit(EBIT > 0)
Operating Loss
(EBIT < 0)
Operating Breakeven Chart

25
Breakeven Computation Sales Total operating Total Totalrevenues costs variable costs fixed costs
= = +
(P x Q) = TOC = (V x Q) + F
QOpBE F
P-V
FContribution margin= =
QOpBE $154.0 million$15.00 - $12.30
= =$154.0 million
$2.70
57.04 million units 57.0 million units
=

26
Operating Breakeven Point
For the proposal to break even, Unilate must sell 57 million units or $855,600,000 of product.
SOpBE
F FGross profit margin= =
1- VP( )
SOpBE $154.0 $12.30$15.00
= = $154.0 1 - 0.82
1-
= $154.0 0.18( )
= 855.6 million

27
Operating Leverage
The existence of fixed operating costs, such that a change in sales will produce a larger change in operating income (EBIT)
28
Degree of Operating Leverage
The percentage change in NOI (or EBIT) associated with a given percentage change in sales

29
Each 1 percent change in sales, will result in a 2.08 percent change in operating income.
DOLS =Gross Profit
EBIT$297$143 2.08x= =
Calculating the Degree of Operating Leverage

30
2010Forcasted Sales Unit PercentOperations Decrease Change Change
Sales in units 110 99 (11) -10.0%Sales revenues 1,650.0$ 1,485.0$ (165.0)$ -10.0%Variable cost of goods sold (1,353.0) (1,217.7) 135.3 -10.0%
Gross profit 297.0 267.3 (29.7) -10.0%Fixed operating costs (154.0) (154.0) - 0.0%
Net operating income (EBIT) 143.0$ 113.3$ (29.7)$ -20.8%
Operating Income at Sales Levels of 110 and 99 Million Units

31
Financial Breakeven Analysis
Determining the operating income (EBIT) the firm needs to just cover all of its fixed financing costs and produce earnings per share equal to zero

32
EPS = Earnings available to common stockholders
Number of common shares outstanding = 0
= (EBIT - I)(1 - T) - Dps
Shrsc= 0
EBITFinBE = I +(1 - T)
Dps
Financial Breakeven Computation
= $41.4 + 0 = $41.4

33
Financial Leverage
The existence of fixed financial costs such as interest and preferred dividends when a change in EBIT results in a larger change in EPS

34
DFLEBIT
EBIT I= - =EBIT
EBIT [financial BEP]-
DFL110
$143.0$143.0 - $41.4
= =$143.0$101.6 = 1.41x
Unilate Textiles:Degree of Financial Leverage

35
DTLGross profit
- [Financial BEP]=EBIT
S - VC- IEBIT
Q(P - V) [Q (P - V) - F] - I
= =
$297.0$101.6
2.92x= =
= DOL x DFL = 2.08 x 1.41 = 2.92x
Degree of Total Leverage

36
Importance of Forecasting and Control Functions
If projected operating results are not satisfactory, management can reformulate its plans.
If funds required to meet sales forecast cannot be obtained, management can sale back projected levels of operations.
If required funds can be raised, it is best to plan for their acquisition in advance.
Any deviation from projections needs to be handled to improve future forecasts.

Example 4-13 Page 173SUE WILSON IS THE NEW FINANCIAL MANAGER OF NORTHWEST CHEMICALS (NWC), AN OREGON PRODUCER OF SPECIALIZED CHEMICALS SOLD TO FARMERS FOR USE IN FRUIT ORCHARDS. SHE IS RESPONSIBLE FOR CONSTRUCTING FINANCIAL FORECASTS AND FOR EVALUATING THE FINANCIAL FEASIBILITY OF NEW PRODUCTS.
PART I. FINANCIAL FORECASTING
SUE MUST PREPARE A FINANCIAL FORECAST FOR 2010 FOR NORTHWEST. NWC’S 2009 SALES WERE $2 BILLION, AND THE MARKETING DEPARTMENT IS FORECASTING A 25 PERCENT INCREASE FOR 2010. SUE THINKS THE COMPANY WAS OPERATING AT FULL CAPACITY IN 2009, BUT SHE IS NOT SURE ABOUT THIS. THE 2009 FINANCIAL STATEMENTS, PLUS SOME OTHER DATA, ARE GIVEN IN TABLE IP 4-1.
39

Example Continue Page 2
TABLE IP4-1. FINANCIAL STATEMENTS AND OTHER DATA ON NWC ($ MILLIONS)
A. 2000 BALANCE SHEET CASH & SECURITIES $ 20 ACCOUNTS PAYABLE AND ACCRUALS $ 100ACCOUNTS RECEIVABLE 240 NOTES PAYABLE 100INVENTORIES 240 TOTAL CURRENT LIABILITIES $ 200TOTAL CURRENT ASSETS $ 500 LONG-TERM DEBT 100 COMMON STOCK 500NET FIXED ASSETS 500 RETAINED EARNINGS 200 TOTAL ASSETS $1,000 TOTAL LIABILITIES AND EQUITY $1,000 B. 2000 INCOME STATEMENT SALES $2,000.00LESS: VARIABLE COSTS (1,200.00) FIXED COSTS ( 700.00)EARNINGS BEFORE INTEREST AND TAXES $ 100.00INTEREST ( 16.00)EARNINGS BEFORE TAXES $ 84.00TAXES (40%) ( 33.60)NET INCOME $ 50.40 DIVIDENDS (30%) $ 15.12ADDITION TO RETAINED EARNINGS $ 35.28

Example 4-13 Page 173C. 2009 KEY RATIOS NWC INDUSTRYPROFIT MARGIN 2.52% 4.00% RETURN ON EQUITY 7.20% 15.60% DAYS SALES OUTSTANDING (360 DAYS) 43.20 DAYS 32.00 DAYSINVENTORY TURNOVER 5.00x 8.00xFIXED ASSETS TURNOVER 4.00x 5.00xTOTAL ASSETS TURNOVER 2.00x 2.50xTOTAL DEBT RATIO 30.00% 36.00%TIMES INTEREST EARNED 6.25x 9.40xCURRENT RATIO 2.50x 3.00xPAYOUT RATIO 30.00% 30.00%ASSUME THAT YOU WERE RECENTLY HIRED AS SUE’S ASSISTANT, AND YOUR FIRST MAJOR TASK IS TO HELP HER DEVELOP THE FORECAST. SHE ASKED YOU TO BEGIN BY ANSWERING THE FOLLOWING SET OF QUESTIONS:

Example 4-13 Page 173A. ASSUME THAT NWC WAS OPERATING AT FULL CAPACITY IN 2009 WITH RESPECT TO ALL ASSETS. ESTIMATE THE 2010 FINANCIAL REQUIREMENT USING THE PROJECTED FINANCIAL STATEMENT APPROACH, MAKING AN INITIAL FORECAST PLUS ONE ADDITIONAL “PASS” TO DETERMINE THE EFFECTS OF “FINANCING FEEDBACKS.” ASSUME THAT (1) EACH TYPE OF ASSET AS WELL AS PAYABLES, ACCRUALS, AND FIXED AND VARIABLE COSTS GROW AT THE SAME RATE AS SALES; (2) THE PAYOUT RATIO IS HELD CONSTANT AT 30 PERCENT; (3) EXTERNAL FUNDS NEEDED ARE FINANCED 50 PERCENT BY NOTES PAYABLE AND 50 PERCENT BY LONG-TERM DEBT (NO NEW COMMON STOCK WILL BE ISSUED); AND (4) ALL DEBT CARRIES AN INTEREST RATE OF 8 PERCENT.
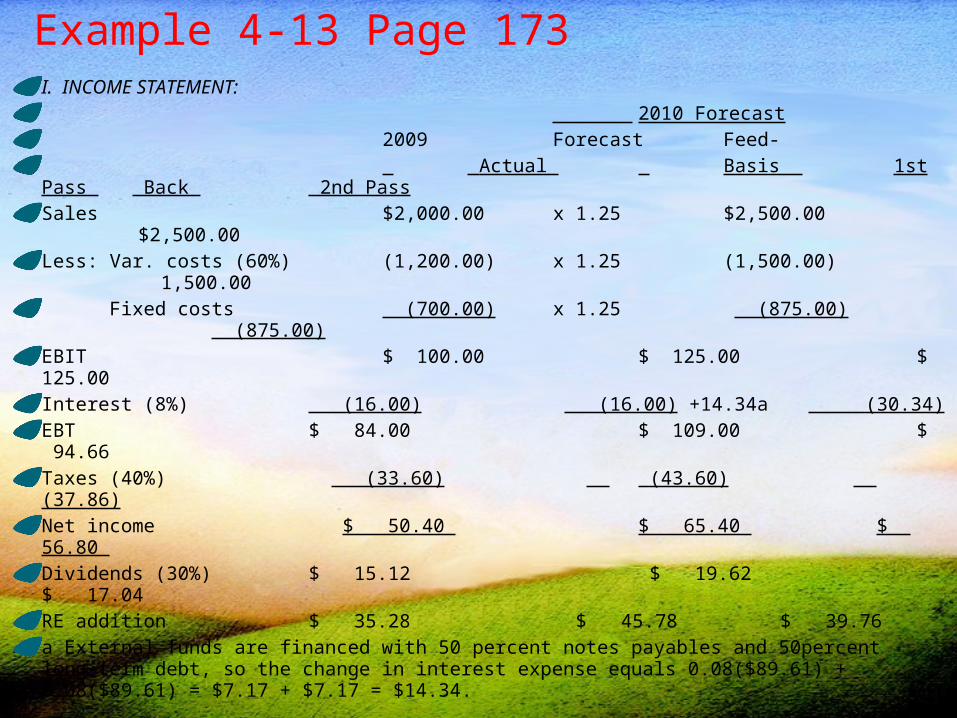
Example 4-13 Page 173I. INCOME STATEMENT: 2010 Forecast 2009 Forecast Feed- Actual Basis 1st Pass Back 2nd PassSales $2,000.00 x 1.25 $2,500.00 $2,500.00Less: Var. costs (60%) (1,200.00) x 1.25 (1,500.00) 1,500.00 Fixed costs (700.00) x 1.25 (875.00) (875.00) EBIT $ 100.00 $ 125.00 $ 125.00Interest (8%) (16.00) (16.00) +14.34a (30.34)EBT $ 84.00 $ 109.00 $ 94.66Taxes (40%) (33.60) (43.60) (37.86)Net income $ 50.40 $ 65.40 $ 56.80 Dividends (30%) $ 15.12 $ 19.62 $ 17.04RE addition $ 35.28 $ 45.78 $ 39.76a External funds are financed with 50 percent notes payables and 50percent long-term debt, so the change in interest expense equals 0.08($89.61) + 0.08($89.61) = $7.17 + $7.17 = $14.34.

Example 4-13 Page 173II. BALANCE SHEET:
2010 Forecast 2009 Forecast Feed- Actual Basis 1st Pass Back 2nd PassCash & securities $ 20.00 x 1.25 $ 25.00 $ 25.00Accounts receivable 240.00 x 1.25 300.00 300.00Inventories 240.00 x 1.25 300.00 300.00 Tot. current assets $ 500.00 $ 625.00 $ 625.00Net fixed assets 500.00 x 1.25 625.00 625.00 Total assets $1,000.00 $1,250.00 $1,250.00A/P and accruals $ 100.00 x 1.25 $ 125.00 $ 125.00Notes payable 100.00 100.00 +89.61a 189.61 Total current liab. $ 200.00 225.00 $ 314.61Long-term debt 100.00 100.00 +89.61b 189.61Common stock 500.00 500.00 500.00Retained earnings 200.00 +45.78 245.78 -6.02c 239.76 Total liab & equity $1,000.00 $1,070.78 $1,243.98 AFN $ 179.22 $ 6.02 Cumulative AFN $ 185.24aΔ in notes payable = $179.22(0.5) = $89.61.bΔ in long-term debt = $179.22(0.5) = $89.61.cΔ in RE = $39.76 - $45.78 = -$6.02. Process would continue until AFN = $0.

Example 4-13 Page 173B. CALCULATE NWC’S FORECASTED RATIOS, AND COMPARE THEM WITH THE COMPANY’S 2009 RATIOS AND WITH THE INDUSTRY AVERAGES. HOW DOES NWC COMPARE WITH THE AVERAGE FIRM IN ITS INDUSTRY, AND IS THE COMPANY EXPECTED TO IMPROVE DURING THE COMING YEAR
Key ratios NWC 2009 2010 Industry Actual 2nd pass 2009 Profit margin 2.52% 2.27% 4.00% ROE 7.20% 7.68% 15.60% Days sales outstanding (DSO) 43.20 days 43.20 days 32.00 days Inventory turnover 5.00x 5.00x 8.00x Fixed assets turnover 4.00x 4.00x 5.00x Total assets turnover 2.00x 2.00x 2.50x Debt/assets 30.00% 40.34% 36.00% Times interest earned 6.25x 4.12x 9.40x Current ratio 2.50x 1.99x 3.00x Payout ratio 30.00% 30.00% 30.00%NWC’s profit margin and ROE are only about half as high as the industry average—NWC is not very profitable relative to other firms in its industry. Further, its DSO is too high, and its inventory turnover ratio is too low, which indicates that the company is carrying excess inventory and receivables. In addition, its debt ratio is forecasted to move above the industry average, and its coverage ratio is low and forecasted to decline even more. The company is not in good shape, and things do not appear to be improving.


