

i
Abstract
A major problem in the world of manufacturing is the loss of productivity and profit due
to defects created during manufacturing. Lean manufacturing and value stream mapping have
become the standard tools to recognize and eliminate wasteful activities ranging from the misuse
of raw materials and labor to the making of defective components. It is imperative to generate
and implement economically sound measures with respect to the needs and capacity of the
company in question, if the making of defect components is to be minimized or eliminated. In
this Major Qualifying Project, the root causes of making defective components and other forms
of wasteful activities during the machining of specific components at Company A are studied.
Using value stream mapping, the stages at which defective components are made and the
associated machining operations, tooling, fixture and cutting conditions are identified. It is
found that the making of defect components is mainly associated with operator errors, machine
errors and set up errors. Lean manufacturing is introduced to both workers and management to
bring about an effective change at Company A. Before the start of the MQP, Company A was
experiencing problems ranging from low employee morale to 20% part defect rates. This was
seriously affecting the profitability of the company and could not be allowed to continue. The
group‟s effort yields new training and recruitment programs for current and future employees
that will ensure the elimination of defective components across in the manufacturing lines at
Company A. 2
ii
Acknowledgements
For the duration of our project, we worked at Company A, a local manufacturing
company located in Worcester, Massachusetts. The company provided us the opportunity to
apply our engineering education in an industrial setting.. Our group would like to express our
gratitude towards everyone who provided us information and guidance at Company A. In
addition, we would like to thank our advisor Professor M. S. Fofana who has provided us the
direction to successfully complete this project.
iii
Table of Contents Abstract ............................................................................................................................................ i
Acknowledgements .......................................................................................................................... ii
Table of Contents ........................................................................................................................... iii
List of Figures .................................................................................................................................. v
List of Tables .................................................................................................................................. vi
Chapter 1 – Recognition and Elimination of Waste .................................................................. 1
Chapter 2 – Strategies for Improvement .................................................................................... 3
2.1 Value Stream Mapping ......................................................................................................... 3
2.1.1 Current and Future State Maps ...................................................................................... 3
2.2 Lean Manufacturing .............................................................................................................. 4
2.2.1 History of Lean Manufacturing ..................................................................................... 5
2.2.2 Fundamentals of Lean Manufacturing ........................................................................... 7
2.2.2.1 Waste and its Many Forms ..................................................................................... 7
2.2.2.2 Just-in-Time and Kanban ........................................................................................ 8
2.2.2.3 Manufacturing Cells.............................................................................................. 12
2.2.2.4 Automation ........................................................................................................... 14
2.2.2.5 Reduction of Setup Time ...................................................................................... 16
2.2.3 Implementation of Lean ............................................................................................... 16
2.2.4 Lean Case Studies ........................................................................................................ 18
2.2.4.1 Toyota Motor Corporation .................................................................................... 18
2.2.4.2 General Motors Delphi Steering Plant [9] ............................................................ 20
2.2.4.3 Gelman Sciences Inc. [9] ...................................................................................... 23
2.3 Training and the Employee Perspective ............................................................................. 26
2.3.1 Fred Remmele and the Fred L. Remmele Co. ............................................................. 27
2.3.2 Harry Featherstone and the Recovery of Will-Burt ..................................................... 29
2.3.3 Chaparral Steel and their “85% Always in Training” Practice ................................... 32
2.4 Quality Management Methods ............................................................................................ 33
2.4.1 Total Quality Management .......................................................................................... 34
2.4.1.1 Management Commitment.................................................................................... 34
2.4.1.2. Employee Commitment and Communication ...................................................... 36

iv
2.4.2 Quality Circles ............................................................................................................. 38
2.4.3 Quality Case Studies .................................................................................................... 39
2.4.3.1 Englehard-Huntsville: Impact of Management ..................................................... 39
2.4.3.2 Lyondell Petrochemical: Employee Empowerment ............................................. 41
Chapter 3 – Problem Formulation and Solutions .................................................................... 44
3.1 Problem Formulation .......................................................................................................... 44
3.1.1 Initial Observations ...................................................................................................... 45
3.1.2 Data Collection and Analysis....................................................................................... 49
3.1.2.1 Employee Background .......................................................................................... 53
3.1.2.2 Organization of Raw Stock ................................................................................... 56
3.1.2.3 Work Station and Part Organization ..................................................................... 58
3.1.3 Conclusions from Data ................................................................................................ 59
3.2 Proposed Solutions.............................................................................................................. 60
3.2.1 Organization of Work Station ...................................................................................... 60
3.2.2 Creation of a Storage Container ................................................................................... 61
3.2.3 Tracking Involved with the Container Facility ............................................................ 64
3.3 Hiring Screening Processes................................................................................................. 65
3.3.1 The Initial Application ................................................................................................. 66
3.3.1.1 The Language and Communication Assessment .................................................. 66
3.3.1.2 The Mathematical Skills Assessment ................................................................... 67
3.3.2 The Interview and Application Follow-up ................................................................... 69
3.4 Employee Training.............................................................................................................. 69
3.4.1 Incoming Training ....................................................................................................... 70
3.4.2 Retraining of Current Employees ................................................................................ 70
Chapter 4 – Conclusion .............................................................................................................. 72
References ..................................................................................................................................... 74
Appendices .................................................................................................................................... 75

v
List of Figures
Chapter 2
2.1: Example of a Withdrawal Kanban…………………………………….. 9
2.2: Example of a Production Kanban……………………………………... 10
2.3: Kanban Chain for a Production Line………………………………….. 11
2.4: Cell Motion and Layout………………………………………………. 13
2.5: Poka-Yoke Part Design………………………………………………... 15
Chapter 3
3.1: Layout of the Manufacturing Floor…………………………………… 46
3.2: Receiving Area and Storage for Raw Materials and Chips………….... 47
3.3: Fixture Storage Area…………………………………………………... 48
3.4: Example of a Quality Control Report…………………………………. 51
3.5: Graph of Categories of Defective Components……………………….. 52
3.6: Graph of Educational Background……………………………………. 53
3.7: Graph of Prior Relevant Work Experience……………………………. 54
3.8: A Shelf with Various Raw Stock Materials………………………….... 56
3.9: Shipment Door and Raw Stock Materials……………………………...57
3.10: Floor Layout Including the Component Containment Facility……… 62
3.11: Shelving Holding Unused Fixtures…………………………………... 63
3.12: Pile of Unused Fixtures on Manufacturing Floor……………………. 63
3.13: Bins for M1 Carbine Barrels…………………………………………. 64
3.14: Sample CAD Drawing……………………………………………….. 68

vi
List of Tables
Chapter 2
2.1: Improvements at Delphi Steering …………………………………….. 22
2.2: Improvements at Gelman Sciences Inc………………………………... 25
2.3: Improvement Statistics of Will-Burt from 1985-1994………………... 31

1
Chapter 1 – Recognition and Elimination of Waste
The goal of any company is to make a profit by selling a quality product at a price higher
than the cost of the effort and materials used. A manufacturing company achieves this by
converting raw material into something of greater value using various manufacturing processes.
These include the machining of different components of an assembly, and selling them to
customers. Machining consists of removing material from the raw stock in order to create an end
product that performs a needed function. This is the goal of Company A that is studied. The
problem is when the machining processes produce a defective part; that part is taking up valuable
resources such as tools, material and labor without providing any profit to the company. While it
is unrealistic to expect a defect rate of zero, Company A is plagued with defective components in
the order of 20% of all production. Many of the defective components are often avoidable, and
they are overwhelmingly a result of human error. The survival of the company depends on
whether or not this problem of making defective components can be overcome.
The goal of this MQP is to identify and eliminate the root causes of making defective
components at Company A. This goal is accomplished by establishing a direct communication
and collaboration with every level of Company A‟s infrastructure, from the machine operators to
management. The first phase of the project is information gathering and observation using value
stream mapping. This organized approach provides us the opportunity to see when and where
defective components are made. Solution ideas are generated and iterated to evaluate the best
suited ones for Company A. Training programs and clear implementation procedures for the best
suited solutions are established. With the focus of the project on the elimination of waste, it
coincides with the core principles of lean manufacturing. Using lean manufacturing, the group is
able to eliminate the making of defective parts across the manufacturing lines at Company A.

2
To ensure that the solutions are acceptable to Company A at several levels of their
manufacturing infrastructure, a cost-benefit analysis of the impact of making defective
components and potential gains for eliminating defects is carried out.
The remaining parts of the report are characterized as follows. Chapter 2 contains
concepts and application of value stream mappings and Lean manufacturing. Chapter 3 discusses
the investigation of the problems at Company A, and several proposed solutions. The concluding
remarks are contained in Chapter 4. References and Appendices follow accordingly in
subsequent sections.

3
Chapter 2 – Strategies for Improvement
The chapter discusses various business practices that have been adopted by a number of
companies. The practices pertain to the improvement of productivity and profit for the
companies. Value stream mapping are Lean manufacturing are tools that embody the key
concepts for waste reduction. The use of these tools and training of the workforce can improve
product quality and employee morale. Total quality management is a philosophy that focuses on
a continuously improving organization. Researching these corporate practices will aid in
developing the methodology for identifying and analyzing wasteful activities at Company A.
2.1 Value Stream Mapping
Value stream mapping is a tool that can be used to analyze production systems,
manufacturing flow, or assembly line. It is an analysis of all processes, their times and
requirements, and their costs. This analysis is used to determine where waste is occurring. Waste
as it is known, can be in many forms. Parts being idle in between processes, a conveyor belt
slowing down too much in between two operations in an assembly line, and overproduction of
components coming out of individual processes are all forms of waste that value stream mapping
can identify.
2.1.1 Current and Future State Maps
The current state map is the analysis of the current situation. The stock is shipped to the
plant from a supplier, the plant carries out manufacturing processes on the stock to achieve a
desired component features, and the parts are assembled and shipped to the customers. All
processes and movements of the components, from stock to finish, are recorded and analyzed.
This allows for specific areas of wasteful activity to be determined, and then eliminated. Once

4
the current state map has been created, the plans for the construction of future state map [11] can
be carried out.
The main goal of value stream mapping is to identify areas of a manufacturing
infrastructure where there are wasteful activities. The future state map is the plan for the
company to start reducing the waste activities that have been recognized in the value stream. It is
important when going through wasteful activities, identified in the current state map, to continue
to look back and forth to make sure that all solutions are not only correct, but feasible. An
important aspect of the future state map is its ability to be implemented in a short period of time.
If wasteful activities are allowed to continue for an extended period of time, they are not only
able to produce more waste over time, but they can become engrained in the minds of the
employees as the way things are done. Allowing this to happen can make changing the current
state map much more difficult.
When attempting to construct the future state map, it is important that the construction is
broken down into steps. Completely altering the processes of a production line can be difficult if
all done at once. It is also important not to slow down the operations when attempting to apply
new plans. From the employees‟ perspectives, smaller individual changes are easy to implement
The main purpose of the value stream mapping is to identify waste. Once all wasteful
activities have been identified and a plan to rectify them has been put into motion, the waste
reducing ideals of Lean Manufacturing come into play [11].
2.2 Lean Manufacturing
Lean Manufacturing is a production tool that focuses on the elimination of waste in order
to reduce costs. This tool is often synonymous with the Toyota Production System (TPS) and the
creator Taiichi Ohno that pioneered these ideas. Waste, he said, can come in many different

5
forms, but all have unifying characteristics. Anything that uses resources without adding value to
the company is a wasteful activity. This can include anything from unnecessary waiting to
producing more then what is required at particular instant [3]. Company profits can be increased
without selling more of a product, but by eliminating wasteful activities from manufacturing
processes.
2.2.1 History of Lean Manufacturing
The origin of Lean Manufacturing date back more than a hundred years of Henry Ford
and the evolution of the first mass production system. The focus of this system was on mass
production of one type of car at low costs through increasing worker productivity. This system
was able to succeed in the United States mostly due to very high demand. With that assumption,
the main goal of Henry Ford was to increase output with the hope that there was always a buyer.
So if demand fell, anything produced past that demand was sold, and thereby became a liability
to the company. Another problem with this system was the inherent inflexibility to changing
consumer desires. An assembly line produced a uniform product in vast quantities. It was not
designed to produce many different variations and the hope was that the products will meet the
customers‟ desires. In other words, the company was “pushing” its products on the customers
rather having the customers pulled the products from the company [1]. Mass production became
impractical in a low demand economy and so a new method of production was developed.
Post-World War II Japan‟s economy was very different from that of the United States.
Demand was low and companies had to offer many different variations of the same product.
With limited resources, waste could not be afforded and overproduction meant the death of the
company. So as stated above, mass production was not the answer then and not an answer now.
Any solution must maximize the use of the limited resources at hand and be able to respond
6
quickly to customer demands. The answer was the Toyota Production System. This system
makes the most out of every resource the company has to offer and focuses on waste reduction
across in manufacturing infrastructures. Production is set according to customer demands and
every process is tailored to fit such demands. This is known as Just in Time Production (JIT).
The goal is having all processes work uniquely and collectively for the desired products at the
required time and for the required quantities [2]. This type of mentality prevented the creation of
excess inventory and overproduction. Thus, Toyota had developed a system that fitted perfectly
with the Japanese economy at the time and was able to withstand extended periods of low
customer demands.
The main reason why the principles of the TPS did not spread widely across in the United
States was that there was no immediate need for it. A high growth economy with seemingly
endless demand for more created a false sense of security among manufacturers that it would not
end. The oil crisis of the 1970‟s shattered this security and witnessed a fundamental paradigm
shift in American manufacturing. Growth and demand slowed while competition from overseas
became more and more problematic [1]. The problems of excess inventory, overproduction and
inefficient use of resources, problems that Toyota had been dealing with for years, threatened
many American manufacturing companies. What amazed many was Toyota‟s capability of
dealing with this crisis. Many other Japanese companies relied on American-style mass
production and were hit very hard. But Toyota weathered the crisis since it had recognized the
danger long in advance. It was here that the ideas of Toyota‟s manufacturing ideals spread to the
United States and began to be implemented. It was here that the term Lean Manufacturing was
coined and summed up many of Toyota‟s ideas with the addition of plans for implementation for
companies wishing to do so.

7
2.2.2 Fundamentals of Lean Manufacturing
While a brief summary of the values of Lean Manufacturing are discussed above, a
thorough walkthrough of its many aspects will follow. Lean is a corporation-wide philosophy
that is implemented through upper management and carried out by leaders and experts in the
lower levels of management. There are many methods of Lean manufacturing that can be used to
identify and eliminate waste. This includes the JIT production system along with its companion,
Kanban, which communicates between production processes. There is also the concept of Kaizen,
or continuous improvement among every level of the company [3]. All these constitute an
effective defense against waste that robs many companies of their profits.
2.2.2.1 Waste and its Many Forms
Eliminating waste at all levels of the Manufacturing infrastructure is an effective measure
for cutting unnecessary costs without sacrificing quality. The costs come in the form of using
material, manpower, and time that could be more effectively used. The key is to find a way to cut
out these practices without accidentally harming an integral part of the manufacturing process.
The various types of waste include:
Overproduction – Making more parts than can be sold or used immediately, and this costs
the company resources without any return on investment. Planning along with Kanban
can rectify this situation.
Waste of Motion – More movement of a product than is necessary. This can include long
transport times of materials and poor workplace layouts. The use of U and L-shaped cell
layouts is possible solution.

8
Waste of time – Workers waiting for a process to finish or taking too long to finish a
process both constitute waste of time. This can be fixed by optimizing setup procedures
and establishing effective production schedules.
Excess Inventory – Any raw material or parts that are not needed immediately take up
space and cost quite a bit for no return. A clear production schedule along with Just in
Time manufacturing practices help to solve the problem.
Defective parts – A part that is not made to specifications costs just as much as a part that
is made correctly. The difference is that the latter can be sold while the former merely
uses up resources. Employee inspection can recognize the problems early while quality
control can eventually avoid the problems from occurring [3].
2.2.2.2 Just-in-Time and Kanban
Just-in-time production and Kanban are measures that create a “pull‟ oriented company
rather then one that is a push oriented company. Push production is an attribute of mass
production that involves making as much as possible along every stage of the production flow in
order to maximize productivity. The problem of course being that many parts will be left over or
not needed and will not go into an end product. Thus no value is added to the company, however
valuable time and energy has been put into the production of these excess parts. Pull production,
on the other hand, involves a process of drawing only the necessary parts from its preceding
process and nothing more. Only the amount of parts that are immediately needed are made and
no inventory is created.
This kind of advanced production planning requires a great deal of communication
between manufacturing plants, suppliers, and departments. This is where the concept of Kanban
comes into play. Kanban is a type of communication that involves attachment of cards to every

9
set of components that moves within the company from raw stock to finished product. The goal
is to ensure that each process creates the right amount of parts as needed for the next process [2].
Each card includes numbers identifying the type and amount of part as well as detailed
information on where the part goes next. This forces the company to be more focused on demand
and to respond in a timely fashion to sudden changes in demand.
There are many different kinds of Kanbans, but most of them fall into the category of
either a withdrawal Kanban or a production-ordering Kanban. They act in opposite directions.
Withdrawal Kanbans specify the amount of parts a process needs from the previous process.
Production-ordering Kanbans indicate how many parts need to be produced for the next process.
Figure 2.1: Example of a Withdrawal Kanban [2]
10
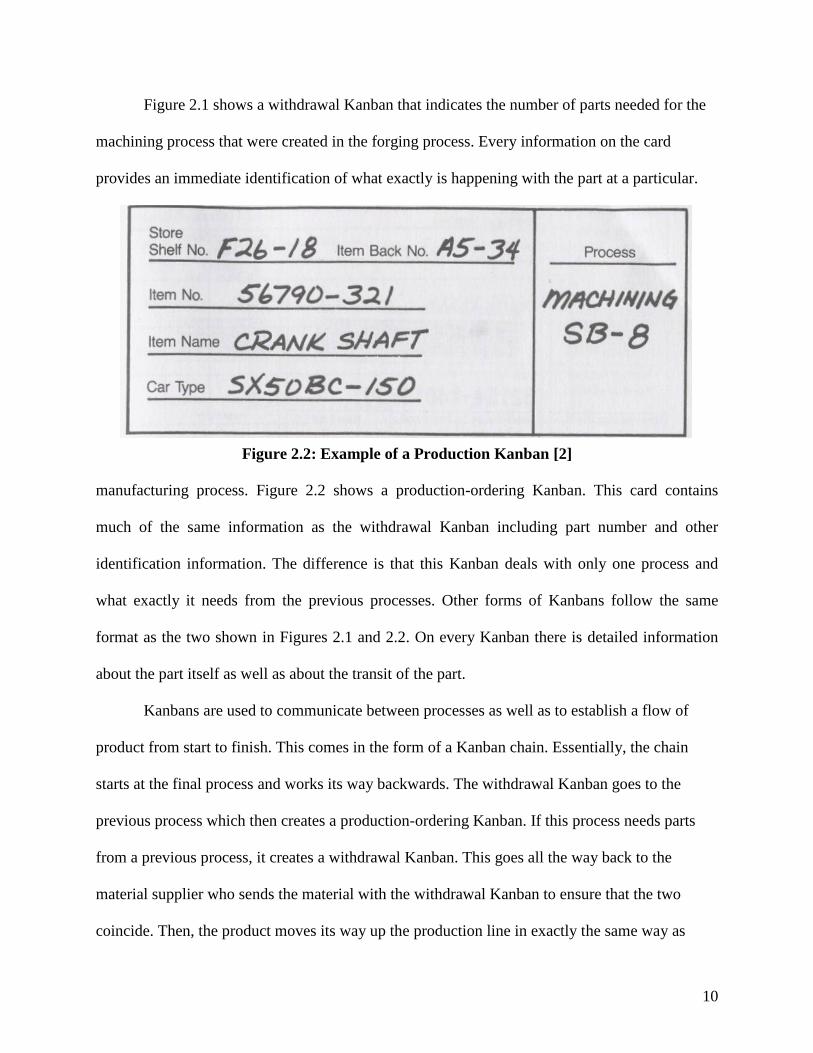
Figure 2.1 shows a withdrawal Kanban that indicates the number of parts needed for the
machining process that were created in the forging process. Every information on the card
provides an immediate identification of what exactly is happening with the part at a particular.
Figure 2.2: Example of a Production Kanban [2]
manufacturing process. Figure 2.2 shows a production-ordering Kanban. This card contains
much of the same information as the withdrawal Kanban including part number and other
identification information. The difference is that this Kanban deals with only one process and
what exactly it needs from the previous processes. Other forms of Kanbans follow the same
format as the two shown in Figures 2.1 and 2.2. On every Kanban there is detailed information
about the part itself as well as about the transit of the part.
Kanbans are used to communicate between processes as well as to establish a flow of
product from start to finish. This comes in the form of a Kanban chain. Essentially, the chain
starts at the final process and works its way backwards. The withdrawal Kanban goes to the
previous process which then creates a production-ordering Kanban. If this process needs parts
from a previous process, it creates a withdrawal Kanban. This goes all the way back to the
material supplier who sends the material with the withdrawal Kanban to ensure that the two
coincide. Then, the product moves its way up the production line in exactly the same way as
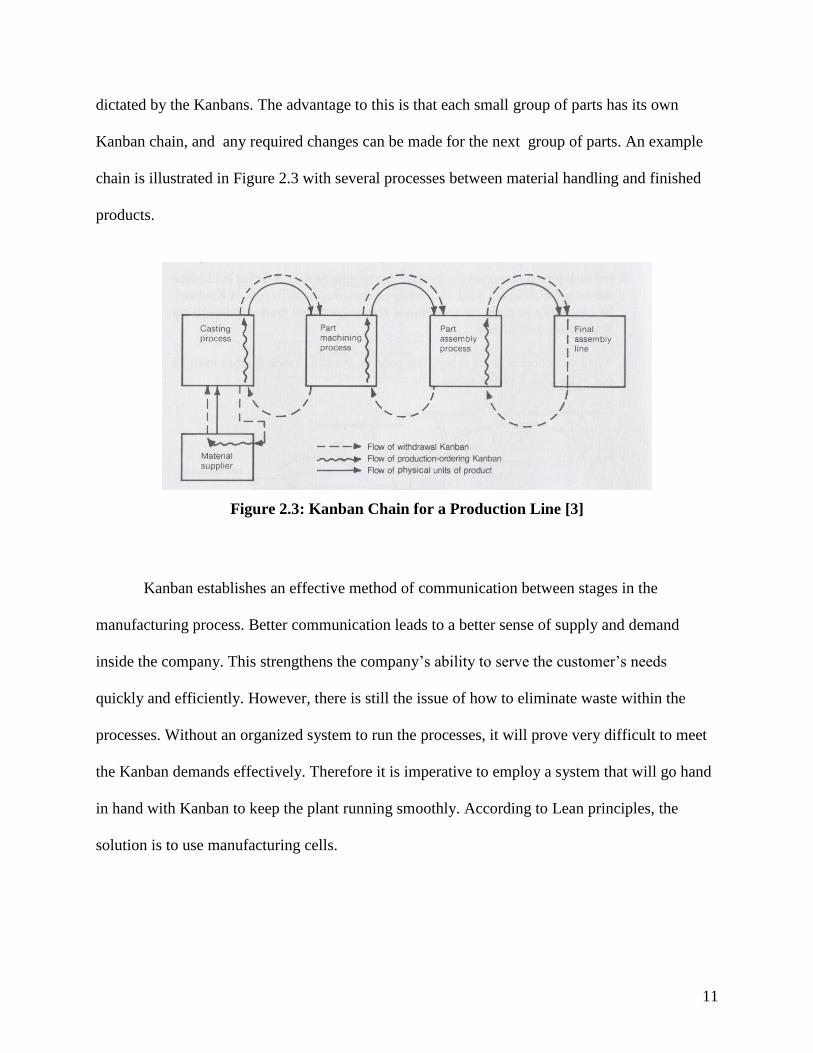
11
dictated by the Kanbans. The advantage to this is that each small group of parts has its own
Kanban chain, and any required changes can be made for the next group of parts. An example
chain is illustrated in Figure 2.3 with several processes between material handling and finished
products.
Figure 2.3: Kanban Chain for a Production Line [3]
Kanban establishes an effective method of communication between stages in the
manufacturing process. Better communication leads to a better sense of supply and demand
inside the company. This strengthens the company‟s ability to serve the customer‟s needs
quickly and efficiently. However, there is still the issue of how to eliminate waste within the
processes. Without an organized system to run the processes, it will prove very difficult to meet
the Kanban demands effectively. Therefore it is imperative to employ a system that will go hand
in hand with Kanban to keep the plant running smoothly. According to Lean principles, the
solution is to use manufacturing cells.

12
2.2.2.3 Manufacturing Cells
Cellular manufacturing is a process that greatly simplifies the flow of the manufacturing
facility as well as uses the skills of the workers to the fullest [12]. In a traditional manufacturing
setting, each worker performs one function on an assembly line. This leads to a repetitive and
disengaging work setting that does not promote worker teamwork. Additionally, there is usually
a problem of long setup time and high inventory costs associated with this approach. A company
that wishes to improve its productivity and reduce waste would be wise to adopt a cellular
manufacturing layout.
One of the main problems associated with mass production are bottlenecks and
overproduction. They stem from unexpected changes in production and the inflexibility of the
system to adjustments. Large batch size and long setup time often times stand in the way for
making changes in the manufacturing process or even to find errors in the first place. Waste is
created in the form of inventory buildup, underproduction and overproduction. The other main
contributors to the problems are the employees. In a mass production setting, the workers spend
a large amount of time setting up and watching one machine. Their skills are limited to that
machine, and if demand changes suddenly they may find themselves overwhelmed with orders or
with nothing to do. Also, the work is also very monotonous and unchanging, and it leads to poor
employee morale and little involvement in the improvement of the company. This mode of
manufacturing has adverse effect on the workers and the company, and clearly needs to be
rectified [12].
Cellular manufacturing is one of the means to rectify the problems by completely
reorganizing the way workers are employed. Instead of working on only one type of machine,
workers are trained in every aspect of one product family. This is a group of products that require
13
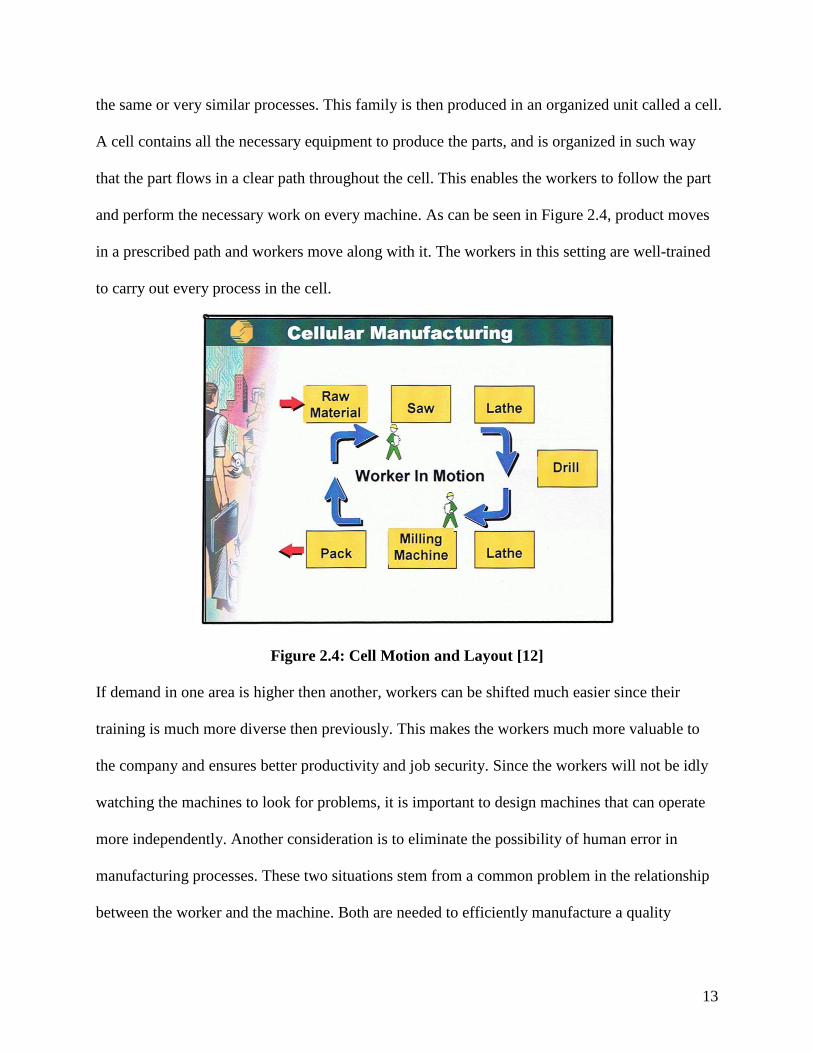
the same or very similar processes. This family is then produced in an organized unit called a cell.
A cell contains all the necessary equipment to produce the parts, and is organized in such way
that the part flows in a clear path throughout the cell. This enables the workers to follow the part
and perform the necessary work on every machine. As can be seen in Figure 2.4, product moves
in a prescribed path and workers move along with it. The workers in this setting are well-trained
to carry out every process in the cell.
Figure 2.4: Cell Motion and Layout [12]
If demand in one area is higher then another, workers can be shifted much easier since their
training is much more diverse then previously. This makes the workers much more valuable to
the company and ensures better productivity and job security. Since the workers will not be idly
watching the machines to look for problems, it is important to design machines that can operate
more independently. Another consideration is to eliminate the possibility of human error in
manufacturing processes. These two situations stem from a common problem in the relationship
between the worker and the machine. Both are needed to efficiently manufacture a quality
14
product. Since the worker‟s responsibilities were changed in the implementation of lean, the
machine and its processes must change also. The lean term for this change is called
manufacturing automation.
2.2.2.4 Automation
Automation is, as Taiichi Ohno puts it, “automation with a human touch” [1]. It is a
system that works to employ both machine and human power to the fullest extent. The idea is to
design a machining process with a fail-safe in place to ensure that if the machine begins to fall
out of tolerance and create defective parts, it will stop [2]. This goes hand in hand with JIT
manufacturing and takes into account the creation of defective parts. The task of the worker then
is to not merely watch the machine and wait for it to fail, but to only work on the machine when
it shuts down. Taiichi Ohno made a comparison between Japanese and American manufacturing
companies. He stated that he never saw a Japanese worker just watching a machine. In the
United States, it is the reverse – He has never visited an American plant without seeing a worker
just watching a machine” [1]. He argues that the brainpower of the worker is being wasted on
such a menial task as watching the machining process. A plant that is employing lean
manufacturing would put its workers to far better, and arguably more stimulating jobs than in a
plant with mass production practices.
There are various processes that can be employed to prevent these errors from occurring.
These are referred to as poka-yoke, which means error proofing. These are aimed at the worker
to prevent the human error that is possible in anything involving human involvement. The most
simple of these is a checklist for setting up and performing any operation done by the worker.
This prevents the simple error of forgetting a step or performing a step in the wrong order. An
inspection by the worker can also be a part of this to catch defects before they move up the
15
process chain. When done both before and after a process, the worker can evaluate both his and
the previous worker‟s performance [3]. Thus the chance of any defective part slipping through
would be very slim provided both workers are well-trained.
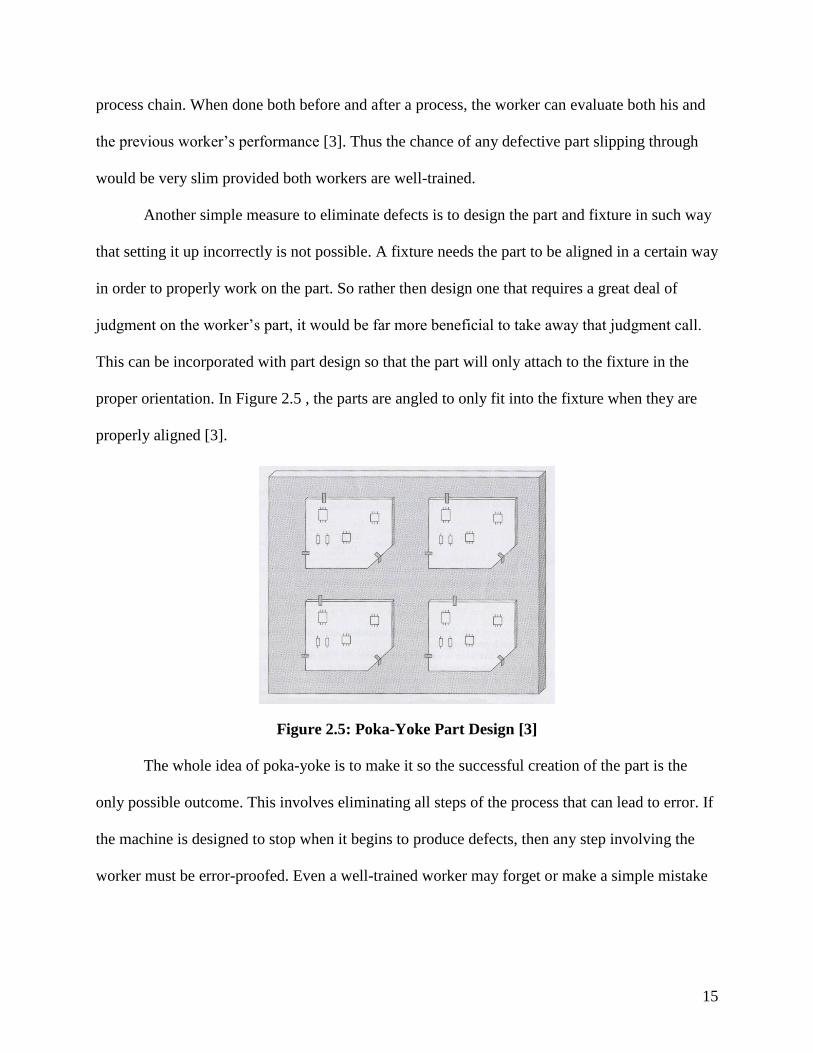
Another simple measure to eliminate defects is to design the part and fixture in such way
that setting it up incorrectly is not possible. A fixture needs the part to be aligned in a certain way
in order to properly work on the part. So rather then design one that requires a great deal of
judgment on the worker‟s part, it would be far more beneficial to take away that judgment call.
This can be incorporated with part design so that the part will only attach to the fixture in the
proper orientation. In Figure 2.5 , the parts are angled to only fit into the fixture when they are
properly aligned [3].
Figure 2.5: Poka-Yoke Part Design [3]
The whole idea of poka-yoke is to make it so the successful creation of the part is the
only possible outcome. This involves eliminating all steps of the process that can lead to error. If
the machine is designed to stop when it begins to produce defects, then any step involving the
worker must be error-proofed. Even a well-trained worker may forget or make a simple mistake
16
from time to time. The idea is to have constant reminders and fail-safes in place to make it very
difficult if not impossible for the worker to make an accidental mistake.
2.2.2.5 Reduction of Setup Time
One of the most time consuming tasks for manufacturing workers is often the setup of a
machine for a certain process. A proponent of mass production would argue that the best way to
eliminate setup time costs is to make the size of the lot being setup large enough so a long setup
will be offset by the quantity of production. Thus the cost is hidden by the amount produced. In
lean manufacturing however, the average lot size is much smaller and so a long setup time will
be more detrimental to overall production. These long setup times can really disturb the entire
manufacturing flow and throw off even the best of production schedules. It is evident that the
shorter a part takes to setup, the less time and money is wasted.
The key to shortening setup times is to make it so everything is prepared in advance so
the worker has everything he needs to complete the setup. This is the distinction between internal
and external setup. Internal setup is everything the worker does while the machine is stopped.
External setup is all the preparation of tools and procedures that assist the worker and can be
prepared beforehand. The length of time it takes to complete internal setup is then the quantity
that needs to be shortened. This is done be shifting as much work as possible to external setup so
as to limit the time required for the machine to be stopped [2]. Also, this provides for the
standardization of setup procedure as well as average time for completion. The worker‟s job is
also simplified so he can move on to other things.
2.2.3 Implementation of Lean
The stiff competition from overseas as well as increasing costs at home has led many
American companies to consider the advantages of employing the principles of lean

17
manufacturing. Coupled with the resounding success of the Toyota Motor Corporation and its
ascendance past Ford and other American companies has led to many of these companies to
emulate many of Toyota‟s practices. Even Ford began the transition to lean in the 1990‟s and
continues it to this day [3]. This is all due to the fact that the conditions that gave birth to Lean
manufacturing in Japan are now beginning to be felt elsewhere. Lower demand coupled with
intense competition is making its mark on the American automotive industry.
A shift from mass production to lean manufacturing requires a company-wide
transformation. The push for change must come from management, but that does not mean that
managers are the only needed proponents of change. Every worker in the company will
experience these changes and some may oppose them purely due to the fear of change. That is
why it is important to have leaders in every department to show that those changes are for the
better. It is only when every worker in the company is an active supporter of lean thinking that
the revolution has run its course.
Undoubtedly the most influential change to workers is the shift from task-oriented job
titles to multiple process supervision. In American industry, the vast majority of workers
specialize in one field and rarely if ever work outside their specialty. There are welders and
turners and drillers, but no general purpose operators. On the other hand, workers at companies
like Toyota work in manufacturing cells monitoring multiple different machines. These do not
even have to be the same type of machine. One worker can simultaneously be a turner and a
driller. This also breaks up the idea of one worker per machine whose sole task is to monitor that
one machine‟s process. Taiichi Ohno feels this gives the worker a boring, monotonous task that
also wastes his talents [1]. A multiple process worker plant frees up manpower from these tasks
and can shift it to expanding production or performing more valuable tasks.
18
Now if multiple process conversion is the biggest change for the worker, the shift to
small lot sizes is the biggest change for the manufacturing plant as a whole. This represents the
shift from a push system to a pull oriented one. A major shift such as this involves shifting the
very foundation of the company and will not prove easy. The planning and coordination to
implement a Kanban approach takes time to work out the details and implementation procedures.
A mass production system may have scheduling and production goals, but contains nothing close
to the extensive communication system that Kanban represents. Bottlenecks will invariably be
created and production goals may be missed in the first stages. But the advantages of going lean
far outweigh the frustration and cost that goes into the actual shift.
2.2.4 Lean Case Studies
This section discusses the ways that lean manufacturing has been implemented at a
company. As the initial developer of many of these strategies, Toyota has spent a lot of energy
working all the kinks out. Their overall success was littered with moments of failure and loss
where the very survival of the idea of Lean was in the balance.
2.2.4.1 Toyota Motor Corporation
The Toyota Motor Corporation was an offshoot of the Toyoda Spinning and Weaving, a
textile company. It was founded by Toyoda Kiichiro in 1933 and was widely viewed as a risky
maneuver [1]. Fortunately, much of the experience in textiles proved very applicable to
automobiles. The world market heavily favored foreign countries and so Japan had to develop
new techniques for catching up to the competition. Taiichi Ohno himself was originally a worker
in the textile factory, but was moved in 1943 to the automobile division. His experience was that
manufacturing cars was no different from textiles. Worker-machine relations as well as cutting

19
costs without cutting quality were all major issues in the textile business [1]. The company
focused mainly on small trucks and catered to the Japanese Imperial Army during World War II.
After World War II ended, Toyota was far behind its American competitors in both production
and profit. The president Toyoda Kiichiro wanted to move into production of small passenger
cars. He recognized the power the car had to change history and wanted his company to be a part
of it. His vision culminated in the goal of catching up with America by 1948 [1]. Toyota had
emulated many of the fundamentals of American manufacturing such as Quality Control and
Industrial Engineering. Imitation would not be enough to pass the American behemoths however.
There had to be something Toyota could develop to catch up.
The development of lean manufacturing at Toyota happened in a certain environment that
encouraged its growth. Since Toyota already used small lot sizes and produced many different
cars, the new system was designed around these practices. Also, labor was not as entrenched in
specialization as it was in America. This made it possible to create the manufacturing cells where
each worker operates multiple machines. Scarce resources made it impossible to build up large
quantities of inventory so an advanced planning system was needed to take full advantage of
every resource possible. The Toyota Production System that came out of this situation was best
able to cope with the special circumstances of a slow-growth economy.
This huge change did not happen overnight. Nor was it easy. While the presidents of
Toyota have always been supporters of the JIT system and other changes, the workers and
supervisors were not. Kanban as a system took ten years to become accepted companywide [1].
Ohno was working as plant manager when he first implemented the system. Although he had the
full blessings of the president, that did not make his job much easier. He had to use his authority
to press the workers and supervisors into adopting Kanban. There were many complaints to
20
Ohno‟s superiors about his “utterly ridiculous” system [1]. Many of the fundamentals of lean
manufacturing run opposite to the established principles of manufacturing. One was that the
bigger the lot size, the lower the cost. Lean turns that on its head and uses very small lot sizes to
minimize waste [1]. This was a problem with die casting procedures that would require many die
changes in the new system. Finding a way to make this work took years, but resulted in the
shortening of setup time. A full conversion from mass production to lean manufacturing took
Toyota many years and a lot of trouble, but the benefits are obvious.
Toyoda Kiichiro would be proud to see that his company has flourished over the years. In
2006, Toyota posted profits approaching $12 billion while GM lost $2 billion [10]. American
companies are plagued with problems such as skyrocketing health care costs and stubborn unions.
Toyota has increased its market share at the expense of GM and Ford and should continue to do
so. Also, companies across the world (including Ford and GM) are adopting Toyota‟s
manufacturing practices much like Toyota adopted those of the Americans. It is clear that Toyota
is the most prosperous automotive company and has a very bright future.
One of the keys to the success of implementing and sustaining lean manufacturing is a
well-educated and motivated workforce. Contrary to popular belief, the trend in manufacturing is
not towards low-cost labor, but towards high quality, high volume production. Constant training
and retraining are necessary to ensure that this takes place. This aids in raising overall quality as
well as improving employee morale. The next section will discuss the various methods for
instituting training programs and the outcomes of each.
2.2.4.2 General Motors Delphi Steering Plant [9]
One of the biggest obstacles to implementing lean is entrenched opposition from labor and
management. Although their superiors may wish to shift towards lean manufacturing, these

21
groups are usually opposed to such change. At Delphi Saginaw Steering Systems (DSSS), plant
management and as well as the local Union of Automotive Workers chapter were resistant to the
Lean ideas. The early 1990‟s saw a huge downturn in the plant‟s profitability and there were
threats of moving the operation overseas unless there were significant changes. The plant still
operated on mass production principles and was forced by union contract to pay their workers
over $45.00 an hour in wages and benefits. It was clear that the plant would face closure unless
significant actions were taken.
It would be impossible to achieve such changes if the union leaders continued their
opposition. A new contract negotiation was approaching and management decided to try to focus
the contract on a change towards Lean manufacturing principles. These leaders were brought to a
similar plant that had instituted many Lean principles. The leaders were amazed at the efficiency
and productivity of the plant. But what really surprised them was the way the work force had
embraced Lean. Morale was very high and workers felt that they had a say in the running of the
plant. A new contract was agreed upon that gave the company the union‟s cooperation in the lean
transformation.
Since the Delphi plant was still mired in an obsolete mass production mode of thinking,
this transformation would have to change every aspect of the work environment. A worker in the
old system would work individually and be paid mostly for his physical labor. A supervisor‟s job
was to ensure the worker did his job through direct control and observation. In the new lean
system, workers are team members working towards the same goal. Communication between
team members and between the team and management is essential. Supervisors act more as
facilitators to ensure the workers have the resources available to do their job. This shift in
22
mindset would not happen overnight and would encounter resistance before broad acceptance
was possible.
It is critical that employees receive training in Lean principles not only to be more
productive, but also to dispel any prejudice towards lean. Many workers and supervisors fear
change due to the uncertainty that change causes. This is especially true of older workers who
have been doing their jobs for the past twenty or more years. They are usually very resistant to
major changes from management and are unlikely to propose changes of their own without
encouragement. For Lean to succeed, it is essential that workers learn to embrace change as well
as propose changes of their own.
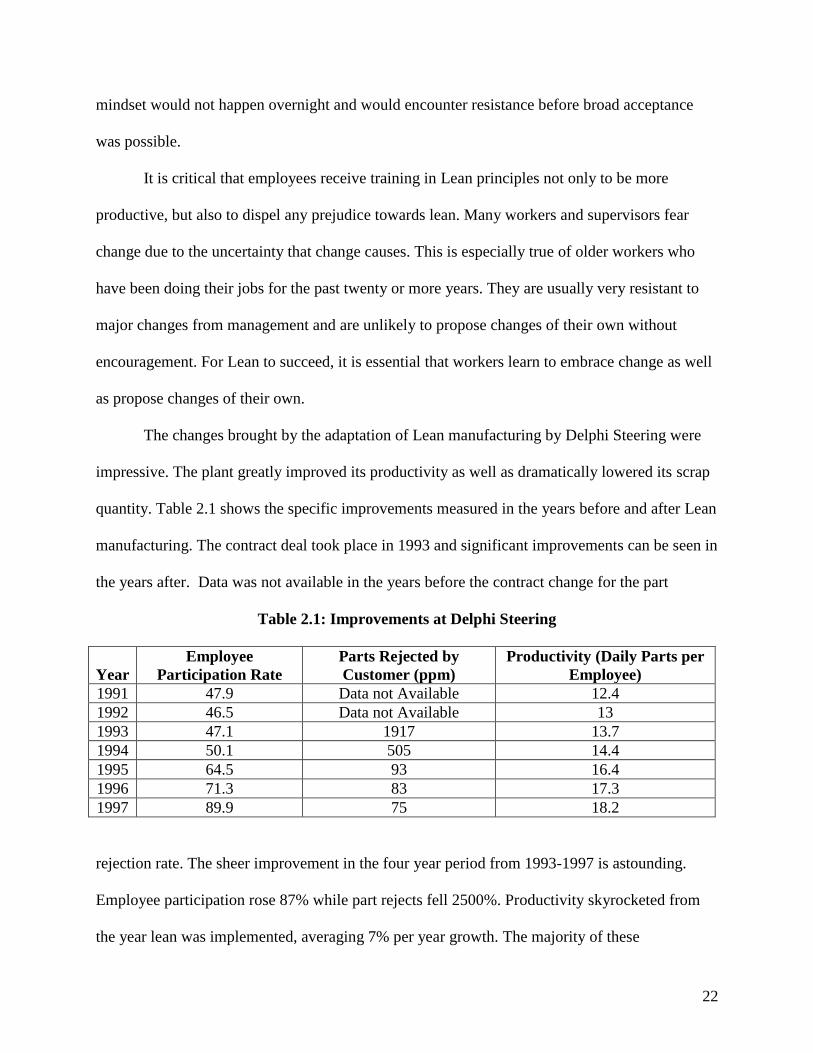
The changes brought by the adaptation of Lean manufacturing by Delphi Steering were
impressive. The plant greatly improved its productivity as well as dramatically lowered its scrap
quantity. Table 2.1 shows the specific improvements measured in the years before and after Lean
manufacturing. The contract deal took place in 1993 and significant improvements can be seen in
the years after. Data was not available in the years before the contract change for the part
Table 2.1: Improvements at Delphi Steering
Year
Employee
Participation Rate
Parts Rejected by
Customer (ppm)
Productivity (Daily Parts per
Employee)
1991 47.9 Data not Available 12.4
1992 46.5 Data not Available 13
1993 47.1 1917 13.7
1994 50.1 505 14.4
1995 64.5 93 16.4
1996 71.3 83 17.3
1997 89.9 75 18.2
rejection rate. The sheer improvement in the four year period from 1993-1997 is astounding.
Employee participation rose 87% while part rejects fell 2500%. Productivity skyrocketed from
the year lean was implemented, averaging 7% per year growth. The majority of these

23
improvements can be attributed to Lean manufacturing and only proved possible when labor and
management fully worked together.
Much can be learned from the Delphi Steering case study. The implementation of Lean
was not something that occurred overnight, but it took several years to see significant
improvements across in the company. Those improvements come in many forms including better
productivity, lower scrap rates, and even in more intangible forms such as higher worker morale.
In fact, a major component of lean involves shifting workers away from purely manual labor to
employ the full resources these workers offer. Higher participation in decision making can
benefit both the company and the worker. The major lesson is that labor and management are
often opposed to the change lean requires and without their support, the transformation will not
take place.
2.2.4.3 Gelman Sciences Inc. [9]
Gelman Sciences is a high-tech manufacturing company that specializes in filtration and
membrane separation of air samples. These products are used in a variety of settings from
applications in the medical field to laboratory research. Gelman mainly employed mass
production due to the long setup times of its machines. Like many other manufacturers, Gelman
experienced a time of increasing competition that forced a shift towards lean manufacturing.
Despite the fact that the company had been utilizing mass production for almost forty years, the
system was not able to compete as effectively with other companies and needed to be changed.
The problems at Gelman were very similar to those at other companies. The setup times
of many machines were long and created bottlenecks in production. There was a high scrap rate
that not only cost resources, but also the wasted time needed to inspect every product to ensure
quality. Another problem was inventory buildup and the inability of the company to accurately

24
deliver the amount demanded. Also, management and worker roles were typical of a mass
manufacturer. Management made all the decisions while the workers were used as manual labor.
All of these problems stem from a mass production mentality that attempts to make up for these
inefficiencies through sheer volume.
The first step for any lean initiative is to get as many people on board as possible. At the
start of the transformation, a few managers fully supported the idea while many were indifferent
or openly opposed to it. Engineering and quality control were both opposed to many of the lean
proposals. The work force was wary of any change that could threaten their way of doing things.
An outside consultant was hired to specialize in the introduction of lean concepts to dispel any
prior notions that people held and to setup a training system. The first step in the operation was
to bring management fully on board before any introduction of lean concepts to the workers.
Continuous improvement teams were organized in management and the resistance to change was
gradually broken down. New managers were even brought in to replace those most resistant to
change. The next step would be to get engineering and quality control to support the change.
Engineering was stubborn to change because many of the engineers felt that there were
too many present problems to deal with to waste time finding root causes. Quality control was
reluctant to take the lead on correcting the problems and was busy just identifying current scrap.
This is a common problem with any shift in thinking. Many people feel they are too busy with
present tasks to worry too much about the future. Unfortunately, it is their responsibility to help
the company improve regardless of any current problems. The best way to convert these people
to a lean way of thinking is to bring them into the problem solving process. At Gelman, this was
met with little enthusiasm by both groups. This would have to be overcome through education
and application of lean concepts.

25
The lean manufacturing classes were designed to meet for two hours every week for 14
weeks. Homework was given to reinforce the concepts and to give the participants experience in
solving these problems. Managers and supervisors were expected to set an example for others by
fully participating. After the basic notions of waste in lean were introduced, the classes began to
focus on scrap in the plant. Scrap rates at Gelman ran as high as 20% and caused a litany of
problems. Not only were the resources used to make that scrap wasted, but also the time and
energy of the workers ensuring their products met the standard. Due to the high rate of scrap, at
least 50% of labor represented redundant inspection of material. If the scrap rate could be
significantly lowered, the company would be much better off.
The consultants at Gelman implemented several major lean concepts at the plant
including cellular manufacturing, small batch sizes, and kaizen. It took about four years from the
formation of Continuous Improvement teams to the spread of lean throughout the entire
corporation. Jobs that had taken over three days to complete could be finished in about five hours,
a decrease of over 1500%. The distance traveled between processes fell from over 250 feet to
about 18 feet. One of the main focuses of lean manufacturing is on inventory reduction and as
can be seen in Table 2, inventory fell about a million dollars after the shift towards
Table 2.2: Improvements at Gelman Sciences Inc.
Statistical Averages
Pre-Cell
Average
Post-Cell
Average
%
Change
Job Time 78 hours 5 hours 1560%
Job Travel Distance 250 feet 18 feet 1388%
On-Time Delivery
Performance 88% 93% 5.4%
Inventory Values $3,750,000 $2,750,000 73%

26
cellular manufacturing. The biggest changes exist in the areas that Gelman chose to focus on.
While the on-time delivery performance change may look small, it gets much harder to improve
as one approached 100% so even an increase of 5% is very large. As can be seen, the company
achieved its goals o higher production efficiency and can now maintain an edge over the
competition.
The lessons that can be learned from Gelman Sciences mainly involve getting people on
the side of a shift towards lean. It is essential to have the support of upper management since
without them there is no power to enact change. Also, it is imperative that managers and
supervisors take the lead in any education effort since many of them are also learning and this
can help encourage other workers. The biggest obstacle is shifting the company‟s focus from
mass production to lean and constant change. This process can take several years and at Gelman
it took more then four. But once this happens, the benefits start to be felt and change becomes
much easier to implement.
2.3 Training and the Employee Perspective
Training has been a feared and respected part of corporate America since the beginning
of technically demanding jobs. Many companies do not train because they feel they are too
small. Others feel that just top managers need to be trained. Then in turn, they can then pass on
whatever they have learned. Still others don‟t bother because they feel their workers aren‟t smart
enough to benefit [4]. All workers can profit in one form or another from training. These benefits
experienced by the workers almost always provide direct benefits to the company as well,
whether instantaneous or over the long term.
Many of the aspects of an average employee‟s day, in many different fields, can be
greatly influenced by training and retraining. Enthusiasm, morale, and a simple basis of

27
knowledge about the jobs they are performing are all benefits of training employees. The major
issue involved with training is the cost. The cost has to be balanced by the longevity of the
employee‟s stay at the company and the increase in value of the worker after training. This
balance of costs versus initial and long term rewards is what the largest problem becomes for
most companies when they are choosing whether or not to adopt regular training as a plan for
their employees.
Many of the companies that provided their employees with training and experienced
success have documented it for others to read and understand. This allows other companies and
entrepreneurs to learn from big companies‟ trials and errors. The following companies‟ plans and
individuals‟ ideals are prime examples of how training and taking into consideration the
employees‟ opinions benefits everyone.
2.3.1 Fred Remmele and the Fred L. Remmele Co.
Fred Remmele was a German born tool and die maker, and founder of Remmele
Engineering. His theories and one well known saying, are still remembered and practiced today.
Remmele said, “Like good tools, craftsmen are fashioned with care” [4]. He moved to the United
States in 1926, and settled in the Midwest, in St. Paul. He became a well known tool and die
maker in that area, and over the next 20 years became one of the best. In his travels to many
different machine shops in the area, he became aware of the mass disorganization of many of
these shops. He noticed that many employers showed a lack of consideration for their employees.
In some cases when something was discovered or figured out on the floor, management would
simply not take the workers‟ opinions into consideration or just ignore what they had to say
completely. In 1949, Remmele took all the ideas he had about how shops were being managed
incorrectly and put his own ideas on how to improve those circumstances into practice. He,
28
along with a friend, Thomas S. Zastrow, opened a tool and die business called the Fred L.
Remmele Co. He based his firm on a few main principles, such as respect for employees, a
flexible and progressive management philosophy, and a desire to set the highest standards in
both machining and in the design of custom machines. Over the years, his company progressed
from its initial 15 employees to 75 in 1962. The company was pulling in a lot of profit; it made
over $1 million in sales in 1962. By 1970, the company had 2 plants on a 67 acre piece of land.
Remmele retired in 1971, but made sure that his ideas stayed the main focus of the company, in
terms of treating employees with respect. In 1974, using Remmele‟s initiatives, the Fred L.
Remmele Co. opened up a training center and apprenticeship program for all who choose to go
into the machining field. The main reason for all of his company‟s progression was because of
Remmele‟s ideals surrounding treating his employees with respect and giving them the
knowledge they needed to perform the tasks they were assigned to.
Fred Remmele‟s overall goal was to be the “best in the field.” To achieve this goal, and
keep his company alive, he adopted and implemented several operating principles. The first of
these was basically to maintain a small plant atmosphere, in which the employees feel like they
know what is going on and can talk to a supervisor when they have a question. With this line of
communication in place, the supervisors could then go over what has been a repeating trend, so
that it could be addressed in the plant. This allowed for a nurturing environment to be maintained,
in which the employees felt like they were constantly learning how to do their job better. The
supervisors were the medium through which the knowledge would flow from upper management
to employees.
Another of Remmele‟s principles was practicing the art of informed risk. Management
encouraged their employees to make decisions based on knowledge. Any mistakes or losses were

29
accepted as part of the learning curve. This allowed the company to address these trends again,
and retrain accordingly. Also, this allowed the supervisors to feel less overwhelmed by
employees constantly coming to them with questions. While it is important for the operators to
be able to talk to the supervisors, it is also imperative that they make their own decisions, in
order to give the supervisors more of a chance to do their job: supervising.
Admittedly, the reason that Fred Remmele had so much success in his business, from
starting it in 1949 to retiring in 1971, was because he cares for his employees. The underlying
principles of the Fred L. Remmele Co. that led them to success were caring for their employees,
treating them with respect, listening to them, and first and foremost of all, training them. Giving
employees the knowledge they needed to succeed was the reason for the company‟s quick path
to success.
2.3.2 Harry Featherstone and the Recovery of Will-Burt
In 1985 Harry Featherstone was elected the new CEO of a manufacturing company, Will-
Burt. The company was well on its way to going out of business. Featherstone was given,
shortly after he was named CEO, a six week period to bring the company‟s profits back up
before Will-Burt and all of its assets would be liquidated. There were problems within every
aspect of the company. Product reject rates were running as high as 35%, with the average at
around 10 to 15% [4]. Employee morale had dropped so low that out of the 300 employees, 100
to 200 a week were tardy at least once. Employee absenteeism was at an all time high.
Featherstone had just become the owner of what was sure to be a nonexistent company in a little
over a month.
To start the company on the path to recovery, Featherstone established an ESOP, which
was a 100% employee stock ownership plan. Using this he was able to borrow $3.5 million for

30
capital. This was a huge personal risk due to the fact that the company, in the recent years, was
only making about $400,000 per year. This huge risk put a lot of pressure on Featherstone to get
the company up and running, as quickly as possible.
Initially, Featherstone went through with some layoffs, mostly of deadweight employees
who had absolutely no room for improvement, or whose jobs had very little purpose and could
be covered by someone else. This alone wasn‟t going to provide Will-Burt with the profit bonus
needed to stay alive. Upon further inspection of most of the employees, both on the
manufacturing floor and in the offices, Featherstone realized that there was only one possible
solution to save the company. He decided to implement a thorough training program for all
employees. He first noticed that some of the blueprints and engineering drawings were in very
complicated language, a sixteenth-grade level. Featherstone was quoted: “Our engineers and
quality control people were using sixteenth- to eighteenth-grade language while the workers
were averaging around an eight- to ninth-grade level. It didn‟t work [4]”. At that time, it seemed
that the workers simply needed education and training, therefore everyone would be on the same
page. The board of directors had proposed that the company needed to drastically cut costs.
Featherstone came back with a plan that would cost the company approximately 2.5% of payroll
in the first couple of years. Virtually no one in the entire company, let alone the board of
directors, thought it was remotely close to what needed to be done to save the company. Many of
the workers felt insulted that he was essentially saying that not many of them were educated
enough to do their job correctly. One of these employees, Jack Rose, said: “When Harry came in
with this education program, a lot of people, and I myself was one of them, felt „I know how to
read blueprints. I know what I‟m doing. I don‟t need this‟ ” [4]. Very few of the workers took
kindly to the idea at first.
31
Featherstone pursued his training ideas, and eventually, many of the employees began to
come around to it. Once the majority decision decided to go through with it, a test was given to
all employees: machine operators, engineers, secretaries, etc. The tests revealed that many of the
employees had very low basic math skills, as well as horrible reading abilities. It was found that
some workers were considered illiterate by educational standards. Due to the poor results of
these tests, it became apparent to Featherstone exactly what the issue was. The time had come for
rhetoric to be pushed aside; there was a huge problem that required bold action.
Featherstone developed a simple training program that initially required all workers to
take math classes and basic reading and writing lessons. He also came up with a voluntary mini-
MBA program for all employees, but sadly only about half of the employees that started it
decided to finish it. Those that finished it felt like they now had a better opportunity to advance
in the company, particularly those who had only graduated high school previous to working at
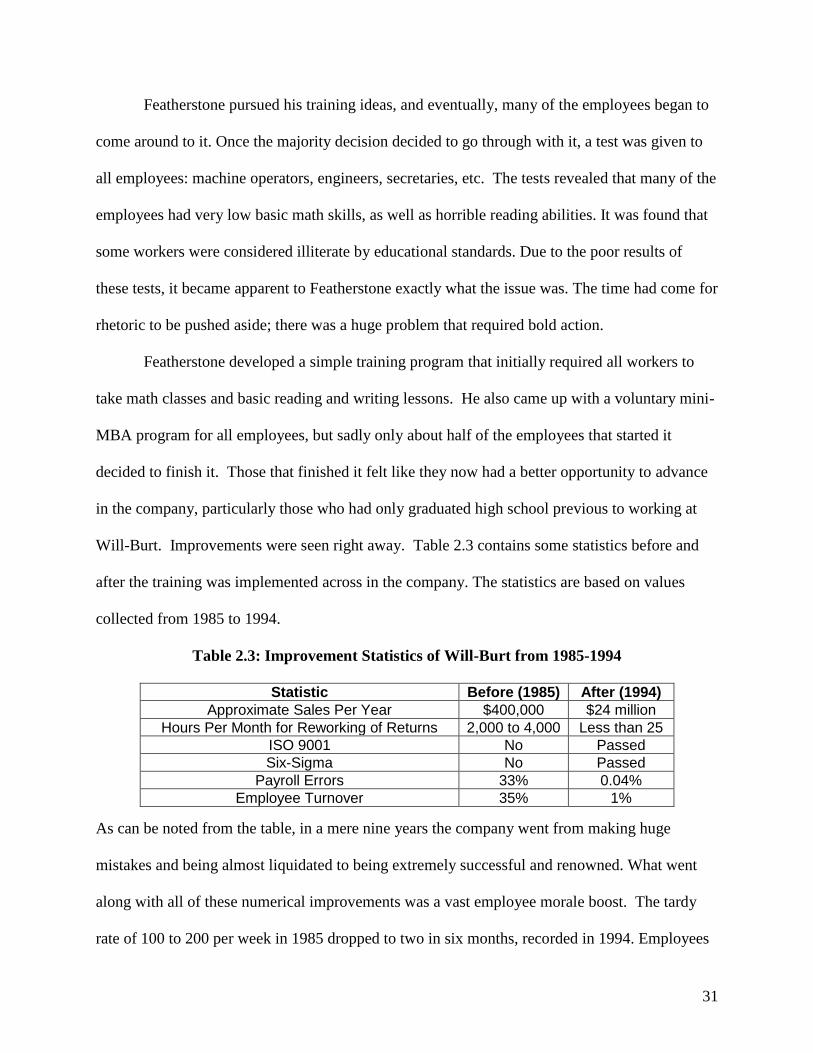
Will-Burt. Improvements were seen right away. Table 2.3 contains some statistics before and
after the training was implemented across in the company. The statistics are based on values
collected from 1985 to 1994.
Table 2.3: Improvement Statistics of Will-Burt from 1985-1994
Statistic Before (1985) After (1994)
Approximate Sales Per Year $400,000 $24 million
Hours Per Month for Reworking of Returns 2,000 to 4,000 Less than 25
ISO 9001 No Passed
Six-Sigma No Passed
Payroll Errors 33% 0.04%
Employee Turnover 35% 1%
As can be noted from the table, in a mere nine years the company went from making huge
mistakes and being almost liquidated to being extremely successful and renowned. What went
along with all of these numerical improvements was a vast employee morale boost. The tardy
rate of 100 to 200 per week in 1985 dropped to two in six months, recorded in 1994. Employees

32
took less sick days and absentee rate dropped as well. The benefits of total 100% training can be
seen very clearly here. There were moderate initial costs, but those were miniscule compared to
the increased value of the company after less than a decade. As a final remark, one of Will-
Burt‟s plant managers, Larry Murgatroyd, was quoted: “As technology keeps changing, we must
keep up with education. We‟re on a road here that‟s not going to stop. It‟s just going to keep
going and going and going. That‟s what we need to do [4]”.
2.3.3 Chaparral Steel and their “85% Always in Training” Practice
Gordon Forward started a steel mini-mills in Texas in 1975 with the challenge to become
the world‟s lowest cost steel producer. He focused mainly on a few particular ideas in order to
complete this, one of which was universal education. Another part of his main ideals was to keep
employee morale up, by some simple protocols as such having free coffee and no reserved
parking spaces. Many companies at the time saw it as normal to have approximately 10 to 20%
of their employees engaged in some sort of training at a time. Gordon felt that was inadequate.
He instituted a plan at Chaparral Steel that kept at least 85% of the workers involved in some
type of educational program at all times. These educational and training courses ranged from
electronics and metallurgy to credit history. Gordon felt that it was important to keep everyone
up to date, not only with the company and its practices, but with other things happening in other
aspects of business. Chaparral Steel provided many industrial sabbaticals as part of these training
programs. These trips would allow workers and supervisors to venture to many different
universities and other companies all around the world, to research and experience new types of
businesses and processes that they could apply to their work at Chaparral.
Through some of the knowledge learned by the employees in training and on sabbaticals,
allowed two maintenance workers to design a new machine for strapping the bundles of steel

33
together that cost $60,000 instead of the original one that cost $250,000. It also did the job much
faster and with less restrictions and more flexibility. Many of the employees together developed
a patent-pending technology that manufactured a final steel product with less than a fifth of the
amount of time involved. This process brought the 50 pass system down to a 10 to 12 pass
system. Through constant education and a higher morale of all employees, Chaparral Steel did in
fact become the fastest steel producing facility, with a record 1.4 hours of labor per ton, which
was much less than the 2.4 hours for other mini-mills and 4.9 hours for other integrated
producers. This greatly shows the value that constant training can have when it is mixed with
overall high employee morale in the workplace.
The next section describes the methodology behind Total Quality management. General
training and employee morale are a huge part of this and as well as continuous learning. It is
important for management to have ongoing processes to keep the company constantly changing
and adapting, such as aforementioned training and education. TQM is the overlying ideology that
supports this.
2.4 Quality Management Methods
There are two main goals of any company. The first is to provide a quality product or
service to a customer while the second is to be able to earn a profit from being the provider. In
order fulfill these goals in an efficient manner various methods of organization must be
implemented throughout a company. Very successful management philosophies include those of
Total Quality Management (TQM) and Quality Circles. In devising helpful methods to decrease
the amount of defective components, some of the principles associated with these philosophies
will be used.
34
2.4.1 Total Quality Management
Originating in Japan during the 1950‟s the popularity of practicing Total Quality
Management (TQM) has become progressively more popular in countries such as the United
States since the 1980‟s. TQM is a management technique focusing on a continuously improving
organization. This method of surveying quality has an emphasis on instituting new quality
standards for processes using management techniques and groundbreaking ideas. For TQM to be
effective in causing improvement there must be overall employee participation, including
involvement from all levels within the organization. Improving encompasses the quality and
efficiency of a product as well as the structure and culture of the organization. Quality is
determined by customer expectations. A customer is purchasing a product or service because
there is a need. This customer will undoubtedly have an expectation to the performance of the
product. A quality product or service is one that would exceed their expectations [5].
2.4.1.1 Management Commitment
Using the term commitment instead of involvement is a very important detail.
Involvement is identified as the halfway point to commitment. Commitment is the product from
the eventual feeling of empowerment caused by improvements [6]. It is possible to establish
management commitment by following the ideas of W. Edwards Deming and Philip B. Crosby.
The concepts presented by these men are a critical part of the foundation for the methodology of
this management technique. Both stressed the impact of management roles in the dedication to
quality improvement. Management positions need to be the first to initiate change. Those in
higher positions have the power and means to create an impact among other workers. The change
will either start or end with the leaders. In essence one has to lead by example. It is also
necessary for management to feel a strong commitment for implementing changes because the

35
leaders will need to enforce the preservation and acknowledgement of such changes. To
successfully implement changes throughout a company all parties must be included in their
commitment to attain a higher quality. Management is the most important part of instituting a
change in an organization. TQM isn‟t simply a managers program as a simple fix. It is a process
that is used to change permanently the current practices in an organization into continuously
improved ones. There is no finish line for TQM. It contributes to a permanent positive change
wherein it is implemented correctly. The supervisors are needed to ensure that steps are taken
companywide adapt new management methods. Dr. W. Edwards Deming created his outline of
management below for those holding leadership positions to carry out. He focused on the impact
of current aspects relating to philosophy of the workplace. This revolution of outlook associated
with the organization must be actively supported and carried out by leadership roles. Point 14
reinforces the fact that when starting to modify the processes,
Dr. W. EDWARDS DEMING‟S 14 POINTS [7]
1. Create constancy of purpose for improvement of product and service
2. Adopt the new philosophy of refusing to allow defects
3. Cease dependence on mass inspection and rely only on statistical control
4. Require suppliers to provide statistical evidence of quality
5. Constantly and forever improve production and service
6. Train all employees
7. Give all employees the proper tools to do the job right
8. Encourage communication and productivity
9. Encourage different departments to work together on problem solving
10. Eliminate posters and slogans that do not teach specific improvement methods
11. Use statistical methods to continuously improve quality and productivity
12. Eliminate all barriers to pride in workmanship
13. Provide ongoing retraining to keep pace with changing products, methods, etc.
14. Clearly define top management‟s permanent commitment to quality
organization and culture in a business must have the support of the company‟s leaders. Philip B.
Crosby also created a basis for achieving quality by creating his Quality Process below. His
outline of focus points reference first and second the concept of management and managerial
type teams. Both Deming and Crosby promote strongly the concept of total leadership

36
involvement for the TQM process, this reinforces the obvious importance of the role in
management when ensuring the success of implementing change. Attempting a change in a
company culture will need the assistance of all the human resources to create a smooth transition
[6].
CROSBY‟S QUALITY PROCESS [7]
1. Management
2. Quality improvement team
3. Quality Measurement
4. Cost of quality Evaluation
5. Awareness
6. Corrective action
7. Zero defects planning
8. Quality education
9. Zero defects day
10. Goal setting
11. Error cause removal
12. Recognition
13. Quality councils
14. Do it all over again
2.4.1.2. Employee Commitment and Communication
As mentioned previously it is essential to have participation at all levels of an
organization to successfully implement change using TQM. This management method is
dependent on the involvement of the personnel that are to be carrying out these processes.
Managers will promote this change and attempt to influence the employees they supervise to do
the same, but in most cases it is the employees that affect the result of the processes the most.
Only with employee commitment to the management methods and processes taking place will
improvement take place. The lack of employee involvement will inevitably cause the
improvement attempts to fail. It is very difficult to change a culture already established.
Employees become accustomed to a particular way of working, many people will have “you

37
can‟t teach an old dog new tricks” mindset. People fear change because it is unknown. However,
it is possible to make certain that employees will be able to accept new ideas more readily.
Creating a situation where employees will feel empowered by the implemented changes will
allow for easier transition. Participation, responsibility, a feeling of unification, and
communication are vital in enabling employee empowerment. Employees should be shown that
they are an important and respected part of improving the organization. Deming expresses the
importance an organization providing the optimal environment for employees. Organizations
should not only be providing all the necessary materials, but also create a setting where the new
philosophy can flourish [6].
Understanding the need for change may be difficult for some employees. Communication
and education are the keys to relaying the importance of the adjustments management are
attempting to institute. Crosby notes awareness in his Quality Process. It is crucial to have
awareness of the rationale for seeking new processes as well as the methods to be taken to obtain
an improving organization. It is important for those in a leadership position to make the
responsibilities clear to those they are overseeing. The less ambiguity and more concrete the
objectives presented are the easier it will be to understand and follow through with the intended
goal. Encouraging communication will greatly benefit all levels of the organization. Those in a
leadership position may not be in direct contact with the production of the product or service
being created for the customer. It is necessary for those who are in direct contact and deal with
the every day tasks associated with production to feel confident in communicating with a
supervisor.

38
2.4.2 Quality Circles
Quality Circles are a method of management most useful when implemented in
conjunction with Total Quality Management. Many companies have attempted to use Quality
Circles as a single management technique but did not develop this method to the potential that
would assist the company to increasing quality [5]. Quality Circles are groups of employees
made into teams who are to meet regularly to discuss topics including quality problems and
proposed solutions. In order for each team to be as productive as possible it is important to
follow a process. Offering Quality Circle training to all employees will make the idea of
involvement in a team less intimidating. As documented earlier, employee participation in
improvement processes will affect greatly the success of the method. Composition of the team is
also very important. Having a manager as a member of an employee team may stifle contribution
if some members lack confidence in some of their suggestions. The number of team members
can also affect the productivity of a team. If there are too many members per team, ideas and
concerns can be lost in large group discussions. An ideal size for a Quality Circle would range
from six to nine members. A close group of co-workers is an ideal situation to stimulate
employee empowerment. The small group would be able to provide support and assistance in
work related activities. There should also be a group representative, this position may rotate
depending on the consensus of the other members, their responsibilities simulate managing the
team [6].
The purpose of these teams are to use the experience of the employee to see what areas of
an organization need to be modified. The proposed solutions of the Quality Circles must be taken
seriously by management. If the suggestions given are ignored, the team will eventually
disintegrate losing the potential of the employees to contribute in the efforts in improving quality
39
and productivity. These teams have the ability to revamp an organization. Giving employees the
opportunity to communicate to higher positions by forming proposals in teams with their co-
workers will make the employees feel as if they “own” the company [8]. They will feel as though
their responsibilities affect directly the performance of the organization. Employees will take
pride in their work and not become robotic in their actions. Quality Circles can be helpful in both
creating a means to promote empowerment and instituting communication between employees
and supervisors.
2.4.3 Quality Case Studies
Total Quality Management has helped many organizations both small and large create a
beneficial structure of management. Dependant on the area needing extra support TQM can be
modified to improve quality and productivity of any organization. For example the Englehard-
Huntsville business focused their attention on the need for different management structure.
Management commitment was a problem and their company‟s well-being showed it.
2.4.3.1 Englehard-Huntsville: Impact of Management
Englehard – Huntsville is a major manufacturer of catalytic converters. Englehard
invented the converters in the early 1970‟s in Huntsville, Alabama where he set up a facility.
There the manufactured parts are created for controlling air emissions from automobiles, forklifts,
and stationary pollution sources [8]. Ten years after being an established manufacturing
company the productivity and quality of the product almost caused the plant to go bankrupt and
close. There was a defective rate of eighteen percent with a turnover of 150% per year. Also,
there were 22 working days lost due to accidents. At this time Joseph Steinreich became general
manager, and Englehard gave him six months to increase the productivity or the facility was to
shut down. Steinreich revamped the methods of management. There was a confrontational
40
management approach when he started and realized this was a major problem. He led a more
personable management technique starting with implementing a training program for supervisors.
It was at this time that supervisors were changed or replaced. There was also the founding of the
Quality Operating System in the Englehard-Huntsville company. This system has requirements
pertaining to customer focus, internal focus, and prevention focus [6]. This method adjusted
customer requirements to be employee requirements. As their method of total quality emerged
the company called it Exceptional Quality (EQ) [8]. All members of the organization are now
trained in EQ adhering to the twelve pledges including: be flexible and adaptable, work together,
train and empower each other, encourage innovation, promote long term relationships with
customers and fellow employees, and “provide management support and accountability for the
quality commitment and principles through direction, example, and appropriate resource
commitment” [8].
During the early 1990‟s employee and managerial staff began to recognize the extreme
amount of progress made. Many employees made comments regarding the assistance of
management in everyday activities and ease of communication with supervisors. The Englehard-
Huntsville plant transformed from a company on the edge of bankruptcy into a smooth running
organization. The turnover rate diminishing to under three percent a year and waste due to
defective components decreasing to less than one percent. In addition, productivity has amplified
to 324% producing more than 40,000 catalysts a year per worker. In the past nine years, there has
not been a single day lost due to any accidents occurring. Englehard-Huntsville has made quite a
turn around. During a time period of two years, they supplied Ford Motor Company with over 9
million catalysts, not one defective. The company‟s quality has become so well known that they
now are supplying 70% of the catalysts to the Japanese market. This transformation was
41
possible because of the implementation of various derivatives of Total Quality Management.
Optimizing certain aspects of TQM like management, communication and training and
modifying them to the organization provided the overall structural change necessary for
Englehard-Huntsville to be as successful as they have become [8].
2.4.3.2 Lyondell Petrochemical: Employee Empowerment
Lyondell Petrochemical was created in the early 1980‟s by Atlantic Richfield combining
the petrochemical and refining operations that were consuming resources without making a profit.
The Lyondell organization had lost $600 million in three years. Bob Gower was offered to run
the company and accepted the responsibility as a challenge. The company held no advantages
over any of its competitors, Bob Gower is quoted in saying “morale was low and costs were way
too high.” [8]. Gower started revolutionizing Lyondell by forming a strong management team
that believed in the same people-oriented method management methods as he did.
Employee empowerment is a focal point of the management team at Lyondell. Leaders
give responsibilities to employees using training techniques learned in “Managing the Lyondell
Way” as shown below [8].
Managing the Lyondell Way
1. Low-cost production
2. Quality
3. Entrepreneurship
4. Action oriented
5. People are the difference
6. Responsibility and accountability in all jobs
7. Teamwork
8. Communication
9. Safety of people
10. Social responsibilities and ethics
The majority of the points made in the management training outline focus on employee
participation and importance in the organization. This includes training to obtain the necessary
42
skills to perform efficiently and take responsibility for their work. Training gives a feeling of
confidence in completing work knowledgably. When empowered, the employees work more
effectively. They were given new roles and opportunities based on their performances. The
opportunities for improved positions are encouraged. Employees have a management sponsor
who is available for guidance, instruction, and support. These sponsors evaluate current progress
and give detailed feedback to employees. There is also a performance review each year to
evaluate performance in regard to “Managing the Lyondell Way”. Significant improvement is
rewarded and recognized by pay increase and company acknowledgement.
Another method used to encourage employee communication at Lyondell is a suggestion
system called Quality Improvement Ideas. These suggestions, submitted by employees, are taken
seriously and receive immediate attention. Employees are kept informed of the status of their
suggestion until implementation. Lyondell pushes to acknowledge the importance of employee
perspective. The suggestions given via the Quality Improvement Ideas have saved the company
over $41 million dollars since its‟ creation in 1985 [8].
Lyondell also used Quality Circles to establish employee empowerment. They shifted the
emphasis to self-directed work teams. These groups take initiative on implementing suggestions.
They look closely into employees when creating a team. Group dynamics are a very important
aspect of a successful team. Lyondell recognized this and instituted a training regimen in regard
to group dynamics. For example, if a team member isn‟t completing their responsibilities, there
is training to be able to manage the situation. Steps are taken to selecting team members that
would work well together as well as arranging rotation of power and responsibilities for
members to within the group [8]. There is also cross training of members in a team. This is to
ensure a competency of all responsibilities required of each member of the team.
43
Lyondell Petrochemical used techniques to stimulate the employee commitment aspect of
Total Quality Management. Using methods of communication, training, and recognition assisted
in developing empowerment among employees company-wide. The philosophy of “people are
the difference” influenced their management methods towards self –directed Quality Circles.
This gives more power and responsibilities to employees, creating a sense of pride. Instilling
confidence into employees has allowed for Lyondell Petrochemical to become a respectable
organization instead of just a challenge [8].
Lean Manufacturing, training programs and Total Quality Management are all techniques
for increasing productivity and decreasing waste produced within an organization. Our group
will combine the key aspects of these management methods to form realistic and applicable
solutions to rectify the root causes of defects at Company A. The next section consists of an
analysis of the root causes of this problem and as well as possible solutions based on the above
research.

44
Chapter 3 – Problem Formulation and Solutions
The following chapter discusses the approaches by which the project group was able to
identify the problems at Company A and develop correspond solutions. The first section explains
the line of reasoning that went into discovering where exactly in manufacturing lines are
defective components are created. From the very first observations of the manufacturing facility,
the problems at hand began to take form. After extensive data collection and analysis, our initial
hypothesis was proved. The hypothesis was that the creation of defective parts was not due to
machine-tool failures or break downs, but it was with the workers themselves. Any solution that
could be proposed would have to alleviate the problems the workers were having and
correspondingly decrease the number of defective parts being created.
Company A is based in Worcester, Massachusetts. They produce many different
products using mainly CNC machining. These products include: aerospace, defensive firearms,
sporting goods, medical devices, and other special contracts brought to them by customers. The
MQP group worked exclusively with the manufacturing of firearm components.
3.1 Problem Formulation
One of the main reasons for the group‟s involvement was to take a fresh look at the
problem of creating defective parts at Company A. The project group‟s first exposure to the
company was through a tour of the manufacturing facility with one of the production supervisors.
We were able to see the whole manufacturing infrastructure, from the manufacturing floor to the
storage and shipment areas. It was management‟s hope that a fresh perspective on these areas
would help bring about positive changes. Even at such an early stage of the project, the problems
became apparent. Problems ranging from clutter of raw materials on the floor to poor employee
morale were obvious from the offset. With an initial hypothesis as a starting point, the group
45
began to collect data that would help to pinpoint the exact causes of making defective parts. As
the data began to prove our initial hypotheses, possible solutions to problems began forming. The
fact that a majority of the problems are associated with human errors means that our solutions
and ideas would be dealing almost exclusively with human problems rather than machine
problems. The feasibility of the solutions is investigated. Some solutions are discarded as
unrealistic because they do not match the resource capacity of Company A. Those that match are
developed further. Since the problem at hand is rooted in the culture at Company A, drastic
measure is needed to be taken to deal with it. There is no magic solution that is both effective
and easy to implement. The solutions that the group proposed required major changes in thinking
across in the Manufacturing infrastructure of Company A. Only through such changes would it
be possible for Company A to eliminate its problems of making defective parts and not meeting
customers‟ needs.
3.1.1 Initial Observations
The problem at Company A was not difficult to see even after just a tour of the
manufacturing facility. Our initial observations of the facility were surprising. Raw materials and
part bins were scattered across the facility with almost no apparent organization. There were oil
and coolant spills all over the floor, surfaces did not seem to have been cleaned and papers at the
machine work stations were filthy as well. That was not necessarily a major problem, as even
some of the best machine shops in the world are just as dirty if not dirtier. Regardless, it was a
problem that needed to be investigated. While there were safety goggles and gloves provided,
few workers took advantage of them and others chose to take the risks involved without wearing
goggles. All together, the working conditions were not optimal and did not provide a good
working environment. It was clear that there were many more components not machined and raw

46
stock on the floor than were needed. The main receiving area was incorporated into the
manufacturing area itself. For storage areas, there were shelves against the walls on every side of
the facility holding everything from raw material to finished products to old, broken fixtures.
Unfortunately, there was not enough space for everything on the wall and so there was a
significant amount of loose objects scattered across the floor. This included a large cage that
housed parts that could be classified as firearms, and needed to be secured for legal reasons. This
cage was placed right at the entrance of the facility and really obstructed any kind of organized
flow in the manufacturing processes.
Figure 3.1: Layout of the Manufacturing Floor
47
Figure 3.1 shows a schematic of the manufacturing floor with several key areas
highlighted including the shipping and receiving area as well as the major storage areas. There
was no real floor plan; everything was kept in whatever area was available at the time. The
security cage was right next to the entrance, interfering with any manufacturing flow. Broken
and unused fixtures were just piled up in the fixture storage area. Parts that had been machined,
but were not yet finished, were placed in bins right next to the machine they were needed at next.
Employees needed to step over these to reach other stations and even just to move around their
own station. The following pictures in Figure3.2 better illustrate the clutter and disorganized
fashion in which material was stored.
Figure 3.2: Receiving Area and Storage for Raw Materials and Chips
Figure 3.2 shows the area used for storage near the receiving area. The left picture shows
the edges of several machines with the storage bins stacked right up to them. There is almost no
room to walk in this area due to the overflow of material. Barrels of chips are placed so they
block the aisle and even much of the receiving area. In the right picture, bars of raw material are
stacked haphazardly on the sides of a sawing machine. This illustrates a safety problem as well
as an organizational one.

48
Figure 3.3: Fixture Storage Area
The area shown in Figure 3.3 is used for storage of unused fixtures as well as carts, bins,
and many other loose objects. Upon inspection of the fixtures and bins it was clear that they had
not been used for some time. There is no point in having things take up space on the floor if they
are not going to be used in the near future. Judging from the previous set of pictures, this area
could be used to handle some of the overflow from the raw material storage and prevent the
overcrowding seen there.
The project group also spoke with several workers and supervisors about their
responsibilities and any problems they knew of. The operators of the machines were responsible
for loading and unloading the machines after each run. They were also assigned inspection of the
parts they had finished machining. These actions are very repetitive, and over an eight-hour shift
can become very monotonous and cause the worker to lose focus. Supervisors were performing
many tasks such as unloading trucks, setting up machines, and running machines. There was
almost no actual supervising involved, the supervisors were too busy with odd jobs. Essentially,
everyone on the floor was very busy, perhaps too busy, during their shifts.
49
From the conversations with several of the workers, it was clear that many were recent
immigrants and had varying degrees of difficulty communicating in English. This would make it
much harder for a supervisor to explain things to them as well as for the operator himself to
report problems. The languages spoken by the employees include English, Japanese, Albanian,
Polish, and Vietnamese. The majority of the operators speak Albanian while the engineers all
speak Japanese. Some in both groups speak English as well, but there are others that only speak
their native language. This creates a barrier between operators and engineers which does not
have to exist. A common language between all employees would help smooth the lines of
communication between departments.
The group‟s first trip to the company revealed many possible candidates for the root
cause of the defective parts. Problems could arise from everything discussed above, but was any
one of them enough to explain the abnormally high defect rate at Company A? The next step in
the investigation was to collect data that would help pinpoint where the problems were coming
from. The major problems identified focused mainly around employee morale and the conditions
that they worked in. This would be the focus of the group‟s work to see if our first impressions
were correct.
3.1.2 Data Collection and Analysis
The data collection phase of this project centered on gathering and interpreting data that
would either prove or disprove our assumptions. This data came from different departments
including Quality Control, Management, and Engineering. As it turned out, the data corroborated
the group‟s initial suspicions and opened up many possibilities for solutions.
The original plan for information gathering was to use Value Stream Mapping to go
through the manufacturing processes of three items currently in production. Then through an

50
analysis of the processes could possible sources for error be detected. The group was to work
with the production supervisor to gather the necessary information. However, this supervisor was
too busy every time the group was at Company A, and proved very unhelpful. As was mentioned
in the initial observations, many of the employees were too busy to spare any time. The group
then decided to focus on gathering data that the employees could provide expending little effort
or time.
The most obvious place to start looking for information on defective components was the
Quality Control department. Their job was very similar, if not identical, to that of the project
group‟s: to eliminate the creation of defective parts. The process that was used here involved
collecting the parts that had been identified as defective, and trying to interpret what went wrong.
These inspections occurred after every process and were performed by the operator themselves.
These consisted of a simple “Go, No-Go” system that used dimensioned pegs to determine if the
part‟s features were in tolerance. There were also final inspections that took place right before
the part was shipped out. A defect would cost the company much less if it is caught sooner rather
then later. A member of the quality control department would then collect the rejected parts from
every station and records where the problem took place, what the problem was, and the
suspected cause. These causes ranged from human errors to machine problems, to problems with
the raw material. Every defect from that day was then compiled into a report and saved. Any
trends could be detected and acted upon quickly to prevent more defects from occurring. The
only problem with this was that no one at Company A was taking action against any trends that
presented themselves. The main reason that QC was unable to really stop the creation of
defective parts was that they are too busy with their day to day responsibilities. These also

51
included inspecting the raw materials shipped in and reworking parts, so there was little time to
perform a company-wide analysis for the causes of part defects.
Figure 3.4: Example of a Quality Control Report
It was clear from talking to members of the Quality Control department that they believed
the major source of error was due to human error. The group felt then that the Value Stream
Mapping of the processes would not help since the problem had already been identified. Also,
the problem was not with the machining processes, but with the operators themselves. Had Value
Stream Mapping been used, much time would have been taken up, yet the same conclusion
would have been drawn. Using all the Quality Control defective part reports from a one month
period, the data was compiled and analyzed to determine why the defects were taking place. The
following chart was created to clearly illustrate the main cause of the defective components.
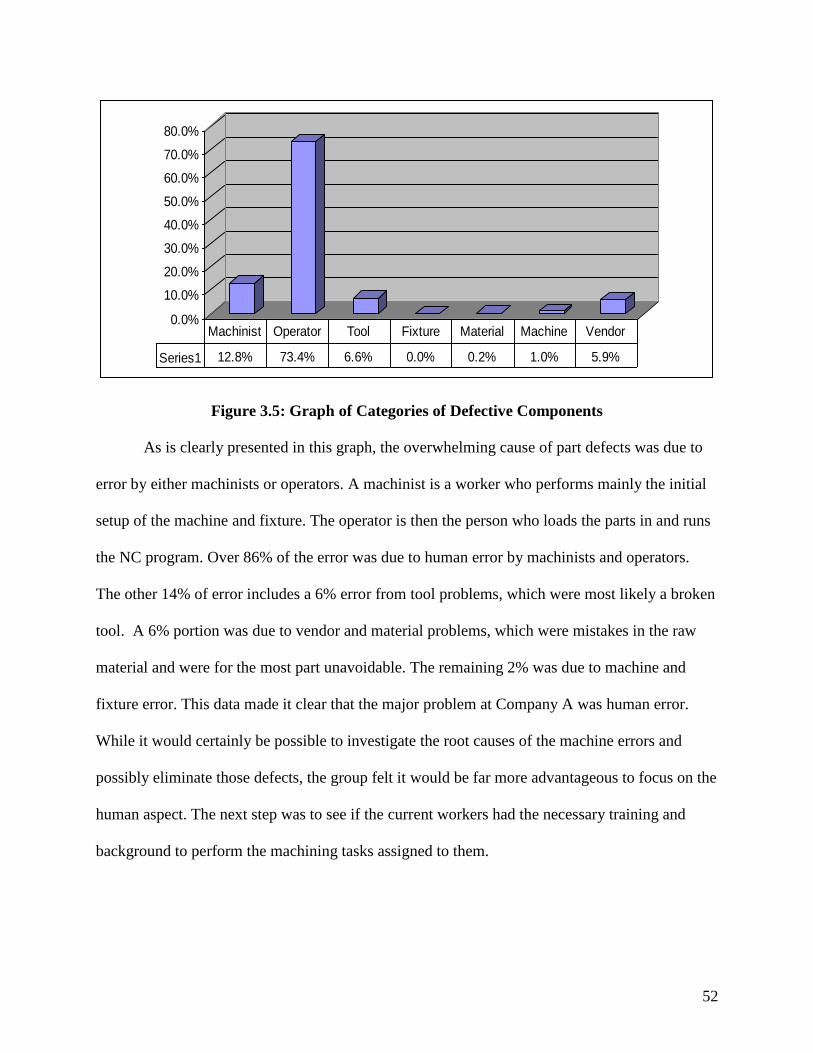
52
0.0%
10.0%
20.0%
30.0%
40.0%
50.0%
60.0%
70.0%
80.0%
Series1 12.8% 73.4% 6.6% 0.0% 0.2% 1.0% 5.9%
Machinist Operator Tool Fixture Material Machine Vendor
Figure 3.5: Graph of Categories of Defective Components
As is clearly presented in this graph, the overwhelming cause of part defects was due to
error by either machinists or operators. A machinist is a worker who performs mainly the initial
setup of the machine and fixture. The operator is then the person who loads the parts in and runs
the NC program. Over 86% of the error was due to human error by machinists and operators.
The other 14% of error includes a 6% error from tool problems, which were most likely a broken
tool. A 6% portion was due to vendor and material problems, which were mistakes in the raw
material and were for the most part unavoidable. The remaining 2% was due to machine and
fixture error. This data made it clear that the major problem at Company A was human error.
While it would certainly be possible to investigate the root causes of the machine errors and
possibly eliminate those defects, the group felt it would be far more advantageous to focus on the
human aspect. The next step was to see if the current workers had the necessary training and
background to perform the machining tasks assigned to them.

53
3.1.2.1 Employee Background
Management provided all the operator and machinist job applications that they had on
file, which included many of the employees currently working there. These applications were
analyzed in order to investigate the educational background as well as prior job experience of the
workforce. The job application itself was a pretty standard application. It included contact
information, educational background, and prior work experience. All the applications were
looked over and analyzed to see the specific background that each employee had and whether it
seemed adequate for a CNC machining job. The results were tabulated and made into the follow
graphs.
0.0%
10.0%
20.0%
30.0%
40.0%
50.0%
60.0%
Series1 55.2% 27.6% 17.2%
High School Associate's Bachelor's
Figure 3.6: Graph of Educational Background
Figure 3.6 shows the highest level of education that the current employees had achieved.
While many of the associate‟s and bachelor‟s degree recipients had their degrees in technical
fields, they were not necessarily trained specifically in CNC machining there. More than half of
the employees were only high school educated and had no formal manufacturing training, least

54
of all in CNC machining. The following graph illustrates the relevant job experience that the
employees had accumulated before working at Company A.
0.0%
5.0%
10.0%
15.0%
20.0%
25.0%
30.0%
35.0%
Series1 27.6% 34.5% 24.1% 13.8%
None Manufacturing CNC Machining Extensive CNC
Figure 3.7: Graph of Prior Relevant Work Experience
As can be seen in Figure 3.7, less then 40% of the employees had any experience in CNC
machining and fewer then 14% had more then ten years in the field. About 35% had experience
in another manufacturing field that did not include machining. The most common fields included
die casting and welding. The other 28% had no job experience that was relevant to machining.
When coupled with the information from the previous graph, it is clear that many employees
lacked the required background for machining. Also, many of those with good backgrounds in
CNC machining were also those with higher education. What this means is that there are several
well-trained employees who act as supervisors and setup machinists and many untrained
employees who work as the operators. Of course this means that when new hires arrive at
Company A, they most likely are not adequately trained for the job they are hired for. If the
company had an effective training program in place, this may not have been a problem.
It turned out that the opposite was true. Company A had no formal training program in
place for either new or current employees. When a new operator was hired, he was assigned to a

55
more experienced operator, and shadowed him for about two weeks before going to work on his
own. What this meant for the company was that few of the operators truly understood what the
machine was actually doing and could not prevent mistakes from occurring as effectively as they
should. There was no guarantee that the impromptu instructor knew exactly what was going on
either. Current employees did not receive any formal training either. Much of what they learned
was procedural and done through trial and error rather then an organized learning process. This
made it very difficult for an operator to advance in skill or in job responsibility.
This leads right into the next problem: that of low employee morale. One of the best
indicators of morale is employee retention. Obviously happy employees would not want to leave
their job for a new one. The retention at Company A was not good, with many employees
leaving the minute a better paying job opened up for them. The employee turnover rate last year
was over 37%. There are several factors that influence morale including opportunity for
advancement, pay raises, and working conditions. Due to the lack of formal training, there really
was little opportunity for many of the workers to advance up in the company. Many employees
made little more then minimum wage and could not look forward to making much more than that
in the future if they stayed with the company. With the high rate of defective parts, there was just
not enough money in the budget for these raises or for training, for that matter. Ironically, a
major argument against training at Company A was the futility of training employees who will
just leave soon anyway. Working conditions were also very poor, due to disorganization and
aforementioned safety issues. Poor employee morale had a large impact on the problems already
present at Company A. There was a culture built around the principle that creating defective
parts was acceptable and even considered unavoidable. Employees that considered their jobs to

56
be temporary rather then careers had no stake in the health of the company. They got paid the
same whether or not the parts they made were good or defective.
3.1.2.2 Organization of Raw Stock
With this in mind the group evaluated the manufacturing floor with respect to the level of
organization. Starting with the beginning of the manufacturing process, we looked at how the
raw stock was arranged. Shipments of materials are brought into the manufacturing floor on the
left side of the building (see Figure 3.9). Once shipments are received the left side of the facility
is dedicated to holding these materials. As shown in the figures below there is no structure to raw
stock shipments. This creates unnecessary clutter and decreases the area that could be otherwise
used to house more machines. The availability of more machines would allow for the production
of components to increase drastically.
Figure 3.8: A Shelf with Various Raw Stock Materials
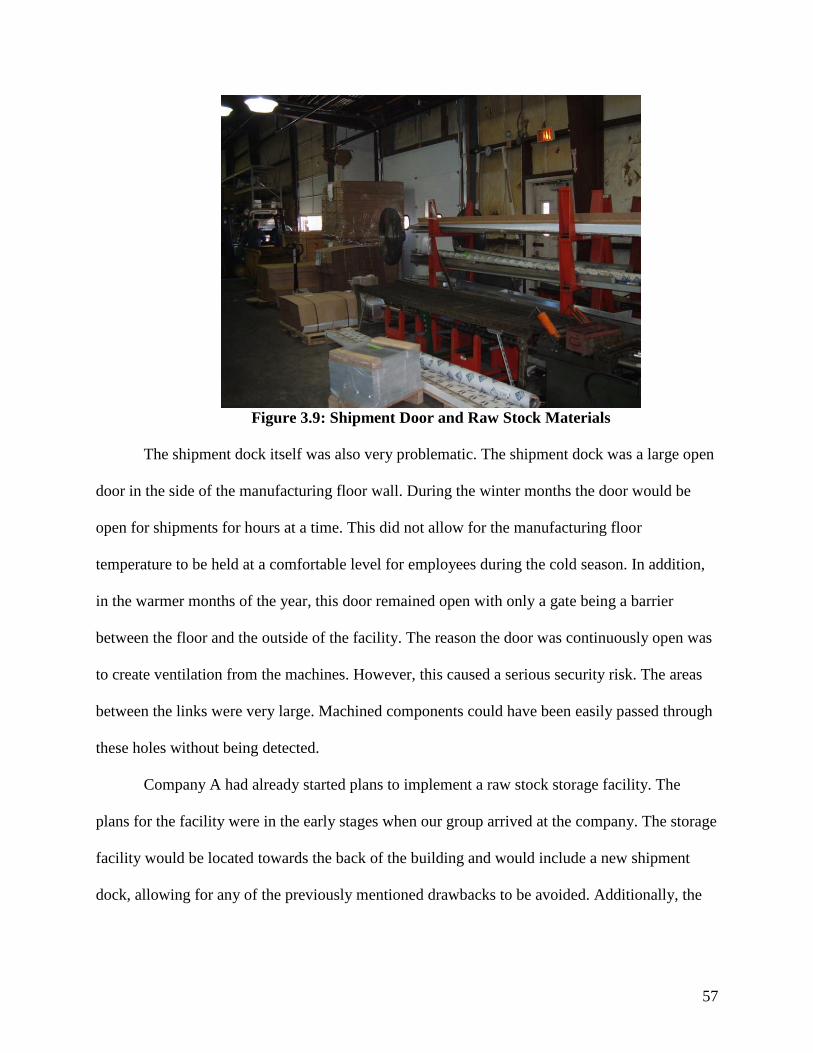
57
Figure 3.9: Shipment Door and Raw Stock Materials
The shipment dock itself was also very problematic. The shipment dock was a large open
door in the side of the manufacturing floor wall. During the winter months the door would be
open for shipments for hours at a time. This did not allow for the manufacturing floor
temperature to be held at a comfortable level for employees during the cold season. In addition,
in the warmer months of the year, this door remained open with only a gate being a barrier
between the floor and the outside of the facility. The reason the door was continuously open was
to create ventilation from the machines. However, this caused a serious security risk. The areas
between the links were very large. Machined components could have been easily passed through
these holes without being detected.
Company A had already started plans to implement a raw stock storage facility. The
plans for the facility were in the early stages when our group arrived at the company. The storage
facility would be located towards the back of the building and would include a new shipment
dock, allowing for any of the previously mentioned drawbacks to be avoided. Additionally, the
58
shipment dock will be removed from the machining area which will make it much more difficult
for those intended on removing machined components to do so inconspicuously.
3.1.2.3 Work Station and Part Organization
The next step of evaluating the floor organization was examining the individual work
stations at each CNC machine. Upon initial evaluation of the floor, each work station was
cluttered with multiple implements used to inspect recently machined components, rags, and
various working drawings. The disorderly manner of the stations will only negatively affect the
production of effective components. After each machining process operators were to inspect the
components features using particular instruments for each feature. If there were too many
instruments on the work station, it is possible that the wrong device was used. Our project group
was shown into Company A‟s assembly area to observe the work stations of employees involved
with assembling the completed components. These work stations were neatly organized with
specific containers designed and labeled for assembly parts. The structure of these work stations
was created by a past WPI student doing their Major Qualifying Project. This level of
organization is needed out on the manufacturing floor.
After machined, the components that pass inspection would be placed in large plastic
boxes and were put on the floor under the workbench, in the aisle, or in between machines. This
not only caused a safety hazard by having clutter in passageways, but also created a hazard by
not efficiently tracking machined components. With the Massachusetts gun laws becoming
stricter, it was imperative for the components that could possibly become functioning firearms to
be closely monitored. It was required by the state for the facility to have a caged storage area to
house components that could be assembled into a firearm. However, some components that are
not required to be locked in the cage needed only a few more features machined to create an

59
operational firearm. Company A had attempted to take precautions to having components carried
out of the facility. There was a metal detector located near the exit that employees must pass
through at the end of a shift. Although this was sometimes helpful, there was still a possibility of
near complete components leaving the facility.
3.1.3 Conclusions from Data
All the data gathered above proved the group‟s initial hypothesis. The vast majority of
defective parts were made through human error. These were for the most part simple mistakes as
a result of inadequate experience on the part of the machine operators. Company A did not have
the money to pay highly skilled machinists and tried to save money by employing low cost,
untrained workers. This strategy entailed that many workers were not adequately prepared for the
jobs they were responsible for. In retrospect, the high rate of defects was not surprising, given
this information.
With the money lost due to defective parts, the prices of Company A‟s products must
correspondingly increase to cover that cost. The customers have been willing to pay these higher
prices, but with increasing competition, this may not last long. Low cost labor is not a strength of
American-based manufacturing. If that is the route Company A decides to take, the end result
will be outsourced operations if not the collapse of the company. The solutions to this problem
must fundamentally change the corporate mindset to empower its employees and stop the trend
towards cheap labor.
While at the outset of the project, the focus was on finding problems with the machining
processes, the real problem turned out to be with the human aspect of manufacturing. The
direction of the project may have shifted, but the original goal remained the same: to eliminate
the root causes of part defects. That root cause was the personnel performing far too complicated

60
machining tasks for their level of training. Other contributing factors included a disorganized
manufacturing floor and poor employee morale. With the problem properly identified, possible
solutions were developed and their feasibility investigated.
3.2 Proposed Solutions
Worker morale and efficiency is greatly affected by the aesthetics and organization of the
workplace. Aesthetics will affect worker morale by creating a sense of pride and quality of
product. By looking into the case studies in Chapter 2, worker morale is a very important factor
to increasing efficiency. The absence of an automated manufacturing facility puts the majority of
production emphasis on the floor employees Therefore implementing various methods of
assisting these employees is a main part of the group overall goal. The solutions suggested focus
around organization of the workplace, from machine workstations to placement of raw stock and
machined parts.
3.2.1 Organization of Work Station
At a meeting in late January our group presented to the managerial staff at Company A.
The presentation included some of our concerns of the organization of the work stations. The
importance of organization on morale was discussed in depth. Both parties agreed that the impact
of restoring organization would be vital. Since that meeting there has been a dramatic change in
the organization of the individual work areas. Signs indicating the importance and responsibility
of employees to keep an organized work station are now present within the manufacturing floor.
It is clear that the employees have taken heed to this new proposal. There is now a clear
format to each of the stations. An area dedicated to inspection and measurement, an area for
working drawings and documents related to the component design, and an open area to place
61
components for inspection. These changes may be small steps but will have a large impact in the
long run in regard to further organizational attempts.
3.2.2 Creation of a Storage Container
Having a centralized component storage container would help with security factors and in
decreasing clutter created by current component containers. This area would be dedicated solely
to the organization and storage of components. At the start of every shift, workers could pull
what they need out of this area. The area would be mostly an open facility however would
contain an area for the parts only requiring the last few operations to be secured. Accessing the
secure section of this facility would require only the employees permitted to use a key code to be
granted entrance. That way only these components that were being machined are out on the floor,
diminishing the amount of containers taking up space near machines. This component storage
container could be designed to fit within the facility of Company A. There was a wide area being
used to store unused fixtures. These fixtures did not rotate into any of the machines because they
have been replaced by either new or updated ones. The figure on the following page indicates the
open area initially chosen for the storage facility. The area labeled component containment
facility will be transformed from the fixture storage.
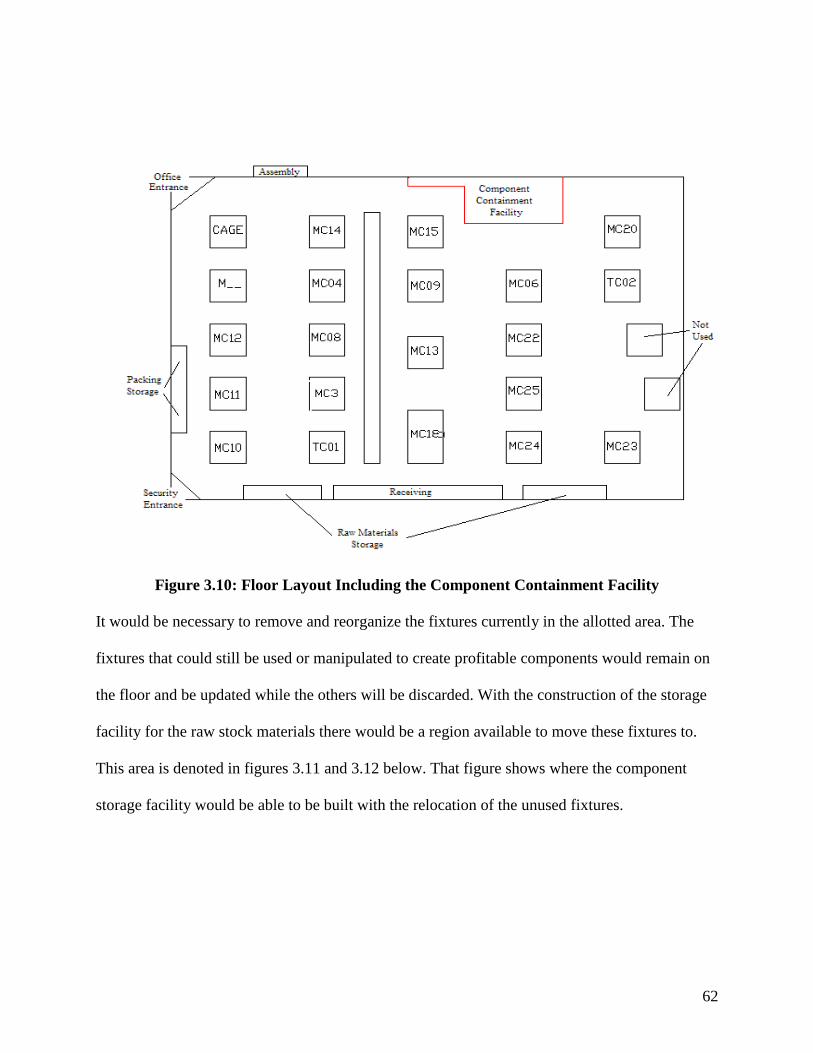
62
Figure 3.10: Floor Layout Including the Component Containment Facility
It would be necessary to remove and reorganize the fixtures currently in the allotted area. The
fixtures that could still be used or manipulated to create profitable components would remain on
the floor and be updated while the others will be discarded. With the construction of the storage
facility for the raw stock materials there would be a region available to move these fixtures to.
This area is denoted in figures 3.11 and 3.12 below. That figure shows where the component
storage facility would be able to be built with the relocation of the unused fixtures.
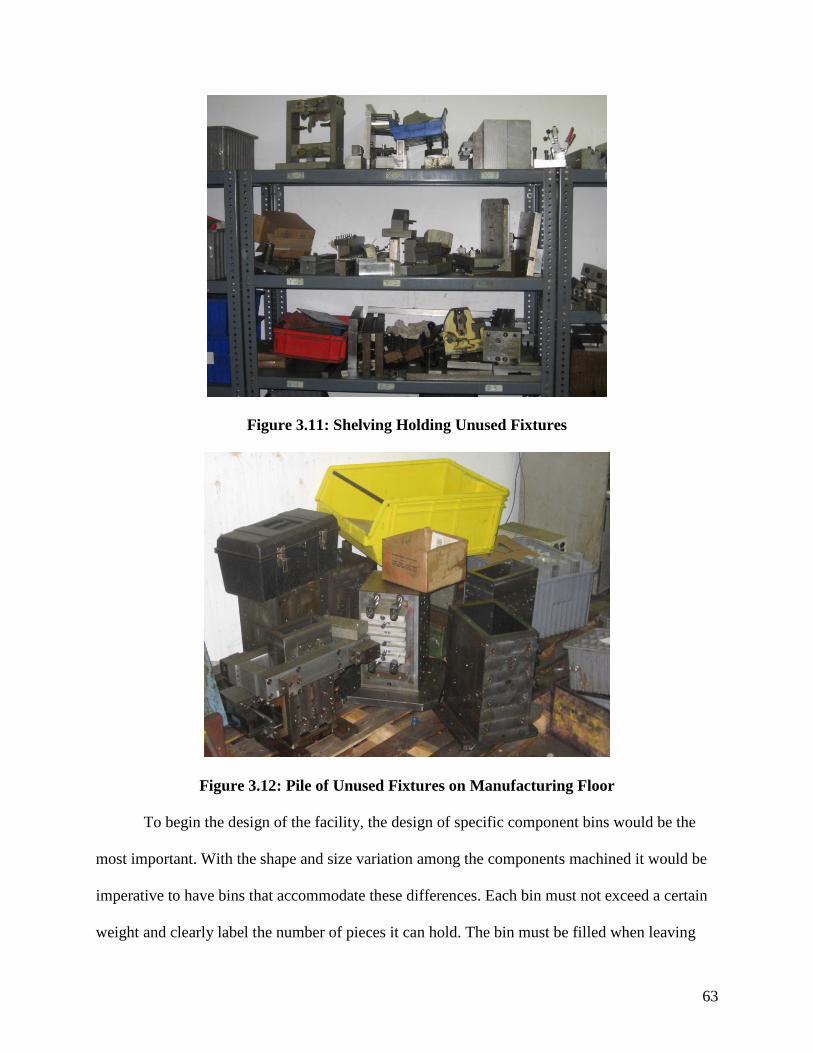
63
Figure 3.11: Shelving Holding Unused Fixtures
Figure 3.12: Pile of Unused Fixtures on Manufacturing Floor
To begin the design of the facility, the design of specific component bins would be the
most important. With the shape and size variation among the components machined it would be
imperative to have bins that accommodate these differences. Each bin must not exceed a certain
weight and clearly label the number of pieces it can hold. The bin must be filled when leaving

64
the component storage facility, that way defects or missing components would be easily noticed.
Because the barrel components of the M1 Carbine were very long and thin (shown on the
following page), they are stored in bins with the barrels held upright.
Figure 3.13: Bins for M1 Carbine Barrels
Although this allowed for a larger number of components to be held in a bin, the weight
of the bin was extreme. The bins for all of the various models would be as similar in outer
dimensions as possible. These individual containers would have shelving units assigned to them
in the containment facility. The lighter component containers would be located on the high
shelves for safety precautions. Also, in order to collect the necessary bins on high shelves, height
adjustable rolling carts would be available.
3.2.3 Tracking Involved with the Container Facility
As employees gathered all of their needed components from the storage facility, it would
be mandatory to log what is taken. Logging out components would require recording machinist,
operator, and machine. This would create a system where cases of defective components can be

65
looked into more easily by having important information already documented. Future additions
to the component storage container facility would expand to having an employee dedicated to
monitoring the flow of components. This employee would also monitor the amount of defects
created, gather them and provide the Quality Control department with them and their log-out
information. Providing this department with all the information needed to document and
investigate defective components would save time and allow for a more detailed report of defect
causes. Since the Quality Control department of Company A would have information regarding
machinists and operators for defective pieces; they would be able to assess employee efficiency
relative to defective components machined. As previously discussed, prior employee experience
was a contribution to machining defective components. Evaluation of the amount of defects
created by each employee relative to the level of difficulty of the part should delegate
responsibilities.
3.3 Hiring Screening Processes
Information from management at Company A made it very clear that there was an issue
with the current employees. This issue was that very few of them seemed to want or enjoy their
job. As aforementioned, many of the employees saw their employment at Company A as simply
a job, not a long term career; they were just there for a paycheck. Management felt that this is
due to the fact that there was really no system in place to select the right people for the job. Prior
to September 11, 2001, there was a hiring screen of sorts in place, to help Company A chose
competent and enthusiastic workers. Due to the drop off of the economy after 9-11, this screen
was discarded, and the only system in place to hire workers was a simple application, much like
that of a supermarket or clothing store. This application can be seen in the Appendix I. The plan
was to create a new application and hiring screen that would prove more useful in selecting the
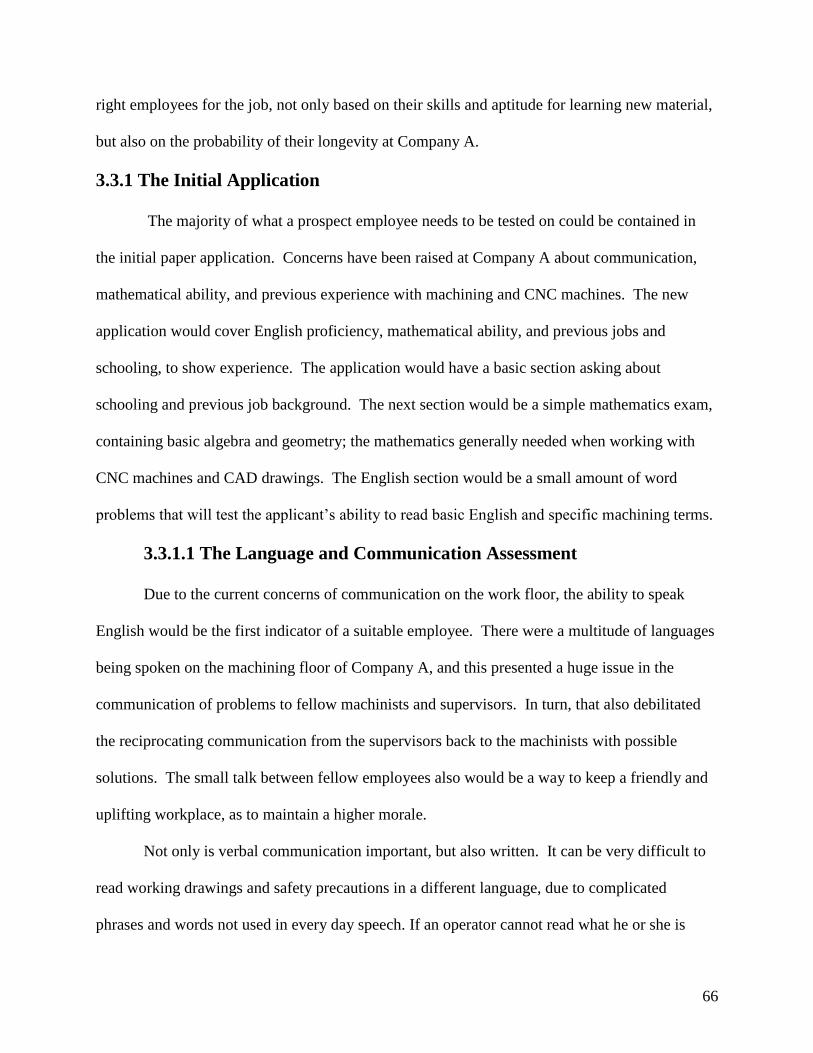
66
right employees for the job, not only based on their skills and aptitude for learning new material,
but also on the probability of their longevity at Company A.
3.3.1 The Initial Application
The majority of what a prospect employee needs to be tested on could be contained in
the initial paper application. Concerns have been raised at Company A about communication,
mathematical ability, and previous experience with machining and CNC machines. The new
application would cover English proficiency, mathematical ability, and previous jobs and
schooling, to show experience. The application would have a basic section asking about
schooling and previous job background. The next section would be a simple mathematics exam,
containing basic algebra and geometry; the mathematics generally needed when working with
CNC machines and CAD drawings. The English section would be a small amount of word
problems that will test the applicant‟s ability to read basic English and specific machining terms.
3.3.1.1 The Language and Communication Assessment
Due to the current concerns of communication on the work floor, the ability to speak
English would be the first indicator of a suitable employee. There were a multitude of languages
being spoken on the machining floor of Company A, and this presented a huge issue in the
communication of problems to fellow machinists and supervisors. In turn, that also debilitated
the reciprocating communication from the supervisors back to the machinists with possible
solutions. The small talk between fellow employees also would be a way to keep a friendly and
uplifting workplace, as to maintain a higher morale.
Not only is verbal communication important, but also written. It can be very difficult to
read working drawings and safety precautions in a different language, due to complicated
phrases and words not used in every day speech. If an operator cannot read what he or she is
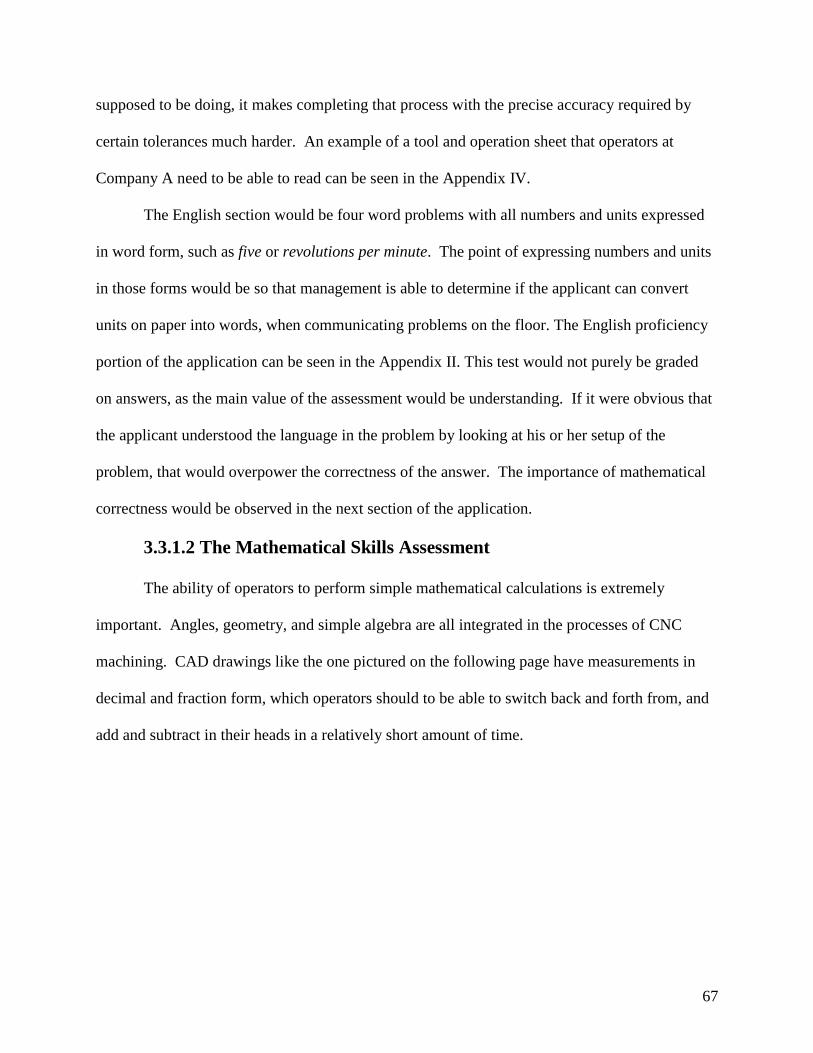
67
supposed to be doing, it makes completing that process with the precise accuracy required by
certain tolerances much harder. An example of a tool and operation sheet that operators at
Company A need to be able to read can be seen in the Appendix IV.
The English section would be four word problems with all numbers and units expressed
in word form, such as five or revolutions per minute. The point of expressing numbers and units
in those forms would be so that management is able to determine if the applicant can convert
units on paper into words, when communicating problems on the floor. The English proficiency
portion of the application can be seen in the Appendix II. This test would not purely be graded
on answers, as the main value of the assessment would be understanding. If it were obvious that
the applicant understood the language in the problem by looking at his or her setup of the
problem, that would overpower the correctness of the answer. The importance of mathematical
correctness would be observed in the next section of the application.
3.3.1.2 The Mathematical Skills Assessment
The ability of operators to perform simple mathematical calculations is extremely
important. Angles, geometry, and simple algebra are all integrated in the processes of CNC
machining. CAD drawings like the one pictured on the following page have measurements in
decimal and fraction form, which operators should to be able to switch back and forth from, and
add and subtract in their heads in a relatively short amount of time.
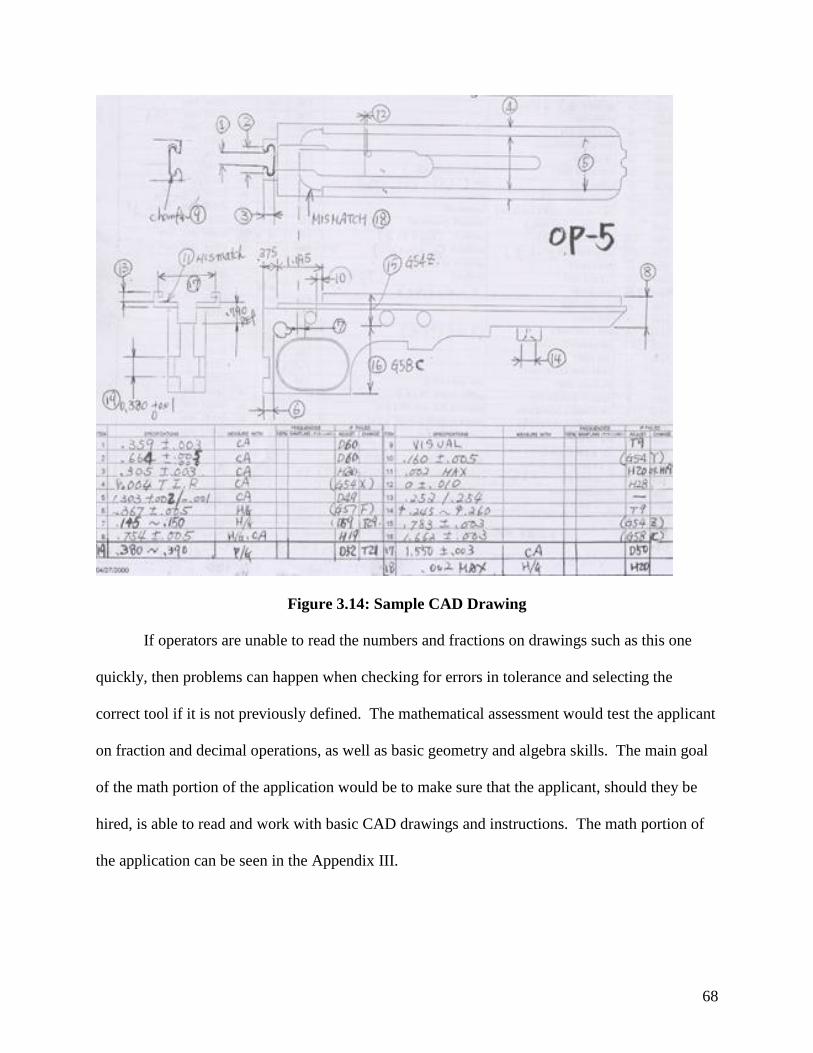
68
Figure 3.14: Sample CAD Drawing
If operators are unable to read the numbers and fractions on drawings such as this one
quickly, then problems can happen when checking for errors in tolerance and selecting the
correct tool if it is not previously defined. The mathematical assessment would test the applicant
on fraction and decimal operations, as well as basic geometry and algebra skills. The main goal
of the math portion of the application would be to make sure that the applicant, should they be
hired, is able to read and work with basic CAD drawings and instructions. The math portion of
the application can be seen in the Appendix III.
69
3.3.2 The Interview and Application Follow-up
An ongoing issue at Company A was employee longevity. At the interview of a hopeful
employee the management in charge of hiring should be able to see whether or not the applicant
wants just a job and a paycheck, or a career. It would be in Company A‟s best interest to hire
workers that would stay with them longer, to keep the gained experience and knowledge within
the company. Also, should the company decide to train and retrain new and current employees,
it would be most cost effective if the employees were going to be around for longer. Therefore,
it would be important at the interview that management makes sure that the employee is looking
to stay with the company and is eager for improvement through the ranks.
At the interview an effective evaluation of an incoming employee should be able to
determine if they meet the minimum requirements for the simplest machining operations, such as
a drilling or working a lathe. Based on previous experience and schooling, the employee could
be assigned certain operating jobs, starting with the simpler ones and moving up. Worker
performance could be monitored, and through effective training, the worker could make their
way up to more complicated tasks, and thus earn a higher wage. This brings up the training and
retraining of employees, which will be covered in the following section.
3.4 Employee Training
Through inspection of defective component causes at Company A in the problem
identification phase of the project, the lack of training became apparent. The background of
many employees proved upon inspection to be insufficient as well. Very few employees showed
evidence of adequate training for the job at hand. In combination with the hiring screen previous
described, training of new employees and retraining of current employees would benefit
70
Company A. The hiring screen would provide workers with some background, but also workers
that are more likely to stay at the company, thus making training worth the money.
3.4.1 Incoming Training
With the new hiring system in place, the knowledge of all new employees would be
known well enough so that training could be implemented to fill in any gaps in their existing
knowledge. Training specific to the processes and machines would be supplied so that the
workers begin their careers with the necessary know how. Depending on the new operator‟s
background and initial proficiency, they would be assigned to a certain level of difficulty,
starting at drilling and working up to more complicated processes, as mentioned before.
If an incoming employee did well on the math section of the hiring screen, and was an
excellent machinist, the option for an ESL, English Second Language, class would be available.
That way, Company A would be able to hire experienced operators from all over, and be able to
teach them the communication skills needed to work successfully on the machining floor. Also,
having an ESL program allowing workers from all over the globe to come to Company A would
give the opportunity for new ideas and methods to come to the company. These ideas could
increase efficiency or productivity, as was seen in the case study of Chaparral Steel from Chapter
2, with the new steel bar bundling machine.
3.4.2 Retraining of Current Employees
It would be very beneficial for Company A to institute a constant learning program as
well. The errors on the work floor, from incorrect setup of a work piece to not correctly
following and accounting for tool wear, could be monitored more closely by the supervising staff
than it is now. That way, a monthly or bi-weekly retraining program could be instituted to
address these issues. The retraining program could be a working lunch, so the employees have
71
incentive to come and get free lunch, or mandatory after shift meeting. Not only would these
meeting serve as a place for management to talk to and train the employees, but for the operators
to talk to their supervisors and managers as well. That way, problems and solutions could be
worked out in a group format, similar to Quality Circles, with communication up and down the
line of command.
With this system in place, workers would have a better chance of moving to more
complicated machines and processes, thus earning a higher wage. The supervisors would note,
during their monitoring of the work floor, when a particular operator was doing very well, with
minimal mistakes for an extended period of time. Then the operator could decide to move up or
stay at his current position. This incentive would be a way to keep employee turnover rate down,
and morale up. If employees felt that what they are doing is being noticed and matters, they
would work harder and more carefully.
To move up to a more complicated process and higher wage, an operator would have to
undergo retraining on the new machines. This could be done during down time in a shift, or any
other time. If an employee really wanted to move up, they would come in for extra hours to
learn the new machines, and this dedication would be a good way for management to see which
employees are serious about their jobs. That way, supervisors would be able to weed out the
workers that just want a higher wage, and those that really care about the company and their
reputation, which is part of the issue currently at Company A. A higher overall morale would
occur from the institution of a retraining and advancement program, as well as the reduction of
mistakes on the floor that cost the company money.

72
Chapter 4 – Conclusion
The creation of defective parts is so engrained in the mindset of the employees and
management at Company A that it is accepted as inevitable and unavoidable. The only way for
Company A to come out of the rut it is currently in is through a drastic change in philosophy and
company fundamentals. Problems of this magnitude need to be addressed by solutions of the
same size. Any solution to the issues that Company A is currently facing will need to take time.
There are no instantaneous solutions to a problem that has become so set in the ideals and
fundamentals of a company.
A solution in any field needs to be similar in nature to the problem that it is addressing.
That is, a problem with attendance needs to be addressed with punishments for being late.
Therefore, a problem that has root causes related directly to human error needs to have solutions
that address that. When a problem relating to employees is let go for a prolonged period of time,
the solution to that problem will take a length of time as well. When management allows their
employees to continue to make mistakes, leading to a severely lowered morale level, it is their
responsibility to provide opportunities for rectification, instead of just making attempts and
placing blame.
Employee morale is tied up with their prospects for advancement, personally and
professionally. This includes the conditions of their workplace as well as their growth skill-wise,
which should lead to greater pay and greater responsibility. Company A needs to implement a
training and retraining program with a chance for advancement in the company. Also, there
needs to be repercussions for recurring errors made by operators, and rewards for working for
lengths of time without making mistakes. There has to be incentive for employees to care about
their jobs. This will lower the turnover rate, and heighten the morale.

73
Any solution that does not deal with the problems of the employees is at best only a
temporary solution and will not really help the company thrive in the future. If Company A
expects to stay in business they must address all worker related problems. Checks and balances
must be made in the financial department, instead of working with the “cutting costs in any way
possible” method. The American market is not known for its low labor costs, which is what
Company A is attempting to use as its main profit margin. This may work for a while, but if the
company ever expects to advance or to be able to supply to more than their niche market, this
philosophy must be changed. “You get what you pay for” just about says it all. With low cost
workers, you get a lower quality product yield. Higher trained and thus higher paid workers
make less mistakes and care more, thus reducing wasted materials, causing an overall bonus is
profit margin for the company, and higher customer satisfaction.
Organization, training, morale, cleanliness, work incentive, and opportunity for worker
advancement are the keys to fixing Company A. Employee and management sensitivity may be
affected, or possibly offended, but there comes a time when problems become so drastic that
etiquette can, and should, be pushed aside to make room for bold action.
74
References
[1] Ohno, Taiichi. Toyota Production System: Beyond Large-Scale Production. Portland,
OR: Productivity Press, 1988.
[2] Monden, Yahuhrio. Toyota Production System 3rd
Edition. Norcross, GA: Engineering
And Management Press, 1998.
[3] Askin, Ronald and Goldberg, Jeffrey. Design and Analysis of Lean Production Systems.
New York, NY: John Wiley & Sons Inc, 2002.
[4] Hamrin, Robert and Jasinowski, Jerry. Making it in America. New York, NY: Simon &
Schuster, 1996.
[5] Berry, Thomas, Managing the Total Quality Transformation. Baskerville, VA: McGraw-
Hill, 1991.
[6] Brocka, Bruce and Suzanne, Quality Management, Homewood IL: Business One Irwin
1992.
[7] Talley, Dorsey, Total Quality Management, Milwaukee, WI: ASQC Quality Press, 1991.
[8] George, Stephen, Total Quality Management, New York, NY: John Wiley & Sons Inc,
1994.
[9] Liker, Jeffrey, Becoming Lean, Portland, OR: Productivity Press, 1998.
[10] Associated Press. "Toyota Overtakes GM in Global Vehicle Sales." MSNBC 24 Apr.
2007. 19 Sept. 2007 <http://www.msnbc.msn.com/id/18286221/>.
[11] Rother, Mike and Shook, John, Learning to See, Brookline, MA: Lean Enterprise
Institute, 1999.
[12] “Principles of Cellular/Flow Manufacturing”, National Institute of Standards and
Technology and Manufacturing Extension Partnership, 1998.

75
Appendices

76
Appendix I Current Application

77

78
Appendix II English Proficiency Portion of New Application
Answer the following questions to the best of your ability. Show all work.
1.) A cylinder with a diameter of fifteen inches is rolling across the floor at three revolutions
per minute. How long will it take, in minutes, for the cylinder to roll two hundred inches?
(answer: 1.42minutes)
2.) A milling tool runs across the surface of a part at sixteen inches per minute. The milling
tool is one and a half inches wide. If the tool starts just on the edge of the piece, and is
finished once it is completely off of the opposite edge, how long will it take, in seconds,
for the tool to completely move across the twenty five inch long piece? (answer:
99.375sec)
3.) Two drums are connected by a belt. Drum A is seventeen inches wide and spinning at
four hundred revolutions per minute. Drum B is twelve inches wide. How fast is Drum
B spinning in revolutions per minute? (answer: 566.7rpm)
4.) A chip flies straight down off a piece in a lathe at one hundred inches per second.
Ignoring the effects of gravity, the chip hits the bottom of the machine in three sixteenths
of a second. How far, in inches, is the bottom of the machine from the piece? (answer:
18.75inches)

79
Appendix III Math Proficiency Portion of New Application
1.
a) 125.023 + 7.89 = f) Sin(90) =
b) 7.002 – 0.1403 = g) 1 inch = (mm)
c) 0.0031 × 45.2 = h) 1/4 + 3/16 = =
d) 6.3 ÷21 = i) 2x + y = 9 and x - y = -3
x = y =
e) √64 =
j) k) l) Regular Pentagon
Ans. º Ans. in2 Ans. º
m) n)
Ans. in3
Ans. RPM
2. Plot each point on the graph 3. Put an integral number on each line
A (3, -2) a) 1, 3, __, 5
B (4, ½) b) 32, 24, 17, __, 6
C (-2, 1½)
D (-1, -2½)

80
Appendix IV Sample Tool and Operations Sheet

81
Appendix V First PowerPoint Presentation to Company A
Total Machining Reliability at
Company A
Ryan Bates
Elizabeth Villani
Matt Warner
Faculty Advisor:
Mustapha Fofana
Objectives
Develop a familiarity with the manufacturing
processes and quality assurance processes.
Get feedback from the people who run these
processes.
Identify areas that need improvement and
develop a plan of action.
Economically justify any proposals.

82
Work so Far…
We were given a tour of the facility.
Copied defective component data since Jan.7
We are tracking the manufacturing flow of the
components of three pistols, P9 (M9093A),
P40 (M4043A) and PM9 (PM9093A).
We reviewed and researched the ISO quality
assurance documents.
Setting up a layout of manufacturing facility.
Includes pictures and AutoCAD diagrams
Graph of Defect Categories
0
10
20
30
40
50
60
70
80
A B C D E F G
G - Vendor Problem
F - Machine Problem
E - Material Problem
D - Fixture Problem
C - Tool Problem
B - Operator Error
A - Machinist Error

83
Breakdown of Operator Errors
0
20
40
60
80
100
120
1 2 3 4 5 6 7 8 9
Operator Errors1. Misload
2. Tool offset was
wrong
3. Dimension
oversize
4. Scratches
5. Damage
6. Dimension
undersize
7. Off center
8. Missing
operation
9. Tool loading
miss
Breakdown of Machinist Errors
0
5
10
15
20
25
30
35
40
45
1 2 3 4 5 6
Machinist Errors
1. Damage,
broken tool
2. Off center
3. Dimension
undersize
4. Dimension
oversize
5. Wrong
program
6. Misload

84
Future Work Observe the inspection and classification of the
defective parts.
Develop a flow chart and floor layout for the pistols we are studying.
Research all the costs that are associated with manufacturing the pistols so as to find out how much the defects are costing Company A.
Research other quality control processes.
Look into possible training options for incoming employees.
Evaluating safety regulations on the manufacturing floor.
Topics of Discussion
Manufacturing Floor
Redesigning the layout of the manufacturing floor
Implementing stronger safety regulations
Standardizing machinist/operator manuals at each work station
Quality Assurance
Regulating the categorization of defective components
Refining the system of organizing defective component data
Incoming Employee Training Regimen
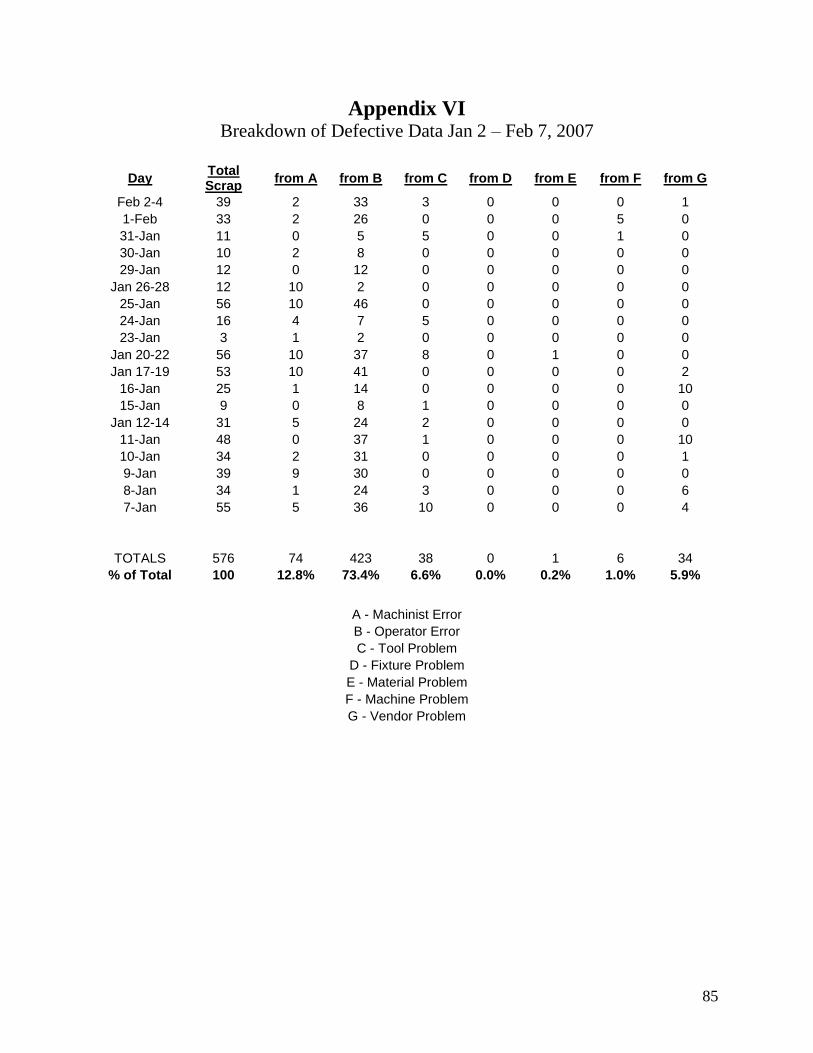
85
Appendix VI Breakdown of Defective Data Jan 2 – Feb 7, 2007
Day Total Scrap
from A from B from C from D from E from F from G
Feb 2-4 39 2 33 3 0 0 0 1
1-Feb 33 2 26 0 0 0 5 0
31-Jan 11 0 5 5 0 0 1 0
30-Jan 10 2 8 0 0 0 0 0
29-Jan 12 0 12 0 0 0 0 0
Jan 26-28 12 10 2 0 0 0 0 0
25-Jan 56 10 46 0 0 0 0 0
24-Jan 16 4 7 5 0 0 0 0
23-Jan 3 1 2 0 0 0 0 0
Jan 20-22 56 10 37 8 0 1 0 0
Jan 17-19 53 10 41 0 0 0 0 2
16-Jan 25 1 14 0 0 0 0 10
15-Jan 9 0 8 1 0 0 0 0
Jan 12-14 31 5 24 2 0 0 0 0
11-Jan 48 0 37 1 0 0 0 10
10-Jan 34 2 31 0 0 0 0 1
9-Jan 39 9 30 0 0 0 0 0
8-Jan 34 1 24 3 0 0 0 6
7-Jan 55 5 36 10 0 0 0 4
TOTALS 576 74 423 38 0 1 6 34
% of Total 100 12.8% 73.4% 6.6% 0.0% 0.2% 1.0% 5.9%
A - Machinist Error
B - Operator Error
C - Tool Problem
D - Fixture Problem
E - Material Problem
F - Machine Problem
G - Vendor Problem

86
Appendix VII Breakdown of Operator and Machinist Errors Jan 2 – Feb 7, 2007
Machinist ## Operator ##
Damage, broken tool, set up part 7 Misload 95
off center 10 tool offset was wrong 9
dimension under size, set up part 42 Dimension over size 96
dimension over size, set up 7 scratches 12
wrong program 6 damage 86
misload,set up part 2 dimension under size 105
off center 14
missing operation 1
tool loading miss 5
74 423
0
5
10
15
20
25
30
35
40
45
1 2 3 4 5 6
Machinist Errors
0
20
40
60
80
100
120
1 2 3 4 5 6 7 8 9
Operator Errors

87
Appendix VIII Defective Data for Parts Followed Jan 2 – Feb 28, 2007
(Left most column says machine number or Final Check)
CW9 Barrel Cause Number Reason
Final Check Barrel, CW9 Muzzle C'sink off center 1 B
MC10 Barrel, CW9 Tool loading miss 5 B
MC10 Barrel, CW9 Damage 14 B
Final check Barrel, CW9 Mazzle chamfer is off center 1 B
MC10 Barrel, CW9 Dimension under size, set up part 8 A
MC10 Barrel, CW9 Dimension over size 3 B
Totals 32
Final Check 2
MC10 30
CW40 Barrel Cause Number Reason
MC10 Barrel, CW40 Dimension under size, Set up part 1 A
MC10 Barrel, CW40 Dimension under size, set up part 4 A
Totals 5
MC10 5
M1 Carb Barrel Cause Number Reason
MC15 Barrel, M1 carbine Damage, tool broken 2 C
Totals 2
MC15 2
P45 Barrel Cause Number Reason
MC09 Barrel, P45 Off center 9 A
MC09 Barrel, P45 Finish surface has rough tool
marks 10 G
MC09 Barrel, P45 Off Center 5 B
MC09 Barrel, P45 Misload, dimension under size 1 B
MC09 Barrel, P45 Rough endmill mark remain 8 G
MC10 Barrel, PT45 dimension over size and damage 4 A
Totals 37
MC09 33
MC10 4
1927 Barrel Cause Number Reason
TC02 Barrrel, 1927 A1 Dimension under size 2 B
TC02 Barrel, 1927 A1 Dimension under size 1 B
TC02 Barrel, 1927 A1 Dimension under size 2 B
TC02 Barrel, 1927 A1 dimension under size, Misload 1 B
Totals 6
TC02 6
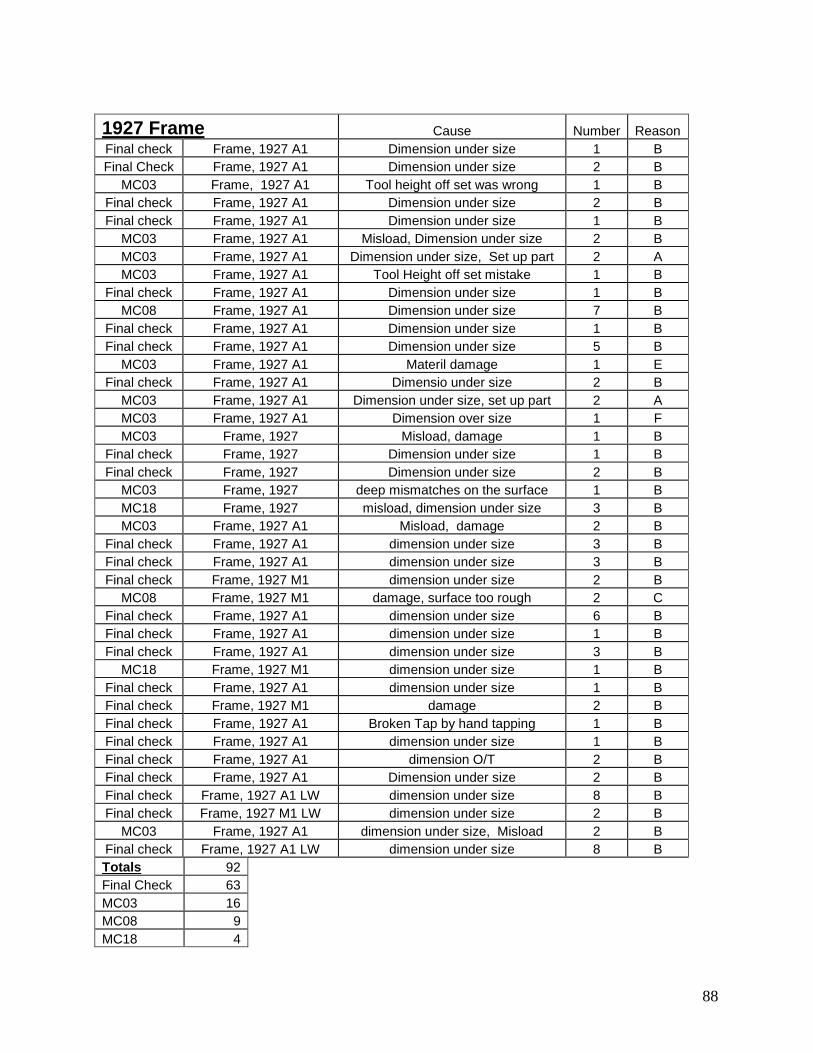
88
1927 Frame Cause Number Reason
Final check Frame, 1927 A1 Dimension under size 1 B
Final Check Frame, 1927 A1 Dimension under size 2 B
MC03 Frame, 1927 A1 Tool height off set was wrong 1 B
Final check Frame, 1927 A1 Dimension under size 2 B
Final check Frame, 1927 A1 Dimension under size 1 B
MC03 Frame, 1927 A1 Misload, Dimension under size 2 B
MC03 Frame, 1927 A1 Dimension under size, Set up part 2 A
MC03 Frame, 1927 A1 Tool Height off set mistake 1 B
Final check Frame, 1927 A1 Dimension under size 1 B
MC08 Frame, 1927 A1 Dimension under size 7 B
Final check Frame, 1927 A1 Dimension under size 1 B
Final check Frame, 1927 A1 Dimension under size 5 B
MC03 Frame, 1927 A1 Materil damage 1 E
Final check Frame, 1927 A1 Dimensio under size 2 B
MC03 Frame, 1927 A1 Dimension under size, set up part 2 A
MC03 Frame, 1927 A1 Dimension over size 1 F
MC03 Frame, 1927 Misload, damage 1 B
Final check Frame, 1927 Dimension under size 1 B
Final check Frame, 1927 Dimension under size 2 B
MC03 Frame, 1927 deep mismatches on the surface 1 B
MC18 Frame, 1927 misload, dimension under size 3 B
MC03 Frame, 1927 A1 Misload, damage 2 B
Final check Frame, 1927 A1 dimension under size 3 B
Final check Frame, 1927 A1 dimension under size 3 B
Final check Frame, 1927 M1 dimension under size 2 B
MC08 Frame, 1927 M1 damage, surface too rough 2 C
Final check Frame, 1927 A1 dimension under size 6 B
Final check Frame, 1927 A1 dimension under size 1 B
Final check Frame, 1927 A1 dimension under size 3 B
MC18 Frame, 1927 M1 dimension under size 1 B
Final check Frame, 1927 A1 dimension under size 1 B
Final check Frame, 1927 M1 damage 2 B
Final check Frame, 1927 A1 Broken Tap by hand tapping 1 B
Final check Frame, 1927 A1 dimension under size 1 B
Final check Frame, 1927 A1 dimension O/T 2 B
Final check Frame, 1927 A1 Dimension under size 2 B
Final check Frame, 1927 A1 LW dimension under size 8 B
Final check Frame, 1927 M1 LW dimension under size 2 B
MC03 Frame, 1927 A1 dimension under size, Misload 2 B
Final check Frame, 1927 A1 LW dimension under size 8 B
Totals 92
Final Check 63
MC03 16
MC08 9
MC18 4

89
1927 Rec Cause Number Reason
Final check Receiver, 1927 A1 Dimension Under size 3 B
Final Check Receiver, 1927 A1 Dimension under size 2 B
MC13 Receiver, 1927 A1 Damage, tool broken 1 C
MC16 Receiver, 1927 A1 Misload, Damage 3 B
Final check Receiver, 1927 A1 Dimension Under size 1 B
Final check Receiver, 1927 A1 Dimension under size 1 B
MC03 Receiver, 1927 A1 Misload, Dimension under size 2 B
MC13 Receiver, 1927 A1 Missing operation 1 B
Final check Receiver, 1927 A1 Dimension under size 1 B
MC08 Receiver,1927 A1 Dimension under size 2 B
MC13 Receiver, 1927 A1 Damage, tool off set is wrong 1 B
Final check Receiver,1927 A1 Dimension under size 1 B
MC13 Receiver, 1927 A1 Damage, tool off set is wrong 2 B
Final check Receiver, 1927 A1 Dimension under size 6 B
Final check Receiver, 1927 A1 Dimension under size 2 B
MC13 Receiver, 1927 A1 Damage, Wrong tool off set 4 B
MC16 Receiver, 1927 A1 Damage, Machine problem 3 F
MC13 Receiver,1927 Damage, Tool broken 2 C
Final check Receiver,1927 Dimension under size 1 B
Final check Receiver,1927 Dimension under size 2 B
MC18 Receiver,1927 misload, dimension under size 3 B
Final check Receiver, 1927 A1 dimension under size 3 B
Final check Receiver, 1927 A1 dimension under size 3 B
Final check Receiver, 1927 M1 dimension under size 2 B
Final check Receiver, 1927 A1 dimension under size 6 B
MC16 Receiver, 1927 A1 damage, tool broken, no Coolant 2 B
Final check Receiver, 1927 A1 dimension under size 1 B
Final check Receiver, 1927 A1 dimension under size 4 B
MC13 Receiver, 1927 A1 Broken drill, damage 1 C
MC18 Receiver, 1927 M1 dimension under size 1 B
Final check Receiver, 1927 A1 dimension under size 1 B
MC13 Receiver, 1927 A1 damage, tool broken 1 C
Final check Receiver, 1927 M1 damage 2 B
MC13 Receiver, 1927 LW Tool Height Offset was wrong 2 B
Final check Receiver,1927 A1 damage 1 B
Final check Receiver,1927 A1 dimension O/T 2 B
MC13 Receiver, 1927 A1 Tap broken 2 C
MC13 Receiver, 1927 M1 Misload, damage 2 B
Final check Receiver,1927 A1 Dimension under size 2 B
MC13 Receiver,1927 A1 dimension under size, wrong offset 2 B
Final check Receiver,1927 A1 LW dimension under size 8 B
Final check Receiver,1927 M1 LW dimension under size 2 B
MC13 Receiver, 1927 A1 dimension under size, Misload 1 B
MC16 Receiver, 1927 A1 damage, wrong program 2 B
Final check Receiver, 1927 A1 LW dimension under size 8 B

90
Totals 105
Final Check 65
MC03 2
MC08 2
MC13 22
MC16 10
MC18 4
A Machinist Error
B Operator Error
C Tool Problem
D Fixture Problem
E Material Problem
F Machine Problem
G Vendor Probem


