Do Not Cite, Quote or Distribute
Working Group III – Mitigation of Climate Change
Chapter 10
Industry

Second Order Draft (SOD) IPCC WG III AR5
Do Not Cite, Quote or Distribute 1 of 92 Chapter 10 WGIII_AR5_Draft2_Ch10.doc 22 February 2013
Chapter: 10
Title: Industry
(Sub)Section: All
Author(s): CLAs: Manfred Fischedick, Joyashree Roy
LAs: Amr Abdel‐Aziz, Adolf Acquaye, Julian Allwood, Jean‐Paul Ceron, Yong Geng, Haroon Kheshgi, Alessandro Lanza, Daniel Perczyk, Lynn Price, Estela Santalla, Claudia Sheinbaum, Kanako Tanaka
CAs: Giovanni Baiocchi, Katherine Calvin, Kathryn Daenzer, Shyamasree Dasgupta, Stephane de la Rue du Can, Gian Delgado, Salah El Haggar, Tobias Fleiter, Ali Hasanbeigi, Samuel Höller, Yacob Mulugetta, Nickolas Themelis, Kramadhati S. Venkatagiri, María Yetano Roche
Remarks: Second Order Draft (SOD)
Version: 3
File name: WGIII_AR5_Draft2_Ch10
Date: 22 February 2013 Template Version: 8
1
[COMMENTS ON TEXT BY TSU TO REVIEWER: This chapter has been allocated 40 template pages 2 (plus an additional 5 for the excursus section on waste). It currently counts 55 (plus an additional 8 3 excursus section pages), so it is 15 pages over target (plus an additional 3 excursus section pages). 4 Reviewers are kindly asked to indicate where the chapter could be shortened.] 5
6 Table of changes
No Date Version Place Description Editor
7
Second Order Draft (SOD) IPCC WG III AR5
Do Not Cite, Quote or Distribute 2 of 92 Chapter 10 WGIII_AR5_Draft2_Ch10.doc 22 February 2013
Chapter 10: Industry 1
2
3
4
5
6
7
8
9
10
11
12
13
14
15
16
17
18
19
20
21
22
23
24
25
26
27
28
29
30
31
32
33
34
Contents
Executive Summary ............................................................................................................................4
10.1 Introduction................................................................................................................................6
10.2 New developments in extractive mineral industries, manufacturing industries and services ..8
10.3 New developments in emission trends and drivers .................................................................10
10.3.1 Extractive industries..........................................................................................................11
10.3.2 Manufacturing...................................................................................................................11
10.4 Mitigation technology options, practices and behavioural aspects.........................................15
10.4.1 Iron and Steel ....................................................................................................................19
10.4.2 Cement ..............................................................................................................................20
10.4.3 Chemicals (Plastics/Fertilisers/Others) .............................................................................22
10.4.4 Pulp and Paper ..................................................................................................................23
10.4.5 Non‐Ferrous (Aluminium/others) .....................................................................................24
10.4.6 Food Processing ................................................................................................................25
10.4.7 Textiles ..............................................................................................................................26
10.4.8 Mining ...............................................................................................................................26
10.5 Infrastructure and systemic perspectives ................................................................................27
10.5.1 Industrial clusters and parks (meso‐level) ........................................................................28
10.5.2 Cross‐sectoral cooperation (macro level) .........................................................................28
10.5.3 Cross‐sectoral implications of mitigation efforts ..............................................................29
10.6 Climate change feedback and interaction with adaptation .....................................................30
10.7 Costs and potentials .................................................................................................................30
10.7.1 CO2‐emissions....................................................................................................................30
10.7.2 Non CO2‐emissions ............................................................................................................34
10.7.3 Waste management ..........................................................................................................34
10.8 Co‐benefits, risks and spill‐over effects....................................................................................36
10.8.1 Socio‐economic, environmental and health effects .........................................................36
10.8.2 Technological risks and uncertainties ...............................................................................40
10.8.3 Public perception ..............................................................................................................41
10.9 Barriers and opportunities .......................................................................................................41
10.9.1 Energy efficiency for reducing energy requirements........................................................42
10.9.2 Emissions efficiency, fuel switching and carbon capture and storage..............................42
10.9.3 Material efficiency.............................................................................................................43

Second Order Draft (SOD) IPCC WG III AR5
Do Not Cite, Quote or Distribute 3 of 92 Chapter 10 WGIII_AR5_Draft2_Ch10.doc 22 February 2013
10.9.4 Product demand reduction ...............................................................................................43 1
2
3
4
5
6
7
8
9
10
11
12
13
14
15
16
17
18
19
20
21
10.9.5 Non‐CO2 greenhouse gases...............................................................................................43
10.10 Sectoral implications on transformation pathways and sustainable development...............46
10.10.1 Industry transformation pathways .................................................................................46
10.10.2 Sustainable development and investment .....................................................................50
10.11 Sectoral policies ......................................................................................................................51
10.11.1 Energy efficiency .............................................................................................................51
10.11.2 Emissions efficiency and fuel switching ..........................................................................54
10.11.3 Material efficiency...........................................................................................................54
10.11.4 Relevance of policy mix...................................................................................................55
10.12 Gaps in knowledge and data ..................................................................................................55
10.13 Waste (excursus section)........................................................................................................56
10.13.1 Introduction ....................................................................................................................56
10.13.2 Emissions trends..............................................................................................................57
10.13.2.1 Solid waste disposal .................................................................................................57
10.13.2.2 Wastewater..............................................................................................................58
10.13.3 Technological options for mitigation of emissions from waste ......................................58
10.13.3.1 Pre‐consumer waste ................................................................................................58
10.13.3.2 Post‐consumer waste ..............................................................................................59
10.13.3.3 Wastewater..............................................................................................................62
References ........................................................................................................................................64

Second Order Draft (SOD) IPCC WG III AR5
Do Not Cite, Quote or Distribute 4 of 92 Chapter 10 WGIII_AR5_Draft2_Ch10.doc 22 February 2013
Executive Summary 1
1112131415161718192021
232425262728
30313233
3536
38394041424344
46
1. Direct GHG emissions from industry and waste/wastewater represented 18.4% of total global 2 GHG emissions in 2010 (24% if AFOLU emissions are not included), larger than the GHG 3 emissions from either the buildings or transport sectors. This share would be even higher if 4 indirect emissions from fuels used for generation, transmission, and distribution of electricity 5 used by industry and waste/wastewater were included. Total direct GHG emissions for industry 6 and waste/wastewater grew from 5.7 GtCO2e in 1970 to 6.6 GtCO2e in 1990 to 9.2 GtCO2e in 7 2010. Nearly 80% of 2010 direct emissions were of CO2, followed by CH4 (14.5%), N2O (3.3%), 8 HFC (2.4%), SF6 (0.7%), and PFC (0.3%) [high confidence]. 9
2. Global direct and indirect energy‐related CO2 emissions in 2010 were 11.5 GtCO2 (3.1 GtC) for 10 manufacturing. Manufacturing primary energy use grew from 116 EJ in 1990 to 170 EJ in 2010. In 2010, energy‐related CO2 emissions from manufacturing were 38% of global CO2 emissions. The largest emissions were from the East Asia region, followed by North America and Economies in Transition in 2010 [high confidence]. Process related emissions (e.g. cement manufacturing) were estimated to be 1.415 Gt CO2 in 2008, and emissions of non‐CO2 GHGs from manufacturing have been in the order of 0.5 GtCO2 since 1990. Manufacturing activity is growing steadily. Further growth in demand for industrial products is expected, but with variation across sub‐ sectors and regions. Annual rate of growth in global production of iron and steel was 4.5% while that of cement was 6.7% between 2005 and 2011. Manufacturing production is increasing rapidly in developing countries, to meet increased domestic demand and increased global trade [high confidence].
3. Over the last three decades there has been strong improvement in energy and process efficiency 22 in energy‐intensive materials processing industries. As a result, energy intensities in best practice are approaching technical limits, with (besides radical innovations) at most 25%‐30% improvement left across all industries [medium confidence]. However, many options for efficiency improvement still remain, and there is still significant potential to reduce the gap between actual energy use and the best practice in many industries and in most countries [high agreement, robust evidence].
4. Besides process specific mitigation options cross‐cutting technologies can help to reduce GHG 29 emissions. As a class of technology, electronic control systems help to optimize performance of motors, compressors, steam combustion, heating, etc. and improve plant efficiency cost‐ effectively with both energy savings and emissions benefits, especially for Small and Medium Enterprises (SMEs).
5. The extractive industry is growing at faster rate to meet materials demand in manufacturing. 34 Particularly many emerging economies typically produce more than they consume. [Medium agreement, medium evidence]
6. Use of primary material is expected to increase between 45% and 60% under business as usual 37 (BAU) conditions by 2050. To achieve an absolute reduction in emissions from the industry sector will require options beyond energy efficiency such as material use efficiency, fuel and feedstock switching, waste recycling, and energy recovery. [High agreement, medium evidence] The models running future long‐term scenarios also envisage rising production rate of materials such as steel and cement and continued improvement in energy efficiency of their production. But material flows and opportunities for material efficiency to mitigate emissions, however, are poorly represented in the models. [High agreement, robust evidence]
7. Level of demand for services/products has significant effect on the activity level in the industry 45 sector. Thus, absolute emission reductions can also come through changes in lifestyle and

Second Order Draft (SOD) IPCC WG III AR5
Do Not Cite, Quote or Distribute 5 of 92 Chapter 10 WGIII_AR5_Draft2_Ch10.doc 22 February 2013
corresponding demand levels directly (e.g. for food, textiles) or indirectly (e.g. for 1 product/service demand related to tourism). 2
8. Producer demand from other sectors for GHG mitigation technologies (e.g. insulation materials 3 for buildings, specific materials for manufacturing of energy efficiency or renewable energy 4 technologies) contributes to industrial GHG emissions. Future demand for those products may 5 increase, resulting in increasing industrial emissions. 6
9. Long‐term step‐change options can include a shift to low carbon electricity, radical product 7 innovations (e.g. alternatives to cement), or Carbon dioxide capture and storage (CCS), which 8 with sufficient public acceptance can contribute to significant GHG mitigation in the future 9 [medium agreement, medium evidence]. 10
121314
161718192021222324
26272829
313233
353637
39404142
444546
10. Rising consumer demand for specific products such as flat panel TVs and solar PV will lead to 11 higher non‐CO2 emissions unless production process changes. For non‐CO2 gases, process optimisation, alternative refrigerants, thermal destruction, and secondary catalysts are options for mitigation.
11. Bottom up studies provide varying mitigation potentials for alternative mitigation options. 15 However, potential varies widely across regions and industries with as high as 90% reduction potential to very low or no reduction potential where theoretical limits have been almost achieved. Uncertainty is also high in potential estimates as underlying quantification methodologies of potential and assumptions are not known. Thus, potential estimates have to be viewed with caution. Corresponding studies indicate that technology deployment in industry sector could deliver CO2 emission reduction in the range of 7 GtCO2 (for year 2030) at costs varying regionally. Marginal abatement cost estimates show that 33‐51% of this reduction can be achieved at net negative cost, 13‐19% can be achieved at less than 20 Euro/tCO2, 12‐23% at 20‐50 Euro/tCO2, 16‐38% at more than Euro 50/tCO2. [Medium agreement, medium evidence]
12. Current mitigation practices in developing countries show that a large number of firms have 25 taken actions at cost less than 20 USD/tCO2. Although very high cost options going up to USD 100/tCO2 have also been implemented. Regional examples show many behavioural responses can deliver emission reduction at a very low or no cost. Currently various barriers block implementation. [High agreement, medium evidence]
13. Non‐CO2 emissions could be reduced by 0.7 Gt CO2e (for year 2030). Four sources will 30 concentrate 75% of emissions. HFC‐23 and N2O from adipic acid and nitric acid provide lower cost mitigation options. Two new sources that are expected to be significant by 2030 ‐flat panel display and photovoltaic manufacturing‐ have high cost mitigation options.
14. Mitigation measures which generate co‐benefits through enhanced environmental compliance, 34 health benefits through better local air and water quality, and which generate less public resistance and reduced waste disposal costs, liability, training needs, are adopted faster [high agreement, robust evidence].
15. Cooperation and cross‐sectoral collaboration at different levels – e.g. sharing of infrastructure, 38 information, waste, heat, etc. ‐ may provide further mitigation potential in certain regions/industry types (e.g. SMEs in developing and emerging economies). Industrial clusters, industrial parks, and industrial symbiosis are emerging trends in many developing countries that help mitigation. [High agreement, robust evidence]
16. There is a knowledge gap on the connection between impacts of climate change and mitigation 43 challenges of manufacturing and extractive industries. Adaptation measures such as flood defence are likely to increase demand for industrial materials. [High agreement, medium evidence]

Second Order Draft (SOD) IPCC WG III AR5
Do Not Cite, Quote or Distribute 6 of 92 Chapter 10 WGIII_AR5_Draft2_Ch10.doc 22 February 2013
17. Unless barriers to mitigation in industry are resolved, the pace and extent of mitigation in 1 industry will be limited. Barriers are varied and include amongst others: expectation of high 2 return on investment (short payback period), high capital costs and long project development 3 times for several technologies, lack of access to capital for energy efficiency improvements and 4 feedstock/fuel change, fair market value for cogenerated electricity to the grid, lack of control of 5 HFC leakage, user preferences and related requirements for products. [High agreement, robust 6 evidence]. 7
18. Sector‐specific policies (e.g. energy management standards, voluntary actions by industries, 8 R&D) can enhance implementation of mitigation strategies and complement overarching 9 economic instruments and policy measures such as carbon pricing [high agreement, robust evidence]
1011
1314151617181920
222324
262728293031323334353637
39 40 41 42 43 44 45 46 47
19. The majority of models used for deriving low‐carbon scenarios indicate that, in the longer run, 12 decrease in carbon intensity is the dominant mitigation option for absolute reduction in emissions over the 21st century in the industry sector. Within the models this decrease is achieved by different transformational pathways that include: a shift from fossil fuels to low (or negative) carbon electricity as an energy carrier, CCS of direct emissions from industry fossil fuel use and process emissions, and an increase in natural gas relative to other fuels. Scenarios differ in the timing, combination and extent of using these mitigation options. Many higher‐carbon scenarios maintain close to the current mix of energy carriers. [High agreement, robust evidence]
20. Waste handling is emerging as a new industrial activity. Waste from various sectors is processed 21 to replace natural raw materials and fossil fuels in industries thereby reducing emission intensity. This also results in direct emission reduction from waste disposal. [High agreement, robust evidence]
21. Emissions from the waste sector almost doubled during the period 1970 to 2010. Approximately 25 only 20% of municipal solid waste (MSW) is recycled while the rest is deposited in open dumpsites or landfills. Approximately 47% of wastewater produced in the domestic and manufacturing sectors is still untreated. Mitigation options (mainly related with reducing CH4 emissions) can deliver emission reductions of 0.8 GtCO2e (for year 2030) at costs varying regionally. Related to MSW, non‐ traditional approaches such as landfill mining, material substitution, and landfill aeration are effective methods for reducing emissions. Waste‐to‐energy plants over their lifetime of approximately 30 years are more economic than landfilling. Moreover, policies supporting the supply and use of sustainable products and material are another effective approach of reducing emissions from the waste sector. Advanced treatment technologies such as membrane filtration, ozonation, improvement of aeration efficiency and engineered nano‐materials are technologies that may enhance GHG emissions mitigation in the wastewater treatment. [High agreement, robust evidence]
10.1 Introduction 38
This chapter updates the knowledge on the industry sector from a mitigation perspective since AR4, but has much wider coverage. In comparison to AR4, this chapter analyses industrial activity over the whole supply chain, from extraction of primary materials (e.g. ores), recycling of waste materials through downstream product manufacturing, to the demand for the products/service of the products. The chapter includes a discussion of trends in activity and emissions, options for mitigation (technology, practices and behavioural aspects), mitigation potentials of these options and related costs, co‐benefits, risks and barriers to their deployment, as well as industry‐specific policy instruments. Findings of integrated assessment models (long‐term mitigation pathways) are also presented and discussed from a sector perspective. Mitigation opportunities in waste management
Second Order Draft (SOD) IPCC WG III AR5
Do Not Cite, Quote or Distribute 7 of 92 Chapter 10 WGIII_AR5_Draft2_Ch10.doc 22 February 2013
are synthesised, covering key waste‐related issues that appear across all chapters in the WGIII report.
1 2
3 4
5 6 7
8 9
10 11 12
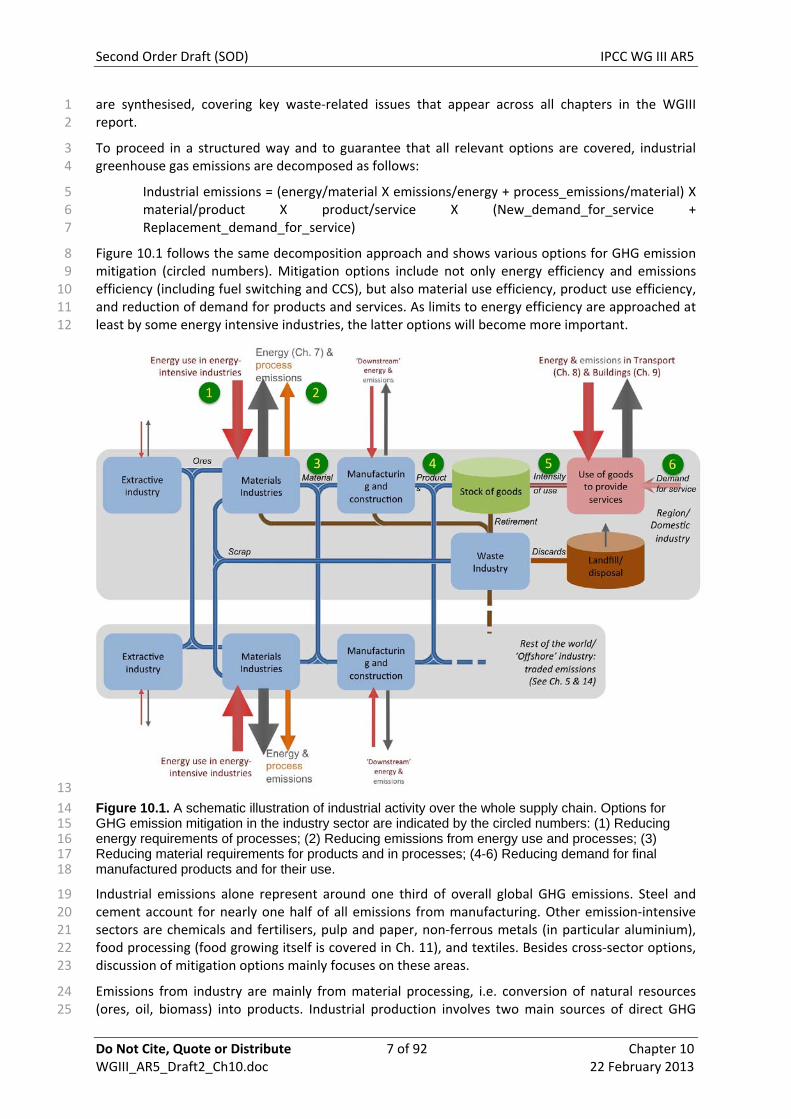
To proceed in a structured way and to guarantee that all relevant options are covered, industrial greenhouse gas emissions are decomposed as follows:
Industrial emissions = (energy/material X emissions/energy + process_emissions/material) X material/product X product/service X (New_demand_for_service + Replacement_demand_for_service)
Figure 10.1 follows the same decomposition approach and shows various options for GHG emission mitigation (circled numbers). Mitigation options include not only energy efficiency and emissions efficiency (including fuel switching and CCS), but also material use efficiency, product use efficiency, and reduction of demand for products and services. As limits to energy efficiency are approached at least by some energy intensive industries, the latter options will become more important.
13
14 15 16 17 18
19 20 21 22 23
24 25
Figure 10.1. A schematic illustration of industrial activity over the whole supply chain. Options for GHG emission mitigation in the industry sector are indicated by the circled numbers: (1) Reducing energy requirements of processes; (2) Reducing emissions from energy use and processes; (3) Reducing material requirements for products and in processes; (4-6) Reducing demand for final manufactured products and for their use.
Industrial emissions alone represent around one third of overall global GHG emissions. Steel and cement account for nearly one half of all emissions from manufacturing. Other emission‐intensive sectors are chemicals and fertilisers, pulp and paper, non‐ferrous metals (in particular aluminium), food processing (food growing itself is covered in Ch. 11), and textiles. Besides cross‐sector options, discussion of mitigation options mainly focuses on these areas.
Emissions from industry are mainly from material processing, i.e. conversion of natural resources (ores, oil, biomass) into products. Industrial production involves two main sources of direct GHG

Second Order Draft (SOD) IPCC WG III AR5
Do Not Cite, Quote or Distribute 8 of 92 Chapter 10 WGIII_AR5_Draft2_Ch10.doc 22 February 2013
emissions: process emissions from chemical reactions and combustion emissions from the burning of fossil fuels. Indirect emissions associated with purchased electricity and steam are relevant in both areas. Major drivers of industrial production are either directly growing demand for products (e.g cars, textiles) or more indirectly through demand for services (e.g. mobility service of a car or airplane, accommodation service of buildings). While product manufacturing related emissions are considered in the industry chapter, emissions from product use and service demand are considered in other chapters, e.g. chapter 9 (Buildings) or chapter 8 (Transport)
1 2 3 4 5 6 7
9
10 11 12 13 14 15 16
17 18 19 20 21 22 23 24 25 26 27 28 29 30 31
32 33 34 35 36 37 38 39
1.
10.2 New developments in extractive mineral industries, manufacturing 8
industries and services
World production trends of mineral extractive industries, manufacturing and services, have grown steadily in the last decades. From 1970 to 2011, the global annual production of metallic minerals such as iron ore, copper, silver, and gold increased by 264%, 168%, 154% and 82% respectively (USGS, 2012); in the same period, world cement production grew by 495%; aluminium 357%; ammonia 251% (USGS, 2012); steel 153% (WSA, 2012a) and paper production 224% (FAO, 2012). Service sector share in the world GDP increased from 50% in 1970 to 72% in 2009; while the industry world GDP share decreased from 38.2 to 25.4% (WB, 2012).
Concerning extractive industries for metallic minerals, from 2005 to 2011 annual mining production growth rate of iron ore, gold, silver and copper increased by 10%, 1%, 4%, and 1% respectively (USGS, 2012). Most of the countries in Africa, Latin America, and the transition economies produce more than they use; whereas use is being driven mainly by China, India and developed countries (UNCTAD, 2008)2. Extractive industries of rare earths are gaining importance because of the demand of its products. This is mostly associated with the hi‐tech industry because of their various uses in high strength permanent magnets, lasers, automotive catalytic converters, fiber optics/superconductors, and electronic devices (Moldoveanu and Papangelakis, 2012). The world production of rare earths (130 Mt in 2010) is dominated by production in China, accounting for 97% of global rare earths extraction (USGS, 2012). New technologies, such as electric vehicles (EVs), energy storage and renewable technologies, increase the demand for certain minerals, such as lithium, gallium and phosphates (Bebbington and Bury, 2009). Important research on extraction methods as well as increasing recycling rates would lead to increasing reserves of these materials (Graedel et al., 2011; Resnick Institute, 2011; Moldoveanu and Papangelakis, 2012; Eckelman et al., 2012).
Regarding manufacturing production, the annual global production growth rate of steel, cement, ammonia, aluminium and paper, the most energy intensive industries, ranged from 2% to 7% between 2005 and 2011 (Table 10.1). Over the last decades the world has witnessed decreasing industrial activity in developed countries with a major downturn in industrial production due to the economic recession in 2009 (USGS, 2012) along with significant increases in industrial activity of some developing countries. The increase in industrial production and consumption has been concentrated in Asia, and in particular in China (China is the largest producer of the main industrial outputs) whereas in many middle‐income countries industrialization has stagnated and Africa has
1 It is important to note that while examining options for mitigation by different sectors there is a significant risk of double‐counting due to the many different ways of attributing emissions. This is of particular importance in this chapter as it covers the manufacture of material goods which are used in other sectors. Chapter 5 shows a Sankey diagram clearly delineating different sources of anthropogenic emissions which aims to resolve this confusion.
2 For example, in 2008, China imported one‐half of the world’s total iron ore exports and produced about one‐half of the world’s pig iron (USGS, 2012). India demanded 35% of world´s total gold production in 2011 (WGC, 2011), and the US consume 33% of world´s total silver production in 2011 (USGS, 2012).

Second Order Draft (SOD) IPCC WG III AR5
Do Not Cite, Quote or Distribute 9 of 92 Chapter 10 WGIII_AR5_Draft2_Ch10.doc 22 February 2013
remained marginalized (WSA, 2012; UNIDO, 2009). In 2011, 1.4 billion tons of steel (210 kg/cap) were manufactured; nearly 50% was produced and consumed in mainland China. China also dominates global cement production, producing 2,000 million metric tons – Mt ‐ (1463 kg/cap) in 2011, followed by India with 210 Mt (168 kg/cap) (USGS, 2012). More subsector specific trends are in 10.4.
1 2 3 4 5
6 7
Table 10.1: Total production of energy-intensive industrial goods for the World Top-5 Producers of Each Commodity: 2005, 2011, and Average Annual Growth Rate (AAGR) (BGS, 2011; USGS, 2012)
2005 2011 2005 2011 Commodity/Country
(Mt) (Mt)
AAGR Commodity/ Country
(Mt) (Mt)
AAGR
Iron ore Steel
World 1.54 2.8 World 1146.6 1490.1 4%China 0.42 1.2 China 355.8 683.3 11%Australia 0.262 0.48 Japan 112.5 107.6 ‐1%Brazil 0.28 0.39 U.S. 94.9 86.2 ‐2%India 0.14 0.24 India 45.8 72.2 8%Russia 0.097 0.1 Russia 66.1 68.7 1%
Cement Aluminium
World 2310.0 3400.0 7% World 31.9 44.1 6%China 1040.0 2000.0 12% China 7.8 18.0 15%India 145.0 210.0 6% Russia 3.7 4.0 2%U.S. 101.0 68.4 ‐6% Canada 2.9 3.0 0%Brazil 36.7 62.1 9% Australia 1.9 1.9 0%Japan 69.6 47.0 ‐6% U.S. 2.5 2.0 ‐4%
Ammonia Paper
World 121.0 136.0 2% World 364.98 403.18 2%China 37.8 41.0 1% China 60.41 103.10 9%India 10.8 12.0 2% U.S. 83.70 77.42 ‐1%Russia 10.0 11.0 2% Japan 30.95 26.61 ‐2%U.S. 8.0 8.1 0% Germany 21.68 22.70 1%Trinidad & Tobago 4.2 5.6 5% Canada 19.50 12.07 ‐8%
Large‐scale production dominates these energy‐intensive industries, although globally small‐ and medium‐sized enterprises have significant shares in many developing countries, this creates special challenges for mitigation efforts (Worrell et al., 2009; Roy, 2010; Ghosh and Roy, 2011).
8 9
10
11 12 13 14 15 16 17 18 19 20 21 22 23 24
Another important change in the world´s industrial output of the last decades has been the rise in the proportion of trade. Not only are manufactured products traded, but the process of production is also increasingly broken down into tasks that are themselves outsourced/traded. Production is becoming less vertically integrated. A rise in the proportion of trade has been driving production increase and relocation through process outsourcing besides population growth, and urbanization led activity growth (Fisher‐Vanden et al., 2004; Liu and Ang, 2007; Reddy and Ray, 2010; OECD, 2011). In contrast, the economic recession of 2009 reduced industrial production worldwide because of consumption reduction, credit crunch, and fall in world trade (Nissanke, 2009). More discussion on GHG emissions embodied in trade is presented in Chapter 14. Similar to industry, the services sector is heterogeneous and has significant proportion of small and medium sized enterprises. . The service sector is reported usually to cover heterogeneous economic activities such as public administration, finance, education, trade, hotels, restaurants and health. Activity growth in developing countries and structural shift with rising income is driving service sector growth (Fisher‐Vanden et al., 2004; Liu and Ang, 2007; Reddy and Ray, 2010; OECD, 2011). OECD countries are

Second Order Draft (SOD) IPCC WG III AR5
Do Not Cite, Quote or Distribute 10 of 92 Chapter 10 WGIII_AR5_Draft2_Ch10.doc 22 February 2013
shifting from manufacturing towards service‐oriented economies (Sun, 1998; Schäfer, 2005; US EIA, 2010), however, this is also true for some Non‐OECD countries. India has almost 64%‐66% (WB, 2012) of GDP contribution from service sector.
1 2 3
5 6 7 8 9
10 11 12
13 14 15 16
10.3 New developments in emission trends and drivers 4
Direct GHG emissions from industry and waste/wastewater represented 18.4% of total global GHG emissions in 2010 (24% if AFOLU emissions are not included), larger than the GHG emissions from either the buildings or transport sectors. This share would be even higher if indirect emissions from fuels used for generation, transmission, and distribution of electricity used by industry and waste/wastewater were included. Figure 10.2 shows global industry and waste/wastewater direct GHG emissions by source from 1970 to 2010. (Regional trends are discussed in Chapter 5). Total direct GHG emissions for industry and waste/wastewater grew from 5.7 GtCO2e in 1970 to 6.6 GtCO2e in 1990 to 9.2 GtCO2e in 2010.
Table 10.2 provides 2010 direct emissions by sector and GHG. Nearly 80% of 2010 direct emissions were of CO2, followed by CH4 (14.5%), N2O (3.3%), HFC (2.3%), SF6 (0.7%), and PFC (0.1%). Indirect emissions from fuels used for generation, transmission, and distribution of electricity used by industry and waste/wastewater are not included in these values.
17
18 19 20 21
Figure 10.2. Industry and waste/wastewater direct GHG emissions by source, 1970 - 2010 (in Gt of CO2 equivalent per year). The Table shows average annual growth rates of emissions over decades. (IEA, 2012a; JRC/PBL, 2012). Indirect emissions from fuels used for generation, transmission, and distribution of electricity used by industry and waste/wastewater are not included in these values.

Second Order Draft (SOD) IPCC WG III AR5
Do Not Cite, Quote or Distribute 11 of 92 Chapter 10 WGIII_AR5_Draft2_Ch10.doc 22 February 2013
Table 10.2: Industry and waste/wastewater direct GHG emissions by source, 2010 (in MtCO2e) (IEA, 2012a; JRC/PBL, 2012). Indirect emissions from fuels used for generation, transmission, and distribution of electricity used by industry and waste/wastewater are not included in these values.
1 2 3
Sector Gas 2010 Emissions (MtCO2e)
Sector Gas 2010 Emissions (MtCO2e)
CO2 2,022.08 CH4 627.34
CH4 18.87 CO2 32.50
SF6 8.77
Landfill & waste incineration
N2O 11.05
PFC 4.99 CH4 666.75
Ferrous and non ferrous metals
N2O 4.27
Wastewater treatment N2O 108.04
CO2 609.08 CO2 3,222.24
HFC 206.90 SF6 47.05
N2O 139.71 N2O 10.02
SF6 11.85 CH4 5.10
Chemicals
CH4 4.91 PFC 3.98
Cement CO2 1,352.35
Other industries
HFC 0.38
Indirect N2O 24.33 Total CO2e 9,142.55
10.3.1 Extractive industries 4
Mining involves diverse range of energy‐intensive processes such as excavation, mine operation, material transfer, mineral preparation, and separation. Energy consumption for mining
5 6 7 8 9
10
12 13 14 15 16 17 18 19
20 21 22 23 24 25 26
27 28
3 and quarrying, which is included in “other industries” in IEA data, represents about 2.7% of worldwide industrial energy use, varying regionally, and a significant share of national industrial energy use in Botswana and Namibia (around 80%), Chile (over 50%), Canada (30%), Zimbabwe (18.6%), Mongolia (16.5%), and South Africa (almost 15%) in 2010 (IEA, 2012b; c).
10.3.2 Manufacturing 11 GHG emissions from manufacturing can be grouped into: (1) energy‐related CO2 emissions, (2) CO2 emissions from non‐energy uses of fossil fuels and from non‐fossil fuel sources, (3) CO2 emissions from calcination in cement manufacturing, and (4) non‐CO2 GHGs. Energy‐related CO2 emissions can be further distinguished between those based on final or site energy and those based on primary or source energy, which account for electricity generation, transmission, and distribution losses. Some studies, notably the IEA, refer to “direct” CO2 emissions as emissions from fuel combustion and process‐related emissions and “indirect” CO2 emissions as emissions from the power generation sector due to electricity use in industry (IEA, 2009a).
Most of these manufacturing CO2 emissions arise due to chemical reactions and fossil fuel combustion largely used to provide the intense heat that is often required to bring about the physical and chemical transformations that convert raw materials into industrial products. These industries, which include production of chemicals and petrochemicals, iron and steel, cement, pulp and paper, and aluminium, usually account for most of the sector’s energy consumption in many countries. In India, the share of energy use by energy‐intensive manufacturing industries in total manufacturing energy consumption is 62% (INCCA, 2010), while it is about 80% in China (NBS, 2012).
Global direct and indirect energy‐related CO2 emissions in 2010 were 11.5 GtCO2 (3.1 GtC) for manufacturing. Global and regional data on final energy use, primary energy use4, and energy‐
3 Discussion on extraction of energy carriers takes place in Chapter 7. 4 Primary energy associated with electricity and heat consumption was calculated by multiplying the amount of electricity and heat consumed by each end‐use sector by electricity and heat primary factors. Primary factors were derived as the ratio of fuel inputs at power plants to electricity or heat delivered. Fuel inputs for electricity production were separated from inputs to heat production, with fuel inputs in combined heat and power plants being separated into fuel inputs for electricity and heat production according to the shares of electricity and heat produced in these plants. In order to calculate primary energy for non‐fossil fuel (hydro,

Second Order Draft (SOD) IPCC WG III AR5
Do Not Cite, Quote or Distribute 12 of 92 Chapter 10 WGIII_AR5_Draft2_Ch10.doc 22 February 2013
related CO2 emissions including indirect emissions related to electricity use and non‐energy uses (IEA, 2012a; b; c) for manufacturing are shown in Table 10.3.
1 2
3 4 5
6 7 8 9
10 11 12 13
14 15 16
Manufacturing primary energy use grew from 116 EJ in 1990 to 170 EJ in 2010. In 2010, energy‐related CO2 emissions from manufacturing were 38% of global CO2 emissions. The largest emissions were from the East Asia region, followed by North America and Economies in Transition.
The share of non‐energy use of fossil fuels (e.g. the use of fossil fuels as a chemical industry feedstock, of refinery and coke oven products, and of solid carbon for the production of metals and inorganic chemicals) in total manufacturing final energy use has grown from 20% in 2000 to 24% in 2009 (IEA, 2012b; c). Fossil fuels used as raw materials/feedstocks in the chemical industry cause emissions at the end of their life‐span in the disposal phase (Patel et al., 2005). These emissions are accounted for in the waste disposal industry's emissions. Process emissions from cement manufacturing were estimated to be 1.415 GtCO2 in 2008 (Boden et al., 2010). Subsector specific details are also in 10.4.
Table 10.3: Manufacturing final energy, primary energy and energy-related direct and indirect CO2 emissions for ten world regions (IEA, 2012a; b; c). For definitions of regions see Annex II (Metrics and Methodology).
Final Energy (EJ) Primary Energy (EJ) Carbon Dioxide (MtCO2)
1990 2005 2010 1990 2005 2010 1990 2005 2010
Latin America and Caribbean (LAM)
5.69 8.47 9.28 6.38 9.71 10.76 296.71 459.03 503.24
North America (USA, Canada) (NAM)
18.88 21.60 20.02 23.86 26.56 24.13 1,419.01 1394.18 1271.36
Japan, Aus, NZ, (JPAUNZ)
6.79 7.07 6.68 8.41 8.74 8.24 559.46 566.55 530.14
Western Europe (WEU)
14.65 16.43 15.19 17.56 19.47 18.00 1,095.04 1,075.54 930.78
East Asia (China, Taiwan, Korea, Mongolia (EAS)
14.36 30.04 40.26 17.95 41.95 57.04 1,567.13 3,509.38 5047.30
South‐East Asia and Pacific (PSA)
2.23 5.54 7.00 2.60 6.74 8.58 140.50 384.44 490.62
South Asia (SAS) 3.96 6.89 9.17 4.97 9.38 12.63 319.07 624.86 877.18
Sub Saharan Africa (SSA)
1.85 2.29 2.50 2.29 2.94 3.31 178.25 191.02 209.90
Middle East and North Africa (MNA)
3.58 6.45 8.77 4.26 7.83 10.48 238.52 409.90 545.38
Economies in Transition (EIT)
21.71 13.21 13.47 27.53 16.76 16.60 1,979.11 1,101.21 1081.71
World 93.69 118.00 132.33 115.80 150.09 169.77 7,792.81. 9,716.11 11,487.62
Note: Includes energy and non-energy industry. Non-energy use covers those fuels that are used as raw materials in the different sectors and are not consumed as a fuel or transformed into another fuel. Also includes construction. Energy use for mining and quarrying is not included in the final and primary energy values; energy-related CO2 emissions from mining and quarrying, which are estimated to be less that 3% of total industry emissions, are included due to data limitations.
17 18 19 20 21
other renewables, nuclear), we followed the direct equivalent method; the primary energy of the non‐fossil fuel energy is accounted for at the level of secondary energy; that is, the first usable energy form or “currency” available to the energy system (IPCC, 2000).

Second Order Draft (SOD) IPCC WG III AR5
Do Not Cite, Quote or Distribute 13 of 92 Chapter 10 WGIII_AR5_Draft2_Ch10.doc 22 February 2013
Two key sources of data on non‐CO2 emissions of GHGs show emissions of roughly the same magnitude, but differ in total amounts as well as the growth trends. The U.S. EPA data on emissions of non‐CO2 GHGs show that they decreased from 0.501 GtCO2e in 1990 to 0.414 GtCO2e in 2010 (Table 10.4). The decrease is related to a reduction in emissions of HFC‐23 from HCFC‐22 production, N2O emissions from adipic acid and nitric acid production and PFC from aluminium production. In the period 1990‐2005, fluorinated gases (F‐gases) were the most important non‐CO2 GHG source in manufacturing industry. Most of the F‐gases arise from the emissions from different processes including the production of aluminium and HCFC‐22 and the manufacturing of flat panel displays, magnesium, photovoltaics and semiconductors. The rest of the F‐gases correspond mostly to HFCs that are used in refrigeration equipment used in industrial processes. Most of the N2O emissions from the industrial sector are contributed by the chemical industry, particularly from the production of nitric and adipic acids (EPA, 2012). The Edgar database data on direct emissions of non‐CO2 GHGs (Table 10.5) show an increase in these emissions from 0.443 GtCO2e in 1990 to 0.524 GtCO2e in 2005, followed by a decrease to 0.500 GtCO2e in 2010 (JRC/PBL, 2012). Further analysis is needed to understand the differences in the data provided by these two sources.
1 2 3 4 5 6 7 8 9
10 11 12 13 14 15
16 Table 10.4: Emissions of non-CO2 GHGs (EPA, 2012)
MtCO2e
Source 1990 2005 2010
HFC‐23 from HCFC‐22 production 104 179 128 ODS substitutes (Industrial process refrigeration) 0 13 21 PFCs, SF6 and NF3 from flat panel display manufacturing 0 4 4 N2O from adipic acid and nitric acid production 200 127 118 PFCs and NF3 from photovoltaic manufacturing 0 0 4 PFC from aluminium production 84 31 26 SF6 from manufacturing of electrical equipment N/A 7 7 HFCs, PFCs, SF6 and NF3 from semiconductor manufacturing 13 26 18 SF6 from magnesium manufacturing 12 10 5 CH4 and N2O from other industrial processes 89 85 83
Total 501 480 414 Note: does not include N2O emissions from caprolactam. 17
18 Table 10.5: Emissions of non-CO2 GHGs per Industrial Sector (JRC/PBL, 2012) in MtCO2e
Industrial Sector Gas 1990 2005 2010
HFC 75 194 207
N2O 263 187 140
SF6 6 9 12
CH4 2 4 5
Chemicals
Total chemicals 347 394 363
N2O 3 4 4
PFC 16 6 5
SF6 12 11 9
CH4 12 15 19
Ferrous and non‐ferrous metals
Total Ferrous and non‐ferrous metals 43 36 37
N2O 9 14 16
HFC 1 9 14
PFC 10 24 20
SF6 29 40 41
CH4 5 8 9
Other industries
Total other industries 54 94 100
Total non‐CO2 direct emissions industry 443 524 500
19
Second Order Draft (SOD) IPCC WG III AR5
Do Not Cite, Quote or Distribute 14 of 92 Chapter 10 WGIII_AR5_Draft2_Ch10.doc 22 February 2013
Trade is an important factor that influences production choice decisions and hence CO2 emissions at the country level. Emission inventories based on consumption rather than production reflect the fact that products produced and exported for consumption in developed countries are an important contributing factor of the emission increase for certain countries such as China, particularly since 2000 (Ahmad and Wyckoff, 2003; Wang and Watson, 2007; Peters and Hertwich, 2008; Weber et al., 2008). Chapter 14 provides an in‐depth discussion and review of the literature related to trade, embodied emissions, and consumption‐based emissions inventories.
1 2 3 4 5 6 7
8 A summary of the issues that concern Least Developed Countries (LDCs) in this chapter is found in Box 10.1. 9
10 Box 10.1. Issues regarding Least Developed Countries (LDCs)
[COMMENTS ON TEXT BY TSU TO REVIEWER: Boxes highlighting further LDC‐specific issues are 11 included in other chapters of the report (see chapter sections 1.3.1, 2.1, 6.3.6.6, 7.9.1, 8.9.3, 9.3.2, 12 10.3.2, 11.7, 12.6.4, 16.8) and a similar box may be added to the Final Draft of chapters, where there 13 is none in the current Second Order Draft. In addition to general comments regarding quality, 14 reviewers are encouraged to comment on the complementary of individual boxes on LDC issues as 15 well as on their comprehensiveness, if considered as a whole.] 16
17 18 19
20 21 22 23 24 25
26 27 28 29
30 31 32 33 34
35 36 37 38 39 40
41 42 43 44 45 46
LDCs have a small industrial production base. The share of MVA (market value added) in LDCs Gross Domestic Product in 2009 was 11.4%, while 21.8% in Developing Countries and 16.5% in Developed countries. The LDCs contribution to World MVA represented only 0.46% in 2010 (UNIDO, 2012).
Industry growth in LDCs has been sustained during the 70s and mid 80s, but the rate of growth diminished since then (UNCTAD, 2011). Industrial sector (IS) participation in GDP was 5.4% in 1970, 18.6% in 1987, 25.1% in 2000 and 30.8% in 2008. The increase in the overall share of industry in GDP has mainly resulted from the boom in commodity prices and concomitant rapid expansion of mining and quarrying. This can be seen in the evolution of manufacturing Industries participation in GDP: 2.7% in 1970, 10.1% in 1987, 10.0% in 2000 and 9.8% in 2008 (UNCTAD, 2011).
Developed and developing countries are changing their IS, from low technology to medium and high technology products, but LDCs remain highly concentrated in low technology products (LTP). The participation of LTP in the years 1995 and 2009 in LDCs MVA was 68% and 71%, while in developing countries had 38% and 30% and in developed countries 33% and 21% (UNIDO, 2012).
Two alternative possible scenarios could be envisaged for the IS in LDCs: a continuation of the present situation of concentration in labor intensive and resource intensive industries or moving towards an increase in the production share of higher technology products (following the trend in Developing Countries). The future evolution of the industrial sector will be successful only if the technologies adopted are consistent with LDCs resource endowment.
However, the heterogeneity of LDCs circumstances should be taken into account when analyzing major trends in the evolution of the group. The case of Bangladesh is exceptional in terms of industrial development, as it represented about 40% of LDCs MVA in 2009 (UNIDO, 2012). The case of Angola, Equatorial Guinea and Sudan are outstanding in terms of FDI (foreign direct investments) attracted, mostly related with the relevance of their extractive industries. They represent 49% of total FDI received by LDCs in the last decade, notably Angola with 33% (UNCTAD, 2011).
A report prepared by UNFCCC Secretariat summarizes the findings of 70 Technology Needs Assessments (TNA) submitted, including 24 from LDCs. As regards the relation between low carbon and sustainable development, most of the LDCs selected their priority technologies on the basis of the potential to eradicate poverty and hunger and to avoid the loss of resources, time and capital. Almost 80% of LDCs considered the IS in their TNA, evidencing that they consider this sector as a key element in their development strategies. The technologies identified in the Industrial sector and the

Second Order Draft (SOD) IPCC WG III AR5
Do Not Cite, Quote or Distribute 15 of 92 Chapter 10 WGIII_AR5_Draft2_Ch10.doc 22 February 2013
proportion (in %) of countries selecting them are: fuel switching (42), energy efficiency (35), mining (30), high efficiency motors (25), cement production (25) (UNFCCC SBASTA, 2009).
1 2
3 4 5 6
A low carbon development strategy facilitated by access to financial resources, technologies and capacity building, would contribute to make the deployment of national mitigation efforts politically viable. As adaptation is the priority in almost all LDCs, industrial development strategies and mitigation actions look for synergies with national adaptation strategies.
7
8 9
10 11 12 13 14 15 16 17 18 19 20 21 22 23 24 25
26 27
28
FAQ 10.1. How much does the industry sector contribute to GHG emissions and how is this changing?
Direct GHG emissions from industry and waste/wastewater represented 18.4% of total global GHG emissions in 2010 (24% if AFOLU emissions are not included), larger than the GHG emissions from either the buildings or transport sectors. This share would be even higher if indirect emissions from fuels used for generation, transmission, and distribution of electricity used by industry and waste/wastewater were included. Total direct GHG emissions for industry and waste/wastewater grew from 5.7 GtCO2e in 1970 to 6.6 GtCO2e in 1990 to 9.2 GtCO2e in 2010. Nearly 80% of 2010 direct emissions were of CO2, followed by CH4 (14.5%), N2O (3.3%), HFC (2.4%), SF6 (0.7%), and PFC (0.3%). Global direct and indirect energy‐related CO2 emissions in 2010 were 11.5 GtCO2 (3.1 GtC) for manufacturing. Manufacturing primary energy use grew from 116 EJ in 1990 to 170 EJ in 2010. In 2010, energy‐related CO2 emissions from manufacturing were 38% of global CO2 emissions. The largest emissions were from the East Asia region, followed by North America and Economies in Transition in 2010. Process related emissions (e.g. cement manufacturing) were estimated to be 1.415 Gt CO2 in 2008, and emissions of non‐CO2 GHGs have been in the order of 0.5 GtCO2 since 1990, while fluorinated (F) gases (mainly HFC‐23 from the production of HCFC‐22) and N2O (from the production of adipic acid and nitric acid) were the most important non‐CO2 GHG sources in manufacturing industry.
Growing use of primary material is expected to increase between 45% to 60% under Business as Usual (BAU) conditions by 2050.
Emissions from the waste sector almost doubled during the period 1970 to 2010. Waste recycling and reduction can help reduction in emission besides technology innovation and deployment. 29
31
33343536373839404142
43 44 45 46
10.4 Mitigation technology options, practices and behavioural aspects 30
Figure 10.1, and its associated identity, define five options for emissions mitigation in industry.
Energy efficiency: Energy is used in industry to drive chemical reactions, to create heat, and to 32 perform mechanical work. The required chemical reactions are subject to thermodynamic limits, so the history of industrial energy efficiency is one of innovating to create ‘best available technologies’ nearer to theoretical limits, implementing these technologies at scale to define a reference ‘best practice technology’, and investing and controlling installed equipment to raise ‘average performance’ nearer to ‘best practice’ (Dasgupta et al., 2012). Over last three decades there has been strong improvement in energy efficiency in energy‐intensive industries. As a result, energy intensities in best practice are approaching technical limits. However, many options for efficiency improvement still remain, and there is still significant potential to reduce the gap between actual energy use and the best practice in many industries and in most countries.
In industry emissions reduction opportunities can generally be applicable to steam systems, process heating systems (furnaces and boilers), motor systems (e.g. pumps, fans, air compressor, refrigerators, material handling. Opportunities to improve heat management include better heat exchange between hot exhaust gases and cool incoming fuel and air, improved insulation,
Second Order Draft (SOD) IPCC WG III AR5
Do Not Cite, Quote or Distribute 16 of 92 Chapter 10 WGIII_AR5_Draft2_Ch10.doc 22 February 2013
capture and use of heat in hot products, and use of exhaust heat for electricity generation or as an input to lower temperature processes (US DoE, 2004a, 2008).
1 2
3 4 5 6 7 8 9
1112131415161718
19 20 21 22 23 24 25 26 27 28 29
30 31 32 33 34 35 36 37 38 39
414243
4445 46 47
Recycling is already widely applied for metals, paper, glass and some plastics as a means to save energy, generally because producing new material from old avoids the need for further energy intensive chemical reactions. Recycling is cost effective in many industries, but constrained by lack of supply because collection rates, while high for some materials (particularly steel), are not 100%, and because with growing global demand for material, available supply of scrap lags total demand. Cement cannot be recycled although concrete can be crushed and down‐cycled into aggregates or engineering fill with some energy benefit from not producing more cement.
Emissions efficiency: In 2008, 40% of industrial energy supply was from coal and oil with 20% 10 from gas. These shares are forecast to change to 30% and 24% respectively by 2035 (IEA, 2011) resulting in lower emissions per unit of energy. Switching to natural gas also favours more efficient use of energy in industrial CHP installations. The use of wastes and biomass in industry is currently limited, but forecast to grow (IEA, 2009b). If electricity generation is decarbonised, greater electrification, for example wider use of heat pumps instead of boilers (IEA, 2009b; HPTCJ, 2010), could also save emissions. Solar thermal energy for drying, washing and evaporation may also be developed further (IEA, 2009a) although to date has not been implemented widely (Edenhofer et al., 2011).
The IEA forecasts that a large part of emission reduction in industry will occur by CO2 sequestration (up to 30% in 2050) (IEA, 2009a). CCS is largely discussed in chapter 7, with the only distinction between its application for industry and in the power sector being the separation of a pure stream of CO2. CCS in gas processing (Kuramochi et al., 2012a) and parts of chemical industry (ammonia production) might be early opportunities as the CO2 in flue gas is already highly concentrated (up to 85%), compared to cement or steel (up to 30%). Industrial utilization of CO2 was assessed in the IPCC SRCCS (Mazzotti et al., 2005) and it was found that the scope of future potential industrial uses of CO2 was rather small, the storage time of CO2 in industrial products often short, and the energy balance can be unfavourable for industrial uses of CO2 to become a significant means of mitigating climate change. However, currently CO2‐use is subject of various R&DD projects.
In terms of Non‐CO2‐emissions from industry for instance HFC‐23 emissions which arises in HCFC‐22 production can be reduced by process optimization and by thermal destruction. In non‐Annex I countries, destruction of HFC‐23 is the major source of credits in the CDM (82 MtCO2e/year). N2O emissions from adipic and nitric acid production have decreased from 200 to 118 MtCO2e between 1990 and 2010 due to the implementation of thermal destruction and secondary catalysts. Ozone depleting substances (e.g Hydrofluorocarbons) can be contained by leak repair, refrigerant recovery and recycling, proper disposal or replaced by alternative refrigerants (ammonia, HC, CO2). Emissions of PFCs, SF6 and NF3 are growing rapidly due to flat panel display manufacturing. 98% of them arise in China (EPA, 2012) and can be countered by fuelled combustion, plasma and catalytic technologies;
Material efficiency: Many decisions are taken to use extra material to save labour costs. 40 Material efficiency – delivering services with less new material – is therefore a significant opportunity for industrial emissions abatement, that has had relatively little attention to date (Allwood et al., 2012). Three key strategies that would significantly improve material efficiency:
Reducing yield losses in materials production, manufacturing and construction. Approximately one tenth of all paper, a quarter of all steel, and a half of all aluminium produced each year is scrapped and internally recycled. This could be reduced by process innovations and new approaches to design (Milford et al., 2011).

Second Order Draft (SOD) IPCC WG III AR5
Do Not Cite, Quote or Distribute 17 of 92 Chapter 10 WGIII_AR5_Draft2_Ch10.doc 22 February 2013
Re‐using old material. A detailed study (Allwood et al., 2012, chap. 15) on re‐use of 1 structural steel in construction concluded that there are no technical barriers to re‐use, that there is a profit opportunity and that the potential supply is growing.
2 3
5 6 7 8 9
10 11 12 13 14 15 16
181920212223
2526272829303132
Manufacturing lighter products. Although new steels and production techniques have 4 allowed relative light‐weighting of cars, in practice cars continue to become heavier as they are larger and have more features. However, many products could be one third lighter without loss of performance in use (Carruth et al., 2011) if design and production were optimised. At present, the high costs of labour relative to materials, and other barriers inhibit this opportunity.
Although substitution of one material by another is often technically possible, (Ashby, 2009) options for material substitution as an abatement strategy are limited: global steel and cement production exceeds 200kg and 380kg/person/year respectively, and no other materials capable of delivering the same functions are available in comparable quantities; epoxy based composite materials and magnesium alloys have significantly higher embodied energy than steel or aluminium; wood is kiln dried, so in effect is energy intensive; blast furnace slag and fly ash from coal‐fired power stations can substitute to some extent for limestone in producing cement clinker.
Using products more intensively. Most products are owned in order to deliver a ‘product 17 service’ rather than for their own sake, so potentially the same level of service could be delivered with fewer products. Using products for longer could reduce demand for replacement goods, and hence reduce industrial emissions (Allwood et al., 2012). New business models could foster dematerialisation and more intense use of products. The ambition of the ‘sustainable consumption’ agenda and policies (see 10.11 and chapter 3) aims towards this goal, although evidence of its application in practice remains scarce.
Reducing overall demand for product services (cf. Box 10.2). Industrial emissions would be 24 reduced if overall demand for product services were reduced (Kainuma et al., 2013)– if the population chose to travel less (for example through more domestic tourism), heat or cool buildings less and buy less. Clear evidence that, beyond some threshold of development, populations do not become ‘happier’ (as reflected in a wide range of socio‐economic measures) with increasing wealth, suggests that reduced overall consumption might not be harmful in developed economies (Layard, 2006; Roy and Pal, 2009; GEA, 2012), and a literature questioning the ultimate policy target of GDP growth is growing, albeit without clear prescriptions about implementation (Jackson, 2011).
33
34
35 36 37 38 39 40 41 42
45
Box 10.2. Service demand reduction and mitigation opportunities in industry sector:
Besides technological mitigation measures an additional mitigation option (cf. Figure 10.1) for industry sector is lying with the end uses of industrial products which provide services to consumers (e.g. diet, mobility, shelter, clothing, amenities, health care and services, hygiene etc). Investigation into the mitigation potential associated with this option is however at its beginning and important knowledge gaps exist (for a more general review of sustainable consumption and production (SCP) policies, see 10.11.3 and 4.4.3). The nature of the linkage between service demand and the demand for industrial products is different and shown here through two examples representing a direct and more indirect link:
clothing demand which is linked directly to the textile industry products (strong link) 43
tourism demand which is understood as giving rise to direct mobility, shelter demand but 44 indirectly to industrial materials demand (weak link)

Second Order Draft (SOD) IPCC WG III AR5
Do Not Cite, Quote or Distribute 18 of 92 Chapter 10 WGIII_AR5_Draft2_Ch10.doc 22 February 2013
Clothing demand: Demand for clothing is apparently unlimited, and during the period 2000‐2005, the advent of ‘fast fashion’ in the UK led to a drop in prices, but an increase in sales equivalent to one third more garments per year per person (Allwood et al., 2008). This growth in demand relates to ‘fashion’, ‘conspicuous consumption’ (Roy and Pal, 2009) rather than ‘need’, and has triggered a wave of interest in concepts like ‘sustainable lifestyle/fashion.’ While much of this interest is related to marketing new materials, authors such as Fletcher (2008) have examined the possibility that ‘commodity’ clothing, which can be discarded easily, will be used for longer and more valued by shared activity.
1 2 3 4 5 6 7 8
9 10 11 12 13 14 15
16 17 18 19 20 21 22 23 24 25 26
27 28 29 30 31 32 33 34 35 36 37
38 39 40 41 42
43 44 45 46 47 48 49
Tourism demand: GHG emissions triggered by tourism significantly contribute to global anthropogenic CO2 emissions. Estimation show a range between 3.9% to 6%, with a best estimate of 4.9% (UNWTO et al., 2008). Worldwide, three quarters (75%) of the emissions are generated by transport (see Chapter 8) and just over 20% by accommodation (UNWTO et al., 2008). A minority of travellers (frequent travellers using the plane over long distances) (Gössling et al., 2009) are responsible for the greater part of emissions (Gössling et al., 2005; TEC and DEEE, 2008; de Bruijn et al., 2010).
Mitigation options for tourism (Gössling, 2010; Becken and Hay, 2012) include technical, behavioural and organisational aspects. Many mitigation options and potentials are the same as those identified in the transport and buildings chapter (cf. chapter 8 and 9). Besides the demand on direct tourism related products delivered by the industry (e.g. products for buildings and other infrastructures: snow lifts etc.), those measures have an important impact on the industry sector as they determine to a certain extent the product and material demand of the sector. In that context service demand reduction (e.g. through sustainable lifestyles) resulting in a lower demand for transportation can, for example, reduce demand for steel to manufacture cars and contribute to lessen emissions in the industry sector. Thus, industry sector has only limited influence on emissions from tourism (via reduction of the embodied emissions), but is affected by decisions in mitigation measures in tourism sector.
Approaches to mitigation in tourism vary across regions (OECD and UNEP, 2011). Some reduction targets have been put forward by the World Travel and Tourism Council (WTTC): ‐25% to ‐30% by 2020, ‐50% in 2035 compared to 2005. Such targets are supported by the European Tourism Commission (ETC) and UNWTO “as a minimum requirement for progress on effective emissions reductions” (ETC and UNWTO, 2009, p. 17) quoted by (Scott et al., 2010). These targets contrast with the trends in emissions growth and reveal a gap of more than 100% between the projected emissions for 2035 and the target (Scott et al., 2010). Some research found using the current target would put an additional unsustainable burden on other sectors of the economy, while some authors also point that by reducing demand in some small subsectors of tourism (long haul, cruises) effective emission reductions may be reached with a minimum of damage to the sector (Peeters and Dubois, 2010).
Several studies show that, for some countries (e.g. the UK) an unrestricted growth of tourism would by 2050 consume the whole carbon budget compatible with the +2°C guardrail (Bows et al., 2009; Scott et al., 2010). A business as usual scenario (UNWTO et al., 2008) projects emissions to grow by 130% from 2005 to 2035 globally; notably the emissions of air transport and accommodation triple (cf. Figure 10.3).
Two alternative scenarios show both that the contribution of technology is limited in terms of achievable mitigation potentials and that even when combining technological and behavioural potentials CO2 emissions no significant reduction in 2035 compared to 2005 can be reached. Insufficient technological mitigation potential and the need for drastic changes in the forms of tourism (reduction in long haul travel (UNWTO et al., 2008)), in the place of tourism (Gössling et al., 2010; Peeters and Landré, 2011) and in the uses of leisure time, implying changes in lifestyles (Ceron and Dubois, 2005; Dubois et al., 2011) are the limiting factors.

Second Order Draft (SOD) IPCC WG III AR5
Do Not Cite, Quote or Distribute 19 of 92 Chapter 10 WGIII_AR5_Draft2_Ch10.doc 22 February 2013
Tourism is an example of a service sector where the discussion of mitigation is not only technology driven, but strongly correlated with behaviourial options. As for many other activities the question is one of how certain levels of mitigation goals would imply consequences for the activity level with indirect implications for industry sector emissions
1 2 3 4
5
Figure 10.3. Scenarios of CO2 mitigation potential from global tourism in 2035 (UNWTO et al., 2008) 6
7 8
10 11 12 13 14 15 16 17 18
19 20 21 22 23 24 25 26 27 28 29 30 31
In the rest of this section, discussion of the application of these five strategies, where it exists, is reviewed for the major emitting industrial sectors.
10.4.1 Iron and Steel 9
Steel continues to dominate global metal production with total crude steel production of around 1490 Mt in 2011. In 2011, China led steel production, producing 46% of the world's steel. Other significant producers include EU‐27 (12%), USA (8%), Japan (7%), India (5%) and Russia (5%) (WSA, 2012b). 70% of all steel is made from Pig iron produced by reducing iron oxide in a blast furnace using coke or coal before reduction in an oxygen blown converter (WSA, 2011). Steel is also made from scrap (23%) or iron oxide reduced in solid state (direct reduced iron. 7%) melted in electric‐arc furnaces before refining. The specific energy intensity of steel production varies by technology and region. Global steel sector emissions were estimated to be 2.6 Gt CO2 in 2006, including direct and indirect emissions (IEA, 2009a; Oda et al., 2012a).
Energy efficiency. The steel industry is pursuing: improved heat and energy recovery from process gases, products and waste streams; improved fuel delivery through pulverized coal injection; improved furnace designs and process controls; reducing the number of temperature cycles through better process coupling such as in Endless Strip Production (Arvedi et al., 2008) and use of various energy efficiency technologies (Worrell, E et al., 2010) (APP, 2010) (Xu, Sathaye, et al., 2011). Efforts to promote energy efficiency and to reduce the production of hazardous wastes are the subject of both international guidelines on environmental monitoring (International Finance Corporation, 2007) and regional benchmarks on best practice techniques (EC, 2012a). The Ultra‐Low CO2 Steelmaking (ULCOS) programme, run by a consortium of 48 European organizations, aims to reduce CO2 emissions intensities by 50% or more. They have identified four production routes for further development: top‐gas recycling applied to blast furnaces, HIsarna (a smelt reduction technology), advanced direct reduction and electrolysis. The first three of these routes would require CCS, and the fourth would reduce emissions only if powered by low carbon electricity.

Second Order Draft (SOD) IPCC WG III AR5
Do Not Cite, Quote or Distribute 20 of 92 Chapter 10 WGIII_AR5_Draft2_Ch10.doc 22 February 2013
Emissions efficiency and fuel switching: The coal and coke used in conventional iron‐making is emissions intensive; switching to gas‐based DRI and oil and natural gas injection has been used, where economic and practicable. Charcoal, another coke substitute, is currently used for iron‐making, notably in Brazil (Taibi et al.; Henriques Jr. et al., 2010), and processing to improve charcoal’s mechanical properties is another substitute under development, although extensive land area is required to produce wood for charcoal. Other alternative fuels include ferro‐coke (Takeda et al., 2011), biomass and waste plastics (IEA, 2009a). Hydrogen fuel might reduce emissions if a cost effective emissions free source of hydrogen were available at scale, but at present this is not the case. Hydrogen reduction is being investigated in the US (Pinegar et al., 2011) and Japan as COURSE50 (Matsumiya, 2011). Molten oxide electrolysis (Wang et al., 2011) could reduce emissions if a low or CO2‐free electricity source was available. However this technology is only at the very early stages of development and identifying a suitable anode material has proved difficult.
1 2 3 4 5 6 7 8 9
10 11 12
13 14 15 16 17 18 19 20
21 22 23 24 25
27 28 29 30 31
32 33 34 35 36 37 38 39 40
41 42 43 44
Material efficiency: Material efficiency offers significant potential for emissions reductions in the iron and steel sector (Allwood et al., 2010) and cost savings (Roy et al., in press). Milford et al. (2011) examined the impact of yield losses along the steel supply chain and found that 26% of global liquid steel is lost as process scrap, so its elimination could have reduced sectoral CO2 emissions by 16% in 2008. Cooper et al. (2012) estimate that nearly 30% of all steel produced in 2008 could be re‐used in future. However, steel is relatively cheap in comparison to labour, and this difference is amplified by tax policy, so economic logic currently drives a preference for material inefficiency to reduce labour costs (Skelton, A.C.H. and Allwood, under review).
Reduced product and service demand: The optimal product life will vary with the share of embodied and in‐use emissions and the actual (rather than the design) life (Skelton, A.C.H. and Allwood, J.M., under review). Cooper et al. (2012) also explore product life proposing an “onion‐skin model” to demonstrate how replacement strategies at the component level can be used to maximise product life and minimize steel demand.
10.4.2 Cement 26
Fuel emissions in cement production (0.8 Gt CO2 (IEA, 2009c)) can be reduced through improvement in energy efficiency and fuel switching while process emissions (calcinations‐ in 2006 totalled 1.9 Gt CO2: 1.1 Gt CO2) can be reduced through reduced demand, including through improved material efficiency. There is small contribution in CO2 emissions from grinding and transport (Bosoaga et al., 2009).
Energy efficiency. Estimates of theoretical minimum primary energy consumption5 for thermal (fuel) energy use ranges between 1.6 and 1.85 GJ/t (Locher, 2006). For large new dry kilns, the “best possible” energy efficiency is 2.7 GJ/t clinker with electricity consumption of 80 kWh/t clinker or lower (Muller and Harnish, 2008). “International best practice” final energy ranges from 1.8 to 2.1 to 2.9 GJ/t cement and primary energy ranges from 2.15 to 2.5 to 3.4 GJ/t cement for production of blast furnace slag, fly ash, and Portland cement, respectively (Ernst Worrell, Price, et al., 2008). Klee et al. (2011) illustrates how these process emissions intensities have declined in various regions of the world. Many options still exist to improve the energy efficiency of cement manufacturing (Muller and Harnish, 2008; Worrell, Galitsky, et al., 2008; Worrell and Galitsky, 2008; APP, 2010).
Emissions efficiency and fuel switching: The majority of cement kilns burn coal (IEA/WBCSD, 2009), but fossil or biomass wastes could be used instead. These fuels have a lower CO2 intensity, depending on their exact composition (Sathaye et al., 2011) and are used in cement production in many countries (for example The Netherlands (92%), Belgium (56%), Germany (50%), Switzerland
5 Final energy is defined as the energy used at the production facility. Primary energy is defined as the energy used at the production facility as well as the energy used to produce the electricity consumed at the facility. For primary energy values, the losses associated with conversion of fuels into electricity along with the losses associated with electricity transmission and distribution are included.

Second Order Draft (SOD) IPCC WG III AR5
Do Not Cite, Quote or Distribute 21 of 92 Chapter 10 WGIII_AR5_Draft2_Ch10.doc 22 February 2013
(48%), and Austria (47%) (Wang, 2008) with potential for further use elsewhere. Figure 10.4 illustrates the share of alternative fuels used for clinker production in several countries in 2005 (Oda et al., 2012b).
1 2 3
4
5
6 7 8 9
10 11 12
13 14 15 16 17 18 19 20 21 22 23 24 25 26 27 28 29
30 31
Figure 10.4. Thermal energy consumption in clinker production in 2005, from Oda et al. (2012b)
Cement kilns can be fitted to harvest CO2, which could then be stored, but this has yet to be piloted and “commercial‐scale CCS in the cement industry is still far from deployment” (Naranjo et al., 2011). CCS potential in the cement sector has also been studied by (IEAGHG, 2008) (Barker et al., 2009) (Croezen and Korteland, 2010) (Bosoaga et al., 2009). A number of emerging technologies aim to reduce emissions and energy use in cement production (Hasanbeigi, Price, et al., 2012), but there are regulatory, supply chain, product confidence and technical barriers to be overcome before such technologies (such as geopolymer cement) could be widely adopted (Van Deventer et al., 2012).
Material efficiency: Almost all cement is used in concrete to construct buildings and infrastructure (Van Oss and Padovani, 2002). For concrete, which is formed by mixing cement, water, sand and aggregates, two applicable material efficiency strategies are: using less cement initially and reusing concrete components at end of first product life (distinct from down‐cycling of concrete into aggregate which is widely applied). Less cement can be used by placing concrete only where necessary, for example Orr et al. (2010) use curved fabric moulds to reduce concrete mass by 40% compared with a standard, prismatic shape. By using higher‐strength concrete, less material is needed; CO2 savings of 40% have been reported on specific projects using ‘ultra‐high‐strength’ concretes (Muller and Harnish, 2008). Portland cement comprises 95% clinker and 5% gypsum, but cement can be produced with lower ratios of clinker through use of additives such as blast furnace slag, fly ash from power plants, limestone, and natural or artificial pozzolans. The weighted average clinker‐to‐cement ratio for the companies participating in the WBCSD GNR project was 76% in 2009 (WBCSD, 2011). In China, this ratio was 63% in 2010 (China Cement, 2011; NDRC, 2011a). In India the ratio is 80% but computer optimisation is improving this (India Planning Commission, 2007). Reusing continuous concrete elements is difficult because it requires elements to be broken up but remain undamaged. Concrete blocks can be reused, as masonry blocks and bricks are reused already, but to date there is little published in this area.
Reduced product and service demand: Cement, in concrete, is used in the construction of buildings and infrastructure. Reducing demand for these products can be achieved by extending their

Second Order Draft (SOD) IPCC WG III AR5
Do Not Cite, Quote or Distribute 22 of 92 Chapter 10 WGIII_AR5_Draft2_Ch10.doc 22 February 2013
lifespans or using them more intensely. Buildings and infrastructure have lifetimes less than 80 years (less than 40 years in East Asia) (Hatayama et al., 2010) however their core structural elements (those which drive demand for concrete) could last over 200 years if well maintained. Reduced demand for building and infrastructure services could be achieved by human settlement design, increasing the number of people living and working in each building, or decreasing per‐capita demand for utilities (water, electricity, waste) but has as yet had little attention.
1 2 3 4 5 6
8 9
10 11 12 13 14 15 16
17 18 19 20 21 22 23 24 25 26 27 28 29 30 31 32 33 34 35 36
37 38 39 40 41 42 43 44 45 46 47 48 49 50
10.4.3 Chemicals (Plastics/Fertilisers/Others) 7
The chemicals industry produces a wide range of different products on scales ranging over several orders of magnitude. This results in methodological and data collection challenges, in contrast to other sectors such as iron and steel or cement (Saygin, Patel, et al., 2011). However, emissions in this sector are dominated by a relatively small number of key outputs: ethylene, used primarily in producing plastics; fertilizer; and adipic acid, nitric acid and caprolactam, used in the production of plastics and other synthetic polymers and fertilizer. Emissions arise both from the use of energy in production, and from the venting of by‐products from the chemical processes. The synthesis of chlorine in chlor‐alkali electrolysis is responsible for about 40% of the electricity demand of the chemical industry.
Energy Efficiency in Production: Steam cracking for the production of light olefins, such as ethylene and propylene, is the most energy consuming process in the chemical industry, and the pyrolysis section of steam cracking consumes about 65% of the total process energy (Ren et al., 2006). Upgrading all steam cracking plants to best practice technology could reduce energy intensity by 23% (Saygin, Patel, et al., 2011; Saygin, Worrell, et al., 2011a) with a further 12% saving possible with best available technology. Switching to a biomass‐based route to avoid steam cracking could reduce CO2 intensity (Ren and Patel, 2009) but at the cost of higher energy use, and with high land‐use requirements. Fertilizer production accounts for around 1.2% of world energy consumption (Swaminathan and Sukalac, 2004), mostly to produce ammonia (NH3). 22% energy savings are possible (Saygin, Worrell, et al., 2011a) by upgrading all plants to best practice technology. Nitrous oxide (N2O) is emitted during production of adipic and nitric acids. Adipic acid is used primarily in the production of plastics and synthetic fibres, and nitric acid is used to produce synthetic fertilizer. By 2020 annual emissions from these industries are estimated to be 125 MtCO2e (EPA, 2012). Very high levels of emissions reduction could be achieved, depending on plant operating conditions (Reimer et al., 2000). Plastics recycling saves energy, but to produce a high value recycled material, a relatively pure waste stream is required: impurities greatly degrade the properties of the recycled material. Some plastics can be produced from mixed waste streams, but generally have a lower value than virgin material. A theoretical estimate suggest that increasing use of combined heat and power plants in the chemical and petrochemical sector from current levels of 10 to 25% up to 100% would result in energy savings up to 2 EJ for the activity level in 2006 (Saygin et al., 2009).
Emissions efficiency and fuel switching. There are limited opportunities for innovation in the current process of ammonia production via the Haber‐Bosch process (Erisman et al., 2008). Possible improvements relate to the introduction of new nitrous oxide (N2O) emission reduction technologies in nitric acid production such as high‐temperature catalytic N2O decomposition (Melián‐Cabrera et al., 2004) which has been shown to reduce N2O emissions by up to 70‐90% (BIS Production Partner, 2012; Yara, 2012). N2O emissions from nitric acid production which currently accounts for 15.7% of emissions in the sector has the potential to reduce GHG emissions by 73 Mt CO2e /year through Best Practice technologies (IFA, 2009). While implementation of this technology has been largely completed in regions pursuing carbon emission reduction (e.g. the EU through the ETS or China through CDM) the implementation of this technology still offers large mitigation potential in other regions like the former soviet union and the US (Kollmus and Lazarus, 2010). Fuel switching can also lead to significant emissions and energy‐savings. For example, natural gas‐based ammonia production results in 25% energy savings compared to Naphtha, 36% compared to Fuel Oil and 50% compared to Coal and 27 Mt CO2e /year GHG emissions savings in the industry (IFA, 2009).

Second Order Draft (SOD) IPCC WG III AR5
Do Not Cite, Quote or Distribute 23 of 92 Chapter 10 WGIII_AR5_Draft2_Ch10.doc 22 February 2013
Material efficiency: Many of the material efficiency measures identified above can be applied to the use of plastics, but this has had little attention to date. More efficient use of fertilizer gives benefits both in reduced direct emissions of N2O from the fertilizer itself and from reduced fertilizer production (Smith et al., 2008).
1 2 3 4
6 7 8 9
10 11 12 13 14 15 16 17 18 19 20 21 22 23 24
25 26 27 28 29 30 31 32 33 34 35 36
37 38 39 40 41
42 43 44 45 46
10.4.4 Pulp and Paper 5
Global paper production has increased steadily during the last three decades (except for a minor production fall originated by the 2008 financial crisis) (FAO, 2012), with global demand expansion currently driven by developing nations. Fuel and energy use are the main sources of GHG emissions during the forestry, pulping and manufacturing stages of paper production.
Energy efficiency. A list of commercially available technologies listed by (Kramer et al., 2009) including more efficient motor drives, more efficient steam cycle washers, use of microwaves to reduce log pulping energy, biotreatment of wood chips and electrohydraulic contaminant removal techniques all offer small potential improvements to sub‐components of the overall process. Energy savings may be obtained from emerging technologies such as black liquor gasification (Jacobs and IPST, 2006; Worrell, Galitsky, et al., 2008) which uses the by‐product of the chemical pulping process to increase the energy efficiency of pulp and paper mills (Naqvi et al., 2010). With commercial maturity expected in 10‐15 years (Eriksson and Harvey, 2004), Black Liquor Gasification can be used as a waste‐to‐energy method with the potential to achieve higher overall energy efficiency (38% for electricity generation) than the conventional recovery boiler (9‐14% efficiency) while generating an energy‐rich syngas from the liquor (Naqvi et al., 2010). The syngas can also be utilized as a feedstock for production of renewable motor fuels such as bio‐methanol, dimethyl ether, and FT‐diesel or hydrogen (Pettersson and Harvey, 2012). Gasification combined cycle systems have potential disadvantages (Kramer et al., 2009), including high energy investments to concentrate sufficient black liquor solids and higher lime kiln and causticizer loads compared to Tomlinson systems.
Emissions efficiency and fuel switching: Direct CO2 emissions from European pulp and paper production reduced from 0.57 to 0.35 ktCO2 per kt of paper between 1990 and 2009, while indirect emissions reduced from 0.2 to 0.11 ktCO2 per kt of paper (CEPI, 2011). Combined heat and power (CHP) accounted for 95% of total on‐site electricity produced by EU paper makers in 2009, compared to 88% in 1990 (CEPI, 2011), so has little further potential. The global pulp and paper industry usually has ready access to biomass resources and it generates from biomass approximately a third of its own energy needs (IEA, 2009a) (53% in the EU, (CEPI, 2011). Paper recycling can have a positive impact on energy intensity and CO2 emissions over the total life‐cycle of paper production (Miner, 2010; Laurijssen et al., 2010). Recycling rates in Europe and North America reached 72% and 63% in 2009, respectively (AF & PA; CEPI, 2011), leaving a small range for improvement when considering the limit of 81% estimated by (CEPI, 2006). In Europe, the share of recovered paper used in paper manufacturing has increased from roughly 33% in 1991 to around 44% in 2009 (CEPI, 2011).
Material efficiency: Higher material efficiency could be achieved through the improvement of recycling yields and the manufacturing of lighter paper. The former could be obtained by promoting the design of easy to remove inks and adhesives and less harmful de‐inking chemicals, while the latter could be achieved by reducing the average weight of newspapers and office paper from 45 and 80 g/m2 to 42 and 70 g/m2 respectively (Van den Reek, J, 1999; Hekkert et al., 2002).
Reduced demand: Opportunities to reduce demand for paper products in the future include printing on demand, removing print to allow paper re‐use (Leal‐Ayala et al., 2012), and substituting e‐readers for paper. The latter has been the subject of substantial academic research (e.g. Gard and Keoleian, 2002; Reichart and Hischier, 2003) although the substitution of electronic media for paper has mixed environmental outcomes, with no clear statistics yet on whether electronics reduce paper demand.

Second Order Draft (SOD) IPCC WG III AR5
Do Not Cite, Quote or Distribute 24 of 92 Chapter 10 WGIII_AR5_Draft2_Ch10.doc 22 February 2013
10.4.5 Non‐Ferrous (Aluminium/others) 1
Annual production of non‐ferrous metals is small compared to steel, and is dominated by aluminium, with 56Mt made globally in 2009, of which 18Mt was secondary production. Production is expected to rise to 97Mt by 2020 (IAI, 2009). Magnesium is also significant, but with global primary production of only 653Kte in 2009 (IMA, 2009) is dwarfed by aluminium.
2 3 4 5
6 7 8 9
10 11 12 13 14 15 16 17 18 19 20 21 22
23 24 25 26 27 28 29 30 31 32
33 34 35 36 37 38 39
40 41 42 43 44 45 46 47 48 49
Energy efficiency: Aluminium production is particularly associated with high electricity demand. Indirect (electricity related) emissions account for over 80% of total GHG emissions in aluminium production. The sector accounts for 3.5% of global electricity consumption (IEA 2008) and energy accounts for nearly 40% of aluminium production costs.
Aluminium can be made from raw materials (alumina) or through recycling. Best practice primary aluminium production – from alumina production through ingot casting – consumes 174 GJ/t primary energy (accounting for electricity production, transmission, distribution losses) and 70.6 GJ/t final energy (Worrell, Price, et al., 2008). Best practice for electrolysis – which consumes roughly 85% of the energy used for production of primary aluminium – is about 13 kWh/kg aluminium while the theoretical energy requirement is 6 kWh/kg aluminium (BCS Inc., 2007). Best practice for recycled aluminium production is 7.6 GJ/t primary energy and 2.5 GJ/t final energy (Worrell, Price, et al., 2008). The U.S. aluminium industry consumes almost three times the theoretical minimum energy level (BCS Inc., 2007). The options for new process development in aluminium production – multipolar electrolysis cells, inert anodes and carbothermic reactions – and have not yet reached commercial scale (IEA, 2012d). The IEA estimates that application of best available technology can reduce energy use for aluminium production by about 10% compared with current levels (IEA, 2012d).
At present, post‐consumer scrap makes up only 20% of total aluminium recycling (J.M. Cullen and J. M. Allwood, under review) which is dominated by internal ‘home’ or ‘new’ scrap. The quality of liquid metal made from recycled scrap depends on control of alloy composition, and despite the closed‐loop of aluminium can recycling, almost all other aluminium recycling is from higher value ductile wrought alloys with a low silicon content, to lower value, casting alloys with high silicon content. As per capita stock levels saturate in the 21st century there could be a shift from primary to secondary aluminium production (Liu, Bangs, et al., 2012) if recycling rates can be increased, and the accumulation of different alloying elements in the scrap stream can be controlled. These challenges will require improved end of life management and even new technologies for separating the different alloys (Liu, Bangs, et al., 2012).
Emissions Efficiency: Data on emissions intensities for a range of non‐ferrous metals are given by (Sjardin, 2003). The aluminium industry alone contributed 3% of carbon dioxide emissions from industry in 2006 (Allwood et al., 2010). In addition to CO2 emissions resulting from electrode and reductant use, the production of non‐ferrous metals can result in the emission of high‐GWP GHGs, for example PFCs (such as CF4) in aluminium or SF6 in magnesium. PFCs result from carbon in the anode and fluorine in the cryolite. The reaction can be minimised by controlling the process to prevent a drop in alumina concentrations, which triggers the process.
Material efficiency: For aluminium, a 50% reduction in emissions from 2000 levels by 2050 cannot be reached if future global per capita stocks saturate at the present level of industrialised nations (Liu, Bangs, et al., 2012). However, there are significant carbon abatement opportunities in the area of material efficiency and demand reduction. From liquid aluminium to final product, the yield in forming and fabrication is only 59% which could be improved by near‐net shape casting and blanking and stamping process innovation (Milford et al., 2011). For chip scrap produced from machining operations (in aluminium for example Tekkaya et al., 2009; or magnesium Wu et al.) extrusion processes are being developed to bond scrap in the solid state to form a relatively high quality product potentially offering energy savings of up to 95% compared to re‐melting. Aluminium building components (window frames, curtain walls and cladding) could be reused when a building is

Second Order Draft (SOD) IPCC WG III AR5
Do Not Cite, Quote or Distribute 25 of 92 Chapter 10 WGIII_AR5_Draft2_Ch10.doc 22 February 2013
demolished (Cooper and Allwood) and more modular product designs would allow longer product lives and an overall reduction in demand for new materials (Cooper et al., 2012).
1 2
4 5 6 7
8 9
10 11 12 13 14 15 16 17 18 19 20 21
22 23 24 25 26 27
28 29 30 31 32 33 34 35 36 37 38 39 40 41 42 43 44 45
46
10.4.6 Food Processing 3 The food industry as discussed in this chapter includes all processing beyond the farm gate, while everything before is in the agriculture industry, and discussed in chapter 11. In the developed world, the emissions released beyond the farm gate are approximately equal to those released before. (Garnett, 2011) suggests that in total provision of human food drives around 17.7 GtCO2e.
Energy efficiency: Dairy processing is among the most energy‐ and carbon‐intensive activities within the global food production industry, with estimated annual emissions of over 128 MtCO2 (Xu and Flapper, 2009, 2011).Within dairy processing, cheese production is the most energy intensive sector (Xu et al., 2009). Specific energy use in processed meat is very high. Energy input difference between plant‐ and meat‐based meals may exceed a factor of 10 (GEA, 2012). The three largest uses of energy in the food industry in the US are animal slaughtering and processing, wet corn milling, fruit and vegetable preservation, accounting for 19%, 15% and 14% of total use respectively (US EIA, 2009). Increased use of heat exchanger networks or heat pumps (Fritzson and Berntsson, 2006), Combined heat and power, mechanical dewatering compared to rotary drying (Masanet et al., 2008),direct use of turbine gas for drying compared to steam‐based heating methods (Masanet et al., 2008), thermal and mechanical vapour recompression in drying further enhanced by use of reverse osmosis can deliver energy use efficiency. Many of these technologies could also be used in cooking and drying in other parts of the food industry. Savings in energy for refrigeration could be made with better insulation, and reduced ventilation in fridges and freezers.
Emissions efficiency and fuel switching: The most cost effective reduction in CO2 emissions would be achieved by switching from heavy fuel oil to natural gas. Other ways of improving emissions efficiency using lower‐emission modes of transport (Garnett, 2011). In transporting food, there is a trade‐off between local sourcing, and producing the food in areas where there are other environmental benefits (Sim et al., 2007; Edwards‐Jones et al., 2008). Landfill emissions associated with this food waste could be reduced by use of anaerobic digestion processes (Woods et al., 2010).
Demand Reduction: In addition, overall demand for food could be reduced without sacrificing wellbeing (GEA, 2012). Up to one third of food produced for human consumption is wasted in either in production/retailing stage, or by consumers. Gustavsonn et al. (2011) suggest that, in developed countries, consumer behaviour could be changed, and ‘best‐before‐dates’ reviewed, while in developing countries small farmers can be encouraged to organize, diversify and upscale their production and marketing, and investments can be on infrastructure and transportation. Increasing cooling demand, the globalization of the food system with corresponding transport distances, and the growing importance of processed convenience food and eating out are also important drivers (GEA, 2012). Globally, approximately 1.5 billion out of 5 billion people over the age of 20 are overweight and 500 million are obese (Beddington et al., 2011). Demand for high‐emission food such as meat and dairy products could therefore be replaced by demand for other, lower‐emission foods. Meat and dairy products contribute to half of the emissions from food (when the emissions from the up‐stream processes are included) according to Garnett (2009), while Stehfest et al. (2009) puts the figure at 18% of global GHG emissions. Furthermore, demand is set to double by 2050, as developing nations grow wealthier and eat more meat and dairy foods (Stehfest et al., 2009; Garnett, 2009). In order to maintain a constant total demand for meat and dairy, Garnet (2009). Healthy dietary choice in countries with consumption level in 2008 above prescribed meat consumption alone has global primary energy saving potential of 1.4% (GEA, 2012).

Second Order Draft (SOD) IPCC WG III AR5
Do Not Cite, Quote or Distribute 26 of 92 Chapter 10 WGIII_AR5_Draft2_Ch10.doc 22 February 2013
10.4.7 Textiles 1
In 2009, textiles and leather manufacturing consumed 2.15 EJ final energy globally. Global consumption is dominated by Asia, which was responsible for 65% of total world energy use for textiles and leather manufacturing (56% of global energy use was from China) in 2009. In the U.S., about 45% of the final energy used for textile mills is natural gas, about 35% is net electricity (site), and 14% coal (US EIA, 2009). In China, final energy consumption for textiles production is dominated by coal (39%) and site electricity (38%) (NBS, 2010). In the U.S. textile industry, motor driven systems and steam systems dominate energy end uses. Around 36% of the energy input to the U.S. textile industry is lost onsite, with motor driven systems responsible for 13%, followed by energy distribution and boiler losses of 8% and 7%, respectively (US DoE, 2004b).
2 3 4 5 6 7 8 9
10
11 12 13 14 15 16 17
18
20 21 22 23 24 25 26 27 28 29 30 31 32
33 34 35 36 37 38
39 40 41 42 43 44 45
46 47 48
Energy and emissions efficiency: Numerous energy efficiency technologies and measures exist that are applicable to the textile industry (CIPEC, 2007; ECCJ, 2007; Hasanbeigi and Price, 2012). Hong et al. (2010) reports energy savings of about 1% in Taiwan’s textile industry following the adoption of energy‐saving measures in 303 firms (less than 10% of the total number of textile firms in Taiwan in 2005) (Chen Chiu, 2009). In India, CO2 emissions reductions of at least 13% were calculated based on implementation of operations and maintenance improvements, fuel switching, and adoption of five energy‐efficient technologies (Velavan et al., 2009).
Demand reduction: see Box 10.2.
10.4.8 Mining 19 In general, there is little data available on energy use by specific mining process, equipment type or fuel type utilized. Investments in state‐of‐the‐art equipment and further research can help reduction in energy consumption (US DoE, 2007; Smith, 2012). Whilst every mine is different, the major area of energy usage, mainly electricity, is in comminution which usually makes up 40‐90% of total energy usage (Smith, 2012). Underground mining requires more energy than surface mining due to greater requirements for hauling, ventilation, water pumping, and other operations (US DoE, 2007). Strategies for GHG mitigation are diverse. An overall scheme to reduce energy consumption is the Implementation of strategies that upgrade the ore body concentration before crushing and grinding, through resource characterization by geo‐metallurgical data and methods (Bye, 2005, 2007, 2011; CRC ORE, 2011; Smith, 2012) Selective blast design, combined with ore sorting and gangue rejection, significantly improve the grade of ore being fed to the crusher and grinding mill, by as much as 2.5 fold, this leads to large reductions of energy usage compared to business‐as‐usual (CRC ORE, 2011; Smith, 2012).
There is also a significant potential to save energy in comminution through the following steps: more crushing, less grinding, using more energy efficient crushing technologies, removing minerals and gangue from the crushing stage, optimizing the particle size feed for grinding mills from crushing mills, the selection of target product size(s) at each stage of the circuit, using advanced flexible comminution circuits, using more efficient grinding equipment, and improving the design of new comminution equipment (Smith, 2012).
Other important energy savings opportunities are in the following areas: a) separation processes – mixers, agitators and froth flotation cells b) drying and dewatering in mineral processing c) materials movement d) air ventilation and conditioning opportunities; e) processing site energy demand management and waste heat recovery options; ) technology specific for lighting, motors, pumps and fans and air compressor systems; and g) Improvement in energy efficiency of product transport from mine site to port (Rathmann, 2007; Raaz and Mentges, 2009; Norgate and Haque, 2010; Daniel et al., 2010; DRET, 2011; Smith, 2012).
Material efficiency: The extraction of metal ores, one of the greatest challenges for energy efficiency enhancement is that of recovery ratio, which refers to the percentage of valualble ore within the total mine material. Lower grades inevitably require greater amounts of material to be moved per
Second Order Draft (SOD) IPCC WG III AR5
Do Not Cite, Quote or Distribute 27 of 92 Chapter 10 WGIII_AR5_Draft2_Ch10.doc 22 February 2013
unit of product. The recovery ratio for metals averages about 4.5% (US DoE, 2007). The ‘grade’ of recyclable materials is often greater than the one of ores being currently mined, for this reason advancing recycling for mineral commodities would bring improvements in the overall energy efficieny (IIED, 2002).
1 2 3 4
5 6 7
8 9
10
Recycling represents an important source of world´s metal supply and it can be increased. In recent years, around 36% of world´s gold supply was from recycled scrap (WGC, 2011), 29% of silver (SI, 2012) and 35 % of copper (ICSG, 2012).
Emissions efficiency and fuel switching: Substitution of onsite fossil fuel electricity generators for renewable energy is an important GHG mitigation strategy. A recent study shows negative abatement costs for almost all selected mitigation strategies in the Australian mining sector including solar CSP thermal (Smith, 2012). 11
12 13
14 15 16 17 18 19
20 21 22 23 24 25
26 27 28 29
FAQ 10.2. What are the main mitigation options in the industry sector and what is the potential for reducing GHG emissions?
Options for mitigation of GHG emissions from industry fall into the following categories: energy efficiency, emissions efficiency (including fuel and feedstock switching, CCS), material efficiency (for example through lightweight design with reduced yield losses in production), specific product characteristics (e.g. products with longer lifetime), and reduction of demand for products (e.g. through more intensive use of cars) and services (e.g., less mobility service by motorized individual transport).
In the last two to three decades there has been a strong improvement in energy and process efficiency in industry, driven by the relatively high share of energy costs. As a result, energy intensities in best practice are increasingly approaching technical limits, with particularly in the major energy intensive industries. However, many options for efficiency improvement still remain, and there is still significant potential to reduce the gap between actual energy use and the best practice in most industries and in most countries.
In contrast to energy efficiency, material efficiency ‐ using less new material to provide the same final service ‐ is an important and promising option for GHG reductions that has to date had little attention. In addition, long‐term step‐change options including a shift to low carbon electricity or radical product innovations (e.g. alternatives to cement) may have the potential to contribute to significant GHG mitigation in the future. 30
32 33 34 35 36 37 38 39 40 41 42 43
44
10.5 Infrastructure and systemic perspectives 31
Getting a better understanding on interactions among different industries, and between industry and other economic sectors is becoming more important. Strategies adopted in other sectors may lead to increased emissions from the industry sector. Collaborative activities within and across the sector may enhance GHG mitigation efforts. Initiatives to adopt a system‐wide view face a barrier as current system boundaries often pose a challenge. A systemic approach can be conducted at different levels, namely, at the micro‐level (within a single company, such as process integration and cleaner production), meso‐level (between three or more companies, such as eco‐industrial parks) and macro‐level (cross‐sectoral cooperation, such as urban symbiosis or regional eco‐industrial network). The section shows that collaborative activities derived from a systemic perspective can reduce the total consumption of materials and energy and contribute to the reduction of GHG emissions. The following discussion is mainly focusing on the meso‐ and macro‐levels as micro‐level options have already been covered in section 10.4.

Second Order Draft (SOD) IPCC WG III AR5
Do Not Cite, Quote or Distribute 28 of 92 Chapter 10 WGIII_AR5_Draft2_Ch10.doc 22 February 2013
10.5.1 Industrial clusters and parks (meso‐level) 1
Small and medium enterprises (SMEs) often suffer not only from difficulties arising due to their size and lack of access to information but also from being isolated (Sengenberger and Pyke, 1992). Clustering of SMEs can facilitate growth and competitiveness (Schmitz, 1995), usually in the form of industrial parks. In terms of implementation of GHG mitigation options, SMEs can benefit from by‐products exchange (including waste heat) and infrastructure sharing, as well as joint purchase (e.g. of energy efficient technologies).
2 3 4 5 6 7
8 9
10 11 12 13 14 15 16 17 18 19 20
21 22 23 24 25 26 27 28 29 30 31 32 33
35 36 37 38 39 40 41 42 43 44
The objective of cooperation in eco‐industrial parks (EIPs) is to reduce the cumulative environmental impact of the whole industrial park in a manner which encourages by‐products exchange among different companies so that a closed loop cycle can be set up (Geng and Doberstein, 2008). Such an initiative can reduce the total consumption of virgin materials and appearance of final waste, and improve the efficiency of companies and their competitiveness. Since the extraction and transformation of virgin materials is usually energy intensive, EIP efforts can abate industrial GHG emissions. In order to encourage target‐oriented cooperation among companies, many countries initiate EIPs. For instance, Chinese eco‐industrial park standards contain quantitative indicators for material reduction and recycling, as well as pollution control (Geng et al., 2009). Two pioneering eco‐industrial parks in China had achieved over 80% solid waste reuse ratio and over 82% industrial water reuse ratio during 2002‐2005 (Geng et al., 2008). The Japanese eco‐town project in Kawasaki achieved substitution of 513, 000 tons of raw material, resulting in the avoidance of 1% of the current total landfill in Japan during 1997‐2006 (Van Berkel et al., 2009).
In order to encourage industrial symbiosis6 at industrial cluster level, different kinds of technical infrastructures (e.g. pipelines) as well as non‐technical infrastructure (e.g. information exchange platforms) are necessary so that both material and energy use can be optimized (Côté and Hall, 1995). Although additional investment for infrastructure building is unavoidable, such an investment can bring both economic and environmental benefits. In India there have been several instances where government is providing land and infrastructure/easy access to water, non conventional (MSW based) power to private sector industries such as chemicals, textile, paper, pharmaceutical companies, cement operating in clusters. A case study in Tianjin Economic Development Area indicates that the application of an integrated water optimization model (e.g. reuse treated wastewater by other firms) can reduce the total water related costs by 10.37%, fresh water consumption by 16.9% and wastewater discharge by 45.6% (Geng et al., 2007). As an additional consequence, due to the strong energy‐water nexus energy use and release of GHG emissions related to fresh water provision or wastewater treatment can be reduced.
10.5.2 Cross‐sectoral cooperation (macro level) 34
Besides inter‐industry cooperation opportunities arise from the geographic proximity of urban and industrial areas, leading to transfer urban refuse as a resource to industrial applications, and vice versa (Geng, Fujita, et al., 2010). For instance, the cement industry can accept not only virgin materials (such as limestone and coal), but also various wastes/industrial by‐products as their inputs (cf. section 10.4) contributing up to 15‐20% CO2 emission reduction (Morimoto et al., 2006; Hashimoto et al., 2010). In Sweden, both exhaust heat from industries and heat generated from burning municipal wastes are supplied to local municipal users through district heating (Holmgren and Gebremedhin, 2004). Industrial waste can also be used to reduce conventional fuel demand in other sectors. For example, the European bio‐DME project7 aims to supply heavy‐duty trucks and industry with dimethyl‐ether fuel made from black liquor produced by the pulp industry in Sweden.
6 Note that industrial symbiosis is further covered in chapter 4 (Sustainable Development and Equity), subsection 4.4.3.3
7 Production of DME from biomass and utilisation of fuel for transport and industrial use. Project website at: http://www.biodme.eu.

Second Order Draft (SOD) IPCC WG III AR5
Do Not Cite, Quote or Distribute 29 of 92 Chapter 10 WGIII_AR5_Draft2_Ch10.doc 22 February 2013
However, careful design of regional recycling networks has to be undertaken because different types of waste have different characteristics, optimal collection and recycling boundaries and therefore need different infrastructure support (Chen et al., 2012).
1 2 3
4 5 6 7 8 9
10
12 13 14 15 16 17 18 19 20 21 22 23 24 25
26 27 28 29 30 31 32
33 34 35 36 37 38
The reuse of materials recovered from urban infrastructures can reduce the demand for primary products (e.g. ore) and thus contribute to GHG mitigation in extractive industries (Klinglmair and Fellner, 2010). So far, reuse of specific materials is only partly established and potential for future urban mining is growing as urban stock of materials still increases. While in 2003 in Japan only 7.45 Mt of steel scrap came from the building sector, 19.4 Mt were consumed by the building sector. In total, urban stock of steel is estimated to be 1.32 billion tonnes in Japan where the total annual crude steel production was 0.11 billion tonnes in FY2010 (JISF, 2012).
10.5.3 Cross‐sectoral implications of mitigation efforts 11
Currently much attention is focused on improving end‐use energy efficiency (Yeo and Gabbai, 2011). Many mitigation strategies from other sectors significantly interact with the industrial sector and industry‐related GHG emissions, such as material substitution for car manufacturing (e.g. potential lightweight materials: cf. chapter 8), growing demand for rechargeable vehicle batteries (cf. chapter 8) and the demand for new materials (e.g. innovative building structures or thermal insulation for buildings: cf. chapter 9; high‐temperature steel for power plants: cf. chapter 7). These materials or products consume energy at the time of manufacturing, but the potential energy‐saving effect is observed over a long period of time (ICCA, 2009) and other sectors than the industry sector take credit for the corresponding GHG mitigation effect. Thus, for a careful assessment of mitigation options a life cycle perspective is needed so that a holistic emission picture (including embodied emissions) can be presented. For instance, the increase in GHG emissions from increased aluminum production could under specific circumstances be larger than the GHG savings from vehicle weight reduction (Geyer, 2008). Kim et al. (2010) have however indicated that in about two decades, closed‐loop recycling can significantly reduce the impacts of aluminum‐intensive vehicles.
A further example of an interaction between non‐industry sector mitigation strategies and industry is the increased extraction of raw materials for low‐carbon energy technologies. Besides the induced energy consumption in that context other factors have to be considered. Moss et al. (2011) examined market and political risks for 14 metals that are used in significant quantities in the technologies of the EU’s Strategic Energy Technology Plan (SET Plan) so that metal requirements and associated bottlenecks in green technologies, such as electric vehicles, low‐carbon lighting, electricity storage and fuel cells and hydrogen, can be recognized.
Following a systemic perspective enables the identification of unexpected outcomes and even potential conflicts between different targets when implementing mitigation options.. For example, the quality of many recycled metals is maintained solely through the addition of pure primary materials (Verhoef et al., 2004), thus perpetuating the use of these materials and creating a challenge for the set up of closed loop recycling (e.g. automotive aluminum, (Kim et al., 2011)). Additionally, due to product retention (the period of use) and growing demand, secondary materials needed for recycling are limited. 39
40 41
42 43 44 45 46 47 48
FAQ 10.3. How will interactions with other sectors and collaboration among industry sectors affect emissions from industry?
Mitigation strategies in other sectors may lead to increased emissions in industry, for example higher production of solar cells (PV) and insulation materials for buildings. On the other hand consumer choice for goods with longer lifetime or low meat diet choice can reduce emissions from industry sector. However, assessment of such strategies need a careful net‐balance calculation as higher quality products enabling a longer or more intensive use might require more energy in the production process in comparison with standard products or might hinder to make use of technological progress in terms of energy efficiency increase.

Second Order Draft (SOD) IPCC WG III AR5
Do Not Cite, Quote or Distribute 30 of 92 Chapter 10 WGIII_AR5_Draft2_Ch10.doc 22 February 2013
Moreover, collaborative interactions between industry and other economic sectors have significant potential for GHG mitigation. Examples for cross‐sectoral cooperation are the use of agricultural and municipal waste in industry sector or heat cascading. In addition inter‐sectoral cooperation, i.e. collaborative interactions among industries in industrial parks, or with regional eco‐industrial networks can contribute to GHG mitigation.
1 2 3 4 5
7 8
9 10 11 12 13 14 15 16 17
19 20 21 22 23 24 25 26 27 28 29 30 31
33 34 35
36 37 38 39
10.6 Climate change feedback and interaction with adaptation 6
There is currently a distinct lack of knowledge on how climate change feedbacks may impact mitigation options and potentials as well as costs in industry8.
Insights into potential synergy effects (how adaptation options could reduce emissions in industry) or trade offs (how adaptation options could lead to additional emissions in industry) are also lacking. However, it can be expected that many adaptation options will generate additional industrial product demand and will lead to additional emissions in the sector. Improving flood defence, for example, in response to sea level rise may lead to a growing demand for materials for embankment. Manufacturers of textile products, machinery for agriculture or construction, and heating/cooling equipment may be affected by changing product requirements (in number and quality) due to climate change. There is as yet no comprehensive assessment of these effects, nor any estimate on market effects resulting from changes in demand for products.
10.7 Costs and potentials 18
Five categories of options discussed in 10.4 for the manufacturing industries can deliver mitigation benefit at varying levels and at varying costs across subsectors. There is not much comprehensive detailed information on costs and potentials associated with each of the mitigation options so far. Mitigation potential assessments are not always supplemented by cost estimates. Also, available cost estimates are not always comparable across studies due to diversity in the treatment of costs. There are many option‐based potential assessments for individual industries with varying time horizons; some studies report mitigation potential with associated investment costs which do not account for the full life time benefits of energy efficiency investments, other studies report marginal abatement costs based on mostly technological options. The sections below provide an assessment using all three categories of information available in the literature (including underlying databases used by some of such studies) and distinguish mitigation of CO2 and non‐CO2 emissions. Generally, the assessment of costs seemed very uncertain. Already the inclusion of non‐energy benefits might change the cost‐effectiveness of a technology completely. Co‐benefits are discussed in 10.8.
10.7.1 CO2‐emissions 32
Quantitative assessments of CO2 emission reduction potential for the industrial sector explored in this section are mainly based on: a) studies with a global scope (IEA, McKinsey, UNIDO), (b) marginal abatement cost studies and (c) various available technology/country specific data.
IEA estimates a global potential for the overall industry sector of 5.5 to 7.5 Gt CO2 for the year 2050 (IEA, 2012d)9. The IEA (2012d) shows a range of 50% reduction in four key sectors (iron and steel, cement, chemicals, and paper), but for aluminium the estimate is in the range of 20%. From a regional perspective, China and India comprise 44% of the potential. In terms of how different
8 There is a limited amount of literature on the impacts of climate change on industry (e.g. availability of water for the food industry and in general for cooling and processing in many different industries), and these are dealt within WG 2 of AR 5, Chapter 10.
9 Expressed here in the form of a deployment potential (difference between the 6DS and 2DS scenarios) rather than the technical potential or limitiation.
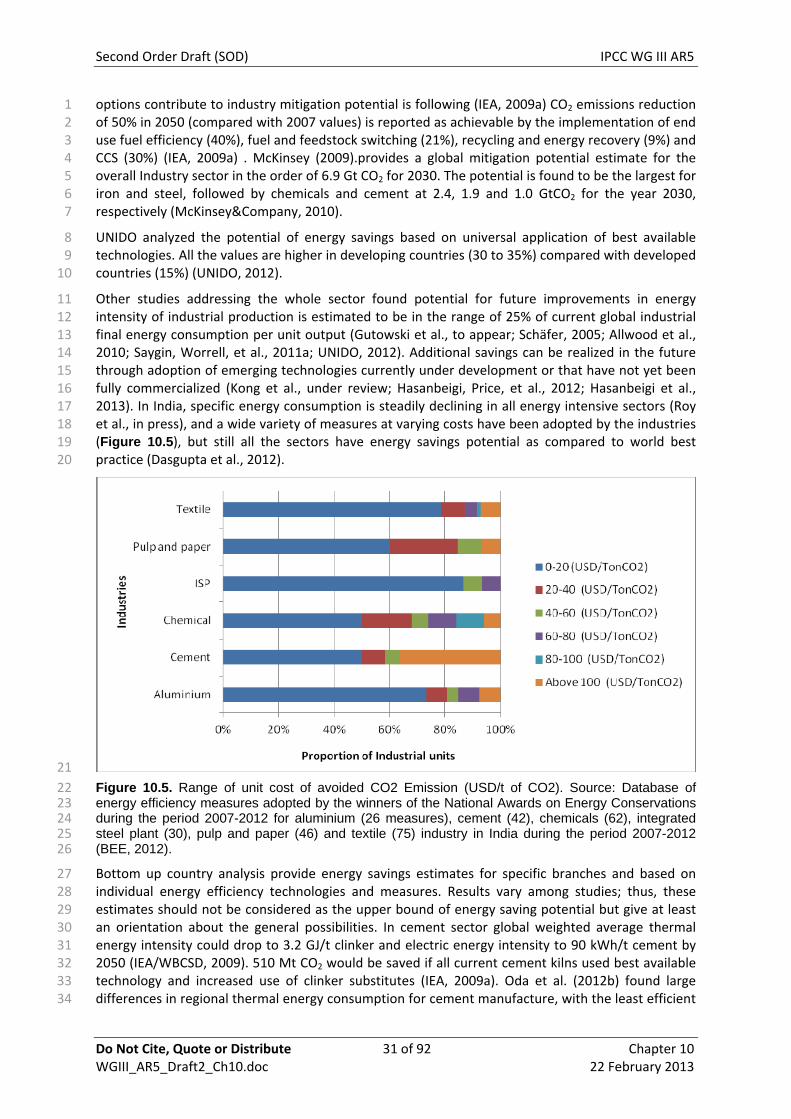
Second Order Draft (SOD) IPCC WG III AR5
Do Not Cite, Quote or Distribute 31 of 92 Chapter 10 WGIII_AR5_Draft2_Ch10.doc 22 February 2013
options contribute to industry mitigation potential is following (IEA, 2009a) CO2 emissions reduction of 50% in 2050 (compared with 2007 values) is reported as achievable by the implementation of end use fuel efficiency (40%), fuel and feedstock switching (21%), recycling and energy recovery (9%) and CCS (30%) (IEA, 2009a) . McKinsey (2009).provides a global mitigation potential estimate for the overall Industry sector in the order of 6.9 Gt CO2 for 2030. The potential is found to be the largest for iron and steel, followed by chemicals and cement at 2.4, 1.9 and 1.0 GtCO2 for the year 2030, respectively (McKinsey&Company, 2010).
1 2 3 4 5 6 7
8 9
10
11 12 13 14 15 16 17 18 19 20
UNIDO analyzed the potential of energy savings based on universal application of best available technologies. All the values are higher in developing countries (30 to 35%) compared with developed countries (15%) (UNIDO, 2012).
Other studies addressing the whole sector found potential for future improvements in energy intensity of industrial production is estimated to be in the range of 25% of current global industrial final energy consumption per unit output (Gutowski et al., to appear; Schäfer, 2005; Allwood et al., 2010; Saygin, Worrell, et al., 2011a; UNIDO, 2012). Additional savings can be realized in the future through adoption of emerging technologies currently under development or that have not yet been fully commercialized (Kong et al., under review; Hasanbeigi, Price, et al., 2012; Hasanbeigi et al., 2013). In India, specific energy consumption is steadily declining in all energy intensive sectors (Roy et al., in press), and a wide variety of measures at varying costs have been adopted by the industries (Figure 10.5), but still all the sectors have energy savings potential as compared to world best practice (Dasgupta et al., 2012).
21
22 23 24 25 26
27 28 29 30 31 32 33 34
Figure 10.5. Range of unit cost of avoided CO2 Emission (USD/t of CO2). Source: Database of energy efficiency measures adopted by the winners of the National Awards on Energy Conservations during the period 2007-2012 for aluminium (26 measures), cement (42), chemicals (62), integrated steel plant (30), pulp and paper (46) and textile (75) industry in India during the period 2007-2012 (BEE, 2012).
Bottom up country analysis provide energy savings estimates for specific branches and based on individual energy efficiency technologies and measures. Results vary among studies; thus, these estimates should not be considered as the upper bound of energy saving potential but give at least an orientation about the general possibilities. In cement sector global weighted average thermal energy intensity could drop to 3.2 GJ/t clinker and electric energy intensity to 90 kWh/t cement by 2050 (IEA/WBCSD, 2009). 510 Mt CO2 would be saved if all current cement kilns used best available technology and increased use of clinker substitutes (IEA, 2009a). Oda et al. (2012b) found large differences in regional thermal energy consumption for cement manufacture, with the least efficient

Second Order Draft (SOD) IPCC WG III AR5
Do Not Cite, Quote or Distribute 32 of 92 Chapter 10 WGIII_AR5_Draft2_Ch10.doc 22 February 2013
region consuming 75% more energy than the best in 2005. Even though processing alternative fuels requires additional electricity consumption (Oda et al., 2012b), their use could reduce cement sector emissions by 0.16 Gt CO2e per year by 2030 (Vattenfall, 2007) although increasing costs may in due course limit uptake (IEA/WBCSD, 2009). Implementing commercial‐scale CCS in the cement industry would increase cement production costs by 40‐90% (IEAGHG, 2008). Cumulative energy savings potential for China’s total cement industry for 2010‐2030 is estimated to be equal to around 30% of total primary energy supply of Latin America or the Middle East or around 70% of primary energy supply of Brazil in 2007, over 90% of which can be realized at net negative cost during that period (Hasanbeigi, Morrow, et al., 2012). Electricity and fuel savings of 6 and 1.5 times the total electricity and fuel use in the Indian cement industry in 2010, respectively, can be realized for the period 2010‐2030, almost all of which is at a net negative cost (Morrow et al., 2012a). About 50% of the electricity used by Thailand’s cement industry in 2005 could have been saved (16% at net negative cost), while about 20% of the fuel use could have been reduced, about 80% at net negative cost (Hasanbeigi et al., 2010, 2011). CCAP (2005) estimated cumulative direct CO2 emissions reductions of up to 47 MtCO2 between 2005 and 2025, of which 77% has a negative abatement cost (CCAP, 2005).
1 2 3 4 5 6 7 8 9
10 11 12 13 14 15
16 17 18 19 20 21 22 23 24 25 26 27 28 29 30
31 32 33
34 35 36 37 38 39 40 41 42 43 44 45 46 47
48 49 50
Total technical primary energy saving potential of the Chinese steel industry from 2010‐2030 is around 72% of total primary energy supply of Latin America or the Middle East or around 168% of primary energy supply of Brazil in 2007. Nearly 60% of the estimated electricity savings and all of the fuel savings can be realized at a net negative cost (Hasanbeigi et al., in press). Total technical primary energy savings potential of the Indian steel industry from 2010‐2030 is equal to around 87% of total primary energy use in the Indian steel industry in 2007, of which 91% of the electricity savings and 64% of the fuel savings can be achieved at a net negative cost (Morrow et al., 2012b). Total technical electricity and fuel savings potential for China’s pulp and paper industry in 2010 are estimated to be 4.3% and 38%, respectively. All of the electricity and 70% of the fuel savings can be realized at a net negative cost (Kong et al., forthcoming). Fleiter et al. (2012)found energy saving potentials for the German pulp and paper industry of 21% and 16% of fuel and electricity demand in 2035, respectively. The savings result in 3 MtCO2 emissions reduction with two‐thirds of this savings having negative abatement cost (Fleiter, Fehrenbach, et al., 2012). Zafeiris (2010) estimates energy saving potential of 6.2% of the global energy demand of the pulp and paper industry in year 2030. More than 90% of the estimated savings potential can be realized at negative cost (Zafeiris, 2010).
The energy intensity of the European pulp and paper industry reduced from 16 to 13.5 GJ per tonne of paper between 1990 and 2008 (Allwood et al., 2012, p. 318; CEPI, 2011). However, energy intensity has now stabilised, and few significant future efficiencies are forecast.
In non‐ferrous production (aluminium/others), energy accounts for nearly 40% of aluminium production costs. IEA forecasts a maximum possible 12% future saving in energy requirements by future efficiencies. In food processing, reductions between 5% and 35% of total CO2 emissions can be made by investing in increased heat exchanger networks or heat pumps (Fritzson and Berntsson, 2006). Combined heat and power can reduce energy demand by 20‐30%. Around 83% of the energy used in wet corn milling is for dewatering, drying, and evaporation processes (Galitsky et al., 2003) and 60% of that used in fruit and vegetable processing is in boilers (Masanet et al., 2008). Mechanical dewatering potentially reduces the energy intensity of drying by 99% compared to rotary drying (Masanet et al., 2008). Direct use of turbine gas for drying, gives about 35‐45% estimated reductions in primary fuel consumption as compared to steam‐based heating methods (Masanet et al., 2008). Thermal and mechanical vapour recompression in drying, allows for estimated 15‐20% total energy savings, which could be increased further by use of reverse osmosis (Galitsky et al., 2003). Cullen et al. (2011) suggest that about 88% savings in energy for refrigeration could be made with better insulation, and reduced ventilation in fridges and freezers.
On extractive industries in general, there is very little data available for mineral extractive industries. Some analysis reveals that investments in state‐of‐the‐art equipment and further research could reduce energy consumption by almost 50% (SWEEP, 2011; US DoE, 2007).
Second Order Draft (SOD) IPCC WG III AR5
Do Not Cite, Quote or Distribute 33 of 92 Chapter 10 WGIII_AR5_Draft2_Ch10.doc 22 February 2013
Allwood et al. (2010) assess different strategies to achieve a 50% cut in the emissions of five sectors (cement, steel, paper, aluminium and plastics) by 2050 and reports stronger limitations for the industry sector (Allwood et al., 2010), because these sectors have already been subject to significant energy efficiency improvements. The conclusion is that this can only be achieved by implementing strategies at least partly going beyond the sectors boundaries: i.e. non destructive recycling, reducing demand through light weighting, life extension or substitution for other materials, and radical process innovations. As demand for these industries is expected to rise, consequently substantial mitigation potential lies outside the manufacturing sector through behavioral and social practice changes connected with comparable low costs, notwithstanding significant implementation barriers (cf. section 10.9).
1 2 3 4 5 6 7 8 9
10
11 12 13 14 15 16 17 18 19 20 21 22 23 24 25
26 27 28 29 30 31 32 33
34 35 36 37 38
39 40 41
Mitigation options can also be analyzed from the perspective of some industry wide technologies. Around two thirds of electricity consumption in the industrial sector is used to drive motors (McKane and Hasanbeigi, 2011). Steam generation represent 30% of global final industrial energy use. Efficiency of motor systems and steam systems can be improved by 20–25% and 10%, respectively (GEA, 2012; Brown et al., 2012). Improvements in the design and especially the operation of motor systems which include motors and associated system components in compressed air, pumping, and fan systems (McKane and Hasanbeigi, 2010, 2011; Saidur, 2010) which have the potential to save on the order of 2.58 EJ in final energy use globally (IEA, 2007), more efficient operation of process heating systems (LBNL and RDC, 2007; Hasanuzzaman et al., 2012) and steam systems (NREL et al., 2012), waste heat loss minimization and waste heat recovery (US DoE, 2004a, 2008), advanced cooling systems, the use of cogeneration (or combined heat and power) (Oland, 2004; Shipley et al., 2008; Brown et al., 2013), and the use of renewable energy sources can impact emission from many industries. Recent analysis show, for example, that recuperators can reduce furnace energy use by 25% while economizers can reduce boiler energy use by 10% to 20%, both with payback periods typically under 2 years (Hasanuzzaman et al., 2012).
Table 10.6 shows that, based on McKinsey (2012) Marginal Abatement Costs (MACs) data, 13‐19% mitigation potential in industry can be achieved at no cost or at cost less than 20 euro/tCO2, 12‐23% at 20‐50 Euro/tCO2, 16‐38% at Euro 50/tCO2. Depending on region, 33‐51% mitigation can be achieved at negative costs (McKinsey&Company, 2010; Akashi et al., 2011). For interpretation it has to be considered that limited information to understand what is the direct additional cost associated to additional reduction of CO2 through technological options is available. Moreover, for MACs typically system perspectives and system interdependencies are not taken into account (McKinsey&Company, 2010; Akashi et al., 2011).
(Akashi et al., 2011) indicate that the largest potential for CO2 emissions savings for some energy intensive industries remains in China and India. They also indicate that with associated costs under 100US$/tCO2 in 2030 the use of efficient blast furnaces in the steel industry in China and India can respectively reduce total emissions by 186 MtCO2 and 165 MtCO2. This represents a combined total of 75% of the global CO2 emissions reduction potential for this technology.
Various barriers which block technology adoption despite low direct costs are often not appropriately accounted for in mitigation cost assessments. Such barriers are discussed in the next section.

Second Order Draft (SOD) IPCC WG III AR5
Do Not Cite, Quote or Distribute 34 of 92 Chapter 10 WGIII_AR5_Draft2_Ch10.doc 22 February 2013
Table 10.6: Industrial Sector Abatement Potential, based on McKinsey (2012) Marginal Abatement Costs (MACs) data. Regional groupings correspond to: OECD1990 (OECD90), Reforming Economies (REF), Latin America and Caribbean (LAM), Middle East and Africa (MAF). See Annex II (Metrics and Methodology) for definition of regions.
1 2 3 4
Cost range (EUR/tCO2) Abatement Potential (% per range)
OECD90 REF LAM MAF ASIA Global
Main Technologies (Cumulative Abatement Potential > 75% o/ total)
<0 41% 47% 33% 43% 51% 48%
Co‐generation (I), Motor Systems (Ch), CHP (Ch), Clinker substitution (Ce), Other Industry (O)
0 ≤ C< 20 13% 14% 19% 15% 13% 14%
Energy efficiency general (I), Smelt reduction new and retrofit (I), Alternative fuels waste (Ce)
20 ≤ C < 50 23% 20% 11% 12% 19% 19% Coke substitution new and retrofit (I), CCS new build (I)
50 ≤ C 23% 19% 38% 30% 16% 19% CCS retrofit (I), CCS new and retrofit (Ch), CCS new (Ce)
% Region/Global 15% 8% 4% 5% 68% 100%
In the long term, however, it is maybe more relevant to look at radically new ways of producing these energy‐intensive products. Low‐carbon cements (e.g. celitements
5 6 7
9 10 11 12 13 14 15
17 18 19 20 21
22 23 24 25 26
27 28 29 30 31
10) might become relevant. But certainly, it is even more uncertain to assess costs here.
10.7.2 Non CO2‐emissions 8
Table 10.7 summarizes the costs and potentials for emission reduction of non‐CO2 gases resulting from activities in the industrial sector. The estimation for the year 2030 for emissions from different industrials sources is also included. Four sources concentrate 75% of the emissions. HFC‐23 emissions are related (in year 2030) to the production of HCFC‐22 for feedstock use, as its use as refrigerant will be phased out in 2035 (Miller and Kuijpers, 2011). Emissions resulting from the production of flat panel display and from photovoltaic manufacturing were not identified as a relevant source in AR4, but together will represent 30% of 2030 emissions.
10.7.3 Waste management 16 Mitigation potential and cost estimates are also available for waste management measures (note: the general discussion of waste management is part of the excursus section 10.13). Emissions from waste management for the year 2030 are estimated at 1.7 GtCO2 (McKinsey&Company, 2010; EPA, 2012). Two sources concentrate more than 90% of this amount: CH4 from landfilling of solid waste and CH4 from wastewater (EPA, 2012).
Table 10.8 provides a summary of costs and potentials for mitigation. The main mitigation technologies are also presented. Mitigation potential for landfills (in terms of % of potential above emissions for 2030) is double compared with wastewater. The mitigation potential in this case tends to concentrate in the higher costs options, due to the significant costs of constructing public wastewater collection systems and centralized treatments facilities.
In the case of landfills, the top 5 emitting countries (United States, China, Mexico, Malaysia and Turkey) account for 24% of the total abatement potential in the sector. In the case of wastewater, 60% of the abatement potential is concentrated in the top 5 emitting countries (United States, Indonesia, Mexico, Nigeria, and China). The distribution of the potential per region (in %) is: Asia 32, Latin America 15, Africa 15, Europe 12, North America 9, Eurasia 9 (EPA, 2012).
10 See http://www.celitement.de/en/

Second Order Draft (SOD) IPCC WG III AR5
Do Not Cite, Quote or Distribute 35 of 92 Chapter 10 WGIII_AR5_Draft2_Ch10.doc 22 February 2013
Table 10.7: Costs and potentials for mitigation emissions of Non-CO2 gases resulting from activities in the industrial sector. Sources: mitigation draft reports from (EPA, forthcoming), (Miller and Kuijpers, 2011). Note: N2O from Caprolactam production not included (no literature available).
1 2 3
Emissions (MtCO2e)
Mitigation potential (cumulated) by cost category
(US$/tCO2)
Source 2030 <0 <5 <20 <50 50+ Abatement Technologies
HFC‐23 from HCFC‐22 production 286 0 286 286 286 286 Thermal destruction PFCs, SF6 and NF3 from flat panel display manufacturing 162 0 0 0 63 130
Fueled combustion, plasma and catalytic abatement technologies
N2O from adipic and nitric acid production
147 0 30 93 115 119 Adipic acid: thermal destruction Nitric acid: secondary or tertiary catalysts, non selective catalytic reduction units
PFCs and NF3 from photovoltaic manufacturing 128 0 0 0 0 114
Thermal systems, catalytic systems, plasmas systems, NF3 chamber clean process
ODS substitutes: industrial refrigeration and cooling 87
Use of low or no GWP refrigerant, leak repair
CH4 and N2O from other industrial processes 83 PFC from aluminium production 37 3 3 15 17 17
Computer controls SWPB, Point feed SWPB
PFC and SF6 from semiconductor manufacture 22 9 9 11 11 11 Abatement system
Other sources 24
Total 976
4

Second Order Draft (SOD) IPCC WG III AR5
Do Not Cite, Quote or Distribute 36 of 92 Chapter 10 WGIII_AR5_Draft2_Ch10.doc 22 February 2013
Table 10.8: Costs and potentials from mitigation emissions of GHG gases resulting from activities in the waste sector (EPA, forthcoming).
1 2
Emissions (MtCO2e)
Mitigation potential (cumulated) by cost category (US$/tCO2)
Source 2030 <0 <5 <20 <50 <100 100+ Technologies
CH4 Landfilling of solid waste
959.4 137.3 214.7 334.7 341.6 428.9 612.4 Landfill gas collection and combustion, waste reduction, waste diversion alternatives (e.g. composting, anaerobic digestion, paper recycling, mechanical biological treatment, waste incineration)
CH4 Wastewater
608.8 3.3 4 15.6 34.1 53.1 191.2 Shifting from septic and latrine wastewater systems to individual (or centralized) aerobic wastewater treatment plants (WWTPs); shifting from open sewer systems to closed collection systems with aerobic WWTP; add‐on installation of anaerobic sludge digester for electricity generation
N2O Human Sewage ‐ Domestic Wastewater
100
CH4 and N2O Other Waste Sources
27
Total 1695
10.8 Co‐benefits, risks and spill‐over effects 3
Cost effectiveness and direct financial costs and paybacks are not the only drivers of final deployment of mitigation technologies. Slow diffusion of cost effective mitigation options can be overcome by explicit consideration of several other beneficial characteristics of the technologies (Fleiter, Hirzel, et al., 2012). Supporting arguments for implementation are amongst others: compatibility with existing system, social acceptance, divisibility, eco friendliness, relative advantage, level of social embedding (Geels and Schot, 2010). Investment decision of companies and priority setting of governments and also social acceptance can change with increasing knowledge of additional benefits, risk perception of adoption and non‐adoption associated with technological strategies and, uncertainties on the potential reliability of mitigation technologies among others. While general aspects of co‐benefits, adverse effects and risks and risk trade offs are discussed in chapters 2, 3 and 4, including those related to carbon price volatility, risk perception and socially‐acceptable risks etc., this section discusses illustrative examples that relate directly to industry sector mitigation options mentioned in Figure 10.1 and section 10.4. Table 10.9 provides consolidated view of co‐benefits and associated risks across see broad mitigation categories
4 5 6 7 8 9
10 11 12 13 14 15 16 17
19 20 21 22
.
10.8.1 Socio‐economic, environmental and health effects 18
The implementation of industrial GHG mitigation options can lead to positive and negative effects on the framework of industrial activity (e.g. competiveness Bassi et al., 2009) or on the whole economy and society (e.g. air quality). In general, quantifying the corresponding benefits and costs that a mitigation technology or practice produces is challenging, and moreover vey localised and different

Second Order Draft (SOD) IPCC WG III AR5
Do Not Cite, Quote or Distribute 37 of 92 Chapter 10 WGIII_AR5_Draft2_Ch10.doc 22 February 2013
1 2 3 4
5 6 7 8 9
10 11 12 13 14 15 16
stakeholders may have different perspectives of what the corresponding losses and gains are (Fleiter, Hirzel, et al., 2012). Identifying mitigation technology options that positively results in emissions reduction and energy efficiency improvements as well as minimizing negative outcomes on socio‐economic and environmental and health issues from local pollution are therefore critical.
At the company or sector level, a typical example of a co‐benefit from GHG mitigation in the industry sector is an increase in productivity of inputs via reduced use of energy or raw materials inputs and resultant production cost reduction. A study of the impact of energy saving technologies and innovation investments on the productivity of Chinese iron and steel enterprises found that productive efficiency growth can be attributed among other factors to the adoption and amelioration of energy saving measures and the investments in improved techniques associated with energy saving (Zhang and Wang, 2008). Other benefits to companies can include reduced costs of environmental compliance and waste disposal or decreased liability. It is important to note that co‐benefits need to be assessed in the light of the costs of implementation of the mitigation options (e.g. training requirements, losses during technology installation) (Worrell et al., 2003), which may be larger for SMEs or isolated enterprises (Crichton, 2006; Zhang and Wang, 2008; Ghosh and Roy, 2011).

Second Order Draft (SOD) IPCC WG III AR5
Do Not Cite, Quote or Distribute 38 of 92 Chapter 10 WGIII_AR5_Draft2_Ch10.doc 22 February 2013
Table 10.9: Co-benefits (+) and Risks (-) of mitigation options in industry 1 Mitigation Options Economic Social Environmental Other
Energy Efficiency for reducing energy requirements
(Crichton, 2006; Zhang and Wang, 2008; Ghosh and Roy, 2011; Worrell et al., 2003)
+ Low cost alternative
+ Reduce energy input costs
+ New improved technology
‐ Longer payback period
‐ Affordability for M/SME
+ Energy access improves
+ New business opportunity and market segment develops
+ Reduction of local pollution and associated local impacts on biodiversity
+ Reduction of water use
+ Leapfrog in technology development
‐ Innovation risk because feasibility not yet established (Worrell et al., 2003)
Emissions efficiency, fuel switching and CCS
(Das, 2011; Chakraborty and Roy, 2012a; Mestl et al., 2005)
+ New activity for using non conventional power
+ Reduced trade deficit
‐ Affordability with higher investment cost/input cost
+ Affordability with more waste recycling
‐ Competing demand of scarce land
+ New business opportunity
+ Reduced local air pollution with reduced coal use
+ New employment opportunity
+ Leapfrog in technology development
‐ New innovation, R&D need
‐ Technology transfer
‐ New skill development/training
‐ Social acceptance, institutional reform (esp. in case of CCS)
‐ Reform in relative fuel price policy
Material efficiency
(Clift and Wright, 2000; Clift, 2006; Allwood et al., 2011, 2012; Zhang and Wang, 2008)
+ Reduction in production cost
+ Reduction of societal costs of waste disposal
‐ Reduction in national sales tax revenue in medium term
+ New infrastructure for industrial clusters etc.
+ Reduced threat of displacement from reduced demand for landfill sites
+ Job creation in formal recycling market, potentially for poor in informal waste recycling market
+ Higher social acceptance with less extractive activity and increased waste recycling, reduction in waste
+ New business opportunity
+ Reduction of local pollution and wastes
+ Less use of virgin materials and natural resources
+ Leapfrog in technology development
‐ Innovation risk
‐ Investment and knowledge sharing of new innovation
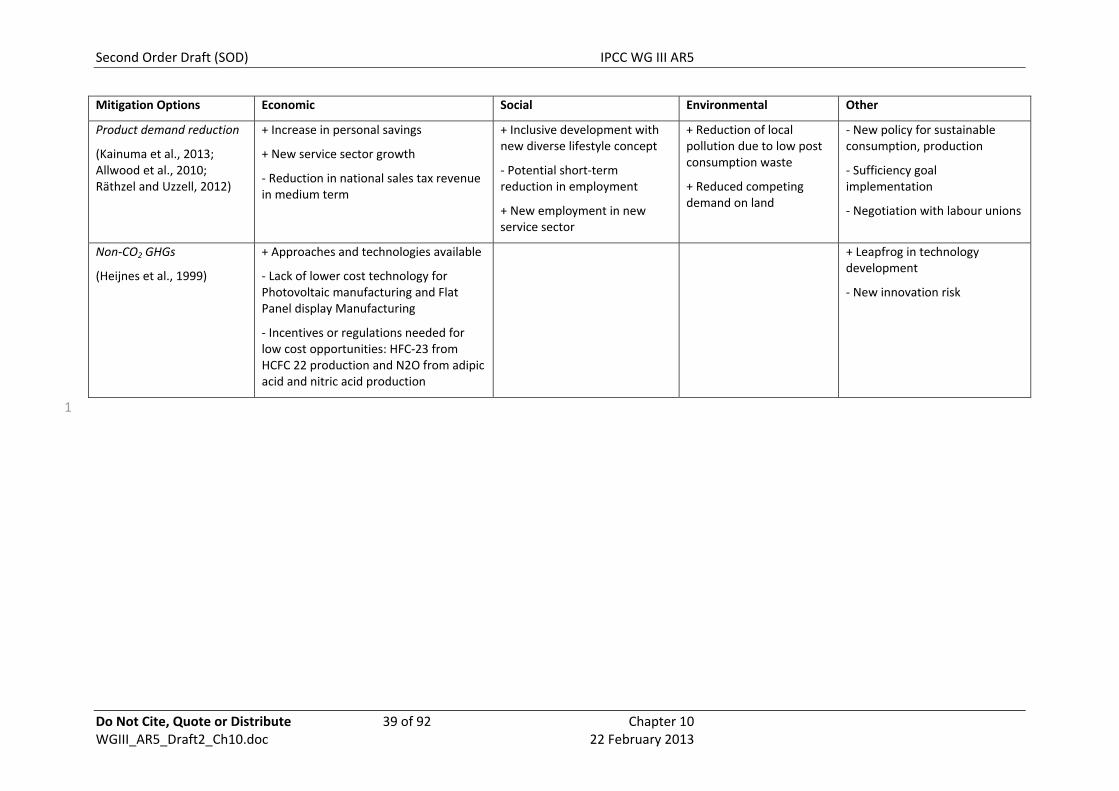
Second Order Draft (SOD) IPCC WG III AR5
Do Not Cite, Quote or Distribute 39 of 92 Chapter 10 WGIII_AR5_Draft2_Ch10.doc 22 February 2013
Mitigation Options Economic Social Environmental Other
Product demand reduction
(Kainuma et al., 2013; Allwood et al., 2010; Räthzel and Uzzell, 2012)
+ Increase in personal savings
+ New service sector growth
‐ Reduction in national sales tax revenue in medium term
+ Inclusive development with new diverse lifestyle concept
‐ Potential short‐term reduction in employment
+ New employment in new service sector
+ Reduction of local pollution due to low post consumption waste
+ Reduced competing demand on land
‐ New policy for sustainable consumption, production
‐ Sufficiency goal implementation
‐ Negotiation with labour unions
Non‐CO2 GHGs
(Heijnes et al., 1999)
+ Approaches and technologies available
‐ Lack of lower cost technology for Photovoltaic manufacturing and Flat Panel display Manufacturing
‐ Incentives or regulations needed for low cost opportunities: HFC‐23 from HCFC 22 production and N2O from adipic acid and nitric acid production
+ Leapfrog in technology development
‐ New innovation risk
1

Second Order Draft (SOD) IPCC WG III AR5
Do Not Cite, Quote or Distribute 40 of 92 Chapter 10 WGIII_AR5_Draft2_Ch10.doc 22 February 2013
At the economy‐wide level, mitigation policies in industry and services can have a positive effect on other policy objectives such as local pollution and therefore health. Quantification of these benefits is often done on a case‐by‐case basis. For example, Mestl et al. (2005) find that the environmental health benefits of using electric arc furnaces for steel production in the city of Tiyuan (China) could potentially lead to higher benefits than other options, despite being the most costly option. For India a detailed study (Chakraborty and Roy, 2012b) of 13 industrial sectors have shown several co‐benefits to neighbouring/larger society, positive effects on economic competitiveness, and resource conservation such as water have driven company level decisions for climate responsive mitigation actions.
1 2 3 4 5 6 7 8 9
10 11 12 13
14 15 16 17 18 19 20 21 22 23 24 25
26 27 28 29 30 31 32 33 34 35
36 37 38 39
41 42 43 44 45 46 47 48 49
There are a wide range of benefits to be harnessed from implementing material efficiency options, including the reduction in production costs, reduction in the demands for raw materials, and decreased amount of waste material going into the landfill, and emergence of new business opportunities related to material efficiency (Clift and Wright, 2000; Clift, 2006; Allwood et al., 2011).
In industry, possible spill‐over effects may be related to trade, carbon leakage, technology and knowledge transfer, among other things. Since Chapter 13 covers the issues in details here only an example of the issue of carbon leakage is presented which strongly relates to industry. There are concerns that industry’s competiveness would be lower in those countries where industries need to comply with specific mitigation policies, as carbon‐intensive industries would get relocated in countries with less stringent carbon abatement policies. Empirical evidence suggests that in reality only a small number of industries could suffer significant impacts (HM Treasury, 2006). Only a small share of the high GHG emitting industries have internationally mobile plants and processes and varied distribution options for their products enabling them effectively to go for trade diversion and relocation. For example, cement is bulky and hard to transport over long distances. Social acceptance is in favour of differentiated responsibility in historically low emitting and industrially less developed regions who envisage mitigation actions as counter developmental.
Trade‐offs often arise from the limitation of resources, and must be understood in order to decide what is the best option to allocate funds to. A typical example is the trade‐off between investing in mitigation vs. adaptation (Gunawansa and Kua, 2011; Chakraborty and Roy, 2012a). In the industry context an illustrative example is the potential competition between biomass applications for energy supply (heat, electricity) and biomass as a feedstock for the industry sector (e.g. biorefineries, automobile production). A clear conflict between economic development and mitigation policies is usually also found in the tourism sector. At the company level, companies may need to trade off between the investments in e.g. health and safety vs. those aimed at reducing their climate impact. Potential conflicts must be studied and opportunities where the co‐benefits are more significant than the conflicts must be identified.
Industrial applications of CCS could provide environmental co‐benefits, conditionally if using a post combustion system e.g. SCRs and FGD units must be installed so as to not poison the amine being used to capture the CO2. Hence, CCS enabled facilities have very low emissions rates for criteria pollutants even without specific policies being in place for those emissions (Kuramochi et al., 2012b).
10.8.2 Technological risks and uncertainties 40
While there is a wealth of literature on the environmental impacts of energy‐related mitigation technologies (e.g. biofuels, battery‐electric vehicles), knowledge on environmental risks for industrial mitigation options is so far lacking. Carbon dioxide capture and storage (CCS) is an example of a technological option subject to several risks and uncertainties (cf. chapter 7 for more in‐depth discussion). A particular set of potential health and safety and environmental risks could arise from additional mining activities as some mitigation technologies could substantially increase the need for specific materials (e.g. rare earths) and the exploitation of new extraction locations or methods accordingly. Also in the opposite case, if demand on particular materials were to be reduced, environmental risks could occur. For example, seventeen mines have recently closed in the

Second Order Draft (SOD) IPCC WG III AR5
Do Not Cite, Quote or Distribute 41 of 92 Chapter 10 WGIII_AR5_Draft2_Ch10.doc 22 February 2013
Philippines, many of which did not have the resources to implement post‐closure measures. However, investment in new facilities enables the opportunity to leapfrog the technologies present in existing facilities offering opportunities for sustainable development. But ease of technology transfer related issues govern the technology uptake rate (Das, 2011).
1 2 3 4
6 7 8 9
10 11 12 13 14 15 16 17 18 19
20 21 22
23 24 25 26 27 28
30 31 32
33
34
35 36
37
38
39 40
41 42
4344
10.8.3 Public perception 5
The asymmetric impacts that a particular industrial activity has on society can lead to different responses to its implementation. From a socio‐constructivist perspective social response to industrial activity depends on three sets of factors related to 1) the dynamics of regional development and the historical place of industry in the community, 2) the relationship between residents and the industry and local governance capacities, and 3) the social or socio‐economic impacts experienced (Fortin and Gagnon, 2006). Public hearing and stakeholder participation ‐especially on environmental and social impact assessment‐ prior to issuance of permission to operate has become mandatory in almost all countries now, and industries’ budget on social corporate responsibility is now disclosed as a good practice. Mitigation measures in the industry sector might be socially acceptable if they come along with co‐benefits for instance reducing not only GHG emission, but improving local environmental standards as a whole (e.g. energy efficiency measures that reduce local emission). Regional variation in commitment to mitigation activity through international negotiation creates public perception leading to public acceptance of mitigation action and investment.
Research on public perception and acceptability with specific regard to industrial applications of CCS is lacking (for the general discussion of CCS see chapter 7 ‐ to date there is no broad evidence whether public perception will be significantly different from CCS in power generation).
Few industries have as profound an influence on community development as mining. Mining activities have generated social conflicts in different parts of the world (Martinez‐Alier, 2001; WB, 2007; Germond‐Duret, 2012; Guha, 2013). The Latin American Observatory of Mining Conflicts reported more than 150 active mining conflicts in the region, most of which started in the 2000s (OCMAL, 2010). Besides this general experience, the potential for interactions of social tensions and greenhouse gas reduction mitigation initiatives in this sector are unknown.
10.9 Barriers and opportunities 29
Barriers and opportunities assessed in this section are the conditions that hinder or facilitate implementation of measures to reduce greenhouse gas emissions in industry. In general they are often not sufficiently captured in model studies and scenarios (cf. 10.10).
Typically, the following categories of barriers and opportunities can be distinguished:
Technological aspects
Technology: includes maturity, reliability, safety, performance, cost of technology options and systems, and gaps in information
Physical: includes availability of infrastructure, geography, and space available
Institutional, legal and cultural aspects
Institutional and legal: includes regulatory frameworks, and institutions that may enable investment
Cultural: includes public acceptance, workforce capacity (e.g. education, training, and knowledge), and cultural norms.
Financial aspects: includes investment risk, value proposition, competitiveness, and access to capital

Second Order Draft (SOD) IPCC WG III AR5
Do Not Cite, Quote or Distribute 42 of 92 Chapter 10 WGIII_AR5_Draft2_Ch10.doc 22 February 2013
Barriers must be resolved to allow implementation (see Flannery and Kheshgi, 2005). Barriers that are often common across sectors are given in Chapter 3.Table 10.10 summarizes barriers and opportunities for some of the major mitigation options listed in 10.4.
1 2 3
4
18 19 20 21 22
23 24 25 26 27 28 29 30 31 32 33 34 35 36 37
38
42 43 44 45 46 47
10.9.1 Energy efficiency for reducing energy requirements Even though energy costs often form a significant fraction of input costs in industry, a number of 5 barriers limit the industrial sector to take steps to minimize energy use via energy efficiency 6 measures. These barriers include: failure to recognize the positive impact of energy efficiency on 7 profitability; short investment payback thresholds; limited access to capital; impact of non‐energy 8 policies on energy efficiency; public acceptance of unconventional manufacturing processes; and a 9 wide range of market failures (IEA, 2009c). Schleich and Gruber (2008), however, find that energy‐10 intensive industries ‐ such as iron and steel, and mineral processing – are quite aware of potential 11 cost savings from investing in energy efficiency, which is automatically considered in investment 12 decisions. In contrast, they find that in the commercial and service sectors, the energy cost share is 13 usually low and for smaller companies overhead costs for energy management and training 14 personnel can be prohibitive (UNIDO, 2012; Ghosh and Roy, 2011). Of course, investment decisions 15 also consider investment risks which are generally not reflected in many mitigation cost estimates 16 included those shown in Section 10.7. 17
The importance of barriers depends on specific circumstances. By surveying the Swedish foundry industry, (Rohdin et al., 2007) found that access to capital was reported to be the largest barrier, followed by technical risk and other barriers. Foundries that were group‐owned were found to have strict investment criteria – e.g. 1‐3 year pay‐off for investments – whereas private companies reported that they do not use any formal investment criteria.
Cogeneration or combined heat and power (CHP) systems is a specific form of energy efficiency option is not only a means for the reduction of GHG emissions by improving system energy efficiency but help in reducing system cost and enhance independence from the grid power in many cases. For industry, however, (IEA, 2009c) CHP faces a complex set of economic, regulatory, social and political barriers that restrain its wider use including: market restriction securing a fair market value for electricity exported to the grid; high upfront costs compared to large power plants; difficulty concentrating suitable heat loads and lack of integrated planning; grid access; non‐transparent and technically demanding interconnection procedures; lack of consumer and policymaker knowledge about CHP energy, cost and emission savings; and industry perceptions that CHP is an investment outside their core business. Regulatory barriers are in the form of unfavourable tax rates, feed‐in tariffs. Utility law and regulatory provisions limit building of a CHP facility. For a cogeneration project of an existing facility, electricity price paid to a cogeneration facility is the most important variable determining the project’s success – more so than capital costs, operating and maintenance cost and even fuel costs (Meidel, 2005). Prices are affected by rules for electricity markets, which differ from region to region, can form either incentives or barriers for cogeneration (Meidel, 2005).
10.9.2 Emissions efficiency, fuel switching and carbon capture and storage Fuel switching within fossil fuels was mentioned in AR4 (Bernstein et al., 2007) and remain 39 applicable today also just always for related GHG reduction rationales (Burtraw et al., 2011) but due 40 to cost related co‐benefits also. 41
There are a number of challenges associated with feedstock and energy substitution in industry. Waste materials and biomass as fuel and feedstock substitutes are limited by their availability, hence competition could drive up prices and make industrial applications less attractive (IEA, 2009b). A decarbonised power sector would offer new opportunities to reduce CO2 intensity of some industrial processes via use of electricity, however, decarbonisation of power has barriers assessed in Chapter 7 that would need to be overcome.
Second Order Draft (SOD) IPCC WG III AR5
Do Not Cite, Quote or Distribute 43 of 92 Chapter 10 WGIII_AR5_Draft2_Ch10.doc 22 February 2013
The application of CCS to the industries covered in this chapter share many of the barriers to its application to power generation (cf. chapter 7). CO2 storage has had public perception issues in early experiences (see Section 7.9.4) which could help to overcome potential social acceptance, regulatory and permitting barriers in the future. With regard to application of CCS in industry particularly space constraints when applied in retrofit situations (CONCAWE, 2011), high capital costs and long project development times, investment risk associated with poorly defined liability, the trade‐exposed nature of many industries which can limit viable CCS business models, and generally the current lack of financial incentives to offset the additional cost of CCS (Kheshgi et al., 2012) are relevant. These barriers are further aggravated because of limited technology research on CO2 capture from cement production, iron and steel industries, and the petrochemical industry.
1 2 3 4 5 6 7 8 9
10
11
21
34 35 36 37 38
39
10.9.3 Material efficiency While there are clear opportunities in the technical feasibility of material efficiency options, their 12 commercial deployment so far remains at a small scale. Barriers to a circular economy which is a 13 growing model across various countries and aims systematically for the fulfilment of the hierarchy 14 principles of material efficiency “reduce, re‐use, recycle”, however, include lack of human and 15 institutional capacities to encourage management decisions and public participation (Geng and 16 Doberstein, 2008), and fragmented and weak institutions (Geng, Wang, et al., 2010). Improving 17 material efficiency by integration of different industries (cf. 10.5) is often limited by specific local 18 conditions, infrastructure requirements (e.g. pipelines) and the complexity of multiple users (Geng, 19 Wang, et al., 2010). 20
10.9.4 Product demand reduction (Allwood et al., 2011) identifies economic, regulatory and social barriers specific for demand 22 reduction for products. Improved product design can help to extend product lifetime but may not 23 satisfy user preferences, which can lead to the replacement of a functioning product by a new one 24 (Van Nes and Cramer, 2006; Allwood et al., 2011). Businesses are rewarded for growing sales 25 volumes and can prefer process innovation over product innovation (e.g. EIO, 2011, 2012). Existing 26 markets generally do not take into account negative externalities associated with resource use nor 27 do they adequately incorporate the risks of resource‐related conflicts (Bleischwitz et al., 2012; 28 Transatlantic Academy, 2012), yet existing national accounting systems based on GDP indicator also 29 support the pursuit of actions and policies that aim to increase demand spending for more products 30 (Roy and Pal, 2009; Jackson, T, 2011). Labour unions often have an ambivalent position in terms of 31 environmental policies and partly see environmental goals as threat for their livelihood (Räthzel and 32 Uzzell, 2012). 33
If, however, newer products result in lower operational emissions (e.g. improved energy efficiency), longer product lifetime may overwhelm embodied emissions due to an increase of operational emissions. For specific products such as washing machines it might be reasonable to replace them before their end‐of‐life (Scholl et al., 2010; Intlekofer et al., 2010; Fischer et al., 2012; Agrawal et al., 2012).
10.9.5 Non‐CO2 greenhouse gases Non‐CO2 greenhouse gas emissions are an important contributor to industry process emissions (note 40 that emissions of CO2 from calcination are another important contributor: for barriers to controlling 41 these emissions by CO2 capture and storage see 10.9.2). Barriers to preventing or avoiding the 42 release of HFCs, CFCs, HCFCs, PFC, SF6 in industry and from its products (IPCC/TEAP, 2005) include 43 for instance: lack of certification and control of leakage of HFCs from refrigeration (Heijnes et al., 44 1999); cost of recycled HFCs in markets where there is direct competition from newly produced HFCs 45 (Heijnes et al., 1999); lack of awareness (e.g., that Production of PV, Flat screen TV can increase non‐46 CO2 emissions), lack of information and communication and education about solvent replacements 47 (Heijnes et al., 1999); (IPCC/TEAP, 2005); cost of adaptation of existing aluminium production for PFC 48 emission reduction and the absence of lower cost technologies in such situations (Heijnes et al., 49

Second Order Draft (SOD) IPCC WG III AR5
Do Not Cite, Quote or Distribute 44 of 92 Chapter 10 WGIII_AR5_Draft2_Ch10.doc 22 February 2013
1999); cost of incineration of HFCs emitted in HCFC production (Heijnes et al., 1999); regulatory 1 barriers to alternatives to some HFC use in aerosols (IPCC/TEAP, 2005). The TEAP report (UNEP, 2 2010) found that there are technically and economically feasible substitutes for HCFCs, however, 3 transitional costs remain a barrier for smaller enterprises. 4
5
6 7
8 9
10 11 12 13 14
15 16 17 18 19 20
21 22 23 24 25 26 27
FAQ 10.4. What are the barriers to reducing emissions in industry and how can these be overcome? Are there any co-benefits associated with mitigation actions in industry?
Implementation of GHG mitigation measures in industry faces a variety of barriers: Expectation of high return on investment (short payback period), high capital costs and long project development times for several technologies, lack of access to capital for energy efficiency improvements and feedstock/fuel change, fair market value for cogenerated electricity to the grid, and lack of control of HFC leakage are typical examples. In addition, businesses, governments and labour unions all tend to drive for increased product demand. Existing national accounting systems based on GDP indicator also support the pursuit of actions and policies that act as barrier to demand reduction.
Reducing investment risk, barrier to access investment grade finance, better provisioning of user demand in the pursuit of human wellbeing could enable the reduction of industry emissions. Improvements in technologies, efficient sector specific policies (e.g. economic instruments, regulatory approaches and voluntary agreements), and information and energy management programmes could all contribute to overcome technological, financial, institutional, legal and cultural barriers.
Reduced emissions attainable through adaption of alternative technological options or behavioural change not only generates climate benefit but often helps industries to become more cost competitive through reduced input cost (be it energy input or material inputs) or waste disposal cost, can provide new market opportunities with new technology and low carbon products. Societal gains can also be multiple ranging from job creation to less displacement from competing demand for landfill sites. Environmental gains such as reduced air pollution, water pollution/virgin material extraction yields health benefits and enables growth on sustainable development path and enhances public acceptance. 28
29 30
Table 10.10: Barriers (-) and opportunities (+) for greenhouse gas emission reduction options in industry. References and discussion appear in respective sub-sections of 10.9.
Energy Efficiency for reducing energy requirements
Emissions efficiency, fuel switching and CCS
Material efficiency
Product demand reduction
Non‐CO2 GHGs
Technological Aspects: Technology
+ many options available
‐ technical risk
+ cogeneration mature in heavy industry
‐ non‐transparent and technically demanding interconnection procedures for cogeneration
+ fuels and technologies readily available
‐ retrofit challenges
+ large potential scope for CCS in cement production, iron and steel, and petrochemicals
‐ lack of CCS technology development, demonstration and maturity for industry applications
+ options available
‐ commercial deployment limited
‐ slower technology turnover can slow technology improvement and higher operational emissions
+ approaches and technologies available
‐ lack of lower cost technology for PFC emission reduction in existing aluminium production plants
Technological + less energy and fuel ‐ lack of sufficient + reduction + reduction in ‐ lack of
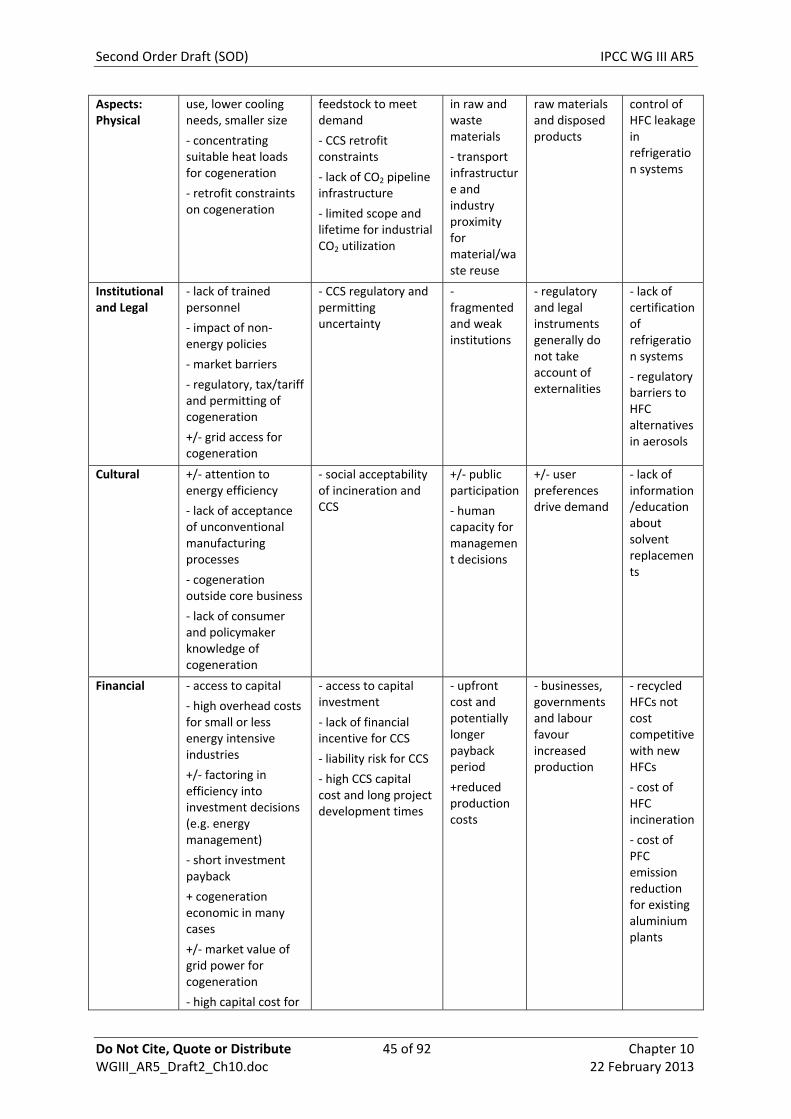
Second Order Draft (SOD) IPCC WG III AR5
use, lower cooling needs, smaller size
‐ concentrating suitable heat loads for cogeneration
‐ retrofit constraints on cogeneration
feedstock to meet demand
‐ CCS retrofit constraints
‐ lack of CO2 pipeline infrastructure
‐ limited scope and lifetime for industrial CO2 utilization
in raw and waste materials
‐ transport infrastructure and industry proximity for material/waste reuse
raw materials and disposed products
control of HFC leakage in refrigeration systems
Aspects: Physical
Institutional and Legal
‐ lack of trained personnel
‐ impact of non‐energy policies
‐ market barriers
‐ regulatory, tax/tariff and permitting of cogeneration
+/‐ grid access for cogeneration
‐ CCS regulatory and permitting uncertainty
‐ fragmented and weak institutions
‐ regulatory and legal instruments generally do not take account of externalities
‐ lack of certification of refrigeration systems
‐ regulatory barriers to HFC alternatives in aerosols
Cultural +/‐ attention to energy efficiency
‐ lack of acceptance of unconventional manufacturing processes
‐ cogeneration outside core business
‐ lack of consumer and policymaker knowledge of cogeneration
‐ social acceptability of incineration and CCS
+/‐ public participation
‐ human capacity for management decisions
+/‐ user preferences drive demand
‐ lack of information/education about solvent replacements
Financial ‐ access to capital
‐ high overhead costs for small or less energy intensive industries
+/‐ factoring in efficiency into investment decisions (e.g. energy management)
‐ short investment payback
+ cogeneration economic in many cases
+/‐ market value of grid power for cogeneration
‐ high capital cost for
‐ access to capital investment
‐ lack of financial incentive for CCS
‐ liability risk for CCS
‐ high CCS capital cost and long project development times
‐ upfront cost and potentially longer payback period
+reduced production costs
‐ businesses, governments and labour favour increased production
‐ recycled HFCs not cost competitive with new HFCs
‐ cost of HFC incineration
‐ cost of PFC emission reduction for existing aluminium plants
Do Not Cite, Quote or Distribute 45 of 92 Chapter 10 WGIII_AR5_Draft2_Ch10.doc 22 February 2013

Second Order Draft (SOD) IPCC WG III AR5
Do Not Cite, Quote or Distribute 46 of 92 Chapter 10 WGIII_AR5_Draft2_Ch10.doc 22 February 2013
cogeneration
10.10 Sectoral implications on transformation pathways and sustainable development
1
2
9
13 14 15 16 17 18 19 20 21
22 23 24 25 26 27 28 29 30 31 32
33 34
This section uses integrated assessment model results and examines how the industry sector might 3 change over this century in carbon‐constrained world in the light of changing overall human 4 activities covered in Chapter 6. Looking forward, scenarios for the industry sector over the 21st 5 century associated with different atmospheric CO2e ‐concentration in 2100 are assessed in 10.10.1 6 and corresponding implications for sustainable development and investment are assessed in 7 10.10.2. 8
10.10.1 Industry transformation pathways Scenarios for the 21st century shown in Figure 10.6, Figure 10.7 and Figure 10.8, lead to a wide 10 range of CO2e levels driven amongst others by changes in product/material demand, energy 11 efficiency, and carbon intensity of the industry sector. 12
Scenarios indicate generally strong growth of the industry sector consistent with general economic growth. Detailed scenarios of the industry sector exhibit like other studies (IEA, 2009b; Akashi et al., 2013; Sano, Akimoto, et al., 2013; Sano, Wada, et al., 2013) increasing material production ‐‐ e.g. iron/steel and cement. Scenarios generated by General Equilibrium models which include economic feedbacks (see Table 6.1) do implicitly include changes in material flow due to, for example, changes in prices that may be driven by a price on carbon; however, these models do not generally provide bottom up details of material flows. Material flows and options for reducing material demand, substitution elasticities (Roy et al., 2006; Sanstad et al., 2006) are used with various assumption which can better be characterized as gaps in Integrated assessment models.
Final energy (FE) demand from industry increases in scenarios as seen in Figure 10.6 (a) driven by the growth of the industry sector; however, FE is weakly dependent on stabilization level, and range of FE demand spanned by scenarios becomes wide in the latter half of the century. In the models energy productivity improvements help to limit FE increase. For example, results of the DNE21+ and AIM models include a 56% and 114% increase in steel produced from 2010 to 2050 and a decrease in FE per unit production of 20‐22% and 28‐34% for the reference, 550e and 450e scenarios, respectively (Akashi et al., 2013; Sano, Akimoto, et al., 2013; Sano, Wada, et al., 2013). While energy efficiency of industry improves with time the growth of, for example, CCS leads to increases FE demand. Growth of FE for cement, for example, is seen in Figure 10.6 (a) in the cement sub‐sector results due to CCS applied to cement in mitigation scenarios (i.e., going from AIM cement category 5,6 scenario to category 0‐4 scenarios).
Figure 10.7 shows the regional breakdown of FE demand by world regions in scenarios of transition pathways. In 21st century scenarios, growth of industry continues to be greatest in Asia, although at a slower growth rate than seen over the last decade (see section 10.3 ). The OECD is expected to contain a decreasing fraction of the World’s industry.
35 36
37 38 39 40 41 42
43 44 45
Emissions from industry, including indirect emissions resulting from industry electricity demand, is lower for scenarios that lead to lower stabilization level as seen in Figure 10.6(b). Following 2050, emissions become very low and in some cases even negative (e.g. resulting from assumption of negative indirect emissions from electricity generated from biomass with CCS). Carbon intensity of FE shown in Figure 10.6(c) decreases generally and decreases more strongly for low stabilization levels.
Decrease in carbon intensity is generally the dominant mechanism for decrease in emissions in these scenarios. In scenarios with strong decrease in carbon intensity is generally due to some combination of application of CCS to direct industry emissions, and a shift to a lower‐carbon carrier
Second Order Draft (SOD) IPCC WG III AR5
Do Not Cite, Quote or Distribute 47 of 92 Chapter 10 WGIII_AR5_Draft2_Ch10.doc 22 February 2013
of energy – for example, a shift to low‐ or negative‐carbon sources of electricity. Figure 10.8 shows a shift, for example, towards electricity for some low stabilization scenarios (with decarbonisation of electricity as discussed in Section 7.12), a shift towards more solid fuel which can have low emissions if CCS is applied, or a shift towards more liquids/gas/hydrogen. There is a strong decrease in indirect emissions from electricity demand in mitigation scenarios in Figure 10.6(d) ‐‐ becoming negative in some cases for low or even medium stabilization levels (e.g. from the generation of electricity from biomass with CCS). While a decarbonised power sector will offer new opportunities to reduce carbon intensity of some industrial processes, the lack of a sufficient carbon price remains amongst others a barrier for making this transition (IEA, 2009b; Bassi et al., 2009); barriers to decarbonisation of electricity is discussed in Section 7.10.
1 2 3 4 5 6 7 8 9
10
11 12 13 14 15 16 17 18 19
One mitigation scenario described in detail in IEA (2009b)– see Figure 10.9– shows initially a strong contribution to mitigation of emissions from recycling and energy recovery which is overtaken by 2050 by improvements in industry energy efficiency and application of CCS to direct emissions. In this scenario, CCS is already present in 2020 which would be challenging since CO2 capture has yet to be applied at commercial scale in major industries such as cement or steel and faces various barriers (cf. Section 10.9). AIM scenarios (Akashi et al., 2013) show, for example, a similar level of CCS penetration a decade later – in 2030 ‐‐ and imply a higher level of penetration in the iron/steel subsector and even higher for cement. Such changes would entail rapid transitions and associated high levels of technology development and investment.
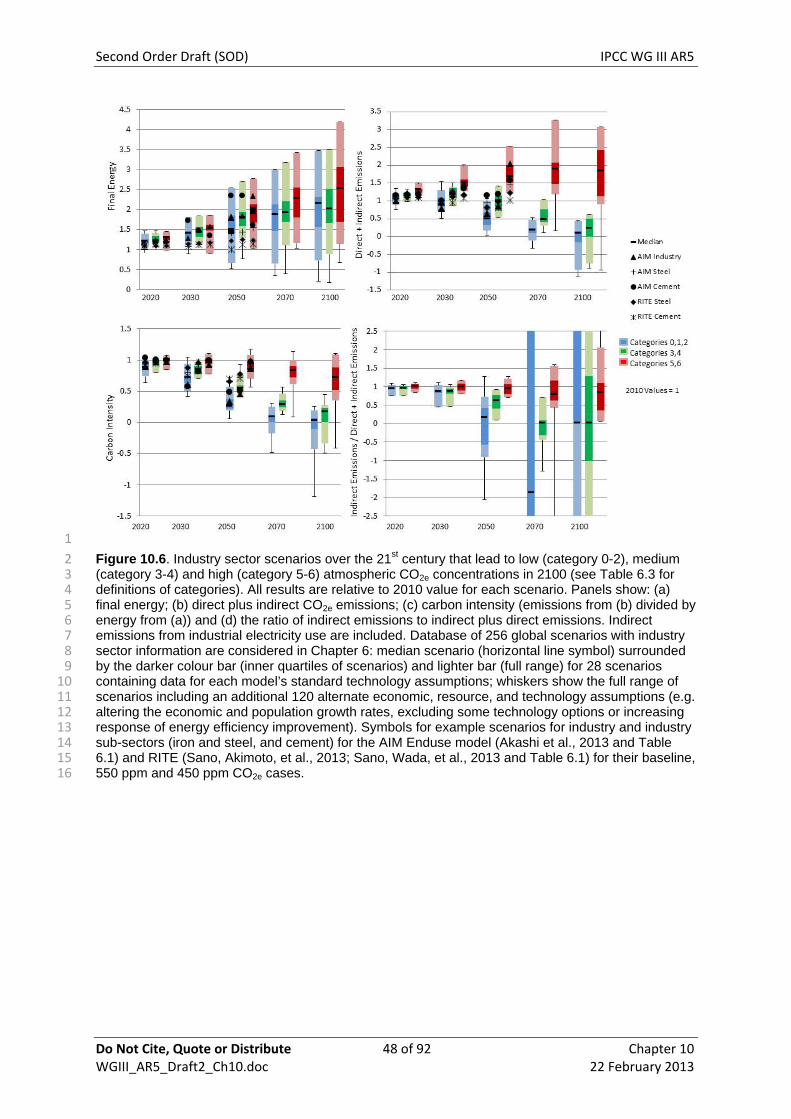
Second Order Draft (SOD) IPCC WG III AR5
Do Not Cite, Quote or Distribute 48 of 92 Chapter 10 WGIII_AR5_Draft2_Ch10.doc 22 February 2013
1
2 3 4 5 6 7 8 9
10 11 12 13 14 15 16
Figure 10.6. Industry sector scenarios over the 21st century that lead to low (category 0-2), medium (category 3-4) and high (category 5-6) atmospheric CO2e concentrations in 2100 (see Table 6.3 for definitions of categories). All results are relative to 2010 value for each scenario. Panels show: (a) final energy; (b) direct plus indirect CO2e emissions; (c) carbon intensity (emissions from (b) divided by energy from (a)) and (d) the ratio of indirect emissions to indirect plus direct emissions. Indirect emissions from industrial electricity use are included. Database of 256 global scenarios with industry sector information are considered in Chapter 6: median scenario (horizontal line symbol) surrounded by the darker colour bar (inner quartiles of scenarios) and lighter bar (full range) for 28 scenarios containing data for each model’s standard technology assumptions; whiskers show the full range of scenarios including an additional 120 alternate economic, resource, and technology assumptions (e.g. altering the economic and population growth rates, excluding some technology options or increasing response of energy efficiency improvement). Symbols for example scenarios for industry and industry sub-sectors (iron and steel, and cement) for the AIM Enduse model (Akashi et al., 2013 and Table 6.1) and RITE (Sano, Akimoto, et al., 2013; Sano, Wada, et al., 2013 and Table 6.1) for their baseline, 550 ppm and 450 ppm CO2e cases.

Second Order Draft (SOD) IPCC WG III AR5
Do Not Cite, Quote or Distribute 49 of 92 Chapter 10 WGIII_AR5_Draft2_Ch10.doc 22 February 2013
1
2 3 4 5 6
Figure 10.7. Final energy demand from the industry sector shown for the five RCP regions (see Annex II Metrics and Methodology for definition) over the 21st century. Bars use information from the the database of 256 global scenarios with industry sector information considered in Chapter 6. Bar height is the median scenario final energy relative to 2010; breakdown fractions are the mean of scenarios.
7
8 9
10 11 12
Figure 10.8. Industry final energy share broken down into three groups of energy carriers: electricity, solids, and liquids-gases-hydrogen. Trajectory for each scenario shown by line with symbols at the start of the trajectories in 2005, in 2050 and at the end in 2100. Results shown draw from the database of 256 global scenarios with industry sector information considered in Chapter 6 and shown in Figure 10.6.
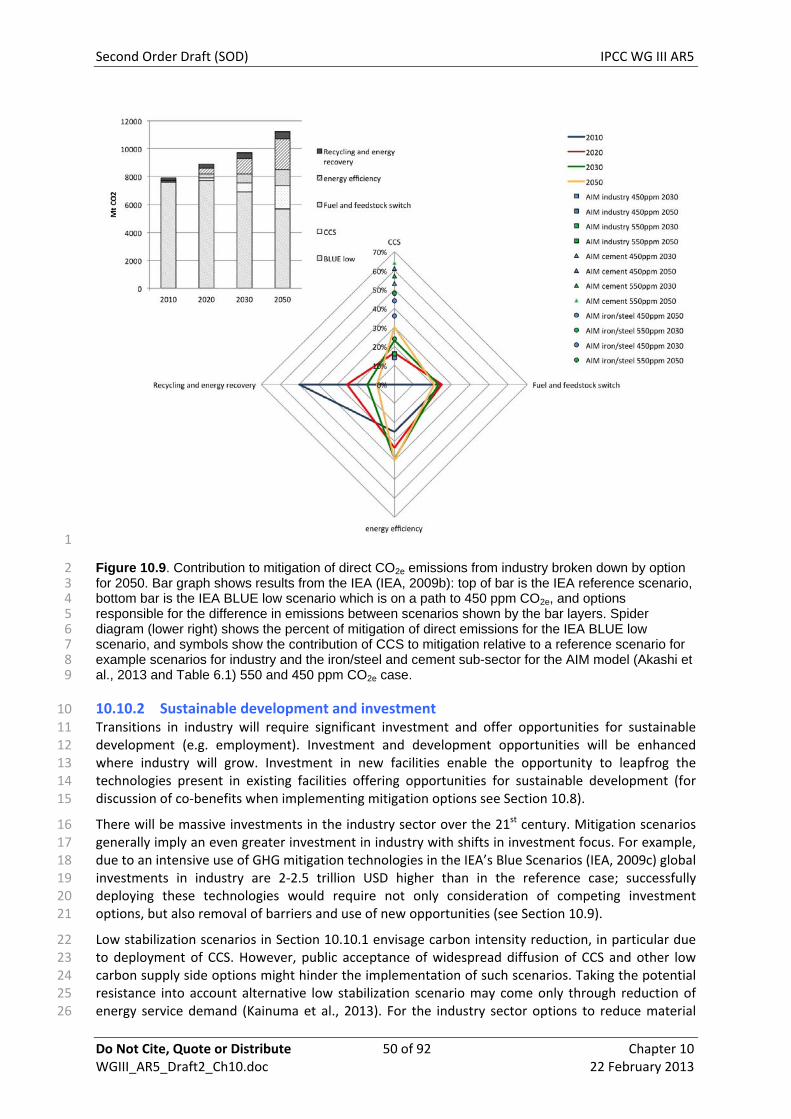
Second Order Draft (SOD) IPCC WG III AR5
Do Not Cite, Quote or Distribute 50 of 92 Chapter 10 WGIII_AR5_Draft2_Ch10.doc 22 February 2013
1
2 3 4 5 6 7 8 9
10
16 17 18 19 20 21
22 23 24 25 26
Figure 10.9. Contribution to mitigation of direct CO2e emissions from industry broken down by option for 2050. Bar graph shows results from the IEA (IEA, 2009b): top of bar is the IEA reference scenario, bottom bar is the IEA BLUE low scenario which is on a path to 450 ppm CO2e, and options responsible for the difference in emissions between scenarios shown by the bar layers. Spider diagram (lower right) shows the percent of mitigation of direct emissions for the IEA BLUE low scenario, and symbols show the contribution of CCS to mitigation relative to a reference scenario for example scenarios for industry and the iron/steel and cement sub-sector for the AIM model (Akashi et al., 2013 and Table 6.1) 550 and 450 ppm CO2e case.
10.10.2 Sustainable development and investment Transitions in industry will require significant investment and offer opportunities for sustainable 11 development (e.g. employment). Investment and development opportunities will be enhanced 12 where industry will grow. Investment in new facilities enable the opportunity to leapfrog the 13 technologies present in existing facilities offering opportunities for sustainable development (for 14 discussion of co‐benefits when implementing mitigation options see Section 10.8). 15
There will be massive investments in the industry sector over the 21st century. Mitigation scenarios generally imply an even greater investment in industry with shifts in investment focus. For example, due to an intensive use of GHG mitigation technologies in the IEA’s Blue Scenarios (IEA, 2009c) global investments in industry are 2‐2.5 trillion USD higher than in the reference case; successfully deploying these technologies would require not only consideration of competing investment options, but also removal of barriers and use of new opportunities (see Section 10.9).
Low stabilization scenarios in Section 10.10.1 envisage carbon intensity reduction, in particular due to deployment of CCS. However, public acceptance of widespread diffusion of CCS and other low carbon supply side options might hinder the implementation of such scenarios. Taking the potential resistance into account alternative low stabilization scenario may come only through reduction of energy service demand (Kainuma et al., 2013). For the industry sector options to reduce material

Second Order Draft (SOD) IPCC WG III AR5
Do Not Cite, Quote or Distribute 51 of 92 Chapter 10 WGIII_AR5_Draft2_Ch10.doc 22 February 2013
demand or reduced demand for products become important as the latter does not rely on investment challenges although they face a different set of barriers and can have high transaction costs (cf. Section 10.9).
1 2 3
4 5 6 7 8 9
10 11 12 13 14 15 16 17 18 19 20 21 22
23
28
37
Industry‐related climate change mitigation options vary widely and may positively or negatively affect employment. Identifying mitigation options that enhance positive effects (e.g. due to some energy efficiency improvements) and minimize the negative outcomes is therefore critical. Many studies have argued that climate change mitigation policies can lead to unemployment and economic downturn (e.g. Babiker and Eckaus, 2007; Chateau et al., 2011) because such policies can threaten labour demand (e.g. Martinez‐Fernandez et al., 2010) and can be regressive (Timilsina, 2009). On the other hand, many studies suggest that environmental regulation could stimulate eco‐innovation and investment in more efficient production techniques and so raise employment (OECD, 2009) and efficient technology deployment can indeed lead to higher employment depending on how redistribution of investible fund takes place within an economy (Sathaye et al., 2006). However, such climate change mitigation policies are thought to become an effective driver for job creation only when they are combined with job support mechanisms (ILO, 2011) such as sustained R&D (Engel and Kammen, 2009), technology and innovation (Accenture, 2011), public and private sector investment (Kammen et al., 2004), policy mechanisms such as green stimulus (Barbier, 2010), industry and domestic policies and regulations governing employment (ILO, 2011), education and skills training (Furchtgott‐Roth, 2012), and by appropriate trade off‐policies for example between maximization of employment creation and maximization of climate benefits (Berndes and Hansson, 2007). The distributional effects of these policies and across different countries, however, remain unclear (Büchs et al., 2011).
10.11 Sectoral policies
This section discusses the range of policies that have been tried in many countries over time to 24 overcome sector‐specific barriers and foster industry sector mitigation options consistent with 25 elements mentioned in Figure 10.1. Chapter 15 in particular and chapters 14 and 16 also analyze 26 overarching policies that are also but not only relevant to industry, such as emissions trading.. 27
10.11.1 Energy efficiency The use of energy efficiency policy in industry has increased appreciably in many IEA countries as 29 well as major developing countries since the late 1990s (Halsnæs et al.; Roy, 2007; Worrell et al., 30 2009; Tanaka, 2011). A review of 575 policy measures found that, as of 2010, information and 31 support policies are the most prevalent (40%), followed by economic instruments (35%), and 32 regulatory approaches (24%) (Tanaka, 2011). Identification of energy efficiency opportunities 33 through energy audits is the most popular measure, followed by subsidies, regulations for 34 equipment efficiency, and voluntary agreements. The various types of policies and their coverage 35 are shown in Figure 10.10 and experiences in a range of these policies are analysed below. 36
Cap‐and‐trade schemes to reduce GHG emissions and enhance energy efficiency in energy‐intensive industry as an example of economic instruments have been in place in the last decade in developed countries and are recently emerging in developing countries (Roy, 2010) The largest scheme by far that covers industrial facilities is the European Emissions Trading Scheme (ETS). The U.S. state of California recently initiated a cap‐and‐trade scheme that covers a number of industrial facilities, such as petroleum refineries (Nordrum et al., 2011) and India’s Perform, Achieve, and Trade (PAT) scheme also relies on trading (Roy, 2010). A more in‐depth analysis of this mechanism is provided in Chapter 15.
38 39 40 41 42 43 44
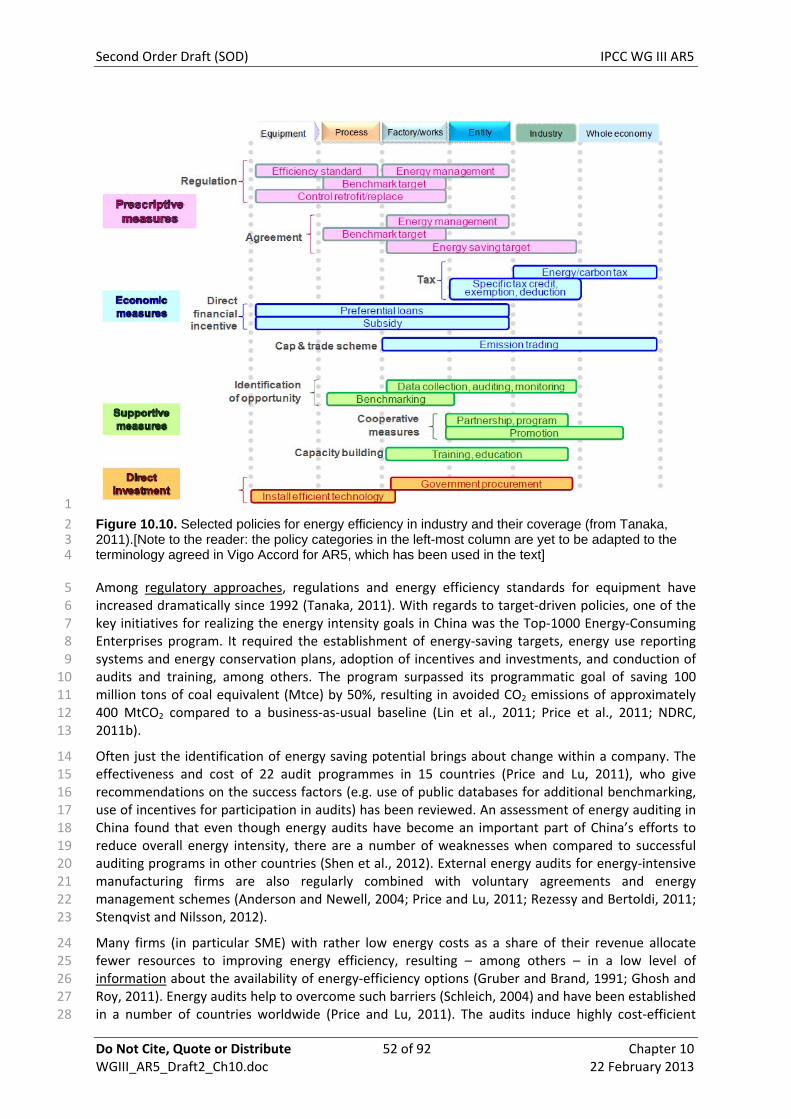
Second Order Draft (SOD) IPCC WG III AR5
Do Not Cite, Quote or Distribute 52 of 92 Chapter 10 WGIII_AR5_Draft2_Ch10.doc 22 February 2013
1
2 3 4
Figure 10.10. Selected policies for energy efficiency in industry and their coverage (from Tanaka, 2011).[Note to the reader: the policy categories in the left-most column are yet to be adapted to the terminology agreed in Vigo Accord for AR5, which has been used in the text]
Among regulatory approaches, regulations and energy efficiency standards for equipment have increased dramatically since 1992 (Tanaka, 2011). With regards to target‐driven policies, one of the key initiatives for realizing the energy intensity goals in China was the Top‐1000 Energy‐Consuming Enterprises program. It required the establishment of energy‐saving targets, energy use reporting systems and energy conservation plans, adoption of incentives and investments, and conduction of audits and training, among others. The program surpassed its programmatic goal of saving 100 million tons of coal equivalent (Mtce) by 50%, resulting in avoided CO2 emissions of approximately 400 MtCO2 compared to a business‐as‐usual baseline (Lin et al., 2011; Price et al., 2011; NDRC, 2011b).
5 6 7 8 9
10 11 12 13
14 15 16 17 18 19 20 21 22 23
24 25
Often just the identification of energy saving potential brings about change within a company. The effectiveness and cost of 22 audit programmes in 15 countries (Price and Lu, 2011), who give recommendations on the success factors (e.g. use of public databases for additional benchmarking, use of incentives for participation in audits) has been reviewed. An assessment of energy auditing in China found that even though energy audits have become an important part of China’s efforts to reduce overall energy intensity, there are a number of weaknesses when compared to successful auditing programs in other countries (Shen et al., 2012). External energy audits for energy‐intensive manufacturing firms are also regularly combined with voluntary agreements and energy management schemes (Anderson and Newell, 2004; Price and Lu, 2011; Rezessy and Bertoldi, 2011; Stenqvist and Nilsson, 2012).
Many firms (in particular SME) with rather low energy costs as a share of their revenue allocate fewer resources to improving energy efficiency, resulting – among others – in a low level of information about the availability of energy‐efficiency options (Gruber and Brand, 1991; Ghosh and Roy, 2011). Energy audits help to overcome such barriers (Schleich, 2004) and have been established in a number of countries worldwide (Price and Lu, 2011). The audits induce highly cost‐efficient
26 27 28

Second Order Draft (SOD) IPCC WG III AR5
Do Not Cite, Quote or Distribute 53 of 92 Chapter 10 WGIII_AR5_Draft2_Ch10.doc 22 February 2013
measures with an average payback period ranging from one to six years (Fleiter, Gruber, et al., 2012).
1 2
3 4 5 6 7 8 9
An essential part of policies for energy efficiency is benchmarking. Countries such as Canada and the Netherlands use benchmarking to compare energy use among different facilities within a particular sector (Price and McKane, 2009). Moreover it can serve to compare energy use in national or international best practice (Saygin, Worrell, et al., 2011b). In the Netherlands, the Benchmarking Covenants encourage companies to compare themselves to others and to commit to becoming among the most energy‐efficient in the world. However high‐quality energy efficiency data for benchmarking is often lacking (Saygin, Worrell, et al., 2011b).
The use of negotiated or voluntary agreements (VAs) increased rapidly in the early 2000s (Tanaka, 2011). Such agreements have been found in various assessments to be effective and cost‐efficient (Rezessy and Bertoldi, 2011). Agreement programs (e.g. in Ireland, France, The Netherlands, Denmark, UK, Sweden) were often responsible for increasing the adoption of energy‐efficiency and GHG mitigation technologies by industries beyond what would have been otherwise adopted without the programs (Price et al., 2010; Stenqvist and Nilsson, 2012). Some key factors contributing to successful VAs appear to be a strong institutional framework; a robust and independent monitoring and evaluation system; credible mechanisms for dealing with non‐compliance; capacity‐building and, very importantly, accompanying measures such as free or subsidized energy audits, mandatory energy management plans, technical assistance, information and financing for implementation (Rezessy and Bertoldi, 2011) as well as dialogue between industry and government (Yamaguchi, 2012).
10 11 12 13 14 15 16 17 18 19 20 21
22 23 24 25 26 27 28 29 30
31 32 33 34 35 36
37 38 39 40
41 42 43 44 45 46 47 48 49
As an example of a voluntary programme, the learning networks in Germany are an instrument designed to lower transaction costs of investment decisions for energy efficiency for industry. Companies of each network agree on a common target for energy‐efficiency improvements and meet regularly for exchange of experiences. Each company receives an initial consultation from an experienced engineer, regular follow‐ups and monitoring of energy consumption and CO2 emissions, among other things. Companies in Germany’s Bundesland Baden‐Württemberg participating in such networks could realize significant net energy cost reductions and a carbon intensity reduction of 2.5% per year, brought about mainly by increases in electrical efficiency (Jochem and Gruber, 2007). Further discussion about VAs can be found in Chapter 15.
The adoption of Energy Management Systems (EMS) in industry is found to be mandatory, as in Japan, Italy, Canada, Turkey or Portugal (Tanaka, 2011) or voluntary. They are often a component of policy mixes or a requirement within VAs, in combination incentives for audits. (Backlund et al., 2012) argue that improvement in practices identified by EMS and audits should be given a greater role in studies of potential for energy efficiency, as most studies concentrate only on the technological and economical potentials (cf. section 10.7).
In addition to dedicated GHG mitigation policies, co‐benefits of other policies should be considered. Local air quality standards have an indirect effect on GHG mitigation. Given the priorities of many governments these indirect policies have played a relatively more effective role than climate policies (e.g. in India Roy, 2010).
The impact of a specific policy depends also on the environment and policy mix. So far only a few national governments evaluated their industry‐specific policy mixes (Reinaud and Goldberg, 2011). For the UK (Barker et al., 2007) modeled the impact of the UK Climate Change Agreements (CCAs) and estimated that from 2000 to 2010 they would result in a reduction of total final demand for energy of 2.6% and a reduction in CO2 emissions of 3.3%. The CCAs established targets for industrial energy‐efficiency improvements in energy‐intensive industrial sectors; firms that met the targets qualified for a reduction of 80% on the Climate Change Levy (CCL) rates on energy use in these sectors. However, (Barker et al., 2007) show that the macro‐economic rebound effect on the UK economy from the policies have to be taken into account.

Second Order Draft (SOD) IPCC WG III AR5
Do Not Cite, Quote or Distribute 54 of 92 Chapter 10 WGIII_AR5_Draft2_Ch10.doc 22 February 2013
10.11.2 Emissions efficiency and fuel switching 1
9 10 11 12 13 14 15 16 17 18
19
24 25 26 27 28 29 30 31 32 33 34 35
36 37 38 39 40 41 42 43 44 45
The policies directed at increasing energy efficiency (discussed above) most often result in reduction 2 of CO2 intensity as well, in particular when part of a wider policy mix addressing multiple policy 3 objectives. Examples for emissions efficiency policy strategies include support schemes and fiscal 4 incentives for fuel switching, R&D programmes for CCS, inclusion of reduction of non‐CO2 gases in 5 voluntary agreements (e.g. Japanese voluntary action plan Keidanren, cf. Chapter 15, p. 18) or 6 market mechanisms (Bureau of Energy Efficiency led REC, EsCert market for Indian industries, (Roy, 7 2010). 8
With regards to gases with relatively high global warming potential (GWP) such as HFCs, PFCs, and SF6, successful policy examples exist for capture in the power industry (e.g. Japan). However there is not much evidence for the industry sector. The CDM has been a major driver for abatement of the industrial gases HFC‐23 and N2O in developing countries; these abatement options had been ignored before the CDM provided monetary incentives (Michaelowa and Buen, 2012). Including high GWP emissions within the same cap and trade programme (and therefore prices) as energy‐related emissions may draw opposition from the industries concerned, but having a special programme for these gases could result in a more costly policy (Hall, 2007). Another option would be to charge an upfront fee that would then be refunded when the gases are later captured and destroyed (Hall, 2007).
10.11.3 Material efficiency Policy instruments for material or resource use efficiency are increasingly being promoted for 20 mitigation of GHG emissions in industry (GTZ et al., 2006) but there is a lack of effective 21 communication to industry on the need and potential for an integrated approach (Lettenmeier et al., 22 2009). 23
A number of policy packages are directly and indirectly aimed at reducing material input per unit of product or unit of service demand11. Examples are: European Action Plan on Sustainable Consumption and Production (SCP) and Sustainable Industry (EC, 2008) EU’s resource efficiency strategy and roadmap (EC, 2011, 2012b) and Germany’s resource efficiency programme, ProgRess (BMU, 2012). SCP policies include both voluntary and regulatory instruments, such as the EU Eco‐design directive, as well as the Green Public Procurement policies. Aside from setting a framework and long‐term goals for future legislation and setting up networks and knowledge bases, these packages include few specific policies and, most importantly, do not set quantitative targets nor explicitly address the link between material efficiency and greenhouse gas emission reductions. Australia’s Low Carbon Policy Package does address material efficiency specifically by setting an objective of 0.5 % additional material efficiency improvement per year, although according (Höhne et al., 2012) it has no specific policies in place to do so yet.
Some single policies (as opposed to policy packages) related to material efficiency do include a mitigation component or measure their impacts in terms of GHG emissions. For example the UK’s National Industrial Symbiosis Programme (NISP) brokers resource exchanges between companies (for an explanation of industrial symbiosis, see section 10.5). An assessment of the savings through the NISP estimated that over 6 million tonnes of CO2e were saved over the first five years (International Synergies Ltd, 2009). The PIUS‐Check initiative by the German state of North Rhine‐Westphalia (NRW) offers audits to companies where the relevant material flows are analysed and recommendations for improvements are made. These PIUS‐checks have been particularly successful in metal processing industries, and it is estimated that they have saved 20 thousand tonnes of CO2 (EC, 2009).
11 SCP policies are also covered in Chapter 4 (Sustainable Development and Equity, sub‐section 4.4.3.1 SCP policies and programmes)

Second Order Draft (SOD) IPCC WG III AR5
Do Not Cite, Quote or Distribute 55 of 92 Chapter 10 WGIII_AR5_Draft2_Ch10.doc 22 February 2013
In Asia and the Pacific there are a number of region‐specific policy instruments for climate change mitigation through SCP, such as the China Refrigerator Project which realized savings of about 11 million tonnes of CO2 emissions between 1999 and 2005 by combining several practices including sustainable product design, technological innovation, eco‐labelling, and awareness raising of consumers and retailers (SWITCH‐Asia Network Facility, 2009). However, there is still a lack of solid ex‐post assessments on SCP policy impacts.
1 2 3 4 5 6
7 8 9
10 11 12 13 14 15
16
22
30 31 32 33 34 35 36 37
38 39 40 41 42
43
Besides industry‐specific policies there are policies with a different sector focus that influence industrial activity indirectly, by reducing need for products (e.g. car pooling incentive schemes can lead to the production of less cars) or industrial materials (e.g. vehicle fuel economy targets can incentivize the design of lighter vehicles). A strategic approach in order to reflect the economy‐wide resource use and the global risks may consist of national accounting systems beyond the GDP12 (Roy and Pal, 2009; Arrow et al., 2010; Jackson, T, 2011; GEA, 2012) including systems to account for increasing resource productivity (OECD, 2008; Bringezu and Bleischwitz, 2009) and of new international initiatives to spur systemic eco‐innovations in key areas such as cement and steel production, light‐weight cars, resource efficient construction, and reducing food waste.
10.11.4 Relevance of policy mix Lastly, it is important to note that there is no single policy that can address the full variety of 17 mitigation options. Current practice acknowledges the importance of policy mixes, the necessity to 18 take care of the national contexts and unintended behaviour of industrial companies. In terms of the 19 latter aspects, carbon leakage is relevant in the discussion of policies for industry (for a more in‐20 depth analysis see Chapter 5). 21
10.12 Gaps in knowledge and data
The key challenge for the industry sector is the uncertainty, low quality and incompleteness of data 23 available on public domain on energy use and costs for specific technologies on global and regional 24 scales that can serve as a basis for assessing performance and mitigation potential with high 25 confidence. Sector data are generally collected by trade associations (international or national), are 26 highly aggregated, and generally give little information about individual processes. The enormous 27 amount of different processes and technologies play a role in that context as well as the complexity 28 of interrelationships. 29
In addition to the shortage of data, a lack of clarity in its presentation leads to widely differing interpretations. In particular reported numbers may refer to final or primary energy, average or best practice, and if stated as emissions rather than energy figures, may fail to state the assumptions/baselines on which emissions were calculated. The emissions factors of different electricity sources cause particular confusion, as does the fact that the reported numbers will vary widely as the boundaries of their coverage may be quite different but unstated. Without commonly agreed government‐mandated release of data in standardised comparable formats, this lack of clarity can be expected to persist.
Due to complex system boundary issues comparative assessments for industry processes are difficult. Process configuration and the degree of integration varies widely in a given industrial sector, so the comparison of monitoring data across companies or plants (Tanaka, 2008; Siitonen et al., 2010), across nations. On the other hand, evaluation by process may not fully account for energy saving efforts over the whole mill (Tanaka, 2012).
Other gaps in knowledge identified to date during the creation of the specific sections include:
12 For example, the EU’s “Beyond GDP Initiative”: http://www.beyond‐gdp.eu/
Second Order Draft (SOD) IPCC WG III AR5
Do Not Cite, Quote or Distribute 56 of 92 Chapter 10 WGIII_AR5_Draft2_Ch10.doc 22 February 2013
a systematic approach and underlying methodologies to avoid double counting due to the many different ways of attributing emissions (10.1)
1 2
4 5
7
9 10 11
1213
1415
19
30 31 32 33
34
insights into how trade can be used as a climate change mitigation option (UNEP and WTO 3 2009) and the impacts any adjustments in embodied emissions particularly in commodities of energy intensive industries have on national and international policies (IEA 2008) (10.3)
more in‐depth assessment of mitigation technologies in particular mitigation options 6 regarding material efficiency and demand‐side options (10.4).
more comprehensive information on sector specific option based mitigation potential and 8 associated costs bases on a common methodology as complementation of existing potential assessments for individual industries with varying and often intransparent assumptions (10.7)
quantitative data on co‐benefits (10.8), including impacts of mitigation options on sustainability criteria such as employment (developed and developing countries)
a better understanding of demand reduction strategies through an improved modelling of material flows in integrated assessment models
Better understanding of the net impacts of different types of policies and the mitigation potential of 16 a link between resource efficiency/energy efficiency policies, as well as the related carbon leakage 17 effects (10.11). 18
10.13 Waste (excursus section)
10.13.1 Introduction 20 Waste generation is an integral part of human activity and related to GDP, per capita energy 21 consumption, and material consumption (Ausubel and Herman, 1988). Waste is generated at various 22 stages of production (“pre‐consumer waste”) of any product as well as at the post‐consumption 23 stage. Several mitigation options exist at the pre‐consumer stage. These include reduction during 24 production processes, recycling and reuse of materials. For post‐consumption waste mitigation 25 options comprise reduction at source (e.g. using products with extended lifetime or with less 26 packaging materials), recycling, reuse, alternative waste treatment techniques e.g. composting, and 27 energy recovery from waste e.g. incineration and capture of methane at disposal sites (see Figure 28 10.11). 29
This section provides a summary of knowledge on current emission status from wastes generated from various economic activities (focussing on solid waste and waste water) and discusses the mitigation options that have been adopted in the waste management industry to reduce emissions and recover materials and energy from solid wastes.

Second Order Draft (SOD) IPCC WG III AR5
Do Not Cite, Quote or Distribute 57 of 92 Chapter 10 WGIII_AR5_Draft2_Ch10.doc 22 February 2013
1 2
3
Figure 10.11. Illustration of waste mitigation options at pre-consumer and post-consumer stages
10.13.2 Emissions trends
10.13.2.1 Solid waste disposal 4
The "hierarchy of waste management as shown in Figure 10.12 places waste reduction at the top, 5 followed by recycling and composting, waste‐to‐energy, and three types of landfilling, ranging from 6 modern sanitary landfills, that treat liquid effluents and also attempt to capture and use the 7 generated biogas, to the traditional waste dumps that are still the dominant form of waste disposal 8 in many parts of the world. 9
10
11
12 13
Figure 10.12. The hierarchy of waste management (Kaufman and Themelis, 2009).
Municipal solid wastes (MSW) are the most visible and troublesome residues of human society. The total amount of MSW generated globally have been estimated at about 1.5 billion tonnes (Themelis,

Second Order Draft (SOD) IPCC WG III AR5
Do Not Cite, Quote or Distribute 58 of 92 Chapter 10 WGIII_AR5_Draft2_Ch10.doc 22 February 2013
2007) and it is expected to increase to approximately 2.2 billion tons yearly by 2025 (Hoornweg and Bhada‐Tata, 2012). Of the current amount, approximately 300 million tonnes are recycled or composted, 200 million are combusted with energy recovery, another 200 million tons are disposed in sanitary landfills, and the remainder of 800 million tons are discarded in non‐sanitary landfills. Thus, a major part of technically recoverable materials are diluted as they get mixed and exposed to other substances and to reactive environmental conditions. The implications in terms of emissions are to be related not only to the reduction of “post‐consumer waste GHG emissions”, but also to the embodied GHG emissions” of MSW or those corresponding to the energy required to obtain and deliver “fresh” or primary materials.
1 2 3 4 5 6 7 8 9
10 11 12 13 14 15
Figure 10.13 (below) presents CH4 emissions from solid waste disposal starting from 1970 until 2008 based on EDGAR version 4.2. Methane emissions from solid waste disposal almost doubled between 1970 and 2010. The First Order Decay (FOD) model used in estimating emissions from solid waste disposal sites in the EDGAR database suffers from several limitations as it does not account for climate and soil micro‐climate conditions (see Spokas et al., 2011; Spokas and Bogner, 2011; Bogner et al., 2011).
0
20000
40000
60000
80000
100000
120000
0
100000
200000
300000
400000
500000
600000
700000
800000
1970 1980 1990 2000 2010
N2O Emissions, G
g CO2e/year
CH4 Emissions, Gg CO2e/year
Year
CH4 SWDS
CH4 Wastewater
N2O Wastewater
16 17 18
19
25
Figure 10.13. Global Methane and Nitrous Oxide Emissions from Solid Waste and Wastewater. Sources (Gg CO2e) EDGAR v4.2 (JRC/PBL, 2012)
10.13.2.2 Wastewater
Methane and nitrous oxide emissions from wastewater steadily increased during the last decades 20 reaching 667 and 108 Mt CO2e in 2010, respectively. Methane emissions from domestic/commercial 21 and industrial categories are responsible of 86% of wastewater GHG emissions during the period 22 1970‐2010, being the domestic/commercial sector responsible for approximately 80% of the 23 methane emissions from wastewater category. 24
10.13.3 Technological options for mitigation of emissions from waste
10.13.3.1 Pre‐consumer waste 26
Waste reduction 27
Pre‐consumer (or post‐industrial) waste is the material diverted from the waste stream during a 28 manufacturing process that has never reached the end user. This does not include the reutilization 29
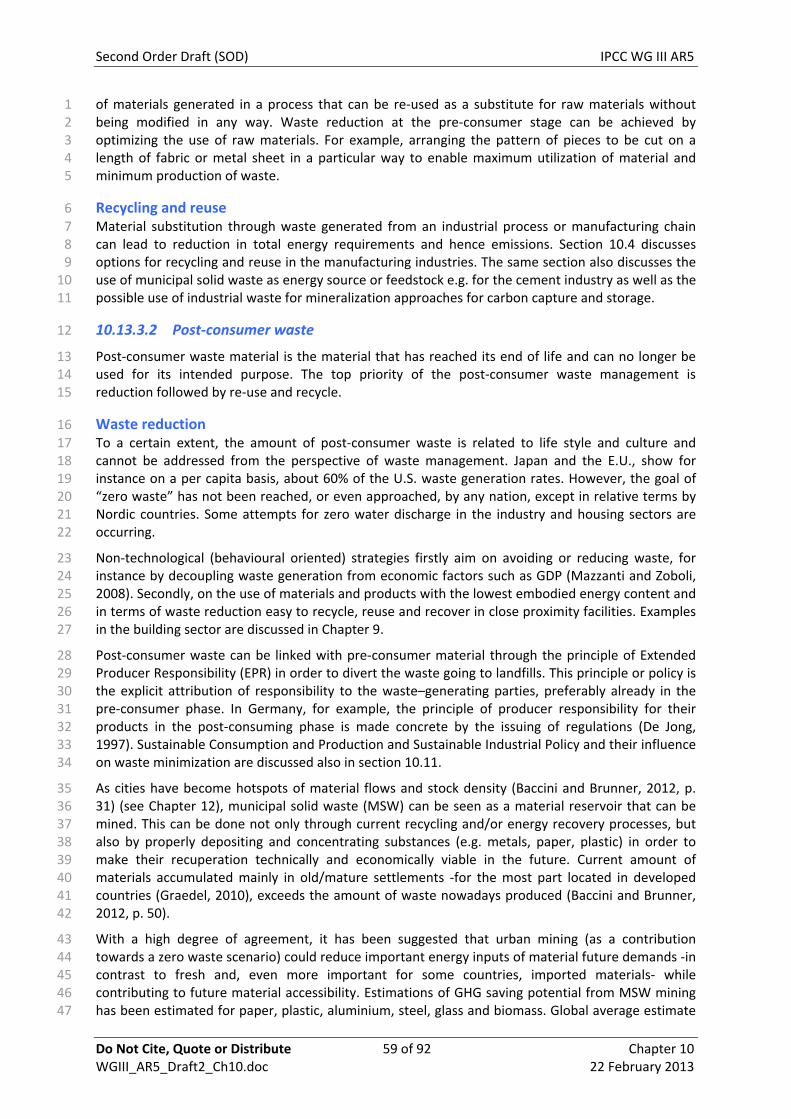
Second Order Draft (SOD) IPCC WG III AR5
Do Not Cite, Quote or Distribute 59 of 92 Chapter 10 WGIII_AR5_Draft2_Ch10.doc 22 February 2013
of materials generated in a process that can be re‐used as a substitute for raw materials without 1 being modified in any way. Waste reduction at the pre‐consumer stage can be achieved by 2 optimizing the use of raw materials. For example, arranging the pattern of pieces to be cut on a 3 length of fabric or metal sheet in a particular way to enable maximum utilization of material and 4 minimum production of waste. 5
Recycling and reuse 6
12
16
23 24 25 26 27
28 29 30 31 32 33 34
35 36 37 38 39 40 41 42
43 44 45 46 47
Material substitution through waste generated from an industrial process or manufacturing chain 7 can lead to reduction in total energy requirements and hence emissions. Section 10.4 discusses 8 options for recycling and reuse in the manufacturing industries. The same section also discusses the 9 use of municipal solid waste as energy source or feedstock e.g. for the cement industry as well as the 10 possible use of industrial waste for mineralization approaches for carbon capture and storage. 11
10.13.3.2 Post‐consumer waste
Post‐consumer waste material is the material that has reached its end of life and can no longer be 13 used for its intended purpose. The top priority of the post‐consumer waste management is 14 reduction followed by re‐use and recycle. 15
Waste reduction To a certain extent, the amount of post‐consumer waste is related to life style and culture and 17 cannot be addressed from the perspective of waste management. Japan and the E.U., show for 18 instance on a per capita basis, about 60% of the U.S. waste generation rates. However, the goal of 19 “zero waste” has not been reached, or even approached, by any nation, except in relative terms by 20 Nordic countries. Some attempts for zero water discharge in the industry and housing sectors are 21 occurring. 22
Non‐technological (behavioural oriented) strategies firstly aim on avoiding or reducing waste, for instance by decoupling waste generation from economic factors such as GDP (Mazzanti and Zoboli, 2008). Secondly, on the use of materials and products with the lowest embodied energy content and in terms of waste reduction easy to recycle, reuse and recover in close proximity facilities. Examples in the building sector are discussed in Chapter 9.
Post‐consumer waste can be linked with pre‐consumer material through the principle of Extended Producer Responsibility (EPR) in order to divert the waste going to landfills. This principle or policy is the explicit attribution of responsibility to the waste–generating parties, preferably already in the pre‐consumer phase. In Germany, for example, the principle of producer responsibility for their products in the post‐consuming phase is made concrete by the issuing of regulations (De Jong, 1997). Sustainable Consumption and Production and Sustainable Industrial Policy and their influence on waste minimization are discussed also in section 10.11.
As cities have become hotspots of material flows and stock density (Baccini and Brunner, 2012, p. 31) (see Chapter 12), municipal solid waste (MSW) can be seen as a material reservoir that can be mined. This can be done not only through current recycling and/or energy recovery processes, but also by properly depositing and concentrating substances (e.g. metals, paper, plastic) in order to make their recuperation technically and economically viable in the future. Current amount of materials accumulated mainly in old/mature settlements ‐for the most part located in developed countries (Graedel, 2010), exceeds the amount of waste nowadays produced (Baccini and Brunner, 2012, p. 50).
With a high degree of agreement, it has been suggested that urban mining (as a contribution towards a zero waste scenario) could reduce important energy inputs of material future demands ‐in contrast to fresh and, even more important for some countries, imported materials‐ while contributing to future material accessibility. Estimations of GHG saving potential from MSW mining has been estimated for paper, plastic, aluminium, steel, glass and biomass. Global average estimate

Second Order Draft (SOD) IPCC WG III AR5
Do Not Cite, Quote or Distribute 60 of 92 Chapter 10 WGIII_AR5_Draft2_Ch10.doc 22 February 2013
for 2025, based on a linear projection, is on the range of 164 to 684 kg CO2/ton for paper; 190 kg CO2/ton of plastic; 385 kg CO2/ton for aluminium; 39 kgCO2/ton for steel; 33 kg CO2/ton for glass and 45 kg CO2/ton for biomass (Delgado‐Ramos, under review).
1 2 3
4
10
14 15 16 17 18
19
20 21 22 23 24 25 26 27
28 29 30 31 32 33 34
35
Recycling/reuse If reduction of post‐consumer waste cannot be achieved, reuse and recycling is the next priority in 5 order to reduce the amount of waste produced and divert it from landfills (Valerio, 2010). Recycling 6 of post‐consumer waste can be achieved with high economic value to protect the environment and 7 conserve the natural resources (El‐Haggar, 2010). Chapter 9 discusses some examples of 8 recycling/reuse options in the building sector. 9
Landfilling and methane capture from landfills Gas collection starts after a landfill cell has been built up to its final height, which may take several 11 years. It has been estimated (Themelis and Ulloa, 2007) that about 50 million tons of methane is 12 generated in global landfills, six million of which are captured at sanitary landfills. 13
The capital investment needed to build a sanitary landfill is less than 30% of a waste‐to‐energy (WTE) plant of the same daily capacity. However, because of the higher production of electricity (average of 0.55 MWh of electricity per metric ton of MSW in the U.S. vs 0.1 MWh for a sanitary landfill), a WTE plant is usually more economic over its lifetime of 30 years or more (Themelis and Ulloa, 2007).
Landfill aeration Landfill aeration should be considered as an effective method for greenhouse gas emissions reduction in the future (Ritzkowski and Stegmann, 2010). In situ aeration is one technology that introduces ambient air into MSW landfills to enhance biological processes and to inhibit methane production (Chai et al., 2013). Ambient air is introduced in the landfill via a system of gas wells, which results in accelerated aerobic stabilization of deposited waste. The resulting gas is collected and treated (Heyer et al., 2005; Prantl et al., 2006). Biological stabilization of the waste using in‐situ aeration provides the possibility to reduce both the actual emissions and the emission potential of the waste material (Prantl et al., 2006).
Landfill aeration is a promising technology for treating the residual methane from landfills utilizing landfill gas for energy when energy recovery becomes economically unattractive (Heyer et al., 2005; Ritzkowski et al., 2006; Rich et al., 2008). In the absence of mandatory environmental regulations that require the collection and flaring of landfill gas, landfill aeration might be applied to closed landfills or landfill cells without prior gas collection and disposal or utilization. For an in situ aerated landfill in northern Germany, landfill aeration achieved a reduction in methane emissions by 83 to 95% under strictly controlled conditions (Ritzkowski and Stegmann, 2010).
Composting Municipal solid waste (MSW) contains “green” wastes e.g. leaves, grass, and other garden and park 36 residues, and also food wastes. Generally, green wastes are source‐separated and composted 37 aerobically (i.e., in presence of oxygen) in windrows. However, food wastes contain meat and other 38 substances that when composted in windrows emit unpleasant odours. Therefore, food wastes need 39 to be composted in closed chemical reactors. The methane generated in these reactors can be used 40 in a gas engine to produce electricity, or for heating purposes. Source separation, collection, and 41 anaerobic digestion of food wastes are costly and so far have been applied to small quantities of 42 food wastes in a few cities (e.g., Barcelona, Toronto, Vienna Arsova, 2010), except in cases where 43 some food wastes are co‐digested with agricultural residues. In contrast, windrow composting is 44 practiced widely; for example, over 50% of the U.S. green wastes (i.e., over 15 million tons annually) 45 are composted aerobically, while less than 5% of the food wastes (less than one million tons) are 46 processed. 47

Second Order Draft (SOD) IPCC WG III AR5
Do Not Cite, Quote or Distribute 61 of 92 Chapter 10 WGIII_AR5_Draft2_Ch10.doc 22 February 2013
Energy Recovery from Waste 1
5
With the exception of metals, glass, and other inorganic materials, MSW consists of biogenic and 2 petrochemical compounds made of carbon and hydrogen atoms. The chemical energy stored in 3 waste materials is considerable, as shown in Table 10.11 (Themelis et al., 2011). 4
Table 10.11: Heating values of materials (Themelis et al., 2011) Material Calorific value, MJ/kg
Natural gas 47
Crude oil 19
Petroleum coke 29
Mixed plastic wastes 28
U.S. coal, high 26
U.S. coal, low 23
Wood 14
MSW, high 12
MSW, low 7
Natural gas 47
The energy contained in solid wastes can be recovered by means of several thermal treatment technologies. These include combustion of as‐received solid wastes on a moving grate, shredding of MSW and combustion on a grate or fluidized bed, mechanical‐biological treatment (MBT) of MSW into compost, refuse‐derived fuel (RDF) or biogas from anaerobic digestion, partial combustion and gasification to a synthetic gas that is then combusted in a second chamber, and pyrolysis of source‐separated plastic wastes to a synthetic oil. At this time, an estimated 90% of the world's WTE capacity (i.e., about 180 million tons per year) is based on combustion of as‐received MSW on a moving grate; the same is true of the nearly 120 new WTE plants that were built worldwide since the beginning of the 21st century (Themelis, 2007).
6 7 8 9
10 11 12 13 14
15 16 17 18 19
20 21 22 23 24 25 26
WTE plants require sophisticated Air Pollution Control (APC) systems that constitute a large part of the plant In the last twenty years, because of the elaborate and costly APC systems, modern WTE plants have become one of the cleanest high temperature industrial processes (Nzihou et al., 2012). Source separation of high moisture organic wastes from the MSW increases the thermal efficiency of WTE.
Most of the mitigation options mentioned above require expenditures and, therefore, are more prevalent in developed countries with higher GDP. A notable exception to this general rule is China, where government policy has encouraged the construction of over 100 WTE plants during the first decade of the 21st century (Dong, 2011). Figure 10.14 shows the percent disposition of the MSW generated in the countries of the European Union (Nzihou et al., 2012). Japan with about 75% WTE and 25% recycling belongs to the top of this graph while China, with 18% WTE and less than 3% recycling, is at the level of Slovakia.
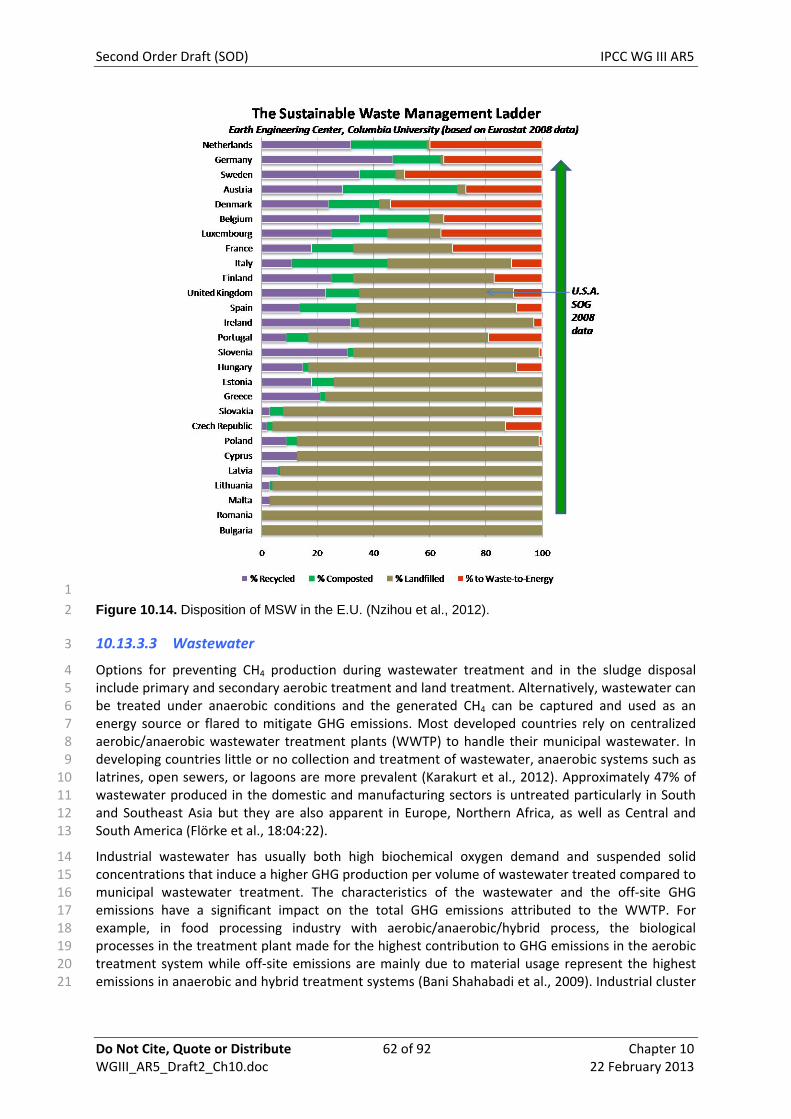
Second Order Draft (SOD) IPCC WG III AR5
Do Not Cite, Quote or Distribute 62 of 92 Chapter 10 WGIII_AR5_Draft2_Ch10.doc 22 February 2013
1
2
3
14 15 16 17 18 19 20 21
Figure 10.14. Disposition of MSW in the E.U. (Nzihou et al., 2012).
10.13.3.3 Wastewater
Options for preventing CH4 production during wastewater treatment and in the sludge disposal 4 include primary and secondary aerobic treatment and land treatment. Alternatively, wastewater can 5 be treated under anaerobic conditions and the generated CH4 can be captured and used as an 6 energy source or flared to mitigate GHG emissions. Most developed countries rely on centralized 7 aerobic/anaerobic wastewater treatment plants (WWTP) to handle their municipal wastewater. In 8 developing countries little or no collection and treatment of wastewater, anaerobic systems such as 9 latrines, open sewers, or lagoons are more prevalent (Karakurt et al., 2012). Approximately 47% of 10 wastewater produced in the domestic and manufacturing sectors is untreated particularly in South 11 and Southeast Asia but they are also apparent in Europe, Northern Africa, as well as Central and 12 South America (Flörke et al., 18:04:22). 13
Industrial wastewater has usually both high biochemical oxygen demand and suspended solid concentrations that induce a higher GHG production per volume of wastewater treated compared to municipal wastewater treatment. The characteristics of the wastewater and the off‐site GHG emissions have a significant impact on the total GHG emissions attributed to the WWTP. For example, in food processing industry with aerobic/anaerobic/hybrid process, the biological processes in the treatment plant made for the highest contribution to GHG emissions in the aerobic treatment system while off‐site emissions are mainly due to material usage represent the highest emissions in anaerobic and hybrid treatment systems (Bani Shahabadi et al., 2009). Industrial cluster

Second Order Draft (SOD) IPCC WG III AR5
Do Not Cite, Quote or Distribute 63 of 92 Chapter 10 WGIII_AR5_Draft2_Ch10.doc 22 February 2013
development in developing countries like China and India are enhancing wastewater treatment and recycling (see also Section 10.5).
1 2
3 4 5 6 7 8 9
10 11 12 13 14 15 16
17 18 19 20 21 22 23 24
25 26 27 28 29
30 31 32 33
Conventional systems may be technologically inadequate to handle the locally produced sewage as occurs in arid areas like the Middle East. In these areas, domestic wastewater are up to five times more concentrated in the amount of oxygen demand per volume of sewage in comparison with United States and Europe, causing large amounts of sludge production. In these cases, choosing an appropriate treatment technology for the community including lagoons/wetlands, upflow anaerobic sludge blanket, hybrid reactors, soil aquifer treatment, in an approach based on pathogens treatment and the reuse of the treated effluent for agricultural reuse could be a sustainable solution for wastewater management and emissions control (Bdour et al., 2009). Constructed wetlands can be a sustainable solution for municipal wastewater treatment due to its low cost, simple operation and maintenance, minimal secondary pollution, favorable environmental appearance and other ecosystem service benefits (Chen et al., 2008, 2011). It has been demonstrated that constructed wetlands are a less carbon intensive technology than the conventional wastewater treatment system although there are differences depending on the available technology and the structure of the economy where it is implemented (Gao et al., 2012).
It has been highlighted that wastewater treatment with anaerobic sludge digestion and methane recovery and use for energy purposes reduce the contribution of methane to the GHG emissions (Bani Shahabadi et al., 2009; Foley et al., 2010; Massé et al., 2011; Fine and Hadas, 2012; Abbasi et al., 2012; Liu, Gao, et al., 2012; Wang et al., 2012). Issues related to lower hydraulic retention times, lower electricity consumption and warmer climate favor the implementation of anaerobic digestion for the treatment of liquid effluents with high organic content (Karakurt et al., 2012), although adequate regulatory policies incentives are needed to widespread the implementation in developed and developing countries (Massé et al., 2011).
Advanced treatment technologies such as membrane filtration, ozonation, improvement of aeration efficiency and bacteria mix which perform the digestion processes to produce biogas, engineered nanomaterials for the treatment of domestic and industrial wastewater (Xu, Slaa, et al., 2011; Brame et al., 2011) are technologies that may enhance GHG emissions mitigation in the wastewater treatment.
The existence of a shared location and infrastructure can also facilitate the identification and implementation of more synergy opportunities to reduce industrial water provision and wastewater treatment, therefore abating greenhouse gas emissions of industry. The concept of eco‐industrial parks is discussed in section 10.5.
Second Order Draft (SOD) IPCC WG III AR5
Do Not Cite, Quote or Distribute 64 of 92 Chapter 10 WGIII_AR5_Draft2_Ch10.doc 22 February 2013
References 1
2 3 4
5 6
7 8
9 10
11 12 13 14
15 16
17 18 19
20 21
22 23
24 25
26 27 28 29
30 31
32 33 34 35
36 37 38
Abbasi T., S.M. Tauseef, and S.A. Abbasi (2012). Anaerobic digestion for global warming control and energy generation—An overview. Renewable and Sustainable Energy Reviews 16, 3228–3242. (DOI: 10.1016/j.rser.2012.02.046).
Accenture (2011). Carbon Capital: Financing the Low Carbon Economy. 1–90 pp. Available at: http://www.accenture.com/SiteCollectionDocuments/PDF/Accenture_Barclays_Carbon_Capital.pdf.
AF & PA Paper and paperboard recovery, recycling statistics. Available at: http://paperrecycles.org/stat_pages/recovery_rate.html.
Agrawal V.V., M. Ferguson, L.B. Toktay, and V.M. Thomas (2012). Is Leasing Greener Than Selling? Management Science 58, 523–533. (DOI: 10.1287/mnsc.1110.1428).
Ahmad N., and A. Wyckoff (2003). Carbon Dioxide Emissions Embodied in International Trade of Goods. (DOI: http://dx.doi.org/10.1787/421482436815). Available at: http://www.oecd‐ilibrary.org/science‐and‐technology/carbon‐dioxide‐emissions‐embodied‐in‐international‐trade‐of‐goods_421482436815.
Akashi O., T. Hanaoka, T. Masui, and M. Kainuma (2013). Halving global GHG emissions by 2050 without depending on nuclear and CCS. Climatic Change.
Akashi O., T. Hanaoka, Y. Matsuoka, and M. Kainuma (2011). A projection for global CO2 emissions from the industrial sector through 2030 based on activity level and technology changes. Energy 36, 1855–1867. (DOI: 10.1016/j.energy.2010.08.016).
Allwood J.M., M.F. Ashby, T.G. Gutowski, and E. Worrell (2011). Material efficiency: A white paper. Resources, Conservation and Recycling 55, 362–381. (DOI: 10.1016/j.resconrec.2010.11.002).
Allwood J.M., J.M. Cullen, M.A. Carruth, D.R. Cooper, M. McBrien, R.L. Milford, M. Moynihan, and A.C.H. Patel (2012). Sustainable Materials: with both eyes open. UIT, Cambridge, England.
Allwood J.M., J.M. Cullen, and R.L. Milford (2010). Options for Achieving a 50% Cut in Industrial Carbon Emissions by 2050. Environ. Sci. Technol. 44, 1888–1894. (DOI: doi: 10.1021/es902909k).
Allwood J.M., S.E. Laursen, S.N. Russell, C.M. de Rodríguez, and N.M.P. Bocken (2008). An approach to scenario analysis of the sustainability of an industrial sector applied to clothing and textiles in the UK. Journal of Cleaner Production 16, 1234–1246. (DOI: 10.1016/j.jclepro.2007.06.014).
Anderson S., and R.G. Newell (2004). Information programs for technology adoption: the case of energy‐efficiency audits. Resource and Energy Economics 26, 27–50.
APP (2010). Energy Efficiency and Resource Saving Technologies in the Cement Industry. Asia Pacific Partnership on Clean Development and Climate. Available at: http://www.asiapacificpartnership.org/pdf/Projects/Cement/APP_Booklet_of_Cement_Technology.pdf.
Arrow K.J., P. Dasgupta, L.H. Goulder, K.J. Mumford, and K. Oleson (2010). Sustainability and the Measurement of Wealth. National Bureau of Economic Research. Available at: http://www.nber.org/papers/w16599.

Second Order Draft (SOD) IPCC WG III AR5
Do Not Cite, Quote or Distribute 65 of 92 Chapter 10 WGIII_AR5_Draft2_Ch10.doc 22 February 2013
Arsova L. (2010). Anaerobic digestion of food waste: Current status, problems and an alternative product. Columbia University.
1 2
3 4 5
6 7
8 9
10
11 12
13 14
15 16
17 18 19
20 21
22 23 24
25 26
27 28 29
30 31 32 33 34
35 36 37
Arvedi G., F. Mazzolari, A. Bianchi, G. Holleis, J. Siegl, and A. Angerbauer (2008). The Arvedi Endless Strip Production line (ESP): from liquid steel to hot‐rolled coil in seven minutes. Revue de Métallurgie 105, 398–407. (DOI: 10.1051/metal:2008057).
Ashby M.F. (2009). Materials and the environment: eco‐informed material choice. Butterworth‐Heinemann, Burlington, MA, USA.
Ausubel J.H., and R. Herman (1988). Cities and Their Vital Systems:Infrastructure Past, Present, and Future (Advisory Committee on Technology and Society, Ed.). The National Academies Press, Washington, D.C., 368 pp., (ISBN: 0309037867).
Babiker M.H., and R.S. Eckaus (2007). Unemployment effects of climate policy. Environmental Science & Policy 10, 600–609. (DOI: 10.1016/j.envsci.2007.05.002).
Baccini P., and P.H. Brunner (2012). Metabolism of the Anthroposphere: Analysis, Evaluation, Design. MIT Press, 405 pp., (ISBN: 9780262016650).
Backlund S., P. Thollander, J. Palm, and M. Ottosson (2012). Extending the energy efficiency gap. Energy Policy 51, 392–396. (DOI: 10.1016/j.enpol.2012.08.042).
Bani Shahabadi M., L. Yerushalmi, and F. Haghighat (2009). Impact of process design on greenhouse gas (GHG) generation by wastewater treatment plants. Water Research 43, 2679–2687. (DOI: 10.1016/j.watres.2009.02.040).
Barbier E. (2010). How is the Global Green New Deal going? Nature 464, 832–833. (DOI: 10.1038/464832a).
Barker T., P. Ekins, and T. Foxon (2007). Macroeconomic effects of efficiency policies for energy‐intensive industries: The case of the UK Climate Change Agreements, 2000–2010. Energy Economics 29, 760–778. (DOI: 10.1016/j.eneco.2006.12.008).
Barker D.J., S.A. Turner, P.A. Napier‐Moore, M. Clark, and J.E. Davison (2009). CO2 Capture in the Cement Industry. Energy Procedia 1, 87–94. (DOI: 16/j.egypro.2009.01.014).
Bassi A.M., J.S. Yudken, and M. Ruth (2009). Climate policy impacts on the competitiveness of energy‐intensive manufacturing sectors. Energy Policy 37, 3052–3060. (DOI: 10.1016/j.enpol.2009.03.055).
BCS Inc. (2007). U.S. Energy Requirements for Aluminum Production: Historical Perspective, Theoretical Limits and Current Practices. Technical Report Prepared for the United States Department of Energy, Industrial Technologies Program. Available at: http://www1.eere.energy.gov/manufacturing/industries_technologies/aluminum/pdfs/al_theoretical.pdf.
Bdour A.N., M.R. Hamdi, and Z. Tarawneh (2009). Perspectives on sustainable wastewater treatment technologies and reuse options in the urban areas of the Mediterranean region. Desalination 237, 162–174. (DOI: 10.1016/j.desal.2007.12.030).

Second Order Draft (SOD) IPCC WG III AR5
Do Not Cite, Quote or Distribute 66 of 92 Chapter 10 WGIII_AR5_Draft2_Ch10.doc 22 February 2013
Bebbington A.J., and J.T. Bury (2009). Institutional challenges for mining and sustainability in Peru. Proceedings of the National Academy of Sciences 106, 17296 –17301. (DOI: 10.1073/pnas.0906057106).
1 2 3
4 5
6 7 8 9
10 11 12
13 14 15
16 17 18
19 20 21 22 23
24 25
26 27 28
29 30 31 32
33 34 35 36
37 38 39
Becken S., and J.E. Hay (2012). Climate Change and Tourism: From policy to practice. Routledge, 344 pp., (ISBN: 9781136471742).
Beddington J., M. Asaduzzaman, A. Fernandez, M. Clark, M. Guillou, M. Jahn, L. Erda, T. Mamo, N. van Bo, C.A. Nobre, R. Scholes, Sharma R, and J. Wakhungu (2011). Achieving food security in the face of climate change: Summary for policymakers from the Commission on Sustainable Agriculture and Climate Change. Copenhagen. Available at: www.ccafs.cgiar.org/commission.
BEE (2012). Database of energy efficiency measures adopted by the winners of the National Awards on Energy Conservations. Bureau of Energy Efficiency, Ministry of Power, Government of India. Available at: http://www.beeindia.in/.
Van Berkel R., T. Fujita, S. Hashimoto, and Y. Geng (2009). Industrial and urban symbiosis in Japan: Analysis of the Eco‐Town program 1997–2006. Journal of Environmental Management 90, 1544–1556. (DOI: 10.1016/j.jenvman.2008.11.010).
Berndes G., and J. Hansson (2007). Bioenergy expansion in the EU: Cost‐effective climate change mitigation, employment creation and reduced dependency on imported fuels. Energy Policy 35, 5965–5979. (DOI: 10.1016/j.enpol.2007.08.003).
Bernstein L., J. Roy, K.C. Delhotal, J. Harnisch, R. Matsuhashi, L. Price, K. Tanaka, E. Worrell, F. Yamba, and Z. Fengqi (2007). Industry. In: Climate Change 2007: Mitigation. Contribution of Working Group III to the Fourth Assessment Report of the Intergovernmental Panel on Climate Change [B. Metz, O.R. Davidson, P.R. Bosch, R. Dave, L.A. Meyer (eds)]. Cambridge University Press, Cambridge, United Kingdom and New York, NY, USA, .
BGS (2011). World Mineral Statistics. British Geological Survey. Available at: http://www.bgs.ac.uk/mineralsuk/statistics/worldStatistics.html.
BIS Production Partner (2012). Strong reduction in emissions with the help of BIS Production Partner. Bilfinger Berger Industrial Services. Available at: http://en.productionpartner.com/About‐us/News/Strong‐reduction‐in‐emissions‐with‐the‐help‐of‐BIS‐Production‐Partner.
Bleischwitz R., B. Bahn‐Walkowiak, F. Ekardt, H. Feldt, and L. Fuhr (2012). International resource politics. New challenges demanding new governance approaches for a green economy. 95 pp pp. Available at: http://www.boell.de/ecology/resources/resource‐governance‐ecology‐publication‐international‐resource‐politics‐14873.html.
BMU B. für U., Naturschutz und Reaktorsicherheit (2012). Deutsches Ressourceneffizienzprogramm (ProgRess). Available at: http://www.bmu.de/wirtschaft_und_umwelt/ressourceneffizienz/ressourceneffizienzprogramm/doc/47841.php.
Boden T.A., G. Marland, and R.J. Andres (2010). Global, Regional, and National Fossil‐Fuel CO2 Emissions. Carbon Dioxide Information Analysis Center, Oak Ridge National Laboratory, U.S. Department of Energy, Oak Ridge, Tenn., U.S.A. (DOI: doi 10.3334/CDIAC/00001_V2010).
Second Order Draft (SOD) IPCC WG III AR5
Do Not Cite, Quote or Distribute 67 of 92 Chapter 10 WGIII_AR5_Draft2_Ch10.doc 22 February 2013
Bogner J.E., K.A. Spokas, and J.P. Chanton (2011). Seasonal greenhouse gas emissions (methane, carbon dioxide, nitrous oxide) from engineered landfills: daily, intermediate, and final California cover soils. Journal of environmental quality 40, 1010–1020. (DOI: 10.2134/jeq2010.0407).
1 2 3
4 5
6 7
8 9
10
11 12
13 14
15 16 17
18 19 20
21 22
23 24
25 26
27 28
29 30
31 32 33
34 35 36
37 38
Bosoaga A., O. Masek, and J.E. Oakey (2009). CO2 Capture Technologies for Cement Industry. Energy Procedia 1, 133–140. (DOI: 16/j.egypro.2009.01.020).
Bows A., K. Anderson, and P. Peeters (2009). Air Transport, Climate Change and Tourism. Tourism and Hospitality Planning & Development 6, 7–20. (DOI: 10.1080/14790530902847012).
Brame J., Q. Li, and P.J.J. Alvarez (2011). Nanotechnology‐enabled water treatment and reuse: emerging opportunities and challenges for developing countries. Trends in Food Science & Technology 22, 618–624. (DOI: 10.1016/j.tifs.2011.01.004).
Bringezu S., and R. Bleischwitz (2009). Sustainable Resource Management: Global Trends, Visions and Policies. Greenleaf Publishing, 345 pp., (ISBN: 9781906093266).
Brown M.A., M. Cox, and P. Baer (2013). Reviving manufacturing with a federal cogeneration policy. Energy Policy 52, 264–276. (DOI: 10.1016/j.enpol.2012.08.070).
Brown T., A. Gambhir, N. Florin, and P. Fennell (2012). Reducing CO2 emissions from heavy industry: a review of technologies and considerations for policy makers. Imperial College London, London, UK. 32 pp. Available at: http://www3.imperial.ac.uk/climatechange/publications.
De Bruijn K., R. Dirven, E. Eijgelaar, and P. Peeters (2010). Travelling large in 2008: the carbon footprint of Dutch holidaymakers in 2008 and the development since 2002. NHTV‐NRIT Research‐NBTC‐NIPO Research. Available at: http://books.google.com/books?id=MVSvYgEACAAJ.
Büchs M., N. Bardsley, and S. Duwe (2011). Who bears the brunt? Distributional effects of climate change mitigation policies. Critical Social Policy 31, 285–307. (DOI: 10.1177/0261018310396036).
Burtraw D., A.G. Fraas, and N. Richardson (2011). Greenhouse Gas Regulation under the Clean Air Act: A Guide for Economists. Review of Environmental Economics and Policy 5, 293–313.
Bye A. (2005). The development and application of a 3D geotechnical model for mining optimisation, sandsloot open pit platinum mine, South Africa.2005, Preprints, 651–660 pp.
Bye A. (2007). The application of multi‐parametric block models to the mining process. Journal of The South African Institute of Mining and Metallurgy 107, 51–58.
Bye A. (2011). Case Studies Demonstrating Value from Geometallurgy Initiatives.2011, .Available at: http://www.ausimm.com.au/publications/epublication.aspx?ID=12887.
Carruth M.A., J.M. Allwood, and M.C. Moynihan (2011). The technical potential for reducing metal requirements through lightweight product design. Resources, Conservation and Recycling 57, 48 – 60. (DOI: 10.1016/j.resconrec.2011.09.018).
CCAP (2005). Reducing CO2 Emissions from California’s Cement Sector. Center for Clean Air Policy. Available at: http://ccap.org/assets/Reducing‐CO2‐Emissions‐from‐Californias‐Cement‐Sector_CCAP‐October‐2005.pdf.
CEPI (2006). Global Champion in Paper Recycling: Paper Industries Meet Ambitious Target. Confederation of European Paper Industries, Brussels, Belgium.

Second Order Draft (SOD) IPCC WG III AR5
Do Not Cite, Quote or Distribute 68 of 92 Chapter 10 WGIII_AR5_Draft2_Ch10.doc 22 February 2013
CEPI (2011). Key Statistics 2010–European Pulp and Paper Industry. Confederation of European Paper Industries, Brussels, Belgium.
1 2
3 4 5
6 7 8 9
10 11 12 13
14 15
16 17 18 19 20
21 22 23
24 25
26 27 28
29 30 31
32 33
34 35 36
37 38
Ceron J.‐P., and G. Dubois (2005). More mobility means more impact on climate change: prospects for household leisure mobility in France. Belgeo 1‐2, 103–120. Available at: http://www.tec‐conseil.com/spip.php?article31&lang=en.
Chai X., Y. Hao, T. Shimaoka, H. Nakayama, T. Komiya, and Y. Zhao (2013). The effect of aeration position on the spatial distribution and reduction of pollutants in the landfill stabilization process ‐ a pilot scale study. Waste management & research: the journal of the International Solid Wastes and Public Cleansing Association, ISWA 31, 41–49. (DOI: 10.1177/0734242X12462285).
Chakraborty D., and J. Roy (2012a). Climate Change Adaptation and Mitigation Strategies: Responses from Select Indian Energy Intensive Industrial Units. In Proceedings: Proceedings of International Conference on Public Policy and Governance. Department of Management Studies, Indian Institute of Science, Bangalore and Public Affairs Centre, Bangalore. 2012, .
Chakraborty D., and J. Roy (2012b). Accounting for Corporate Water Use: Estimating Water Footprint of an Indian Paper Production Unit. Journal of Indian Accounting Review 16, 34–42.
Chateau J., A. Saint‐Martin, and T. Manfredi (2011). Employment Impacts of Climate Change Mitigation Policies in OECD: A General‐Equilibrium Perspective. OECD Environment Working Papers 32. (DOI: http://dx.doi.org/10.1787/5kg0ps847h8q‐en). Available at: http://www.oecd‐ilibrary.org/environment/employment‐impacts‐of‐climate‐change‐mitigation‐policies‐in‐oecd_5kg0ps847h8q‐en.
Chen Z.M., B. Chen, J.B. Zhou, Z. Li, Y. Zhou, X.R. Xi, C. Lin, and G.Q. Chen (2008). A vertical subsurface‐flow constructed wetland in Beijing. Communications in Nonlinear Science and Numerical Simulation 13, 1986–1997. (DOI: 10.1016/j.cnsns.2007.02.009).
Chen Chiu L. (2009). Industrial Policy and Structural Change in Taiwan’s Textile and Garment Industry. Journal of Contemporary Asia 39, 512–529. (DOI: 10.1080/00472330903076743).
Chen X., T. Fujita, S. Ohnishi, M. Fujii, and Y. Geng (2012). The Impact of Scale, Recycling Boundary, and Type of Waste on Symbiosis and Recycling. Journal of Industrial Ecology 16, 129–141. (DOI: 10.1111/j.1530‐9290.2011.00422.x).
Chen G.Q., L. Shao, Z.M. Chen, Z. Li, B. Zhang, H. Chen, and Z. Wu (2011). Low‐carbon assessment for ecological wastewater treatment by a constructed wetland in Beijing. Ecological Engineering 37, 622–628. (DOI: 10.1016/j.ecoleng.2010.12.027).
China Cement (2011). National Bureau of Statistics: China’s Cement Production Reached 1.868 Billion Tonnes in 2010. Available at: http://www.ccement.com/news/Content/40492.html.
CIPEC (2007). Benchmarking and best practices in Canadian wet‐processing. Canadian Industry Program for Energy Conservation. Available at: http://oee.nrcan.gc.ca/industrial/technical‐info/benchmarking/textiles‐wet‐processing/10728.
Clift R. (2006). Sustainable development and its implications for chemical engineering. Chemical Engineering Science 61, 4179–4187. (DOI: 10.1016/j.ces.2005.10.017).

Second Order Draft (SOD) IPCC WG III AR5
Do Not Cite, Quote or Distribute 69 of 92 Chapter 10 WGIII_AR5_Draft2_Ch10.doc 22 February 2013
Clift R., and L. Wright (2000). Relationships Between Environmental Impacts and Added Value Along the Supply Chain. Technological Forecasting and Social Change 65, 281–295. (DOI: 10.1016/S0040‐1625(99)00055‐4).
1 2 3
4 5 6 7
8 9
10 11 12
13 14
15 16 17 18
19 20
21 22
23 24
25 26 27
28 29
30 31 32
33 34
35 36 37
38 39
CONCAWE (2011). The potential for application of CO2 capture and storage in EU oil refineries. Available at: http://www.concawe.be/DocShareNoFrame/Common/GetFile.asp?PortalSource=1856&DocID=30781&mfd=off&pdoc=1.
Cooper D.R., and J.M. Allwood Reusing steel and aluminium components at end of product life. Submitted to Environmental Science & Technology, 2012.
Cooper D.R., A.C.H. Patel, M. Moynihan, J.M. Allwood, and T. Cooper (2012). Increasing the life of steel and aluminium (products) to save carbon. To be submitted to the Journal of Resources, Conservation and Recycling.
Côté R., and J. Hall (1995). Industrial parks as ecosystems. Journal of Cleaner Production 3, 41–46. (DOI: 10.1016/0959‐6526(95)00041‐C).
CRC ORE (2011). Annual Report: Transforming Resource Extraction, 2010‐11. CRC ORE, St Lucia, Queensland, Australia. Available at: http://www.crcore.org.au/images/docs/General/CRC%20ORE%20Annual%20Report%202010‐11.pdf.
Crichton D. (2006). Climate Change and Its Effects on Small Businesses in the UK. AXA Insurance UK plc., (ISBN: 978‐0‐9554108‐0‐2).
Croezen H., and M. Korteland (2010). Technological developments in Europe: A long‐term view of CO2 efficient manufacturing in the European region. CE Delft, Delft. 87 pp. Available at: www.ce.nl.
Cullen J.M., J.M. Allwood, and E.H. Borgstein (2011). Reducing Energy Demand: What Are the Practical Limits? Environ. Sci. Technol. 45, 1711–1718. (DOI: 10.1021/es102641n).
Daniel M., G. Lane, and E. McLean (2010). Efficiency, Economics, Energy and Emissions – Emerging Criteria for Comminution Circuit Decision Making. Brisbane, QLD, Australia. 6‐September‐2010, .Available at: http://www.ceecthefuture.org.
Das K. (2011). Technology Transfer under the Clean Development Mechanism: an empirical study of 1000 CDM projects. School of International Development, University of East Anglia, UK.
Dasgupta S., J. Roy, A. Bera, A. Sharma, and P. Pandey (2012). Growth accounting for six energy intensive industries in India. The Journal of Industrial Statistics, Central Statistics Office, Ministry of Statistics and Programme Implementation, Government of India 1, 1–15.
Delgado‐Ramos G.C. (under review). Metabolismo de los residuos sólidos urbanos: el caso de la Ciudad de México. Revista Internacional de Contaminación Ambiental, UNAM, Mexico.
Van Deventer J.S.J., J.L. Provis, and P. Duxson (2012). Technical and commercial progress in the adoption of geopolymer cement. Minerals Engineering 29, 89–104. (DOI: 10.1016/j.mineng.2011.09.009).
Dong Y. (2011). Development of Waste‐To‐Energy in China; and Case Study of the Guangzhou Likeng WTE plant. Columbia University and the Global WTERT Council.

Second Order Draft (SOD) IPCC WG III AR5
Do Not Cite, Quote or Distribute 70 of 92 Chapter 10 WGIII_AR5_Draft2_Ch10.doc 22 February 2013
DRET (2011). Analyses of Diesel Use for Mine Haul and Transport Operations. Department of Resources, Energy and Tourism, Australian Government. Available at: http://www.ret.gov.au/energy/Documents/energyefficiencyopps/res‐material/Analysis‐of‐Diesel‐Use.pdf.
1 2 3 4
5 6 7 8
9 10 11
12 13 14
15
16 17 18
19 20
21 22 23
24 25 26
27 28 29 30
31 32 33 34 35
36 37
38 39
Dubois G., P. Peeters, J.‐P. Ceron, and S. Gössling (2011). The future tourism mobility of the world population: Emission growth versus climate policy. Transportation Research Part A: Policy and Practice 45, 1031–1042. (DOI: 10.1016/j.tra.2009.11.004). Available at: http://www.sciencedirect.com/science/article/pii/S0965856409001244.
EC (2008). Sustainable Consumption and Production and Sustainable Industrial Policy Action Plan. {SEC(2008) 2110} {SEC(2008) 2111}. Available at: http://ec.europa.eu/environment/eussd/escp_en.htm.
EC (2009). Economic Analysis of Resource Efficiency Policies (and additional material on case‐studies). European Commission, DG Environment. Available at: http://ec.europa.eu/environment/enveco/resource_efficiency/.
EC (2011). A resource‐efficient Europe – Flagship initiative under the Europe 2020 Strategy.
EC (2012a). Best Available Technologies (BAT) Reference Document for Iron and Steel Production, Industrial Emissions Directive 2010/75/EU (Integrated Pollution Prevention and Control). European Commission.
EC (2012b). Roadmap to a Resource Efficient Europe. Available at: http://ec.europa.eu/environment/resource_efficiency/index_en.htm.
ECCJ (2007). Overview of Energy Saving Technologies in Textile Industry. Energy Conservation Center, Japan. Available at: Industry. www.aseanenergy.org/download/projects/promeec/2007‐2008/industry/eccj/ECCJ_SW03%20Overview%20of%20energy%20saving%20technology_TH.pdf.
Eckelman M.J., B.K. Reck, and T.E. Graedel (2012). Exploring the Global Journey of Nickel with Markov Chain Models. Journal of Industrial Ecology 16, 334–342. (DOI: 10.1111/j.1530‐9290.2011.00425.x).
Edenhofer O., R. Pichs‐Madruga, Y. Sokona, K. Seyboth, P. Matschoss, S. Kadner, T. Zwickel, P. Eickemeier, G. Hansen, S. Schlömer, and C. von Stechow (2011). WHAT CHAPTER? In: IPCC special report on renewable energy sources and climate change mitigation. Cambridge University Press, Cambridge, UK and New York, USA.
Edwards‐Jones G., L. Milà i Canals, N. Hounsome, M. Truninger, G. Koerber, B. Hounsome, P. Cross, E.H. York, A. Hospido, K. Plassmann, I.M. Harris, R.T. Edwards, G.A.S. Day, A.D. Tomos, S.J. Cowell, and D.L. Jones (2008). Testing the assertion that “local food is best”: the challenges of an evidence‐based approach. Trends in Food Science & Technology 19, 265–274. (DOI: 10.1016/j.tifs.2008.01.008).
EIO (2011). The Eco‐Innovation Challenge: Pathways to a resource‐efficient Europe. Eco‐Innovation Observatory, Funded by the European Commission, DG Environment, Brussels.
EIO (2012). The Eco‐Innovation Gap: An economic opportunity for business. Eco‐Innovation Observatory, Funded by the European Commission, DG Environment, Brussels.

Second Order Draft (SOD) IPCC WG III AR5
Do Not Cite, Quote or Distribute 71 of 92 Chapter 10 WGIII_AR5_Draft2_Ch10.doc 22 February 2013
El‐Haggar S. (2010). Sustainable Industrial Design and Waste Management: Cradle‐to‐Cradle for Sustainable Development. Academic Press, 421 pp., (ISBN: 9780080550145).
1 2
3 4
5 6 7
8 9
10
11 12
13 14
15
16 17
18 19 20
21 22 23
24 25
26 27
28 29 30
31 32 33
34 35
36 37
Engel D., and D.. Kammen (2009). Green Jobs and the Clean Energy Economy. Available at: http://rael.berkeley.edu/sites/default/files/old‐site‐files/TLS%20Four_May2209_1.pdf.
EPA (forthcoming). Global Mitigation of Non‐CO2 Greenhouse Gas Emissions. United States Environmental Protection Agency, Washington, D.C., USA. Available at: http://www.epa.gov/climatechange/.
EPA (2012). Global Anthropogenic Non‐CO2 Greenhouse Gas Emissions: 1990 ‐ 2030. Available at: http://www.epa.gov/climatechange/Downloads/EPAactivities/EPA_Global_NonCO2_Projections_Dec2012.pdf.
Eriksson H., and S. Harvey (2004). Black liquor gasification—consequences for both industry and society. Energy 29, 581–612. (DOI: 10.1016/j.energy.2003.09.005).
Erisman J.W., M.A. Sutton, J. Galloway, Z. Klimont, and W. Winiwarter (2008). How a century of ammonia synthesis changed the world. Nature Geoscience 1, 636–639. (DOI: 10.1038/ngeo325).
ETC, and UNWTO (2009). Briefing to delegates. Gothenburg, Sweden.
FAO (2012). FAOSTAT. Available at: http://faostat.fao.org/site/626/DesktopDefault.aspx?PageID=626#ancor.
Fine P., and E. Hadas (2012). Options to reduce greenhouse gas emissions during wastewater treatment for agricultural use. Science of The Total Environment 416, 289–299. (DOI: 10.1016/j.scitotenv.2011.11.030).
Fischer S., S. Steger, N.D. Jordan, M. O’Brien, and P. Schepelmann (2012). Leasing Society. European Parliament Committee Environment, public health and food safety. Available at: http://www.europarl.europa.eu/committees/en/studies.html.
Fisher‐Vanden K., G.H. Jefferson, H. Liu, and Q. Tao (2004). What is driving China’s decline in energy intensity? Resource and Energy Economics 26, 77–97. (DOI: 10.1016/j.reseneeco.2003.07.002).
Flannery B.P., and H.S. Kheshgi (2005). An industry perspective on successful deployment and global commercialization of innovative technologies for GHG management. Tokyo, Japan. 2005, .
Fleiter T., D. Fehrenbach, E. Worrell, and W. Eichhammer (2012). Energy efficiency in the German pulp and paper industry – A model‐based assessment of saving potentials. Energy 40, 84–99. (DOI: 10.1016/j.energy.2012.02.025).
Fleiter T., E. Gruber, W. Eichhammer, and E. Worrell (2012). The German energy audit program for firms ‐ a cost‐effective way to improve energy efficiency? Energy Efficiency http://dx.doi.org/10.1007/s12053‐012‐9157‐7.
Fleiter T., S. Hirzel, and E. Worrell (2012). The characteristics of energy‐efficiency measures – a neglected dimension. Energy Policy 51, 502–513. (DOI: 10.1016/j.enpol.2012.08.054).
Fletcher K. (2008). Sustainable Fashion and Textiles: Design Journeys. Earthscan, 254 pp., (ISBN: 9781844074815).

Second Order Draft (SOD) IPCC WG III AR5
Do Not Cite, Quote or Distribute 72 of 92 Chapter 10 WGIII_AR5_Draft2_Ch10.doc 22 February 2013
Flörke M., E. Kynast, I. Bärlund, S. Eisner, F. Wimmer, and J. Alcamo (18:04:22). Domestic and industrial water uses of the past 60 years as a mirror of socio‐economic development: A global simulation study. Global Environmental Change 23, 144–156. (DOI: 10.1016/j.gloenvcha.2012.10.018).
1 2 3 4
5 6 7
8 9
10
11 12 13
14 15 16
17 18
19 20 21
22 23 24
25 26
27 28 29
30 31 32
33 34 35 36
37 38 39
Foley J., D. de Haas, K. Hartley, and P. Lant (2010). Comprehensive life cycle inventories of alternative wastewater treatment systems. Water Research 44, 1654–1666. (DOI: 10.1016/j.watres.2009.11.031).
Fortin M.‐J., and C. Gagnon (2006). Interpreting major industrial landscapes: Social follow‐up on meanings, the case of two aluminium smelters, Alcan (Alma, Canada) and Pechiney (Dunkirk, France). Environmental Impact Assessment Review 26, 725–745. (DOI: 10.1016/j.eiar.2006.06.002).
Fritzson A., and T. Berntsson (2006). Energy efficiency in the slaughter and meat processing industry—opportunities for improvements in future energy markets. Journal of Food Engineering 77, 792–802. (DOI: 10.1016/j.jfoodeng.2005.08.005).
Furchtgott‐Roth D. (2012). The elusive and expensive green job. Energy Economics. (DOI: 10.1016/j.eneco.2012.08.034). Available at: http://www.sciencedirect.com/science/article/pii/S0140988312002046.
Galitsky C., E. Worrell, and M. Ruth (2003). Energy Efficiency Improvement and Cost Saving Opportunities for the Corn Wet Milling Industry. US Environmental Protection Agency.
Gao R.Y., L. Shao, J.S. Li, S. Guo, M.Y. Han, J. Meng, J.B. Liu, F.X. Xu, and C. Lin (2012). Comparison of greenhouse gas emission accounting for a constructed wetland wastewater treatment system. Ecological Informatics 12, 85–92. (DOI: 10.1016/j.ecoinf.2012.05.007).
Gard D.L., and G.A. Keoleian (2002). Digital versus Print: Energy Performance in the Selection and Use of Scholarly Journals. Journal of Industrial Ecology 6, 115–132. (DOI: 10.1162/108819802763471825).
Garnett T. (2009). Livestock‐related greenhouse gas emissions: impacts and options for policy makers. Environmental Science & Policy 12, 491–503. (DOI: 10.1016/j.envsci.2009.01.006).
Garnett T. (2011). Where are the best opportunities for reducing greenhouse gas emissions in the food system (including the food chain)? Food Policy 36, Supplement 1, S23–S32. (DOI: 10.1016/j.foodpol.2010.10.010).
GEA (2012). Global Energy Assessment Toward a Sustainable Future. Cambridge University Press, Cambridge UK and New York, NY, USA and the International Institute for Applied Systems Analysis, Laxenburg, Austria.
Geels F.W., and J.W. Schot (2010). Part 1: The Dynamics of Transitions: A Socio‐Technical Perspective. In: Transitions to sustainable development�: new directions in the study of long term transformative change (eds. J. Grin, J. Rotmans and J.W. Schot). Routledge, New York(ISBN: 9780415876759 0415876753).
Geng Y., R. Côté, and F. Tsuyoshi (2007). A quantitative water resource planning and management model for an industrial park level. Regional Environmental Change 7, 123–135. (DOI: 10.1007/s10113‐007‐0026‐4).
Second Order Draft (SOD) IPCC WG III AR5
Do Not Cite, Quote or Distribute 73 of 92 Chapter 10 WGIII_AR5_Draft2_Ch10.doc 22 February 2013
Geng Y., and B. Doberstein (2008). Developing the circular economy in China: Challenges and opportunities for achieving “leapfrog development”. International Journal of Sustainable Development & World Ecology 15, 231–239. (DOI: 10.3843/SusDev.15.3:6).
1 2 3
4 5 6
7 8 9
10 11 12
13 14 15
16 17 18
19 20
21 22
23 24
25 26 27
28 29 30
31 32
33 34
35 36 37
38 39
Geng Y., T. Fujita, and X. Chen (2010). Evaluation of innovative municipal solid waste management through urban symbiosis: a case study of Kawasaki. Journal of Cleaner Production 18, 993–1000. (DOI: 10.1016/j.jclepro.2010.03.003).
Geng Y., X. Wang, Q. Zhu, and H. Zhao (2010). Regional initiatives on promoting cleaner production in China: a case of Liaoning. Journal of Cleaner Production 18, 1502–1508. (DOI: 10.1016/j.jclepro.2010.06.028).
Geng Y., P. Zhang, R.P. Côté, and T. Fujita (2009). Assessment of the National Eco‐Industrial Park Standard for Promoting Industrial Symbiosis in China. Journal of Industrial Ecology 13, 15–26. (DOI: 10.1111/j.1530‐9290.2008.00071.x).
Geng Y., P. Zhang, R.P. Côté, and Y. Qi (2008). Evaluating the applicability of the Chinese eco‐industrial park standard in two industrial zones. International Journal of Sustainable Development & World Ecology 15, 543–552. (DOI: 10.1080/13504500809469850).
Germond‐Duret C. (2012). Extractive Industries and the Social Dimension of Sustainable Development: Reflection on the Chad–Cameroon Pipeline. Sustainable Development, n/a–n/a. (DOI: 10.1002/sd.1527).
Geyer R. (2008). Parametric assessment of climate change impacts of automotive material substitution. Environmental Science and Technology 42, 6973–6979.
Ghosh D., and J. Roy (2011). Approach to energy efficiency among micro, small and medium enterprises in India: Results of a field survey.
Gössling S. (2010). Carbon Management in Tourism: Mitigating the Impacts on Climate Change. Routledge, 358 pp., (ISBN: 978‐0‐415‐56633‐9).
Gössling S., J.‐P. Ceron, G. Dubois, and M.C. Hall (2009). Hypermobile travellers. In: Climate change and aviation. Issues, Challenges and solutions. Eds Upham, P. and Gössling, S. Earthscan, London pp.131–151, (ISBN: 9781844076208).
Gössling S., C.M. Hall, P.M. Peeters, and D. Scott (2010). The Future of Tourism: Can Tourism Growth and Climate Policy be Reconciled? A Climate Change Mitigation Perspective. Tourism Recreation Research 35, 119–130. Available at: http://edepot.wur.nl/197417.
Gössling S., P. Peeters, J.‐P. Ceron, G. Dubois, T. Patterson, and R.B. Richardson (2005). The eco‐efficiency of tourism. Ecological Economics 54, 417–434. (DOI: 10.1016/j.ecolecon.2004.10.006).
Graedel T.E. (2010). Metal Stocks in Society: Scientific Synthesis. United Nations Environment Programme, 48 pp., (ISBN: 9789280730821).
Graedel T.E., J. Allwood, J.‐P. Birat, M. Buchert, C. Hagelüken, B.K. Reck, S.F. Sibley, and G. Sonnemann (2011). What Do We Know About Metal Recycling Rates? Journal of Industrial Ecology 15, 355–366. (DOI: 10.1111/j.1530‐9290.2011.00342.x).
Gruber E., and M. Brand (1991). Promoting energy conservation in small and medium‐sized companies. Energy Policy 19, 279–287.
Second Order Draft (SOD) IPCC WG III AR5
Do Not Cite, Quote or Distribute 74 of 92 Chapter 10 WGIII_AR5_Draft2_Ch10.doc 22 February 2013
GTZ, CSCP, and Wuppertal Institute (2006). Policy Instruments for Resource Efficiency ‐ Towards Sustainable Consumption and Production. 124 pp. Available at: http://www2.gtz.de/dokumente/bib/07‐0598.pdf.
1 2 3
4 5 6
7 8 9
10 11
12 13 14 15
16 17 18
19 20 21 22 23
24 25 26
27 28 29
30 31 32
33 34 35
36 37 38
39 40 41
Guha A. (2013). The Macro‐Costs of Forced Displacement of the Farmers in India: A Micro‐Level Study. European Journal of Development Research advance online publication 31 January 2013. (DOI: 10.1057/ejdr.2012.37).
Gunawansa A., and H.W. Kua (2011). A Comparison of Climate Change Mitigation and Adaptation Strategies for the Construction Industries of Three Coastal Territories. Sustainable Development, n/a–n/a. (DOI: 10.1002/sd.527).
Gustavsonn J., C. Cederberg, U. Sonesson, R. van Otterdijk, and A. Meybeck (2011). Global Food Losses and Food Waste. Food and Agriculture organization of the United Nations.
Gutowski T.G., S. Sahnia, J.M. Allwood, M.F. Ashby, and E. Worrell (to appear). The Energy Required to Produce Materials: Constraints on Energy Intensity Improvements, Parameters of Demand. Philosophical Transactions of the Royal Society A: Mathematical, Physical and Engineering Sciences.
Hall D.S. (2007). Mandatory Regulation of Nontraditional Greenhouse Gases: Policy Options for Industrial Process Emissions and Non‐CO2 Gases. Resources for the Future. Available at: http://www.rff.org/Publications/Pages/CPF_AssessingUSClimatePolicyOptions_IB14.aspx.
Halsnæs K., A. Garg, J. Christensen, H.Y. Føyn, M. Karavai, E.L. Rovere, M. Bramley, X. Zhu, C. Mitchell, J. Roy, K. Tanaka, H. Katayama, C. Mena, I. Obioh, I. Bashmakov, S. Mwakasonda, M.‐K. Lee, M. Vinluan, Y.J. Huang, and L. Segafredo Climate change mitigation policy paradigms—national objectives and alignments. Mitigation and Adaptation Strategies for Global Change, 1–27. (DOI: 10.1007/s11027‐012‐9426‐y).
Hasanbeigi A., M. Arens, and L. Price (2013). Emerging Energy‐Efficiency and Greenhouse Gas Mitigation Technologies for the Iron and Steel Industry. Lawrence Berkeley National Laboratory, Berkeley, CA.
Hasanbeigi A., C. Menke, and A. Therdyothin (2010). The use of conservation supply curves in energy policy and economic analysis: The case study of Thai cement industry. Energy Policy 38, 392–405. (DOI: 10.1016/j.enpol.2009.09.030).
Hasanbeigi A., C. Menke, and A. Therdyothin (2011). Technical and cost assessment of energy efficiency improvement and greenhouse gas emission reduction potentials in Thai cement industry. Energy Efficiency 4, 93–113. (DOI: 10.1007/s12053‐010‐9079‐1).
Hasanbeigi A., W. Morrow, E. Masanet, J. Sathaye, and T. Xu (2012). Assessment of Energy Efficiency Improvement and CO2 Emission Reduction Potentials in the Cement Industry in China. Lawrence Berkeley National Laboratory, Berkeley, CA.
Hasanbeigi A., W. Morrow, J. Sathaye, E. Masanet, and T. Xu (in press). Assessment of Energy Efficiency Improvement and CO2 Emission Reduction Potentials in the Iron and Steel Industry in China.
Hasanbeigi A., and L. Price (2012). A review of energy use and energy efficiency technologies for the textile industry. Renewable and Sustainable Energy Reviews 16, 3648–3665. (DOI: 10.1016/j.rser.2012.03.029).
Second Order Draft (SOD) IPCC WG III AR5
Do Not Cite, Quote or Distribute 75 of 92 Chapter 10 WGIII_AR5_Draft2_Ch10.doc 22 February 2013
Hasanbeigi A., L. Price, and E. Lin (2012). Emerging energy‐efficiency and CO2 emission‐reduction technologies for cement and concrete production: A technical review. Renewable and Sustainable Energy Reviews 16, 6220–6238. (DOI: 10.1016/j.rser.2012.07.019).
1 2 3
4 5 6
7 8 9
10 11
12 13
14 15 16
17 18 19
20 21 22
23 24
25 26 27 28 29
30 31 32
33 34
35 36
37 38
Hasanuzzaman M., N.A. Rahim, M. Hosenuzzaman, R. Saidur, I.M. Mahbubul, and M.M. Rashid (2012). Energy savings in the combustion based process heating in industrial sector. Renewable and Sustainable Energy Reviews 16, 4527–4536. (DOI: 10.1016/j.rser.2012.05.027).
Hashimoto S., T. Fujita, Y. Geng, and E. Nagasawa (2010). Realizing CO2 emission reduction through industrial symbiosis: A cement production case study for Kawasaki. Resources Conservation and Recycling 54, 704–710. (DOI: 10.1016/j.resconrec.2009.11.013).
Hatayama H., I. Daigo, Y. Matsuno, and Y. Adachi (2010). Outlook of the World Steel Cycle Based on the Stock and Flow Dynamics. Environ. Sci. Technol. 44, 6457–6463. (DOI: 10.1021/es100044n).
Heijnes H., M. van Brummelen, and K. Blok (1999). Reduction of the emissions of HFC’s, PFC’s and SF6 in the European Union. Ecofys, Utrecht, Netherlands.
Hekkert M.P., J. van den Reek, E. Worrell, and W.C. Turkenburg (2002). The impact of material efficient end‐use technologies on paper use and carbon emissions. Resources, Conservation and Recycling 36, 241–266. (DOI: 10.1016/S0921‐3449(02)00081‐2).
Henriques Jr. M.F., F. Dantas, and R. Schaeffer (2010). Potential for reduction of CO2 emissions and a low‐carbon scenario for the Brazilian industrial sector. Energy Policy 38, 1946–1961. (DOI: 10.1016/j.enpol.2009.11.076).
Heyer K.‐U., K. Hupe, M. Ritzkowski, and R. Stegmann (2005). Pollutant release and pollutant reduction – Impact of the aeration of landfills. Waste Management 25, 353–359. (DOI: 10.1016/j.wasman.2005.02.007).
HM Treasury e‐C.T. (2006). Stern Review on the Economics of Climate Change. Available at: http://www.hm‐treasury.gov.uk/sternreview_index.htm.
Höhne N., N. Braun, M. Hagemann, H. Fekete, J. Grözinger, V. Schüler, G. Hänsel, M. Vieweg, B. Hare, M. Schaeffer, and M. Rocha (2012). Climate Action Tracker Australia. Assessment of Australia‘s policies impacting its greenhouse gas emissions profile. Available at: http://climateactiontracker.org/publications/publication/49/Assessment‐of‐Australias‐policies‐impacting‐its‐greenhouse‐gas‐emissions‐profile.html.
Holmgren K., and A. Gebremedhin (2004). Modelling a district heating system: Introduction of waste incineration, policy instruments and co‐operation with an industry. Energy Policy 32, 1807–1817. (DOI: 10.1016/S0301‐4215(03)00168‐X).
Hong G.‐B., T.‐L. Su, J.‐D. Lee, T.‐C. Hsu, and H.‐W. Chen (2010). Energy conservation potential in Taiwanese textile industry. Energy Policy 38, 7048–7053. (DOI: 10.1016/j.enpol.2010.07.024).
Hoornweg D., and P. Bhada‐Tata (2012). What a Waste: A Global Review of Solid Waste Management. World Bank, Washington D.C. Available at: http://go.worldbank.org/BCQEP0TMO0.
HPTCJ (2010). Survey of Availability of Heat Pumps in the Food and Beverage Sector. Heat Pump and Thermal Technology Centre of Japan. Available at: www.hptcj.or.jp/e/publication/survey.html.
Second Order Draft (SOD) IPCC WG III AR5
Do Not Cite, Quote or Distribute 76 of 92 Chapter 10 WGIII_AR5_Draft2_Ch10.doc 22 February 2013
IAI (2009). Global Aluminium Recycling: A Cornerstone of Sustainable Development. Available at: http://www.world‐aluminium.org/cache/fl0000181.pdf.
1 2
3 4 5
6 7
8 9
10 11
12 13 14
15 16 17
18 19
20 21 22
23 24
25
26
27 28
29 30 31
32 33
34 35 36 37
ICCA (2009). Innovations for Greenhouse Gas Reductions ‐ life cycle quantification of carbon abatement solutions enabled by the chemical industry. International Council of Chemical Associations.
ICSG (2012). The World Copper Factbook 2012. International Copper Study Group. Available at: http://www.icsg.org/index.php/component/jdownloads/finish/170/1188.
IEA (2007). Tracking industrial energy efficiency and CO2 emissions. International Energy Agency, Paris.
IEA (2009a). Energy Technology Transitions for Industry. Strategies for the Next Industrial Revolution. Paris.
IEA (2009b). Energy Technology Perspectives 2010. Scenarios and Strategies to 2050. International Energy Agency, Paris. Available at: http://www.iea.org/publications/freepublications/publication/name,26100,en.html.
IEA (2009c). Energy Technology Transitions for Industry. Strategies for the Next Industrial Revolution. International Energy Agency, Paris. Available at: http://www.iea.org/Textbase/npsum/industry2009sum.pdf.
IEA (2009d). Chemical and Petrochemical Sector: Potential of best practice technology and other measures for improving energy efficiency. International Energy Agency, Paris.
IEA (2011). World Energy Outlook 2011 Special Report: Are We Entering a Golden Age of Gas? International Energy Agency, Paris. Available at: http://www.worldenergyoutlook.org/goldenageofgas/.
IEA (2012a). CO2 Emissions from Fuel Combustion. Beyond 2020 Online Database. 2012 Edition. International Energy Agency, Paris. Available at: http://data.iea.org.
IEA (2012b). Energy Balances of OECD countries. International Energy Agency, Paris.
IEA (2012c). Energy Balances of Non‐OECD Countries. International Energy Agency, Paris.
IEA (2012d). Energy Technology Perspectives 2012: Pathways to a clean energy system. International Energy Agency (IEA), Paris, France. Available at: www.iea.org/etp/.
IEA/WBCSD (2009). Cement Technology Roadmap 2009: Carbon Emissions Reductions up to 2050. International Energy Agency/World Business Council for Sustainable Development. Available at: http://www.wbcsd.org/DocRoot/mka1EKor6mqLVb9w903o/WBCSD‐IEA_CementRoadmap.pdf.
IEAGHG (2008). CO2 Capture in the Cement Industry. International Energy Agency Greenhouse Gas R&D Programme, Cheltenham.
IFA (2009). Fertilizers, Climate Change and Enhancing Agricultural Productivity Sustainably. International Fertilizer Industry Association, Paris, France. Available at: www.fertilizer.org/ifa/content/download/23000/329421/version/1/file/2009_ifa_climate_change.pdf.
Second Order Draft (SOD) IPCC WG III AR5
Do Not Cite, Quote or Distribute 77 of 92 Chapter 10 WGIII_AR5_Draft2_Ch10.doc 22 February 2013
IIED (2002). The Report of the Mining, Minerals and Sustainable Development Project. International Institute for Environment and Development, London. Available at: http://www.iied.org/sustainable‐markets/key‐issues/business‐and‐sustainable‐development/mining‐minerals‐and‐sustainable‐development.
1 2 3 4
5 6 7
8 9
10 11 12
13 14 15
16 17 18 19
20 21 22
23 24
25 26
27 28
29 30
31
32 33 34 35
36 37
ILO (2011). Assessing green jobs potential in developing countries A Practitioner’s Guide. International Labour Organisation. Available at: http://www.ilo.org/wcmsp5/groups/public/‐‐‐dgreports/‐‐‐dcomm/‐‐‐publ/documents/publication/wcms_153458.pdf.
IMA (2009). Year ending Statistics: 2009. International Magnesium Association. Available at: http://www.intlmag.org/files/yend2009rev.pdf.
INCCA (2010). India: Greenhouse Gas Emissions 2007. Indian Network for Climate Change Assessment. Ministry of Environment and Forests, Government of India. Available at: http://moef.nic.in/downloads/public‐information/Report_INCCA.pdf.
India Planning Commission (2007). Report of the Task Force for the Eleventh Five Year Plan (2007‐12) on Cement submitted to the Planning Commission of India. India Planning Commission. Available at: http://planningcommission.nic.in/aboutus/committee/wrkgrp11/wg11_cement.pdf.
International Finance Corporation (2007). Environmental, Health and Safety Guidelines for Integrated Steel Miils. Available at: http://www.ifc.org/ifcext/enviro.nsf/AttachmentsByTitle/gui_EHSGuidelines2007_IntegratedSteelMills/$FILE/Final+‐+Integrated+Steel+Mills.pdf.
International Synergies Ltd (2009). National Industrial Symbiosis Programme ‐ The Pathway to a low carbon sustainable economy. by Peter Lay‐bourn and Maggie Morrissey. Available at: www.nisp.org.uk/Publications/Pathway.pdf.
Intlekofer K., B. Bras, and M. Ferguson (2010). Energy Implications of Product Leasing. Environmental Science & Technology 44, 4409–4415. (DOI: 10.1021/es9036836).
IPCC (2000). Emission Scenarios. In: Special Report on Emissions Scenarios [Nebojsa Nakicenovic and Rob Swart (Eds.)].Geneva. Available at: http://www.ipcc.ch/pdf/special‐reports/spm/sres‐en.pdf.
IPCC/TEAP (2005). Special Report on Safeguarding the Ozone Layer and the Global Climate System: Issues Related to Hydrofluorocarbons and Perfluorocarbons.
Jackson T. (2011). Societal transformations for a sustainable economy. Natural Resources Forum 35, 155–164. (DOI: 10.1111/j.1477‐8947.2011.01395.x).
Jackson, T (2011). Prosperity without growth. Routledge.
Jacobs, and IPST (2006). Pulp and Paper Industry: Energy Bandwidth Study. Report for American Institute of Chemical Engineers (AIChE). Jacobs Greenville and Institute of Paper Science and Technology (IPST) at Georgia Institute of Technology, Atlanta. Available at: http://www1.eere.energy.gov/industry/forest/pdfs/doe_bandwidth.pdf.
JISF (2012). Tetsu no wa ga tsunagu hito to chikyu (in Japanese). Statistical yearbook from the Japan Iron and Steel Federation (JISF).
Second Order Draft (SOD) IPCC WG III AR5
Do Not Cite, Quote or Distribute 78 of 92 Chapter 10 WGIII_AR5_Draft2_Ch10.doc 22 February 2013
Jochem E., and E. Gruber (2007). Local learning‐networks on energy efficiency in industry – Successful initiative in Germany. Applied Energy 84, 806–816. (DOI: 10.1016/j.apenergy.2007.01.011).
1 2 3
4 5
6 7 8
9 10
11 12 13
14 15
16 17 18
19 20
21 22 23
24 25 26
27 28 29
30 31
32 33
34 35 36 37
38 39
De Jong P. (1997). The Structure of the Dutch Waste Sector and Impediments for Waste Reduction. Waste Management & Research 15, 641–658.
JRC/PBL (2012). Emission Database for Global Atmospheric Research (EDGAR) ‐ release version 4.2 FT2010. European Commission, Joint Research Centre (JRC)/PBL Netherlands Environmental Assessment Agency. Available at: http://edgar.jrc.ec.europa.eu.
Kainuma M., K. Miwa, T. Ehara, O. Akashi, and Y. Asayama (2013). A low carbon society: global visions, pathways, and challenges. Climate Policy 13, 6–22.
Kammen D., K. Kapadia,, and M. Fripp (2004). Putting Renewables to Work: How Many Jobs Can the Clean Energy Industry Generate? University of California, Berkeley. Available at: http://rael.berkeley.edu/old‐site/renewables.jobs.2006.pdf.
Karakurt I., G. Aydin, and K. Aydiner (2012). Sources and mitigation of methane emissions by sectors: A critical review. Renewable Energy 39, 40–48. (DOI: 10.1016/j.renene.2011.09.006).
Kaufman S.M., and N.J. Themelis (2009). Using a direct method to characterize and measure flows of municipal solid waste in the United States. Journal of the Air & Waste Management Association (1995) 59, 1386–1390.
Kheshgi H.S., H. Thomann, N.A. Bhore, R.B. Hirsch, M.E. Parker, and G. Teletzke (2012). Perspectives on CCS Cost and Economics. SPE Economics & Management 4, pp. 24–31.
Kim H.‐J., G.A. Keoleian, and S.J. Skerlos (2011). Economic Assessment of Greenhouse Gas Emissions Reduction by Vehicle Lightweighting Using Aluminum and High‐Strength Steel. Journal of Industrial Ecology 15, 64–80.
Kim H.‐J., C. McMillan, G.A. Keoleian, and S.J. Skerlos (2010). Greenhouse Gas Emissions Payback for Lightweighted Vehicles Using Aluminum and High‐Strength Steel. Journal of Industrial Ecology 14, 929–946.
Klee H., R. Hunziker, R. van der Meer, and R. Westaway (2011). Getting the numbers right: a database of energy performance and carbon dioxide emissions for the cement industry. Greenhouse Gas Measurement and Management 1, 109–118. (DOI: 10.1080/20430779.2011.579357).
Klinglmair M., and J. Fellner (2010). Urban Mining in Times of Raw Material Shortage. Journal of Industrial Ecology 14, 666–679. (DOI: 10.1111/j.1530‐9290.2010.00257.x).
Kollmus A., and M. Lazarus (2010). Industrial N2O Projects Under the CDM: The Case of Nitric Acid Production. Stockholm Environment Institute.
Kong L., A. Hasanbeigi, and L. Price (under review). Emerging Energy‐Efficiency and Greenhouse Gas Mitigation Technologies for the Pulp and Paper Industry. Renewable and Sustainable Energy Reviews. Available at: http://eaei.lbl.gov/emerging‐energy‐efficiency‐and‐greenhouse‐gas‐mitigation‐technologies‐pulp‐and‐paper‐industry.
Kong L., A. Hasanbeigi, L. Price, and H. Liu (forthcoming). Analysis of Energy‐Efficiency Opportunities for the Pulp and Paper Industry in China. Lawrence Berkeley National Laboratory, Berkeley, CA.
Second Order Draft (SOD) IPCC WG III AR5
Do Not Cite, Quote or Distribute 79 of 92 Chapter 10 WGIII_AR5_Draft2_Ch10.doc 22 February 2013
Kramer K.J., E. Masanet, T. Xu, and E. Worrell (2009). Energy Efficiency Improvement and Cost Saving Opportunities for the Pulp and Paper Industry: An ENERGY STAR Guide for Energy and Plant Managers. Lawrence Berkeley National Laboratory, Berkeley, CA. Available at: http://www.energystar.gov/ia/business/industry/downloads/Pulp_and_Paper_Energy_Guide.pdf.
1 2 3 4
5 6 7
8 9
10
11
12 13 14 15 16
17 18
19 20 21
22 23
24 25 26
27 28 29
30 31
32 33
34 35 36
37 38
Kuramochi T., A. Ramírez, W. Turkenburg, and A. Faaij (2012a). Comparative assessment of CO2 capture technologies for carbon‐intensive industrial processes. Progress in Energy and Combustion Science 38, 87–112. (DOI: 10.1016/j.pecs.2011.05.001).
Kuramochi T., A. Ramírez, W. Turkenburg, and A. Faaij (2012b). Effect of CO2 capture on the emissions of air pollutants from industrial processes. International Journal of Greenhouse Gas Control 10, 310–328. (DOI: 10.1016/j.ijggc.2012.05.022).
Layard R. (2006). Happiness: lessons from a new science. Penguin, (ISBN: 9780141016900).
LBNL, and RDC (2007). Improving Process Heating System Performance: A Sourcebook for Industry. Second Edition. Lawrence Berkeley National Laboratory and Resource Dynamics Corporation. Available at: http://www1.eere.energy.gov/manufacturing/tech_deployment/pdfs/process_heating_sourcebook2.pdf.
Lettenmeier M.T., S. Samus, S. Veuro, and H. Rohn (2009). Connection between material and energy efficiency. Vienna. 7‐December‐2009, .
Lin J., D. He, P. He, M. Hu, and H. Lu (2011). The Race is On: China Kick‐Starts Its Clean Economy. ClimateWorks Foundation, San Francisco. Available at: http://www.climateworks.org/download/?id=86f8db38‐1272‐41da‐8fe9‐4f9aa0021d13.
Liu N., and B.W. Ang (2007). Factors shaping aggregate energy intensity trend for industry: Energy intensity versus product mix. Energy Economics 29, 609–635. (DOI: 10.1016/j.eneco.2006.12.004).
Liu G., C.E. Bangs, and D.B. Müller (2012). Stock dynamics and emission pathways of the global aluminium cycle. Nature Climate Change. (DOI: 10.1038/nclimate1698). Available at: http://www.nature.com/nclimate/journal/vaop/ncurrent/full/nclimate1698.html.
Liu X., X. Gao, W. Wang, L. Zheng, Y. Zhou, and Y. Sun (2012). Pilot‐scale anaerobic co‐digestion of municipal biomass waste: Focusing on biogas production and GHG reduction. Renewable Energy 44, 463–468. (DOI: 10.1016/j.renene.2012.01.092).
Locher F.W. (2006). Cement: principles of production and use. Verlag Bau+Technik, 535 pp., (ISBN: 9783764004200).
Martinez‐Alier J. (2001). Mining conflicts, environmental justice, and valuation. Journal of Hazardous Materials 86, 153–170. (DOI: 10.1016/S0304‐3894(01)00252‐7).
Martinez‐Fernandez C., C. Hinojosa, and G. Miranda (2010). Green jobs and skills: the local labour market implications of addressing climate change. Available at: http://www.oecd.org/regional/leed/44683169.pdf.
Masanet et al. (2008). Energy Efficiency Improvements and Cost Saving Opportunities for the Fruit and Vegetable Processing Industry.

Second Order Draft (SOD) IPCC WG III AR5
Do Not Cite, Quote or Distribute 80 of 92 Chapter 10 WGIII_AR5_Draft2_Ch10.doc 22 February 2013
Massé D.I., G. Talbot, and Y. Gilbert (2011). On farm biogas production: A method to reduce GHG emissions and develop more sustainable livestock operations. Animal Feed Science and Technology 166–167, 436–445. (DOI: 10.1016/j.anifeedsci.2011.04.075).
1 2 3
4 5
6 7 8
9 10 11 12
13 14 15 16
17 18 19
20 21
22 23 24 25
26
27 28
29 30 31 32
33 34 35
36 37 38 39
Matsumiya T. (2011). Steelmaking technology for a sustainable society. Calphad 35, 627–635. (DOI: 10.1016/j.calphad.2011.02.009).
Mazzanti M., and R. Zoboli (2008). Waste generation, waste disposal and policy effectiveness Evidence on decoupling from the European Union. Resources, Conservation and Recycling 52, 1221–1234. (DOI: 10.1016/j.resconrec.2008.07.003).
Mazzotti M., J. Abanades, R. Allam, K. Lackner, F. Meunier, E. Rubin, J. Sanchez, K. Yogo, and R. Zevenhoven (2005). Mineral carbonation and industrial uses of carbon dioxide. In: IPCC Special Report on Carbon dioxide Capture and Storage. Cambridge University Press, Cambridge, UK and New York, USA.
McKane A., and A. Hasanbeigi (2010). Motor Systems Efficiency Supply Curves: Assessment the Energy Efficiency Potential of Industrial Motor Systems. United Nations Industrial Development Organization, Vienna. Available at: http://industrial‐energy.lbl.gov/files/industrial‐energy/active/0/UNIDO%20Motor%20Systems%20Efficiency%20Supply%20Curves.pdf.
McKane A., and A. Hasanbeigi (2011). Motor systems energy efficiency supply curves: A methodology for assessing the energy efficiency potential of industrial motor systems. Energy Policy 39, 6595–6607. (DOI: 10.1016/j.enpol.2011.08.004).
McKinsey&Company (2009). Pathways to a low‐carbon economy: Version 2 of the global greenhouse gas abatement cost curve. McKinsey Company.
McKinsey&Company (2010). Impact of the financial crisis on carbon economics. Version 2.1 of the Global Greenhouse Gas Abatement Cost Curve. McKinsey Company. Available at: http://www.mckinsey.com/client_service/sustainability/latest_thinking/greenhouse_gas_abatement_cost_curves.
McKinsey&Company (2012). Climate Desk ‐ http://solutions.mckinsey.com/climatedesk/.
Meidel R.W. (2005). Oil company makes CHP work. Cogeneration and On‐Site Power Production, pp.49–56.
Melián‐Cabrera I., R.W. van den Brink, J.A.Z. Pieterse, G. Mul, F. Kapteijn, and J.A. Moulijn (2004). Decomposition of N2O in the nitric acid industry: Definition of structure‐activity relations as a tool to develop new catalysts. Paris, France. 11‐July‐2004, .Available at: ftp://nrg‐nl.com/pub/www/library/report/2005/rx05080.pdf.
Mestl H.E.S., K. Aunan, J. Fang, H.M. Seip, J.M. Skjelvik, and H. Vennemo (2005). Cleaner production as climate investment—integrated assessment in Taiyuan City, China. Journal of Cleaner Production 13, 57–70. (DOI: 10.1016/j.jclepro.2003.08.005).
Michaelowa A., and J. Buen (2012). The Clean Development Mechanism gold rush. In: Carbon Markets or Climate Finance?: Low Carbon and Adaptation Investment Choices for the Developing World. Routledge, Abingdon pp.1–38, (ISBN: 978‐1‐84971‐474‐7). Available at: http://www.routledge.com/books/details/9781849714747/.

Second Order Draft (SOD) IPCC WG III AR5
Do Not Cite, Quote or Distribute 81 of 92 Chapter 10 WGIII_AR5_Draft2_Ch10.doc 22 February 2013
Milford R.L., J.M. Allwood, and J.M. Cullen (2011). Assessing the potential of yield improvements, through process scrap reduction, for energy and CO2 abatement in the steel and aluminium sectors. Resources, Conservation and Recycling 55, 1185 – 1195. (DOI: 10.1016/j.resconrec.2011.05.021).
1 2 3
4 5
6 7
8 9
10 11
12 13 14
15 16 17
18 19 20
21 22 23 24
25 26 27
28 29
30
31 32
33 34 35
36 37 38
Miller B.R., and L.J.M. Kuijpers (2011). Projecting future HFC‐23 emissions. Atmospheric Chemistry and Physics 11, 13259–13267. (DOI: 10.5194/acp‐11‐13259‐2011).
Moldoveanu G.A., and V.G. Papangelakis (2012). Recovery of rare earth elements adsorbed on clay minerals: I. Desorption mechanism. Hydrometallurgy 117‐118, 71–78.
Morimoto K., H.X. Nguyen, M. Chihara, T. Honda, and R. Yamamoto (2006). Proposals for Classification and an Environmental Impact Evaluation Method for Eco‐services: Case Study of Municipal Waste Treatment in Cement Production. Journal of Life Cycle Assessment, Japan 2, 347–354.
Morrow W., A. Hasanbeigi, J. Sathaye, and T. Xu (2012a). Assessment of Energy Efficiency Improvement and CO2 Emission Reduction Potentials in the Cement Industry in India. Lawrence Berkeley National Laboratory, Berkeley, CA.
Morrow W., A. Hasanbeigi, J. Sathaye, and T. Xu (2012b). Assessment of Energy Efficiency Improvement and CO2 Emission Reduction Potentials in the iron and steel Industry in India. Lawrence Berkeley National Laboratory, Berkeley, CA.
Moss R.L., E. Tzimas, H. Kara, P. Willis, and J. Kooroshy (2011). Critical Metals in Strategic Energy Technologies. Assessing Rare Metals as Supply‐Chain Bottlenecks in Low‐Carbon Energy Technologies. EU Joint Research Centre.
Muller N., and J. Harnish (2008). A Blueprint for a Climate‐Friendly Cement Industry: How to Turn Around the Trend of Cement Related Emissions in the Developing World. WWF International, Gland, Switzerland. Available at: http://wwf.panda.org/about_our_earth/all_publications/?151621/A‐blueprint‐for‐a‐climate‐friendly‐cement‐industry.
Naqvi M., J. Yan, and E. Dahlquist (2010). Black liquor gasification integrated in pulp and paper mills: A critical review. Bioresource Technology 101, 8001–8015. (DOI: 10.1016/j.biortech.2010.05.013).
Naranjo M., D.T. Brownlow, and A. Garza (2011). CO2 capture and sequestration in the cement industry. Energy Procedia 4, 2716–2723. (DOI: 10.1016/j.egypro.2011.02.173).
NBS (2010). China Energy Statistical Yearbook 2010. National Bureau of Statistics, Beijing, China.
NBS (2012). China Energy Statistical Yearbook 2011. National Bureau of Statistics, Beijing, China. Available at: http://www.stats.gov.cn/tjsj/ndsj/2010/indexee.htm.
NDRC (2011a). Further Structural Optimization of Building Materials Industry in China. National Development and Reform Commission. Available at: http://gys.ndrc.gov.cn/gzdt/t20110130_393698.htm.
NDRC (2011b). Review of the Eleventh Five‐Year Plan: Top 1000 Program Exceeded Targets. National Development and Reform Commission. Available at: http://www.gov.cn/gzdt/2011‐09/30/content_1960586.htm.
Second Order Draft (SOD) IPCC WG III AR5
Do Not Cite, Quote or Distribute 82 of 92 Chapter 10 WGIII_AR5_Draft2_Ch10.doc 22 February 2013
Van Nes N., and J. Cramer (2006). Product lifetime optimization: a challenging strategy towards more sustainable consumption patterns. Journal of Cleaner Production 14, 1307–1318. (DOI: 10.1016/j.jclepro.2005.04.006).
1 2 3
4 5 6
7 8 9
10 11 12
13 14 15 16
17 18 19
20 21
22 23 24
25 26 27
28 29 30
31 32
33 34 35
36 37
38 39 40
Nissanke M. (2009). The Global Financial Crisis and the Developing World: Transmission Channels and Fall‐outs for Industrial Development. Available at: http://www.unido.org/fileadmin/user_media/Publications/RSF_DPR/WP062009_Ebook.pdf.
Nordrum S., D. Lieberman, M. Colombo, A. Gorski, and C. Webb (2011). Assessment of greenhouse gas mitigation options and costs for California Petroleum Industry facilities: The shape of things to come. Energy Procedia 4, 5729–5737. (DOI: 10.1016/j.egypro.2011.02.568).
Norgate T., and N. Haque (2010). Energy and greenhouse gas impacts of mining and mineral processing operations. Journal of Cleaner Production 18, 266–274. (DOI: 10.1016/j.jclepro.2009.09.020).
NREL, LBNL, and RDC (2012). Improving Steam System Performance: A Sourcebook for Industry. National Renewable Energy Laboratory, Lawrence Berkeley National Laboratory, and Resource Dynamics Corporation. Available at: http://www1.eere.energy.gov/manufacturing/tech_deployment/pdfs/steamsourcebook.pdf.
Nzihou A., N.J. Themelis, M. Kemiha, and Y. Benhamou (2012). Dioxin emissions from municipal solid waste incinerators (MSWIs) in France. Waste management 32, 2273–2277. (DOI: 10.1016/j.wasman.2012.06.016).
OCMAL (2010). Observatorio de Conflictos Mineros de América Latina. Available at: http:// www.conflictosmineros.net.
Oda J., K. Akimoto, T. Tomoda, M. Nagashima, K. Wada, and F. Sano (2012a). International comparisons of energy efficiency in power, steel, and cement industries. Energy Policy 44, 118–129. (DOI: 10.1016/j.enpol.2012.01.024).
Oda J., K. Akimoto, T. Tomoda, M. Nagashima, K. Wada, and F. Sano (2012b). International comparisons of energy efficiency in power, steel, and cement industries. Energy Policy 44, 118–129. (DOI: 10.1016/j.enpol.2012.01.024).
OECD (2008). Measuring Material Flows and Resource Productivity (Volumes I‐III and Synthesis Report). OECD, Paris, France. Available at: http://www.oecd.org/redirect/dataoecd/55/12/40464014.pdf.
OECD (2009). Sustainable Manufacturing and Eco‐innovation: Towards a Green Economy. OECD Observer, 1–8.
OECD (2011). OECD Science, Technology and Industry Scoreboard 2011: Innovation and Growth in Knowledge Economies. Paris, France, 204 pp., (ISBN: 978‐92‐64‐11165‐3). Available at: http://www.oecd.org/document/10/0,3746,en_2649_33703_39493962_1_1_1_1,00.html.
OECD, and UNEP (2011). Climate Change and Tourism Policy in OECD Countries. OECD Studies on Tourism, OECD Publishing. (DOI: 10.1787/9789264119598‐en).
Oland C.B. (2004). Guide to Combined Heat and Power. Oak Ridge National Laboratory, Oak Ridge. Available at: http://www1.eere.energy.gov/manufacturing/tech_deployment/pdfs/guide_chp_boiler.pdf.

Second Order Draft (SOD) IPCC WG III AR5
Do Not Cite, Quote or Distribute 83 of 92 Chapter 10 WGIII_AR5_Draft2_Ch10.doc 22 February 2013
Orr J., A. Darby, T. Ibell, M. Evernden, and M. Otlet (2010). Concrete structures using fabric formwork. The Structural Engineer 89, 21–28.
1 2
3 4 5
6 7 8 9
10 11
12 13 14
15 16
17 18 19
20 21 22
23 24 25
26 27 28 29
30 31
32 33 34 35 36
37 38 39
Van Oss H.G., and A.C. Padovani (2002). Cement Manufacture and the Environment: Part I: Chemistry and Technology. Journal of Industrial Ecology 6, 89–105. (DOI: 10.1162/108819802320971650).
Patel M.K., M.L. Neelis, D. Gielen, J.G.J. Olivier, T. Simmons, and J. Theunis (2005). Carbon dioxide emmissions from non energy use of fossil fuels: Summary of key issues and conclusions from the country analyses. Available at: http://igitur‐archive.library.uu.nl/chem/2007‐0320‐200503/UUindex.html.
Peeters P., and G. Dubois (2010). Tourism travel under climate change mitigation constraints. Journal of Transport Geography 18, 447–457. (DOI: 10.1016/j.jtrangeo.2009.09.003).
Peeters P., and M. Landré (2011). The Emerging Global Tourism Geography—An Environmental Sustainability Perspective. Sustainability 4, 42–71. (DOI: 10.3390/su4010042). Available at: http://www.mdpi.com/2071‐1050/4/1/42.
Peters G.P., and E.G. Hertwich (2008). CO2 Embodied in International Trade with Implications for Global Climate Policy. Environ. Sci. Technol. 42, 1401–1407. (DOI: 10.1021/es072023k).
Pettersson K., and S. Harvey (2012). Comparison of black liquor gasification with other pulping biorefinery concepts – Systems analysis of economic performance and CO2 emissions. Energy 37, 136–153. (DOI: 10.1016/j.energy.2011.10.020).
Pinegar H.K., M.S. Moats, and H.Y. Sohn (2011). Process Simulation and Economic Feasibility Analysis for a Hydrogen‐Based Novel Suspension Ironmaking Technology. Steel Research International 82, 951–963. (DOI: 10.1002/srin.201000288).
Prantl R., M. Tesar, M. Huber‐Humer, and P. Lechner (2006). Changes in carbon and nitrogen pool during in‐situ aeration of old landfills under varying conditions. Waste Management 26, 373–380. (DOI: 10.1016/j.wasman.2005.11.010).
Price L., M.D. Levine, N. Zhou, D. Fridley, N. Aden, H. Lu, M. McNeil, N. Zheng, Y. Qin, and P. Yowargana (2011). Assessment of China’s energy‐saving and emission‐reduction accomplishments and opportunities during the 11th Five Year Plan. Energy Policy 39, 2165–2178. (DOI: 10.1016/j.enpol.2011.02.006).
Price L., and H. Lu (2011). Industrial Energy Auditing and Assessments: A Survey of Programs Around the World. Presq’ile, France. 2011, .
Price L., and A.T. McKane (2009). Policies and Measures to realise Industrial Energy Efficiency and mitigate Climate Change. UN‐Energy Energy Efficiency Cluster. Available at: http://www.unido.org/fileadmin/user_media/Services/Energy_and_Climate_Change/EPU/UN%20Energy%202009%20Policies%20and%20Measures%20to%20realise%20Industrial%20Energy%20Efficiency%20and%20mitigate%20Climate%20Change_small.pdf.
Price L., S. de la Rue du Can, and H. Lu (2010). Evaluation of Efficiency Activities in the Industrial Sector Undertaken in Response to Greenhouse Gas Emission Reduction Targets,. Lawrence Berkeley National Laboratory. Available at: http://china.lbl.gov/sites/china.lbl.gov/files/LBNL‐3551E.pdf.
Second Order Draft (SOD) IPCC WG III AR5
Do Not Cite, Quote or Distribute 84 of 92 Chapter 10 WGIII_AR5_Draft2_Ch10.doc 22 February 2013
Raaz V., and U. Mentges (2009). Comparison of Energy Efficiency and CO2 Emissions for Trucks Haulage versus In‐Pit Crushing and Conveying of Materials: Calculation, Methods and Case Studies. ThyssenKrupp Fördertechnik GmbH, Essen, Germany. Available at: http://mine‐planning.com/Homepage/publications_documents/Energy%20Efficiency%20&%20CO2%20Emissions%20in%20Open%20Pit%20Mines%202011%20SME%20Anual%20Meeting.pdf.
1 2 3 4 5
6 7 8 9
10 11
12 13 14
15 16
17 18
19 20 21
22 23 24
25 26 27
28 29
30
31 32 33
34 35
36 37 38
Rathmann B. (2007). Retrofit of an Electric Shovel or Dragline ‐ a cost saving alternative between frequent repairs and the purchase of a new machine,. Denver, CO. 25‐February‐2007, .Available at: http://www05.abb.com/global/scot/scot244.nsf/veritydisplay/e4d71de93711bdcac12576730045d8eb/$file/sme%202007%20refit%20of%20an%20electric%20shovel.pdf.
Räthzel N., and D. Uzzell (2012). Trade Unions in the Green Economy: Working for the Environment. Routledge, New York, 288 pp., (ISBN: 978‐1‐84971‐464‐8).
Reddy B.S., and B.K. Ray (2010). Decomposition of energy consumption and energy intensity in Indian manufacturing industries. Energy for Sustainable Development 14, 35–47. (DOI: 10.1016/j.esd.2009.12.001).
Van den Reek, J (1999). Reduction of CO2 emissions by reduction of paper use for publication applications. Universiteit Utrecht, Utrecht, Netherlands.
Reichart I., and R. Hischier (2003). The environmental impact of getting the news: a comparison of on‐line, television, and newspaper information delivery. Journal of Industrial Ecology 6, 185–200.
Reimer R.A., C.S. Slaten, M. Seapan, A. Koch, and V.G. Triner (2000). Adipic Acid Industry ‐ N2O Abatement, Non‐CO2 Gases: Scientific Understanding, Control and Implementation. Kluwer Academic Publishers, 347–358.
Reinaud J., and A. Goldberg (2011). Ten Key Messages for Effective Policy Packages – Sharing Best Practices in Industrial Energy Efficiency Policies. Institute for Industrial Productivity. Available at: http://www.iipnetwork.org/publications#tenkey.
Ren T., and M.K. Patel (2009). Basic petrochemicals from natural gas, coal and biomass: Energy use and CO2 emissions. Resources, Conservation and Recycling 53, 513–528. (DOI: 10.1016/j.resconrec.2009.04.005).
Ren T., M. Patel, and K. Blok (2006). Olefins from conventional and heavy feedstocks: Energy use in steam cracking and alternative processes. Energy 31, 425–451. (DOI: 10.1016/j.energy.2005.04.001).
Resnick Institute (2011). Critical Materials For Sustainable Energy Applications.
Rezessy S., and P. Bertoldi (2011). Voluntary agreements in the field of energy efficiency and emission reduction: Review and analysis of experiences in the European Union. Energy Policy 39, 7121–7129. (DOI: 10.1016/j.enpol.2011.08.030).
Rich C., J. Gronow, and N. Voulvoulis (2008). The potential for aeration of MSW landfills to accelerate completion. Waste Management 28, 1039–1048. (DOI: 10.1016/j.wasman.2007.03.022).
Ritzkowski M., K.‐U. Heyer, and R. Stegmann (2006). Fundamental processes and implications during in situ aeration of old landfills. Waste management (New York, N.Y.) 26, 356–372. (DOI: 10.1016/j.wasman.2005.11.009).

Second Order Draft (SOD) IPCC WG III AR5
Do Not Cite, Quote or Distribute 85 of 92 Chapter 10 WGIII_AR5_Draft2_Ch10.doc 22 February 2013
Ritzkowski, and R. Stegmann (2010). Generating CO(2)‐credits through landfill in situ aeration. Waste management New York NY 30, 702–706.
1 2
3 4
5 6
7 8
9 10 11
12 13
14 15 16
17 18
19 20 21
22 23 24
25 26 27
28 29 30
31 32 33
34 35 36 37
Rohdin P., P. Thollander, and P. Solding (2007). Barriers to and drivers for energy efficiency in the Swedish foundry industry. Energy Policy 35, 672–677. (DOI: 10.1016/j.enpol.2006.01.010).
Roy J. (2007). De‐Linking Economic Growth From GHG Emissions Through Energy Efficiency Route‐ How far are we in India? Bulletin on Energy Efficiency 7, 52–57.
Roy J. (2010). Iron and steel sectoral approaches to the mitigation of climate change, perform, achieve and trade (PAT) in India. Climate Strategies. Available at: http://www.climatestrategies.org.
Roy J., S. Dasgupta, and D. Chakrabarty (in press). Energy Efficiency: Technology, Behaviour and Development. In: The Handbook of Global Energy Policy, ed Andreas Golthau. Wiley‐Blackwell, (ISBN: 978‐0‐470‐67264‐8).
Roy J., and S. Pal (2009). Lifestyles and climate change: link awaiting activation. Current Opinion in Environmental Sustainability 1, 192–200. (DOI: 10.1016/j.cosust.2009.10.009).
Roy J., A.H. Sanstad, J.A. Sathaye, and R. Khaddaria (2006). Substitution and price elasticity estimates using inter‐country pooled data in a translog cost model. Energy Economics 28, 706–719. (DOI: 10.1016/j.eneco.2006.05.008).
Saidur R. (2010). A review on electrical motors energy use and energy savings. Renewable and Sustainable Energy Reviews 14, 877–898. (DOI: 10.1016/j.rser.2009.10.018).
Sano F., K. Akimoto, and K. Wada (2013). Impacts of different scenarios for mitigation technology options and of model representations regarding renewables intermittency on evaluations of CO2 emissions reductions. Climatic Change (Submitted for the Special Issue).
Sano F., K. Wada, and K. Akimoto (2013). Decomposition Analysis of GHG Emission Reduction Scenarios with a Technology‐Rich Energy Systems Model with High Consistency across Sectors. , (will be submitted for a special issue by the end of January).
Sanstad A.H., J. Roy, and J.A. Sathaye (2006). Estimating energy‐augmenting technological change in developing country industries. Energy Economics 28, 720–729. (DOI: 10.1016/j.eneco.2006.07.005).
Sathaye J., J. Roy, R. Khaddaria, and S. Das (2006). Reducing electricity deficit through energy efficiency in India: An evaluation of macroeconomic benefits. Lawrence Berkeley National Laboratory, Berkeley, CA.
Sathaye J., T. Xu, and C. Galitsky (2011). Bottom‐up Representation of Industrial Energy Efficiency Technologies in Integrated Assessment Models for the Cement Sector. Lawrence Berkeley National Laboratory. Available at: http://www.escholarship.org/uc/item/0xt5x113.
Saygin D., M.K. Patel, C. Tam, and D.J. Gielen (2009). Chemical and petrochemical sector ‐ Potential of best practice technology and other measures for improving energy effiency. IEA ‐ International Energy Agency, Paris, France. Available at: http://www.iea.org/textbase/papers/2009/chemical_petrochemical_sector.p df.
Second Order Draft (SOD) IPCC WG III AR5
Do Not Cite, Quote or Distribute 86 of 92 Chapter 10 WGIII_AR5_Draft2_Ch10.doc 22 February 2013
Saygin D., M.K. Patel, E. Worrell, C. Tam, and D.J. Gielen (2011). Potential of best practice technology to improve energy efficiency in the global chemical and petrochemical sector. Energy 36, 5779–5790. (DOI: 10.1016/j.energy.2011.05.019).
1 2 3
4 5 6
7 8 9
10 11
12 13
14 15
16 17
18 19 20 21
22 23 24
25 26
27 28
29 30
31 32
33 34
35 36 37
Saygin D., E. Worrell, M.K. Patel, and D.J. Gielen (2011a). Benchmarking the energy use of energy‐intensive industries in industrialized and in developing countries. Energy 36, 6661–6673. (DOI: 10.1016/j.energy.2011.08.025).
Saygin D., E. Worrell, M.K. Patel, and D.J. Gielen (2011b). Benchmarking the energy use of energy‐intensive industries in industrialized and in developing countries. Energy 36, 6661–6673. (DOI: 10.1016/j.energy.2011.08.025).
Schäfer A. (2005). Structural change in energy use. Energy Policy 33, 429–437. (DOI: 10.1016/j.enpol.2003.09.002).
Schleich J. (2004). Do energy audits help reduce barriers to energy efficiency? An empirical analysis for Germany. International Journal Energy Technology and Policy 2, 226–239.
Schleich J., and E. Gruber (2008). Beyond case studies: Barriers to energy efficiency in commerce and the services sector. Energy Economics 30, 449–464. (DOI: 10.1016/j.eneco.2006.08.004).
Schmitz H. (1995). Collective efficiency: Growth path for small‐scale industry. Journal of Development Studies 31, 529–566. (DOI: 10.1080/00220389508422377).
Scholl G., L. Schulz, L. Süßbauer, and S. Otto (2010). Nutzen statt Besitzen – Perspektiven für ressourceneffizienten Konsum durch innovative Dienstleistungen. Wuppertal Institute for Climate, the Environment and Energy, Wuppertal. Available at: http://epub.wupperinst.org/frontdoor/index/index/docId/4336.
Scott D., P. Peeters, and S. Gössling (2010). Can tourism deliver its “aspirational” greenhouse gas emission reduction targets? Journal of Sustainable Tourism 18, 393–408. (DOI: 10.1080/09669581003653542).
Sengenberger W., and F. Pyke (1992). Industrial districts and Local Economic Regeneration. International Institute for Labour Studies, Geneva.
Shen B., L. Price, and H. Lu (2012). Energy audit practices in China: National and local experiences and issues. Energy Policy 46, 346–358. (DOI: 10.1016/j.enpol.2012.03.069).
Shipley A., A. Hampson, B. Hedman, P. Garland, and P. Bautista (2008). Combined Heat and Power: Effective Energy Solutions for a Sustainable Future. Oak Ridge National Laboratory, Oak Ridge.
SI (2012). Supply and Demand Silver supply. The Silver Institute. Available at: http://www.silverinstitute.org/site/supply‐demand/silver‐supply/.
Siitonen S., M. Tuomaala, and P. Ahtila (2010). Variables affecting energy efficiency and CO2 emissions in the steel industry. Energy Policy 38, 2477–2485. (DOI: 10.1016/j.enpol.2009.12.042).
Sim S., M. Barry, R. Clift, and S. Cowell (2007). The relative importance of transport in determining an appropriate sustainability strategy for food sourcing. The International Journal of Life Cycle Assessment 12, 422–431. (DOI: 10.1065/lca2006.07.259).

Second Order Draft (SOD) IPCC WG III AR5
Do Not Cite, Quote or Distribute 87 of 92 Chapter 10 WGIII_AR5_Draft2_Ch10.doc 22 February 2013
Sjardin M. (2003). CO2 emission factors for non‐energy use in the non‐ferrous metal, ferroalloys and inorganics industry. Copernicus Institute, Utrecht, 63.
1 2
3 4
5 6
7 8
9 10 11 12 13
14 15
16 17 18 19
20 21
22 23
24 25
26 27
28 29 30
31 32 33
34 35 36
37 38 39
Skelton, A.C.H., and J.M. Allwood (under review). The incentives for material efficiency along the steel sector supply chain: an analysis using input‐output techniques. Ecological Economics.
Skelton, A.C.H., and Allwood, J.M. (under review). Product‐life trade‐offs: what if products fail early? Environmental Science and Technology.
Smith H.M. (2012). The Mining Sector ‐ Energy Efficiency Best Practice Guide for the Australian Federal and State Government Energy Efficiency Exchange. Available at: www.eex.gov.au.
Smith P., D. Martino, Z. Cai, D. Gwary, H. Janzen, P. Kumar, B. McCarl, S. Ogle, F. O’Mara, C. Rice, B. Scholes, O. Sirotenko, M. Howden, T. McAllister, G. Pan, V. Romanenkov, U. Schneider, S. Towprayoon, M. Wattenbach, and J. Smith (2008). Greenhouse Gas Mitigation in Agriculture. Philosophical Transactions of the Royal Society B: Biological Sciences 363, 789–813. (DOI: 10.1098/rstb.2007.2184).
Spokas K.A., and J.E. Bogner (2011). Limits and dynamics of methane oxidation in landfill cover soils. Waste Management 31, 823–832. (DOI: 10.1016/j.wasman.2009.12.018).
Spokas K., J. Bogner, and J. Chanton (2011). A process‐based inventory model for landfill CH4 emissions inclusive of seasonal soil microclimate and CH4 oxidation. Journal of Geophysical Research: Biogeosciences 116. (DOI: 10.1029/2011JG001741). Available at: http://onlinelibrary.wiley.com/doi/10.1029/2011JG001741/abstract.
Stehfest E., L. Bouwman, D. van Vuuren, M. den Elzen, B. Eickhout, and P. Kabat (2009). Climate benefits of changing diet. Climatic Change 95, 83–102. (DOI: 10.1007/s10584‐008‐9534‐6).
Stenqvist C., and L. Nilsson (2012). Energy efficiency in energy‐intensive industries ‐ an evaluation of the Swedish voluntary agreement PFE. Energy Efficiency 5, 225–241.
Sun J.W. (1998). Changes in energy consumption and energy intensity: A complete decomposition model. Energy Economics 20, 85–100. (DOI: 10.1016/S0140‐9883(97)00012‐1).
Swaminathan B., and K.E. Sukalac (2004). Technology transfer and mitigation of climate change: The fertilizer industry perspective. Tokyo, Japan. 21‐September‐2004, .
SWEEP (2011). Southwest Energy Efficiency Project. Energy Efficiency Guide for Colorado Businesses‐ Recommendations by Sector: Mining. Available at: http://www.coloradoefficiencyguide.com/recommendations/mining.htm.
SWITCH‐Asia Network Facility (2009). A key solution to climate change: Sustainable consumption and production. Making the link. 23 pp. Available at: http://ec.europa.eu/europeaid/infopoint/publications/europeaid/documents/160a_en.pdf.
Taibi E., D. Gielen, and M. Bazilian The potential for renewable energy in industrial applications. Renewable and Sustainable Energy Reviews. (DOI: 10.1016/j.rser.2011.08.039). Available at: http://www.sciencedirect.com/science/article/pii/S1364032111004497.
Takeda K., T. Anyashiki, T. Sato, N. Oyama, S. Watakabe, and M. Sato (2011). Recent Developments and Mid‐ and Long‐Term CO2 Mitigation Projects in Ironmaking. Steel Research International 82, 512–520. (DOI: 10.1002/srin.201100034).
Second Order Draft (SOD) IPCC WG III AR5
Do Not Cite, Quote or Distribute 88 of 92 Chapter 10 WGIII_AR5_Draft2_Ch10.doc 22 February 2013
Tanaka K. (2008). Assessment of energy efficiency performance measures in industry and their application for policy. Energy Policy 36, 2887–2902. (DOI: 10.1016/j.enpol.2008.03.032).
1 2
3 4
5 6 7
8 9
10
11 12 13
14 15
16 17
18 19
20 21 22
23 24
25 26
27 28 29 30
31 32 33
34 35 36 37
Tanaka K. (2011). Review of policies and measures for energy efficiency in industry sector. Energy Policy 39, 6532–6550. (DOI: 10.1016/j.enpol.2011.07.058).
Tanaka K. (2012). A comparison study of EU and Japan methods to assess CO2 emission reduction and energy saving in the iron and steel industry. Energy Policy 51, 578–585. (DOI: 10.1016/j.enpol.2012.08.075).
TEC, and DEEE (2008). Déplacements touristiques des Français�: hyper concentration des comportements les plus émetteurs de gaz à effet de serre. Minstère de l’écologie, TEC (?) and Direction des études et de l’évaluation Environnementale, Paris, 4 pp.
Tekkaya A.E., M. Schikorra, D. Becker, D. Biermann, N. Hammer, and K. Pantke (2009). Hot profile extrusion of AA‐6060 aluminum chips. Journal of Materials Processing Technology 209, 3343–3350. (DOI: 10.1016/j.jmatprotec.2008.07.047).
Themelis N.J. (2007). Introduction to waste‐to‐energy. Encyclopedia of Sustainability of Science and Technology 17, 11828–11838.
Themelis N.J., M.J. Castaldi, J. Bhatti, and L. Arsova (2011). Energy and economic value of non‐recycled plastics. American Chemistry Council.
Themelis N.J., and P.A. Ulloa (2007). Methane generation in landfills. Renewable Energy 32, 1243–1257. (DOI: 10.1016/j.renene.2006.04.020).
Timilsina G.R. (2009). Carbon tax under the Clean Development Mechanism: a unique approach for reducing greenhouse gas emissions in developing countries. Climate Policy 9, 139–154. (DOI: 10.3763/cpol.2008.0546).
Transatlantic Academy (2012). The global resource nexus: The struggles for land, energy, food, water, and materials. Transatlantic Academy, Washington DC, USA.
UNCTAD (2008). World investment report 2008. Transnational corporations, and the infrastructure challenge. United Nations, 294 pp., (ISBN: 9789211127553).
UNCTAD (2011). The least developed countries report 2011: the potential role of South‐South cooperation for inclusive and sustainable development. United Nations Conference on Trade and Development (UNCTAD), New York, 166 pp., (ISBN: 9789210551564). Available at: www.unctad.org/en/docs/ldc2011_en.pdf.
UNEP (2010). 2010 Assessment Report of the Technology and Economic Assessment Panel. UNEP (Montreal Protocol on Substances that Deplete the Ozone Layer). Available at: http://ozone.unep.org/teap/Reports/TEAP_Reports/TEAP‐Assessment‐report‐2010.pdf.
UNFCCC SBASTA (2009). Second synthesis report on technology needs identified by Parties not included in Annex I to the Convention. Subsidiary Body for Scientific and Technological Advice, United Nations Framework Convention on Climate Change, Bonn. Available at: http://unfccc.int/resource/docs/2009/sbsta/eng/inf01.pdf.
Second Order Draft (SOD) IPCC WG III AR5
Do Not Cite, Quote or Distribute 89 of 92 Chapter 10 WGIII_AR5_Draft2_Ch10.doc 22 February 2013
UNIDO U.N.I.D.O. (2009). Industrial Development Report 2009: Breaking In and Moving Up ‐ New Industrial Challenges for the Bottom Billion and the Middle‐Income Countries. United Nations Publications, 161 pp., (ISBN: 9789211064452).
1 2 3
4 5 6
7 8
9 10 11 12
13 14 15 16
17 18 19
20 21 22
23 24
25 26
27 28
29 30 31
32 33
34 35 36
37 38
UNIDO (2012). Industrial Development Report 2011 Industrial Energy Efficiency for Sustainable Wealth Creation: Capturing Environmental, Economic and Social Dividends. United Nations Pubns, (ISBN: 9789211064483 9211064481).
UNWTO, UNEP, and WMO (2008). Climate change and tourism: responding to global challenges. UNEP/Earthprint, 276 pp., (ISBN: 9789284412341).
US DoE (2004a). Waste Heat Reduction and Recovery for Improving Furnace Efficiency Productivity and Emissions Performance. A Best Practices Process Heating Technical Brief. US Department of Energy, Washington, D.C., USA. Available at: http://www1.eere.energy.gov/manufacturing/tech_deployment/pdfs/35876.pdf.
US DoE (2004b). Energy Use, Loss and Opportunities Analysis: U.S. Manufacturing & Mining. US Department of Energy, Washington, D.C., USA. Available at: https://www.eecbg.energy.gov/industry/intensiveprocesses/pdfs/energy_use_loss_opportunities_analysis.pdf.
US DoE (2007). Mining Industry Energy Bandwith Study. International Industrial Program ‐ US Department of Energy, Washington, D.C., USA. Available at: http://www1.eere.energy.gov/industry/mining/pdfs/mining_bandwidth.pdf.
US DoE (2008). Waste Heat Recovery: Technology and Opportunities in U.S. Industry. US Department of Energy, Washington, D.C., USA. Available at: http://www1.eere.energy.gov/manufacturing/intensiveprocesses/pdfs/waste_heat_recovery.pdf.
US EIA (2009). Manufacturing Energy Consumption Survey. Washington, D.C., USA. Available at: http://38.96.246.204/emeu/mecs/contents.html.
US EIA (2010). International Energy Outlook 2010. Washington, D.C., USA. Available at: http://www.eia.gov/oiaf/ieo/index.html.
USGS (2012). Historical Statistics for Mineral and Material Commodities in the United States ‐ United States Geological Survey. Available at: http://minerals.usgs.gov/ds/2005/140/.
Valerio F. (2010). Environmental impacts of post‐consumer material managements: Recycling, biological treatments, incineration. Waste Management 30, 2354–2361. (DOI: 10.1016/j.wasman.2010.05.014).
Vattenfall (2007). Global Mapping of Greenhouse Gas Abatement Opportunities up to 2030 Industry sector deep‐dive.
Velavan R., R. Rudramoorthy, and S. Balachandran (2009). CO2 Emission reduction opportunities for small and medium scale textile sector in India. Journal of scientific and industrial research 68, 630–633.
Verhoef E.V., G.P.J. Dijkema, and M.A. Reuter (2004). Process Knowledge, System Dynamics, and Metal Ecology. Journal of Industrial Ecology 8, 23–43. (DOI: 10.1162/1088198041269382).

Second Order Draft (SOD) IPCC WG III AR5
Do Not Cite, Quote or Distribute 90 of 92 Chapter 10 WGIII_AR5_Draft2_Ch10.doc 22 February 2013
Wang X. (2008). Policy Research on Alternative Fuels for Cement Industry in China. Institute of Technical Information for the Building Materials Industry of China, Beijing, China.
1 2
3 4 5
6 7 8 9
10 11
12 13 14
15 16
17 18 19
20 21
22 23
24 25 26
27 28
29 30 31 32
33 34 35
36 37
38 39
Wang D., A.J. Gmitter, and D.R. Sadoway (2011). Production of Oxygen Gas and Liquid Metal by Electrochemical Decomposition of Molten Iron Oxide. Journal of The Electrochemical Society 158, E51. (DOI: 10.1149/1.3560477).
Wang X., J. Liu, N.‐Q. Ren, and Z. Duan (2012). Environmental profile of typical anaerobic/anoxic/oxic wastewater treatment systems meeting increasingly stringent treatment standards from a life cycle perspective. Bioresource Technology 126, 31–40. (DOI: 10.1016/j.biortech.2012.09.009).
Wang T., and T. Watson (2007). Who Owns China’s Carbon Emissions? Tyndall Centre. Available at: http://www.tyndall.ac.uk/content/who‐owns‐chinas‐carbon‐emissions.
WB (2007). Towards Sustainable Mineral‐Intensive Growth in Orissa�: Managing Environmental and Social Impacts. World Bank. Available at: https://openknowledge.worldbank.org/handle/10986/7657.
WB (2012). World Bank Data. Available at: http://data.worldbank.org/topic/economic‐policy‐and‐external‐debt.
WBCSD (2011). Cement Sustainability Initiative: Global Cement Database on CO2 and Energy Information. World Business Council for Sustainable Development. Available at: http://www.wbcsdcement.org/index.php?option=com_content&task=view&id=57&Itemid=118.
Weber C.L., G.P. Peters, D. Guan, and K. Hubacek (2008). The contribution of Chinese exports to climate change. Energy Policy 36, 3572–3577. (DOI: 10.1016/j.enpol.2008.06.009).
WGC W.G.C. (2011). Gold demand trends. Full year 2011. Available at: http://www.gold.org/media/publications/.
Woods J., A. Williams, J.K. Hughes, M. Black, and R. Murphy (2010). Energy and the Food System. Philosophical Transactions of the Royal Society B: Biological Sciences 365, 2991–3006. (DOI: 10.1098/rstb.2010.0172).
Worrell E., L. Bernstein, J. Roy, L. Price, and J. Harnisch (2009). Industrial energy efficiency and climate change mitigation. Energy Efficiency 2, 109–123. (DOI: 10.1007/s12053‐008‐9032‐8).
Worrell E., and C. Galitsky (2008). Energy Efficiency Improvement and Cost Saving Opportunities for Cement Making. An ENERGY STAR Guide for Energy and Plant Managers. Lawrence Berkeley National Laboratory, Berkeley, CA. Available at: http://china.lbl.gov/publications/energy‐efficiency‐improvement‐and‐cost‐saving‐opportunities‐cement‐making.
Worrell E., C. Galitsky, and L. Price (2008). Energy Efficiency Improvement Opportunities for the Cement Industry. Lawrence Berkeley National Laboratory, Berkeley, CA. Available at: http://china.lbl.gov/sites/china.lbl.gov/files/CementEEMs.Compilation.English.pdf.
Worrell E., J.A. Laitner, M. Ruth, and H. Finman (2003). Productivity benefits of industrial energy efficiency measures. Energy 28, 1081–1098. (DOI: 10.1016/S0360‐5442(03)00091‐4).
Worrell E., L. Price, M. Neelis, C. Galitsky, and N. Zhou (2008). World Best Practice Energy Intensity Values for Selected Industrial Sectors. Lawrence Berkeley National Laboratory, Berkeley, CA.
Second Order Draft (SOD) IPCC WG III AR5
Do Not Cite, Quote or Distribute 91 of 92 Chapter 10 WGIII_AR5_Draft2_Ch10.doc 22 February 2013
Available at: http://china.lbl.gov/sites/china.lbl.gov/files/LBNL62806.World_Best_Practice.Feb2008.pdf.
1 2
3 4 5
6 7 8
9 10
11 12 13
14 15 16
17 18
19 20
21 22
23 24 25
26 27 28
29 30 31
32 33
34 35 36
37 38
Worrell, E, P. Blinde, M. Neelis, E. Blomen, and E. Masanet (2010). Energy efficiency improvement and cost saving opportunities for the U.S. iron and steel industry. Ernest Orlando Lawrence Berkeley National Laboratory.
WSA (2011). Steel’s contribution to a low carbon future ‐ Position paper. World Steel Association. Available at: http://www.worldsteel.org/publications/position‐papers/Steel‐s‐contribution‐to‐a‐low‐carbon‐future.html.
WSA (2012a). World Steel Association, statistics archive. Available at: http://www.worldsteel.org/statistics/statistics‐archive.html.
WSA (2012b). Crude steel production 2011. World Steel Association. Available at: http://www.worldsteel.org/dms/internetDocumentList/steel‐stats/2011/Crude‐steel‐production‐2011/document/2011%20steel%20updated%20Feb2012.pdf.
Wu S., Z. Ji, S. Rong, M. Hu, and T. Zhang Microstructure and mechanical properties of AZ31B magnesium alloy prepared by solid‐state recycling process from chips. Transactions of Nonferrous Metals Society of China 20, 783–788.
Xu T., and J. Flapper (2009). Energy use and implications for efficiency strategies in global fluid‐milk processing industry. Energy Policy 37, 5334–5341. (DOI: 10.1016/j.enpol.2009.07.056).
Xu T., and J. Flapper (2011). Reduce energy use and greenhouse gas emissions from global dairy processing facilities. Energy Policy 39, 234–247. (DOI: 10.1016/j.enpol.2010.09.037).
Xu T., J. Flapper, and K.J. Kramer (2009). Characterization of energy use and performance of global cheese processing. Energy 34, 1993–2000. (DOI: 10.1016/j.energy.2009.08.014).
Xu T., J. Sathaye, and C. Galitsky (2011). Development of Bottom‐up Representation of Industrial Energy Efficiency Technologies in Integrated Assessment Models for the Iron and Steel Sector. Lawrence Berkeley National Laboratory. Available at: http://escholarship.org/uc/item/8n82s7j3.
Xu T., J.W. Slaa, and J. Sathaye (2011). Developing Information on Energy Savings and Associated Costs and Benefits of Energy Efficient Emerging Technologies Applicable in California. Available at: http://escholarship.org/uc/item/38v358h9.
Yamaguchi M. (2012). Climate Change Mitigation. [Yamaguchi Mitsusune ed.]. Springer, 262 pp., (ISBN: ISBN 978‐1‐4471‐4227‐0). Available at: http://www.springer.com/engineering/energy+technology/book/978‐1‐4471‐4227‐0.
Yara (2012). Environmental efforts. Available at: http://www.yara.com/sustainability/health_environment_safety/environmental_efforts/index.aspx.
Yeo D., and R.D. Gabbai (2011). Sustainable design of reinforced concrete structures through embodied energy optimization. Energy and Buildings 43, 2028–2033. (DOI: 10.1016/j.enbuild.2011.04.014).
Zafeiris T. (2010). Global CO2 abatement potential in the pulp and paper industry up to 2030. Utrecht University.

Second Order Draft (SOD) IPCC WG III AR5
Do Not Cite, Quote or Distribute 92 of 92 Chapter 10 WGIII_AR5_Draft2_Ch10.doc 22 February 2013
1 2
Zhang J., and G. Wang (2008). Energy saving technologies and productive efficiency in the Chinese iron and steel sector. Energy 33, 525–537. (DOI: 10.1016/j.energy.2007.11.002).


