Chapter 10Natural Environment:How Big is Our Footprint?
0
42
84
126
168
210
252
294
336
378
420
1980 1990 1995 2000
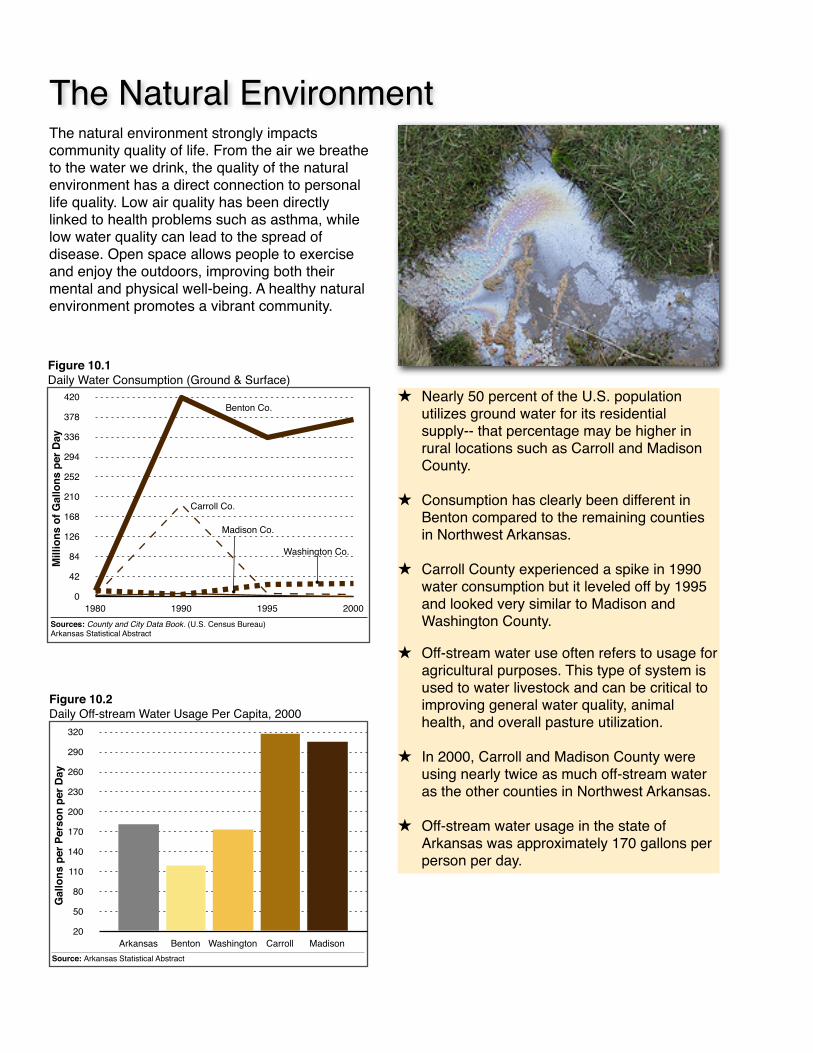
Figure 10.1Daily Water Consumption (Ground & Surface)
Sources: County and City Data Book. (U.S. Census Bureau)Arkansas Statistical Abstract
Washington Co.
Benton Co.
Carroll Co.
Mill
ions
of G
allo
ns p
er D
ay
Madison Co.
20
50
80
110
140
170
200
230
260
290
320
Arkansas Benton Washington Carroll Madison
Gal
lons
per
Per
son
per D
ay
Source: Arkansas Statistical Abstract
Figure 10.2Daily Off-stream Water Usage Per Capita, 2000
★ Nearly 50 percent of the U.S. population utilizes ground water for its residential supply-- that percentage may be higher in rural locations such as Carroll and Madison County.
★ Consumption has clearly been different in Benton compared to the remaining counties in Northwest Arkansas.
★ Carroll County experienced a spike in 1990 water consumption but it leveled off by 1995 and looked very similar to Madison and Washington County.
★ Off-stream water use often refers to usage for agricultural purposes. This type of system is used to water livestock and can be critical to improving general water quality, animal health, and overall pasture utilization.
★ In 2000, Carroll and Madison County were using nearly twice as much off-stream water as the other counties in Northwest Arkansas.
★ Off-stream water usage in the state of Arkansas was approximately 170 gallons per person per day.
The natural environment strongly impacts community quality of life. From the air we breathe to the water we drink, the quality of the natural environment has a direct connection to personal life quality. Low air quality has been directly linked to health problems such as asthma, while low water quality can lead to the spread of disease. Open space allows people to exercise and enjoy the outdoors, improving both their mental and physical well-being. A healthy natural environment promotes a vibrant community.
The Natural Environment
0
120
240
360
480
600
720
840
960
1,080
1,200
90 95 00 01 02 03 04 05
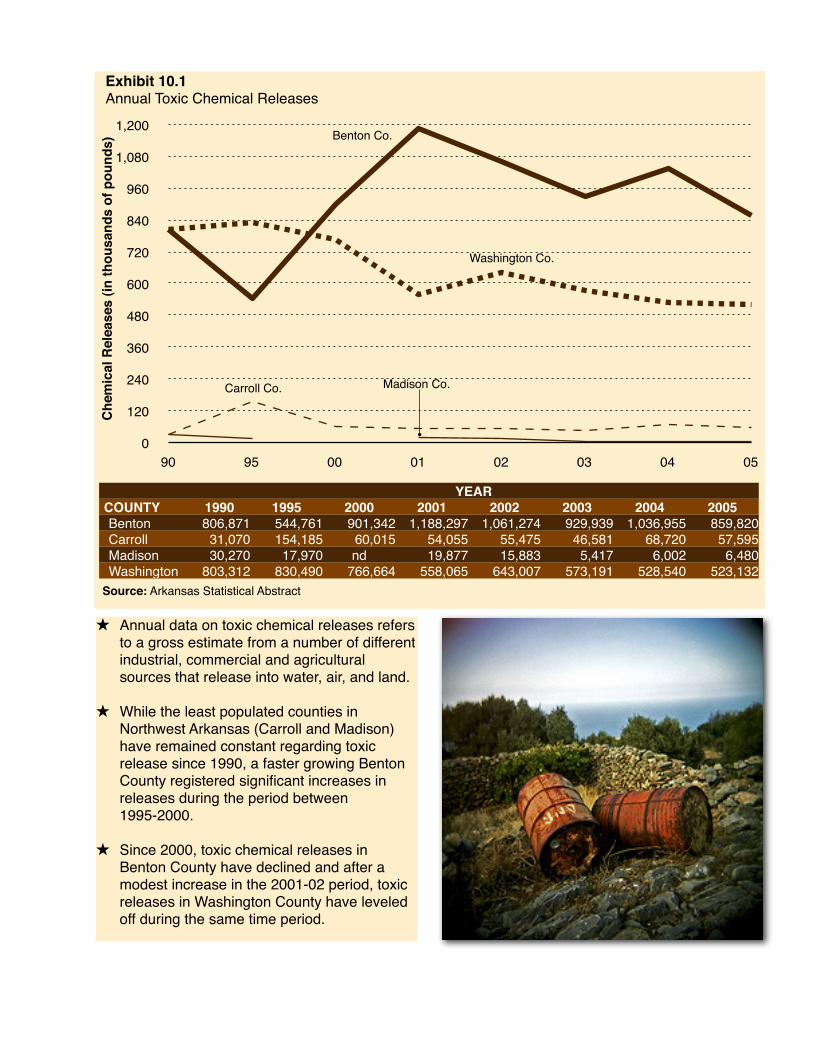
Exhibit 10.1Annual Toxic Chemical Releases
Source: Arkansas Statistical Abstract
Washington Co.
Benton Co.
Carroll Co.
Chem
ical
Rel
ease
s (in
thou
sand
s of
pou
nds)
Madison Co.
YEARCOUNTY 1990 1995 2000 2001 2002 2003 2004 2005Benton 806,871 544,761 901,342 1,188,297 1,061,274 929,939 1,036,955 859,820Carroll 31,070 154,185 60,015 54,055 55,475 46,581 68,720 57,595Madison 30,270 17,970 nd 19,877 15,883 5,417 6,002 6,480Washington 803,312 830,490 766,664 558,065 643,007 573,191 528,540 523,132
★ Annual data on toxic chemical releases refers to a gross estimate from a number of different industrial, commercial and agricultural sources that release into water, air, and land.
★ While the least populated counties in Northwest Arkansas (Carroll and Madison) have remained constant regarding toxic release since 1990, a faster growing Benton County registered significant increases in releases during the period between 1995-2000.
★ Since 2000, toxic chemical releases in Benton County have declined and after a modest increase in the 2001-02 period, toxic releases in Washington County have leveled off during the same time period.
0
35.8
71.6
107.4
143.2
179.0
Benton Washington Carroll Madison
Tota
l Num
ber o
f Fac
ilitie
s
Source: Environmental Protection Agency
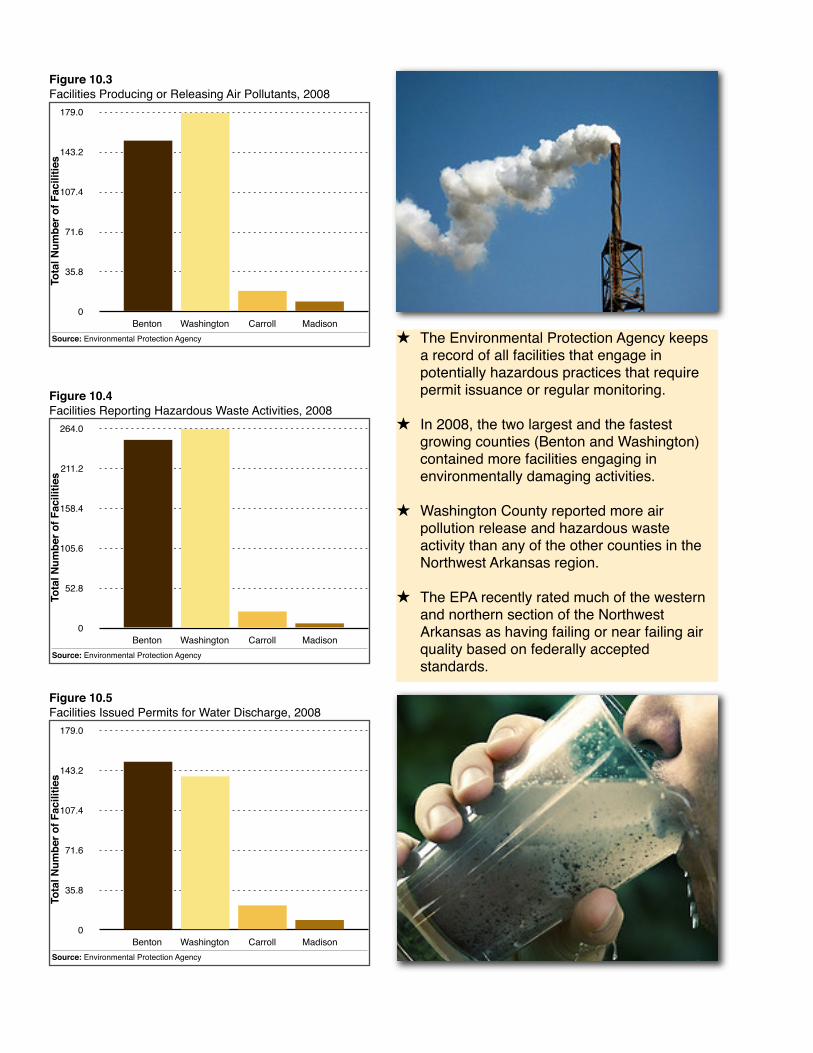
Figure 10.3Facilities Producing or Releasing Air Pollutants, 2008
★ The Environmental Protection Agency keeps a record of all facilities that engage in potentially hazardous practices that require permit issuance or regular monitoring.
★ In 2008, the two largest and the fastest growing counties (Benton and Washington) contained more facilities engaging in environmentally damaging activities.
★ Washington County reported more air pollution release and hazardous waste activity than any of the other counties in the Northwest Arkansas region.
★ The EPA recently rated much of the western and northern section of the Northwest Arkansas as having failing or near failing air quality based on federally accepted standards.
0
52.8
105.6
158.4
211.2
264.0
Benton Washington Carroll Madison
Tota
l Num
ber o
f Fac
ilitie
s
Source: Environmental Protection Agency
Figure 10.4Facilities Reporting Hazardous Waste Activities, 2008
0
35.8
71.6
107.4
143.2
179.0
Benton Washington Carroll Madison
Tota
l Num
ber o
f Fac
ilitie
s
Source: Environmental Protection Agency
Figure 10.5Facilities Issued Permits for Water Discharge, 2008
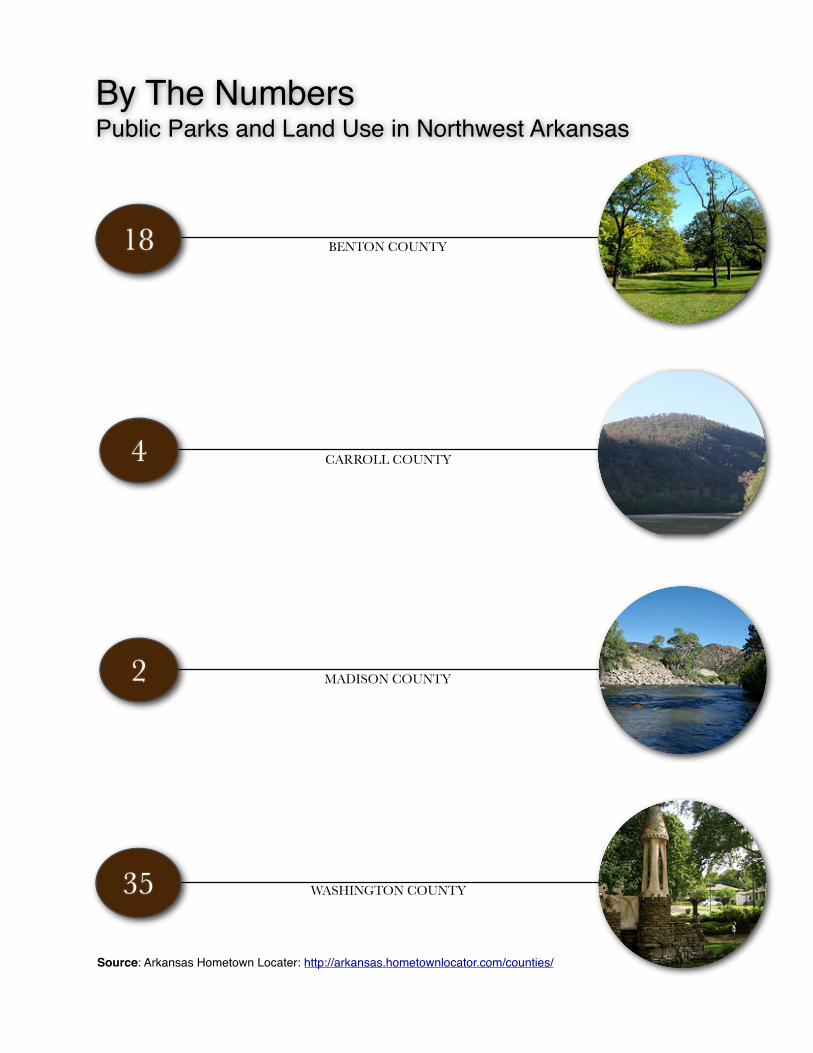
18 BENTON COUNTY
MADISON COUNTY2
WASHINGTON COUNTY35
CARROLL COUNTY4
By The NumbersPublic Parks and Land Use in Northwest Arkansas
Source: Arkansas Hometown Locater: http://arkansas.hometownlocator.com/counties/
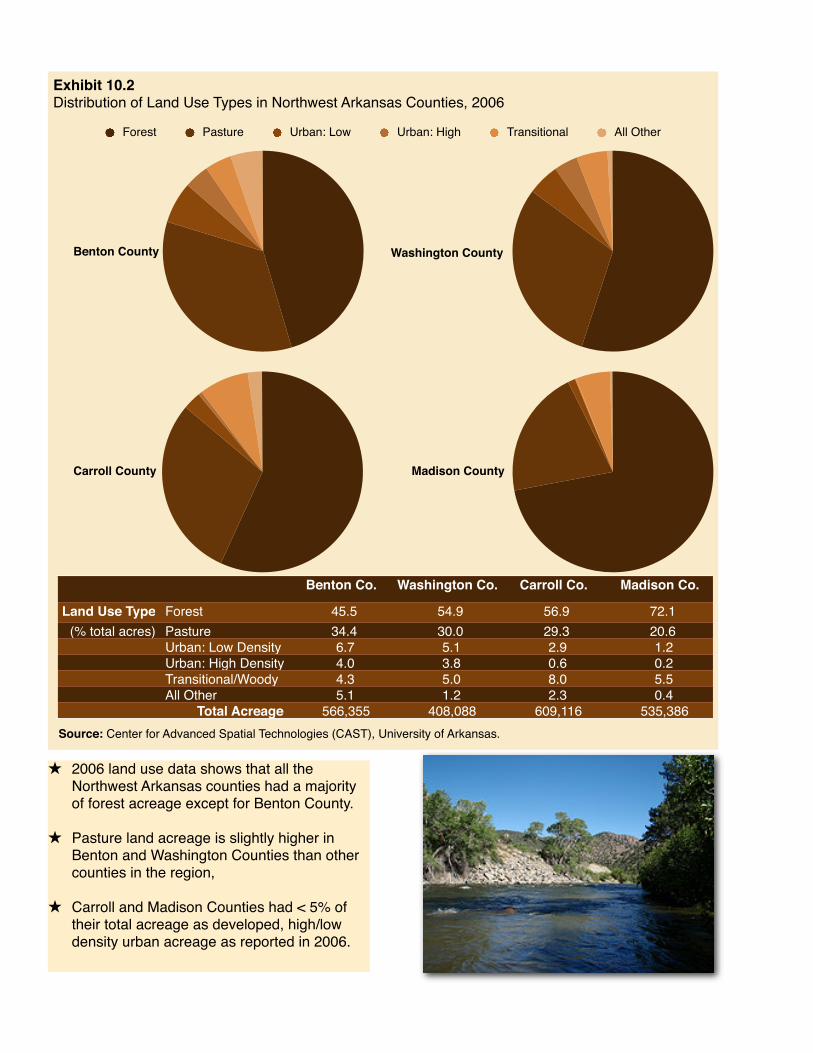
★ 2006 land use data shows that all the Northwest Arkansas counties had a majority of forest acreage except for Benton County.
★ Pasture land acreage is slightly higher in Benton and Washington Counties than other counties in the region,
★ Carroll and Madison Counties had < 5% of their total acreage as developed, high/low density urban acreage as reported in 2006.
Exhibit 10.2Distribution of Land Use Types in Northwest Arkansas Counties, 2006
Forest Pasture Urban: Low Urban: High Transitional All Other
Benton Co. Washington Co. Carroll Co. Madison Co.
Land Use Type Forest 45.5 54.9 56.9 72.1(% total acres) Pasture 34.4 30.0 29.3 20.6
Urban: Low Density 6.7 5.1 2.9 1.2Urban: High Density 4.0 3.8 0.6 0.2Transitional/Woody 4.3 5.0 8.0 5.5All Other 5.1 1.2 2.3 0.4
Total Acreage 566,355 408,088 609,116 535,386
Benton County Washington County
Madison CountyCarroll County
Source: Center for Advanced Spatial Technologies (CAST), University of Arkansas.
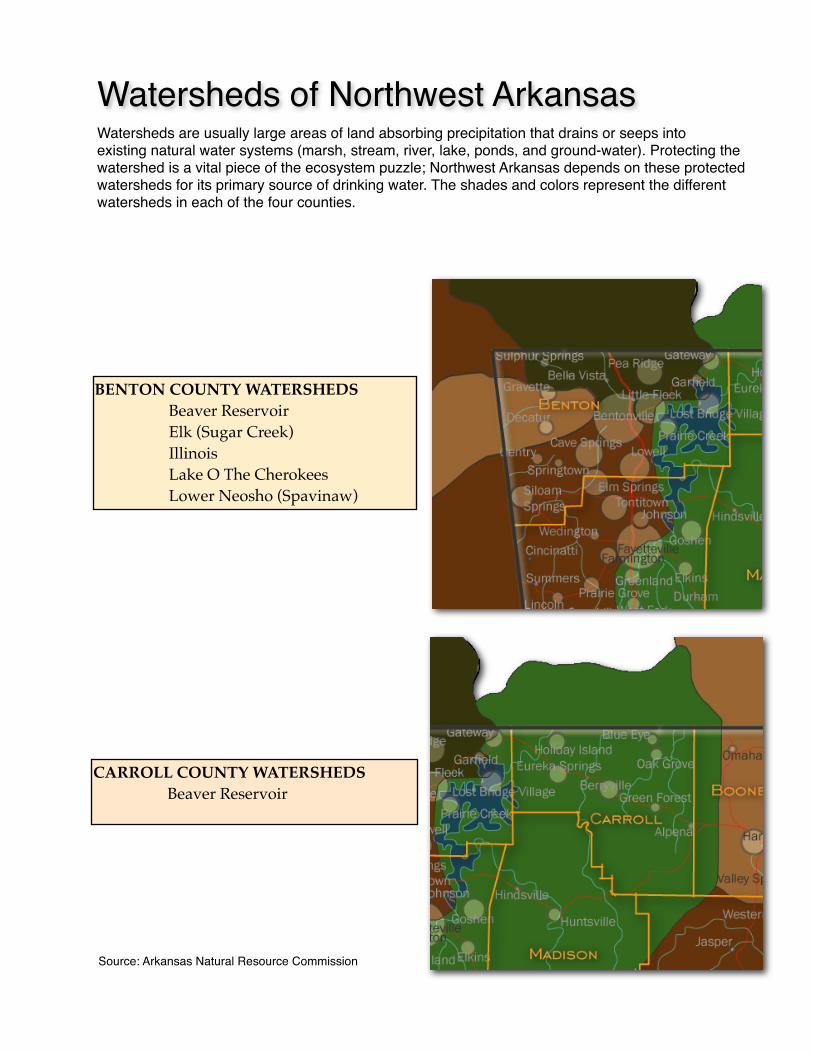
Watersheds of Northwest Arkansas
BENTON COUNTY WATERSHEDS Beaver Reservoir Elk (Sugar Creek) Illinois Lake O The Cherokees Lower Neosho (Spavinaw)
CARROLL COUNTY WATERSHEDS Beaver Reservoir
Watersheds are usually large areas of land absorbing precipitation that drains or seeps into existing natural water systems (marsh, stream, river, lake, ponds, and ground-water). Protecting the watershed is a vital piece of the ecosystem puzzle; Northwest Arkansas depends on these protected watersheds for its primary source of drinking water. The shades and colors represent the different watersheds in each of the four counties.
Source: Arkansas Natural Resource Commission
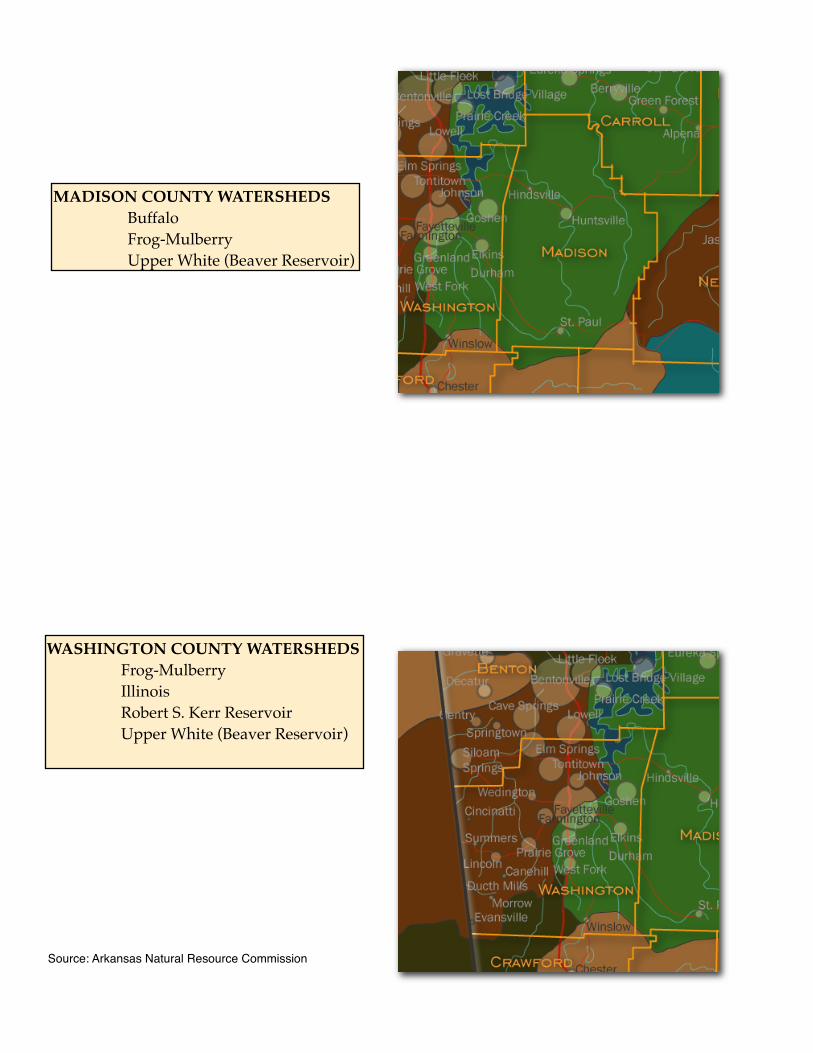
MADISON COUNTY WATERSHEDS Buffalo Frog-Mulberry Upper White (Beaver Reservoir)
WASHINGTON COUNTY WATERSHEDS Frog-Mulberry Illinois Robert S. Kerr Reservoir Upper White (Beaver Reservoir)
Source: Arkansas Natural Resource Commission
20
30
40
50
60
70
80
1990 2000 2006
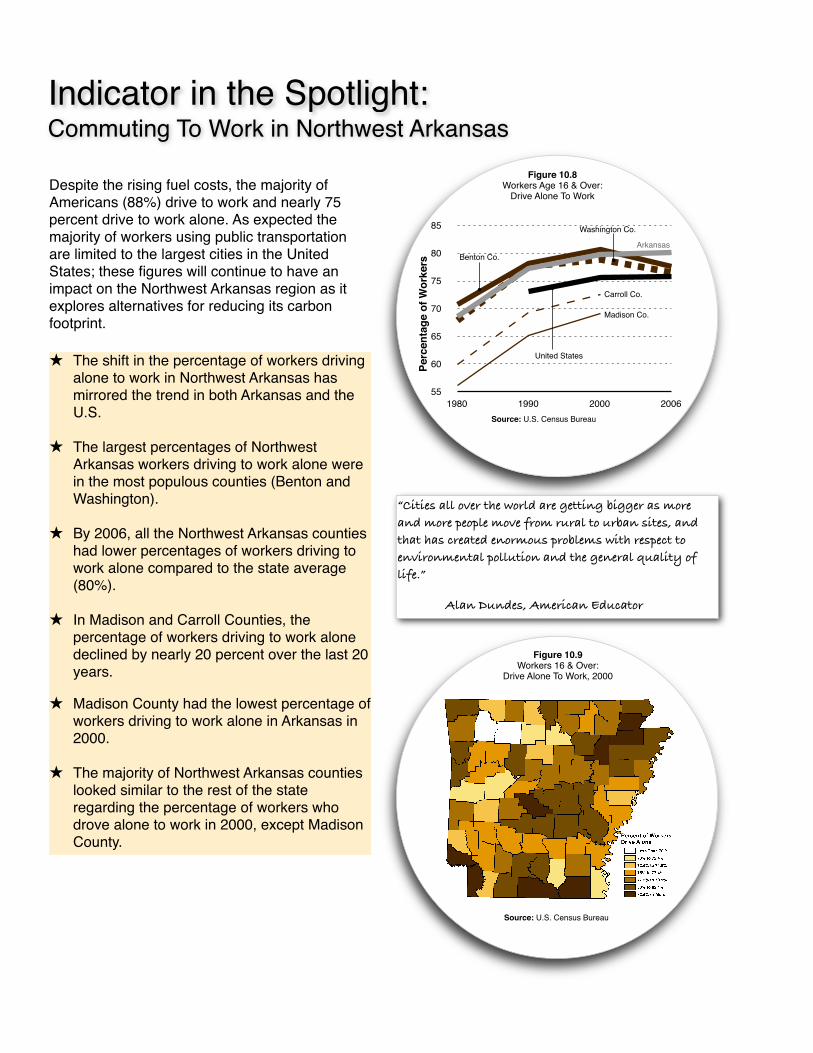
Figure 10.7Percent of Workers: Travel Time Less Than 30 Minutes
Source: U.S. Census Bureau
Bent
on
Perc
ent o
f Wor
kers
16
& O
ver
Was
hing
ton
Carr
oll
Mad
ison
Arkansas
United States
No D
ata
No D
ata
5,000
25,500
46,000
66,500
87,000
107,500
128,000
148,500
169,000
189,500
210,000
1980 1990 00 2010*
Num
ber o
f Veh
icle
Reg
istra
tions
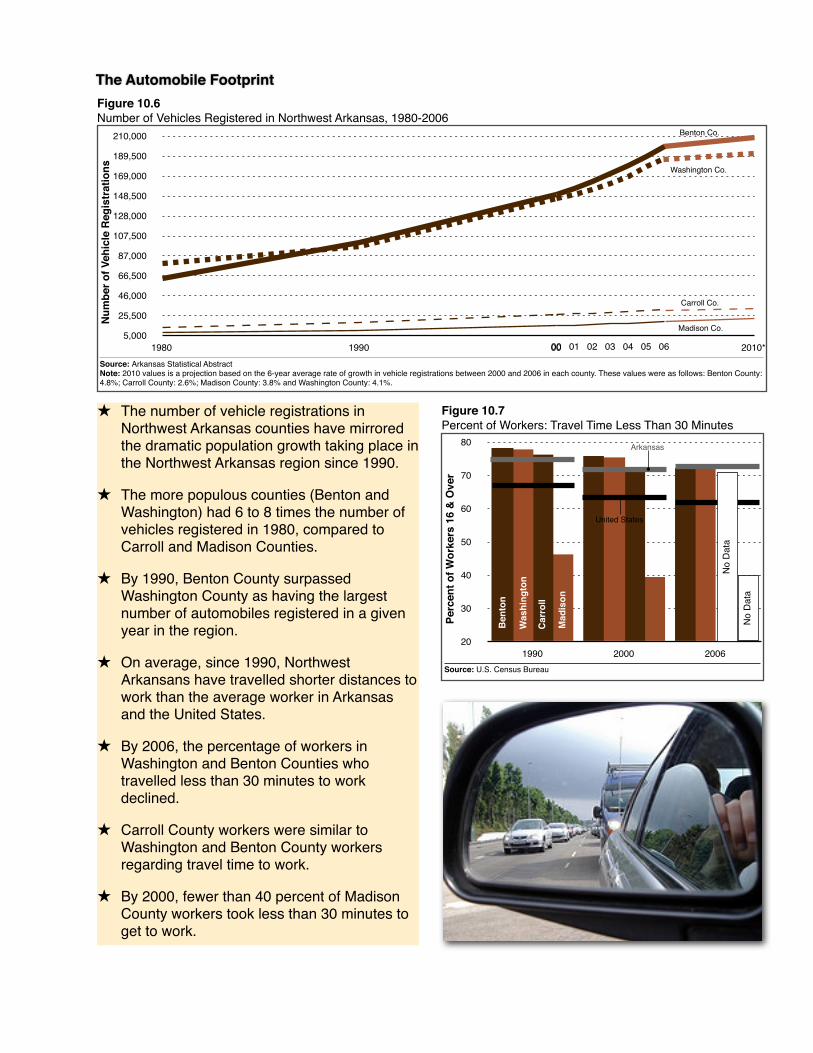
Source: Arkansas Statistical AbstractNote: 2010 values is a projection based on the 6-year average rate of growth in vehicle registrations between 2000 and 2006 in each county. These values were as follows: Benton County: 4.8%; Carroll County: 2.6%; Madison County: 3.8% and Washington County: 4.1%.
Figure 10.6Number of Vehicles Registered in Northwest Arkansas, 1980-2006
Washington Co.
Benton Co.
Carroll Co.
Madison Co.
00 01 02 03 04 05 06
The Automobile Footprint
★ The number of vehicle registrations in Northwest Arkansas counties have mirrored the dramatic population growth taking place in the Northwest Arkansas region since 1990.
★ The more populous counties (Benton and Washington) had 6 to 8 times the number of vehicles registered in 1980, compared to Carroll and Madison Counties.
★ By 1990, Benton County surpassed Washington County as having the largest number of automobiles registered in a given year in the region.
★ On average, since 1990, Northwest Arkansans have travelled shorter distances to work than the average worker in Arkansas and the United States.
★ By 2006, the percentage of workers in Washington and Benton Counties who travelled less than 30 minutes to work declined.
★ Carroll County workers were similar to Washington and Benton County workers regarding travel time to work.
★ By 2000, fewer than 40 percent of Madison County workers took less than 30 minutes to get to work.
Source: U.S. Census Bureau
55
60
65
70
75
80
85
1980 1990 2000 2006
Figure 10.8Workers Age 16 & Over:
Drive Alone To Work
Perc
enta
ge o
f Wor
kers
Washington Co.
Benton Co.
Carroll Co.
Madison Co.
Arkansas
United States
Figure 10.9Workers 16 & Over:
Drive Alone To Work, 2000
Source: U.S. Census Bureau
Indicator in the Spotlight:Commuting To Work in Northwest Arkansas
Despite the rising fuel costs, the majority of Americans (88%) drive to work and nearly 75 percent drive to work alone. As expected the majority of workers using public transportation are limited to the largest cities in the United States; these figures will continue to have an impact on the Northwest Arkansas region as it explores alternatives for reducing its carbon footprint.
★ The shift in the percentage of workers driving alone to work in Northwest Arkansas has mirrored the trend in both Arkansas and the U.S.
★ The largest percentages of Northwest Arkansas workers driving to work alone were in the most populous counties (Benton and Washington).
★ By 2006, all the Northwest Arkansas counties had lower percentages of workers driving to work alone compared to the state average (80%).
★ In Madison and Carroll Counties, the percentage of workers driving to work alone declined by nearly 20 percent over the last 20 years.
★ Madison County had the lowest percentage of workers driving to work alone in Arkansas in 2000.
★ The majority of Northwest Arkansas counties looked similar to the rest of the state regarding the percentage of workers who drove alone to work in 2000, except Madison County.
“Cities all over the world are getting bigger as more and more people move from rural to urban sites, and that has created enormous problems with respect to environmental pollution and the general quality of life.”
! Alan Dundes, American Educator
Whatʼs It All Mean?Growth and environmental impact are strongly correlated--how big the carbon footprint is in an area is partly determined by the growth of its population, commercial and industrial development, and the rate as which natural resources are being used and abused. Since 1990, Northwest Arkansas counties have grown at an alarming rate and that growth has clearly had an impact on the natural resources and environment in the region.
While the data are inconsistent and not as comprehensive at the county level, the indicators suggest that careful monitoring of air and water quality as well as chemical release will be a critical piece to plotting the regionʼs future. In addition, the data show quite clearly that despite
changes in the economy and fuel pricing, even in 2006. Northwest Arkansans were either not using or had limited access to alternatives for getting to work other than driving; unfortunately a large majority of those persons driving to work were driving to work alone.
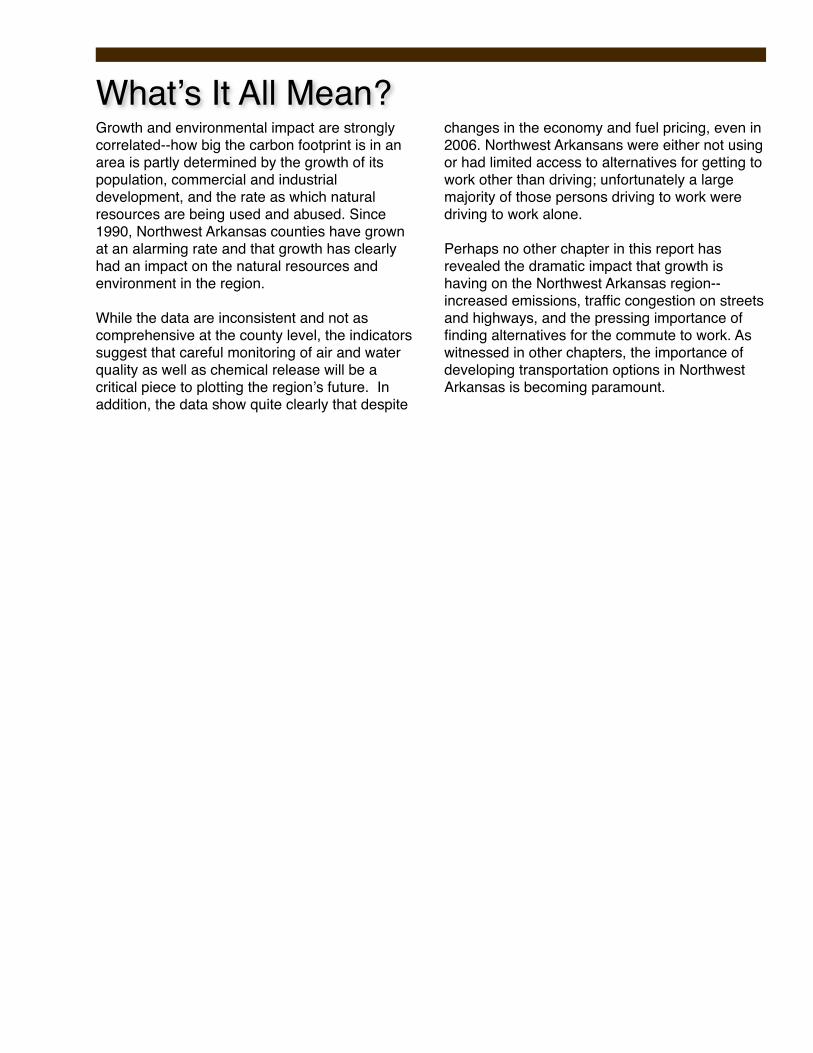
Perhaps no other chapter in this report has revealed the dramatic impact that growth is having on the Northwest Arkansas region--increased emissions, traffic congestion on streets and highways, and the pressing importance of finding alternatives for the commute to work. As witnessed in other chapters, the importance of developing transportation options in Northwest Arkansas is becoming paramount.


