
67
CHAPTER – 3
Data Analysis and Interpretation
Framework of Analysis 1. Financial health
a. Profitability Ratios
i. Gross Profit Ratio
ii. Net Profit Ratio
iii. Return on Assets
iv. Return on Equity
v. Return on Capital employed
b. Financial Leverage Ratios
i. Debt – Equity Ratio
ii. Total Capitalisation
c. Capital Market Ratios
i. Earning per share
ii. Price Earning ratio
2. Synergies a. Financial Synergy Standards
i. Current Ratio
ii. Quick Ratio
iii. Interest Coverage
iv. Total assets turnover ratio
b. Managerial Synergy Standards
i. Investment turnover ratio
ii. Fixed assets turn over ratio
iii. Total assets turn over ratio
c. Operating synergy standards
i. Operating Profit Margin
3. Firm Value ( Economic Value Added Model)
4. Value Added / Shortfall ( Economic Value Added Model)
5. Comparative study of overall performance

68
Figure: 3.1 Framework of Analysis
M&A Impact Analysis Model
Financial Health Firm Value
Ratio Analysis Economic Value Added Model
Profitability
Synergies
Leverage
- DER
- Total
Capitalisation
Capital
Market
- EPS
- PER
Financial
- GPR
- NPR
- ROA
- ROE
- ROCE
Managerial
Operational
- CR
- QR
- Interest
Coverage
-Market
Capitalisation
- ITOR
- FATOR
-TATOR
- OPM
- Economic Value Added
- Firm Value
-Value Added / Short Fall
Value added or shortfall
Financial Performance Standards
Synergy Performance Standards

69
This chapter intends to evaluate pre and post performance of select Mergers
and Acquisitions in terms of financial health, synergies, firm value and value addition
or shortfall. The analysis ensures long term survival. In this chapter, an analysis has
been done based on table 4.1. The individual objectives of the study are carried out in
the same order as during the study period. In this context, Mean and Co – efficient of
Variation are used to test volatility in pre and post period performance of the selected
companies.
Analysis of Financial Health
In order to identify the financial health in terms of changes in profitability, leverage
and capital market position after Mergers and Acquisitions studies have been made
separately for each group. However few ratios are used to identify the financial
performance. For convenience, the changes in financial health are identified and
called as financial performance metrics.
Financial performance metrics provide a relative basis for comparing a company over
a time. This analysis is to identify quantitative relations are to diagnose internal
strengths and weakness and help predict future financial performances. There are no
boundaries and hence useful to assessing the company’s performance throughout the
world.
Financial performance metrics considers strategic and economic developments for the
firm’s long-run success. These metrics should quickly provide actionable feedback to
improve the operations of the firm. A company is required to focus on these metrics
and represent the most important drivers of value creation. Long term induced
compensation was tied to attaining reliable levels of performance measured through
financial performance metrics.
Pre and post acquisition period financial performance metrics are computed for the
entire set of selected sample firms. This study involves relevant financial ratios which
are identified and categorised into various groups. Each group of ratios are deals with
important ratios by comparing the pre and post acquisition financial performance and
are shown as follows:
70
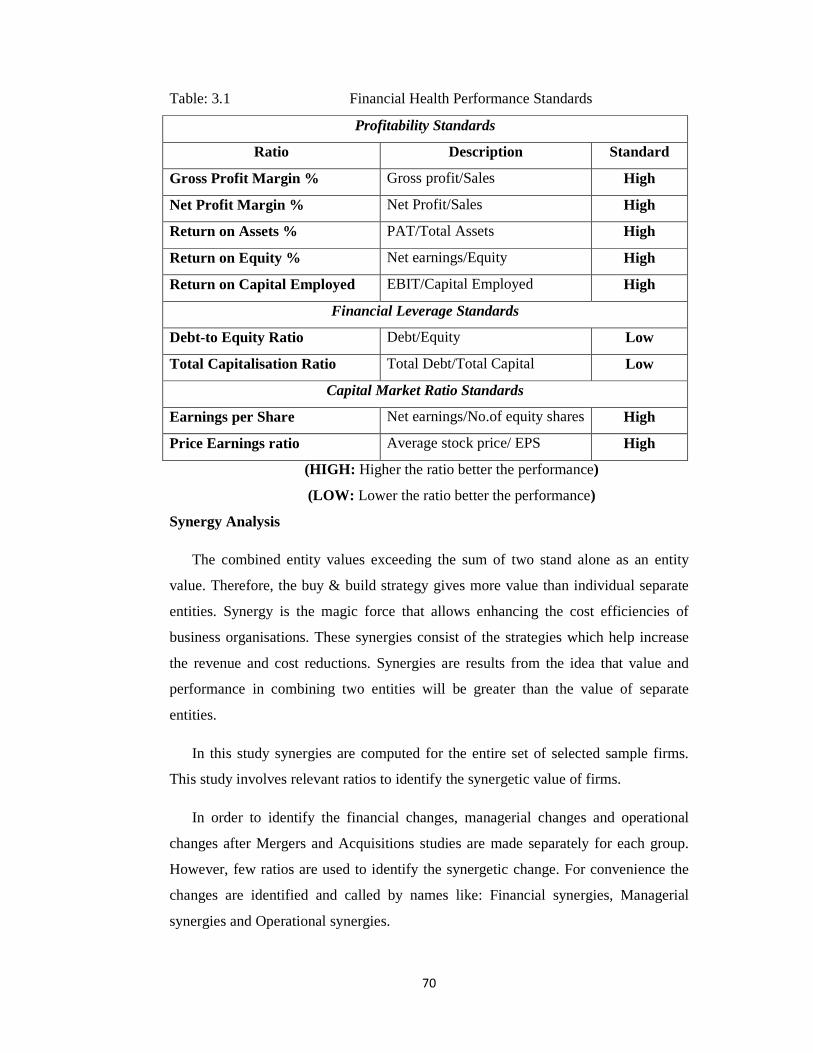
Table: 3.1 Financial Health Performance Standards
Profitability Standards
Ratio Description Standard
Gross Profit Margin % Gross profit/Sales High
Net Profit Margin % Net Profit/Sales High
Return on Assets % PAT/Total Assets High
Return on Equity % Net earnings/Equity High
Return on Capital Employed EBIT/Capital Employed High
Financial Leverage Standards
Debt-to Equity Ratio Debt/Equity Low
Total Capitalisation Ratio Total Debt/Total Capital Low
Capital Market Ratio Standards
Earnings per Share Net earnings/No.of equity shares High
Price Earnings ratio Average stock price/ EPS High
(HIGH: Higher the ratio better the performance)
(LOW: Lower the ratio better the performance)
Synergy Analysis
The combined entity values exceeding the sum of two stand alone as an entity
value. Therefore, the buy & build strategy gives more value than individual separate
entities. Synergy is the magic force that allows enhancing the cost efficiencies of
business organisations. These synergies consist of the strategies which help increase
the revenue and cost reductions. Synergies are results from the idea that value and
performance in combining two entities will be greater than the value of separate
entities.
In this study synergies are computed for the entire set of selected sample firms.
This study involves relevant ratios to identify the synergetic value of firms.
In order to identify the financial changes, managerial changes and operational
changes after Mergers and Acquisitions studies are made separately for each group.
However, few ratios are used to identify the synergetic change. For convenience the
changes are identified and called by names like: Financial synergies, Managerial
synergies and Operational synergies.

71
The below mentioned table indicates the positive changes. The referred ratios are
higher than the pre acquisition ratios of individual firms.
Table: 3.2 Synergy Ratio Standards
Financial Synergy Standards
Ratio Description Standard
Current Ratio Current Assets/Current Liabilities High
Liquid Ratio Liquid Assets/Current Liabilities High
Interest Coverage EBIT/interest Charges High
Market Capitalisation Stock Price x outstanding Shares High
Managerial Synergy Standards
Investment turnover Ratio Sales/ Investment High
Fixed assets turnover ratio Sales/ Fixed Assets High
Total assets turnover ratio Sales/Total Assets High
Operational Synergy Standards
Operating Profit Margin EBIT/Total Sales High
(HIGH: Higher the ratio better the performance)
Economic Value Added (EVA)
Economic Value Added is defined as “the incremental difference in rate of
return over a firms overall cost of capital. In other words, Economic Value Added is
calculated as a sum of excess return made on investment and invested capital.
Economic Value Added may be positive or negative. Negative Economic Value
Added indicates that the firm is destroying the value of funds invested. In case of
Economic Value Added negative means firm is destroying the value of funds
invested. Economic Value Added is a yardstick for an investment to measure the
value addition or shortfall.
Economic Value Added is calculated by using the following formula;
Economic Value Added = (Return on invested capital) – (Cost of Capital) (Capital
invested)

72
Economic Value Added improved measure of the Net Present Value rule. In
calculations of Economic value Added considered the present value of Economic
value Added is considered throughout the project life. The following formula is used
to evaluate the project or investment feasibility.
NPV = EVA t
(1+Kc) t
Where,
EVA t = Economic Value Added of project in year t
K c = Overall Cost of Capital
NPV = Net Present Value
The Economic Value Added and Net Present Value will result in a link
between value of the firm and Economic value Added of the firm. The calculation has
a simple formulation of firm value by the use of value of assets in place and
anticipated growth.
Firm Value = Value of assets in place + Value of expected future growth
There are two types of firm value calculation under Economic Value Added.
1) Discounted cash flow model - in this model both of the assets in place and the
expected future growth are ascertained by the use of Net Present Value created in the
preceding year. The following formula is used to evaluate the firm value by
considering the Net Present Value.
Firm Value = Capital invested Asset in place + Net Present Value Assets in place
+ Net Present Value
2) Economic Value Added model – this model is a substitute for discounted cash flow
model. In this model, instead of Net Present Value results, the calculation considers
Economic Value Added into this equation. The following formula is used to evaluate
firm value by using Economic Value Added.
Firm Value = Capital invested Assets in place +EVA Assets in place + EVA t Future projects
(1+Kc)t (1+Kc)
t

73
Thus, Firm Value is written as the total of following three components. Those are
• Capital investment assets in place
• Present value of Economic Value Added of assets in place
• Expected present value of Economic Value Added from the future investment.
Economic Value Added definitions outlines mainly depend on three basic inputs
that are-1) Invested capital 2) The return on net assets 3) Cost of capital of the firm.
Economic Value Added positive means the management has increased the firm’s total
worth. In other words, the firms profit is higher than that of the creditors and investors
expectations. If, Economic Value Added is negative it means the overall cost of
capital is more than the profit accumulated by the company which a means decline in
the firm value over a period. In other words, the profit of the firm is lower than that of
the Creditors and investors expectations.
Economic Value Added is performance metric. Economic Value Added is the
most preferable measure to evaluate a firm’s performance. The increase in Economic
Value Added will maximise the firm’s market value. It covers both the capital costs
and the operating costs. Hence it presents the best outcomes of the firms. Economic
Value Added of the firm will evaluate independently identify the feasibility of the
investment.

74
1. Analysis of Financial Health of selected Mergers and Acquisitions
Analysis of financial health measures the ability of the management and a
company’s accomplishments. Capital market performance ensures short term survival.
Profitability and leverage position ensures long term survival. Both are essential for
any company to long run survival. In order to identify the financial health changes
after Mergers and Acquisitions studies are made separately for each group. However,
few ratios are used to measure the financial health. For convenience the changes are
identified and called by names like: profitability ratios, leverage ratios and capital
market ratios. In this heading, an analysis has been done with the help of ratios like
gross profit margin, net profit margin, debt equity ratio, earnings per share and return
on capital employed by using the statistical tools like mean, standard deviation and
co- efficient of variation to examine the financial health of selected Mergers and
Acquisitions during the study period.
Table: 3.1.1 Gross Profit Margin of Selected Companies
Companies Mean Standard Deviation
Co - efficient of Variation
Pre Post Pre Post Pre Post
BAL 28.63 18.12 1.001 4.15 3.50 22.90
HGSL 22.15 12.82 0.60 2.59 2.71 20.20
HZL 63.86 53.19 14.10 2.17 22.08 4.08
LIL 17.10 10.05 3.35 3.29 19.59 32.74
FHL -8.92 -2.53 15.43 4.48 -172.98 -177.08
JSPL 31.17 24.50 2.887 5.475 9.26 22.35
M&ML 10.15 10.95 3.98 1.74 39.21 15.89
TCL 12.04 10.04 1.74 0.300 14.45 2.99
GTLIL -6.58 2.49 9.92 34.16 150.76 1371.89
RPL 0 481.18 0 399.09 0 82.94 (Source: AGM reports of selected companies & moneycontrol.com database)
During the study period, the average Gross Profit Margin from 2007 to 2009 is
considered to be pre-acquisition period whereas 2010 to 2013 to be considered as post
acquisition period. The comparison of the pre and post-acquisition, Gross Profit
Margin of selected companies is shown in table – 3.1.1
75
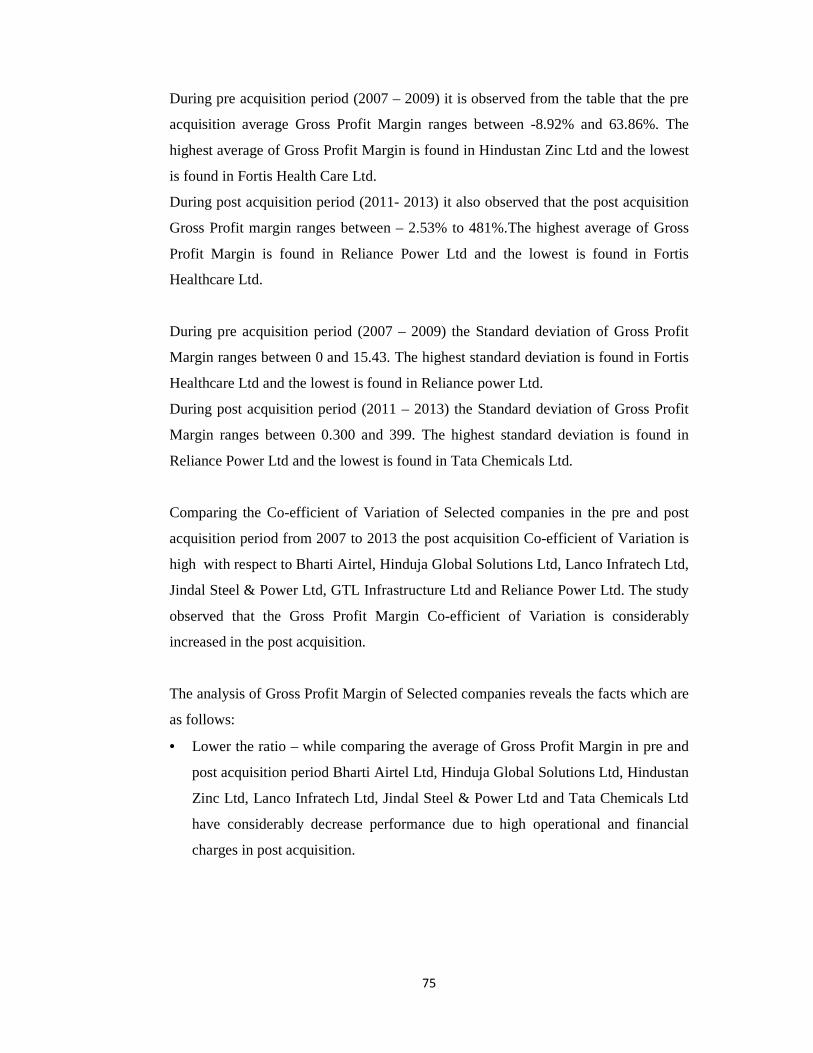
During pre acquisition period (2007 – 2009) it is observed from the table that the pre
acquisition average Gross Profit Margin ranges between -8.92% and 63.86%. The
highest average of Gross Profit Margin is found in Hindustan Zinc Ltd and the lowest
is found in Fortis Health Care Ltd.
During post acquisition period (2011- 2013) it also observed that the post acquisition
Gross Profit margin ranges between – 2.53% to 481%.The highest average of Gross
Profit Margin is found in Reliance Power Ltd and the lowest is found in Fortis
Healthcare Ltd.
During pre acquisition period (2007 – 2009) the Standard deviation of Gross Profit
Margin ranges between 0 and 15.43. The highest standard deviation is found in Fortis
Healthcare Ltd and the lowest is found in Reliance power Ltd.
During post acquisition period (2011 – 2013) the Standard deviation of Gross Profit
Margin ranges between 0.300 and 399. The highest standard deviation is found in
Reliance Power Ltd and the lowest is found in Tata Chemicals Ltd.
Comparing the Co-efficient of Variation of Selected companies in the pre and post
acquisition period from 2007 to 2013 the post acquisition Co-efficient of Variation is
high with respect to Bharti Airtel, Hinduja Global Solutions Ltd, Lanco Infratech Ltd,
Jindal Steel & Power Ltd, GTL Infrastructure Ltd and Reliance Power Ltd. The study
observed that the Gross Profit Margin Co-efficient of Variation is considerably
increased in the post acquisition.
The analysis of Gross Profit Margin of Selected companies reveals the facts which are
as follows:
• Lower the ratio – while comparing the average of Gross Profit Margin in pre and
post acquisition period Bharti Airtel Ltd, Hinduja Global Solutions Ltd, Hindustan
Zinc Ltd, Lanco Infratech Ltd, Jindal Steel & Power Ltd and Tata Chemicals Ltd
have considerably decrease performance due to high operational and financial
charges in post acquisition.

76
• Higher the ratio – Fortis Healthcare Ltd, Mahindra & Mahindra Ltd, GTL
Infrastructure Ltd and Reliance Power Ltd have considerably increase in Gross
Profit Margin due to low co-efficient of variation in post acquisition period.
Table: 3.1.2 Net Profit Margin of Selected Companies
Companies Mean Standard Deviation
Co - efficient of Variation
Pre Post Pre Post Pre Post
BAL 23.01 14.85 0.85 4.75 3.69 31.99
HGSL 14.38 10.37 1.66 3.18 11.54 30.67
HZL 48.42 45.99 5.73 0.85 11.83 1.85
LIL 10.72 2.10 3.70 2.31 34.51 110.00
FHL -12.44 28.57 19.83 23.43 -159.41 82.01
JSPL 20.68 15.79 1.83 5.36 8.85 33.95
M&ML 8.68 9.40 2.15 1.55 24.77 16.49
TCL 12.98 6.90 8.92 0.43 68.72 6.23
GTLIL -24.87 11.17 22.53 96.01 -90.59 859.53
RPL 60.66 120.46 46.44 75.74 76.56 62.88 (Source: AGM reports of selected companies & moneycontrol.com database)
During the study period, the average Net Profit Margin from 2007 to 2009 is
considered to be pre-acquisition period whereas 2010 to 2013 to be considered as post
acquisition period. The comparison of the pre and post-acquisition, Net Profit Margin
of selected companies is shown in table – 3.1.2
During pre acquisition period (2007 – 2009) it is observed from the table that the pre
acquisition average Net Profit Margin ranges between -24.87% and 60.66%. The
highest average of Net Profit Margin is found in Reliance Power Ltd and the lowest is
found in GTL Infrastructure Ltd.
During post acquisition period (2011- 2013) it also observed that the post acquisition
Net Profit margin ranges between 2.10% to 120.46%.The highest average of Net

77
Profit Margin is found in Reliance Power Ltd and the lowest is found in Lanco
Infratech Ltd.
During pre acquisition period (2007 – 2009) the Standard deviation of Net Profit
Margin ranges between 0.85 and 46.44. The highest standard deviation is found in
Reliance Power Ltd and the lowest is found in Bharti Airtel Ltd.
During post acquisition period (2011 – 2013) the Standard deviation of Net Profit
Margin ranges between 0.43 and 96.01. The highest standard deviation is found in
GTL Infrastructure Ltd and the lowest is found in Tata Chemicals Ltd.
Comparing the Co-efficient of Variation of Selected companies in the pre and post
acquisition period from 2007 to 2013 the post acquisition Co-efficient of Variation is
high with respect to Bharti Airtel, Hinduja Global Solutions Ltd, Lanco Infratech Ltd,
Jindal Steel & Power Ltd, GTL Infrastructure Ltd and Reliance Power Ltd. The study
observed that the Net Profit Margin Co-efficient of Variation is considerably
increased in the post acquisition.
The analysis of Net Profit Margin of Selected companies reveals the facts which are
as follows:
• Lower the ratio – while comparing the average of Net Profit Margin in pre and
post acquisition period Bharti Airtel Ltd, Hinduja Global Solutions Ltd, Hindustan
Zinc Ltd, Lanco Infratech Ltd, Jindal Steel & Power Ltd and Tata Chemicals Ltd
have considerably decrease performance due to high financial charges in post
acquisition.
• Higher the ratio – Fortis Healthcare Ltd, Mahindra & Mahindra Ltd, GTL
Infrastructure Ltd and Reliance Power Ltd have considerably increase in Net
Profit Margin due to low co-efficient of variation in post acquisition period.
78
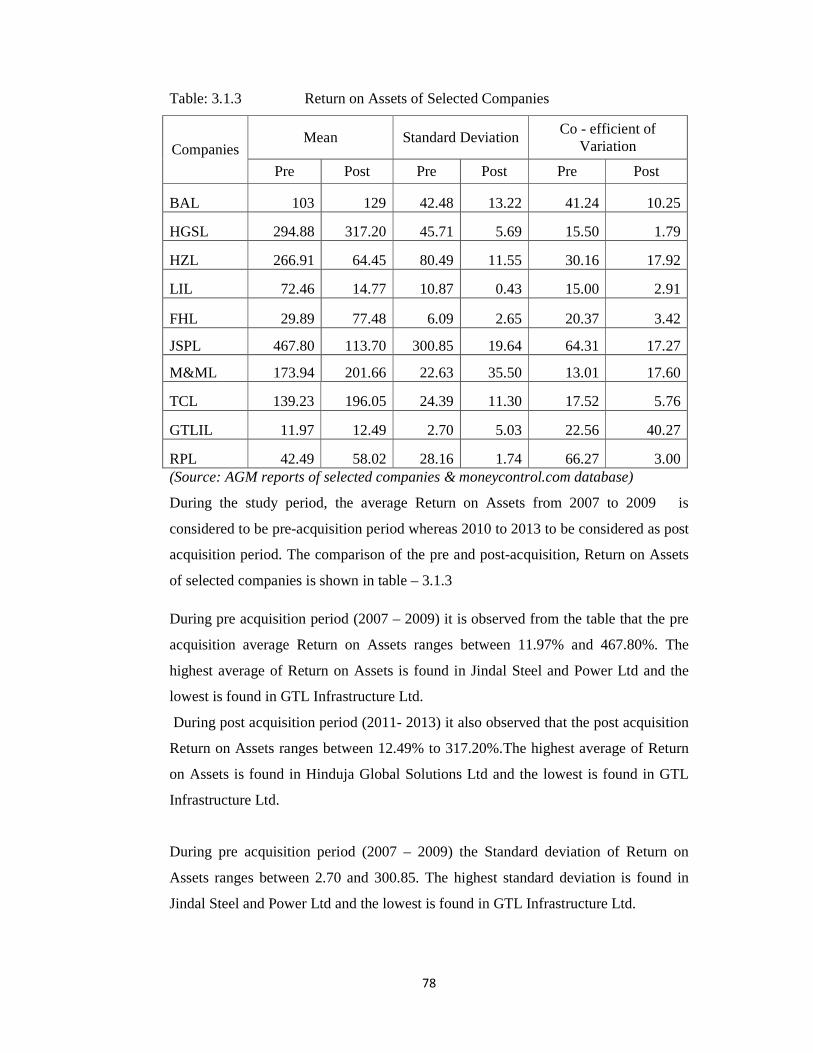
Table: 3.1.3 Return on Assets of Selected Companies
Companies Mean Standard Deviation
Co - efficient of Variation
Pre Post Pre Post Pre Post
BAL 103 129 42.48 13.22 41.24 10.25
HGSL 294.88 317.20 45.71 5.69 15.50 1.79
HZL 266.91 64.45 80.49 11.55 30.16 17.92
LIL 72.46 14.77 10.87 0.43 15.00 2.91
FHL 29.89 77.48 6.09 2.65 20.37 3.42
JSPL 467.80 113.70 300.85 19.64 64.31 17.27
M&ML 173.94 201.66 22.63 35.50 13.01 17.60
TCL 139.23 196.05 24.39 11.30 17.52 5.76
GTLIL 11.97 12.49 2.70 5.03 22.56 40.27
RPL 42.49 58.02 28.16 1.74 66.27 3.00 (Source: AGM reports of selected companies & moneycontrol.com database)
During the study period, the average Return on Assets from 2007 to 2009 is
considered to be pre-acquisition period whereas 2010 to 2013 to be considered as post
acquisition period. The comparison of the pre and post-acquisition, Return on Assets
of selected companies is shown in table – 3.1.3
During pre acquisition period (2007 – 2009) it is observed from the table that the pre
acquisition average Return on Assets ranges between 11.97% and 467.80%. The
highest average of Return on Assets is found in Jindal Steel and Power Ltd and the
lowest is found in GTL Infrastructure Ltd.
During post acquisition period (2011- 2013) it also observed that the post acquisition
Return on Assets ranges between 12.49% to 317.20%.The highest average of Return
on Assets is found in Hinduja Global Solutions Ltd and the lowest is found in GTL
Infrastructure Ltd.
During pre acquisition period (2007 – 2009) the Standard deviation of Return on
Assets ranges between 2.70 and 300.85. The highest standard deviation is found in
Jindal Steel and Power Ltd and the lowest is found in GTL Infrastructure Ltd.

79
During post acquisition period (2011 – 2013) the Standard deviation of Return on
Assets ranges between 0.43 and 35.50. The highest standard deviation is found in
Mahindra and Mahindra Ltd and the lowest is found in Lanco Infratech Ltd.
Comparing the Co-efficient of Variation of Selected companies in the pre and post
acquisition period from 2007 to 2013 the post acquisition Co-efficient of Variation is
high with respect to GTL Infrastructure Ltd. The study observed that the Return on
Assets Co-efficient of Variation is considerably decreased in the post acquisition.
The analysis of Return on Assets of Selected companies reveals the facts which are as
follows:
• Lower the ratio – while comparing the average of Return on Assets in pre and post
acquisition period Hindustan Zinc Ltd, Lanco Infratech Ltd and Jindal Steel &
Power Ltd have considerably decrease performance due to low utilisation of
available resources.
• Higher the ratio – Bharti Airtel Ltd, Hinduja Global Solutions Ltd,Fortis
Healthcare Ltd, Mahindra & Mahindra Ltd, GTL Infrastructure Ltd, Tata
Chemicals Ltd and Reliance Power Ltd have considerably increase in Return on
Assets due to low co-efficient of variation in post acquisition period.
Table: 3.1.4 Return on Equity of Selected Companies
Companies Mean Standard Deviation Co - efficient of
Variation Pre Post Pre Post Pre Post
BAL 31.47 12.83 3.64 4.18 11.57 32.58
HGSL 8.62 9.81 4.01 1.81 46.52 18.45
HZL 37.81 20.14 20.09 2.52 53.13 12.51
LIL 10.67 3.92 4.73 3.97 44.33 101.28
FHL -3.68 3.84 5.96 2.97 -161.96 77.34
JSPL 29.84 18.70 2.70 5.47 9.05 29.25
M&ML 23.91 24.11 7.21 1.52 30.15 6.30
TCL 19.21 10.80 7.07 1.91 36.80 17.69
GTLIL -4.83 -23.68 4.03 13.66 -83.44 -57.69
RPL 0.0267 2.23 0.046 0.715 172.28 32.06 (Source: AGM reports of selected companies & moneycontrol.com database)

80
During the study period, the average Return on Equity from 2007 to 2009 is
considered to be pre-acquisition period whereas 2010 to 2013 to be considered as post
acquisition period. The comparison of the pre and post-acquisition, Return on Equity
of selected companies is shown in table – 3.1.4
During pre acquisition period (2007 – 2009) it is observed from the table that the pre
acquisition average Return on Equity ranges between -4.83% and 37.81%. The
highest average of Return on Equity is found in Bharti Airtel Ltd and the lowest is
found in GTL Infrastructure Ltd.
During post acquisition period (2011- 2013) it also observed that the post acquisition
Return on Equity ranges between -23.68% to 24.11%.The highest average of Return
on Equity is found in Mahindra and Mahindra Ltd and the lowest is found in GTL
Infrastructure Ltd.
During pre acquisition period (2007 – 2009) the Standard deviation of Return on
Equity ranges between 0.046 and 20.99. The highest standard deviation is found in
Jindal Steel and Power Ltd and the lowest is found in Reliance Power Ltd.
During post acquisition period (2011 – 2013) the Standard deviation of Return on
Equity ranges between 0.715 and 13.66. The highest standard deviation is found in
GTL Infrastructure Ltd and the lowest is found in Reliance Power Ltd.
Comparing the Co-efficient of Variation of Selected companies in the pre and post
acquisition period from 2007 to 2013 the post acquisition Co-efficient of Variation is
high with respect to Lanco Infratech Ltd and Jindal Steel and Power Ltd. The study
observed that the Return on Equity Co-efficient of Variation is considerably
decreased in the post acquisition.
The analysis of Return on Equity of Selected companies reveals the facts which are as
follows:
• Lower the ratio – while comparing the average of Return on Equity in pre and
post acquisition period Bharti Airtel, Hindustan Zinc Ltd, Lanco Infratech Ltd,
Jindal Steel & Power Ltd, Tata Chemicals Ltd have considerably decrease
performance due to decline in profits.

81
• Higher the ratio – Hinduja Global Solutions Ltd,Fortis Healthcare Ltd, Mahindra
& Mahindra Ltd, GTL Infrastructure Ltd, Tata Chemicals Ltd and Reliance Power
Ltd have considerably increase in Return on Equity due to low co-efficient of
variation in post acquisition period.
Table: 3.1.5 Return on Capital Employed of Selected Companies
Companies Mean Standard Deviation
Co - efficient of Variation
Pre Post Pre Post Pre Post
BAL 28.47 13.95 0.558 2.339 1.96 16.77
HGSL 9.93 11.41 5.63 1.81 56.70 15.86
HZL 51.56 24.45 30.56 1.96 59.27 8.02
LIL 13.41 9.02 4.80 1.34 35.79 14.86
FHL 1.59 3.92 1.31 1.14 82.39 29.08
JSPL 22.19 12.69 3.35 2.83 15.10 22.30
M&ML 19.41 25.59 5.91 1.83 30.45 7.15
TCL 14.55 13.38 3.98 3.02 27.35 22.57
GTLIL 0.77 0.66 0.23 3.26 29.87 493.94
RPL 0 1.193 0 0.959 0 80.39 (Source: AGM reports of selected companies & moneycontrol.com database)
During the study period, the average Return on Capital Employed from 2007 to 2009
is considered to be pre-acquisition period whereas 2010 to 2013 to be considered as
post acquisition period. The comparison of the pre and post-acquisition, Return on
Capital Employed of selected companies is shown in table – 3.1.5
During pre acquisition period (2007 – 2009) it is observed from the table that the pre
acquisition average Return on Capital Employed ranges between 0% and 51.56%. The
highest average of Return on Capital Employed is found in Hindustan Zinc Ltd and
the lowest is found in Reliance Power Ltd.
During post acquisition period (2011- 2013) it also observed that the post acquisition
Return on Capital Employed ranges between 0.66% to 25.59%.The highest average of

82
Return on Capital Employed is found in Mahindra and Mahindra Ltd and the lowest is
found in GTL Infrastructure Ltd.
During pre acquisition period (2007 – 2009) the Standard deviation of Return on
Capital Employed ranges between 0 and 30.55. The highest standard deviation is
found in Mahindra and Mahindra Ltd and the lowest is found in Reliance Power Ltd.
During post acquisition period (2011 – 2013) the Standard deviation of Return on
Capital Employed ranges between 0.959 and 2.34. The highest standard deviation is
found in Bharti Airtel Ltd and the lowest is found in Reliance Power Ltd.
Comparing the Co-efficient of Variation of Selected companies in the pre and post
acquisition period from 2007 to 2013 the post acquisition Co-efficient of Variation is
high with respect to Bharti Airtel Ltd, GTL Infrastructure Ltd and Reliance Power
Ltd. The study observed that the Return on Capital Employed Co-efficient of
Variation is considerably decreased in the post acquisition.
The analysis of Return on Capital Employed of Selected companies reveals the facts
which are as follows:
• Lower the ratio – while comparing the average of Return on Capital Employed in
pre and post acquisition period Bharti Airtel, Hindustan Zinc Ltd, Lanco Infratech
Ltd, Jindal Steel & Power Ltd, Tata Chemicals Ltd have considerably decrease
performance due to decline in profits earned and Capital Employed.
• Higher the ratio – Hinduja Global Solutions Ltd,Fortis Healthcare Ltd, Mahindra
& Mahindra Ltd, GTL Infrastructure Ltd, Tata Chemicals Ltd and Reliance Power
Ltd have considerably increase in Return on Capital Employed due to low co-
efficient of variation in post acquisition period.
During the study period, the average Debt Equity Ratio from 2007 to 2009 is
considered to be pre-acquisition period whereas 2010 to 2013 to be considered as post
acquisition period. The comparison of the pre and post-acquisition, Debt Equity Ratio
of selected companies is shown in table – 3.1.6

83
Table: 3.1.6 Debt Equity Ratio of Selected Companies
Companies Mean Standard Deviation
Co - efficient of Variation
Pre Post Pre Post Pre Post
BAL 0.440 0.2533 0.147 0.032 33.41 12.63
HGSL 0.097 0.167 0.084 0.058 86.60 34.73
HZL - - - - - -
LIL 0.397 1.07 0.303 0.110 76.32 10.28
FHL 0.57 0.27 0.428 0.106 75.09 39.26
JSPL 1.14 1.41 0.24 0.147 21.05 10.43
M&ML 0.61 0.237 0.15 0.021 24.59 8.86
TCL 0.70 0.53 0.29 0.088 41.43 16.60
GTLIL 2.70 2.86 0.39 0.30 14.44 10.49
RPL 0 0.07 0 0.0608 0 86.86 (Source: AGM reports of selected companies & moneycontrol.com database)
During pre acquisition period (2007 – 2009) it is observed from the table that the pre
acquisition average Debt Equity Ratio ranges between 0:1 and 1.14:1.The highest
average of Debt Equity Ratio is found in Jindal Steel & Power Ltd and the lowest is
found in Reliance Power Ltd.
During post acquisition period (2011- 2013) it also observed that the post acquisition
Debt Equity Ratio ranges between 0.07:1 to 1.41:1 The highest average of Debt
Equity Ratio found in Jindal Steel and Power Ltd and the lowest is found in Reliance
Power Ltd.
During pre acquisition period (2007 – 2009) the Standard deviation of Debt Equity
Ratio ranges between 0 and 0.428. The highest standard deviation is found in Fortis
Healthcare Ltd and the lowest is found in Reliance Power Ltd.
During post acquisition period (2011 – 2013) the Standard deviation of Debt Equity
Ratio ranges between 0.032 and 0.147. The highest standard deviation is found in
Jindal Steel and Power Ltd and the lowest is found in Bharti Airtel Ltd.

84
Comparing the Co-efficient of Variation of Selected companies in the pre and post
acquisition period from 2007 to 2013 the post acquisition Co-efficient of Variation is
high with respect to Reliance Power Ltd. The study observed that the Debt Equity
Ratio Co-efficient of Variation is considerably decreased in the post acquisition.
The analysis of Debt Equity Ratio of Selected companies reveals the facts which are
as follows:
• Lower the ratio – while comparing the average of Debt Equity Ratio in pre and
post acquisition period Bharti Airtel Ltd, Fortis Healthcare Ltd, Ltd, Mahindra and
Mahindra Ltd and Tata Chemicals Ltd have considerably decreased indicating
lower leverage policy by infusing more equity funds in its capital structure.the
raised equity capital was devoted for long term investment purposes and
acquisition of long term assets. Over the years the debt amount decreased on
account of effective borrowing policies. The analysis indicates that the claims of
lenders are less than the shareholders funds or networth.
• Higher the ratio – Hinduja Global Solutions Ltd, Lanco Infratech Ltd, Jindal Steel
& Power Ltd, GTL Infrastructure Ltd and Reliance Power Ltd have considerably
increase in Debt Equity Ratio due to low co-efficient of variation in post
acquisition period.
Table: 3.1.7 Total Capitalisation of Selected Companies
Companies Mean Standard Deviation
Co - efficient of Variation
Pre Post Pre Post Pre Post
BAL 0.2633 0.2000 0.051 0.017 19.37 8.50
HGSL 0.083 0.143 0.072 0.046 86.75 32.17
HZL 0.74 0.42 0.37 0.026 50.00 6.19
LIL 0.26 0.53 0.16 0.04 61.54 7.55
FHL 0.30 0.21 0.16 0.07 53.33 33.33
JSPL 0.52 0.58 0.051 0.023 9.81 3.97
M&ML 0.38 0.19 0.060 0.17 15.79 89.47
TCL 0.40 0.35 0.10 0.038 25.00 10.86
GTLIL 0.72 0.74 0.026 0.017 3.61 2.30
RPL 0 0.063 0 0.055 0 87.30 (Source: AGM reports of selected companies & moneycontrol.com database)

85
During the study period, the average Total Capitalisation from 2007 to 2009 is
considered to be pre-acquisition period whereas 2010 to 2013 to be considered as post
acquisition period. The comparison of the pre and post-acquisition, Total
Capitalisation of selected companies is shown in table – 3.1.7
During pre acquisition period (2007 – 2009) it is observed from the table that the pre
acquisition average Total Capitalisation ranges between 0:1 and 0.74:1.The highest
average of Total Capitalisation is found in Hindustan Zinc Ltd and the lowest is found
in Reliance Power Ltd.
During post acquisition period (2011- 2013) it also observed that the post acquisition
Total Capitalisation ranges between 0.063:1 to 0.74:1 The highest average of Total
Capitalisation found in GTL Infrastructure Ltd and the lowest is found in Reliance
Power Ltd.
During pre acquisition period (2007 – 2009) the Standard deviation of Total
Capitalisation ranges between 0 and 0.37. The highest standard deviation is found in
Hindustan Zinc Ltd and the lowest is found in Reliance Power Ltd.
During post acquisition period (2011 – 2013) the Standard deviation of Total
Capitalisation ranges between 0.017 and 0.17. The highest standard deviation is found
in Mahindra and Mahindra Ltd and the lowest is found in GTL Infrastructure Ltd.
Comparing the Co-efficient of Variation of Selected companies in the pre and post
acquisition period from 2007 to 2013 the post acquisition Co-efficient of Variation is
high with respect to Mahindra and Mahindra Ltd and Reliance Power Ltd. The study
observed that the Total Capitalisation Co-efficient of Variation is considerably
decreased in the post acquisition.
The analysis of Total Capitalisation of Selected companies reveals the facts which are
as follows:
• Lower the ratio – while comparing the average of Total Capitalisation in pre and
post acquisition period Bharti Airtel Ltd, Fortis Healthcare Ltd, Ltd, Mahindra and
Mahindra Ltd and Tata Chemicals Ltd have considerably decreased. It indicates
that the proportion of debt is low compared to equity funds reflecting use under
leveraging to fund the business operation. To fulfil operating and strategic plans

86
above companies depended on equity financing as a result leading to debt trap
where in future earnings are enough to meet obligations.
• Higher the ratio – Hinduja Global Solutions Ltd, Lanco Infratech Ltd, Jindal Steel
& Power Ltd, GTL Infrastructure Ltd and Reliance Power Ltd have considerably
increase in Total Capitalisation due to low co-efficient of variation in post
acquisition period.
Table: 3.1.8 Earnings per Share of Selected Companies
Companies Mean Standard Deviation
Co - efficient of Variation
Pre Post Pre Post Pre Post
BAL 31.65 16.28 9.82 3.59 31.03 22.05
HGSL 47.86 31.05 32 5.17 66.86 16.65
HZL 91.23 13.67 23.12 2.42 25.34 17.70
LIL 8.07 0.57 4.39 0.56 54.40 98.25
FHL -0.92 2.97 1.45 2.32 -157.61 78.11
JSPL 136 20.57 80.50 3.07 59.19 14.92
M&ML 40.57 48.29 8.58 5.75 21.15 11.91
TCL 26.81 21.44 11.93 4.81 44.50 22.43
GTLIL -0.49 -2.77 0.46 1.22 -93.88 -44.04
RPL 0.49 1.30 0.52 0.46 106.12 35.38 (Source: AGM reports of selected companies & moneycontrol.com database)
During the study period, the average Earnings per Share from 2007 to 2009 is
considered to be pre-acquisition period whereas 2010 to 2013 to be considered as post
acquisition period. The comparison of the pre and post-acquisition, Earnings per
Share of selected companies is shown in table – 3.1.8
During pre acquisition period (2007 – 2009) it is observed from the table that the pre
acquisition average Earnings per Share ranges between -0.92 and 136.The highest

87
average of Earnings per Share is found in Jindal Steel and Power Ltd and the lowest is
found in Fortis Healthcare Ltd.
During post acquisition period (2011- 2013) it also observed that the post acquisition
Earnings per Share ranges between -2.77 to 48.29. The highest average of Earnings
per Share found in Mahindra and Mahindra Ltd and the lowest is found in GTL
Infrastructure Ltd.
During pre acquisition period (2007 – 2009) the Standard deviation of Earnings per
Share ranges between 0.46 and 80.50. The highest standard deviation is found in
Jindal Steel and Power Ltd and the lowest is found in GTL Infrastructure Ltd.
During post acquisition period (2011 – 2013) the Standard deviation of Earnings per
Share ranges between 0.46 and 5.75. The highest standard deviation is found in
Mahindra and Mahindra Ltd and the lowest is found in Reliance Power Ltd.
Comparing the Co-efficient of Variation of Selected companies in the pre and post
acquisition period from 2007 to 2013 the post acquisition Co-efficient of Variation is
high with respect to Lanco Infratech Ltd and Fortis Healthcare Ltd. The study
observed that the Earnings per Share Co-efficient of Variation is considerably
decreased in the post acquisition.
The analysis of Earnings per Share of Selected companies reveals the facts which are
as follows:
• Lower the ratio – while comparing the average of Earnings per Share in pre and
post acquisition period Bharti Airtel Ltd, Hinduja Global Solutions Ltd, Lanco
Infratech Ltd, Jindal Steel & Power Ltd, GTL Infrastructure Ltd and Tata
Chemicals Ltd have considerably decreased. It indicates that the decline in
Earning per Share attributed to higher operating expences and proportionate
decrease in sales revenue.
• Higher the ratio – Fortis Healthcare Ltd, Mahindra and Mahindra Ltd and
Reliance Power Ltd have considerably increase in Earnings per Share due to low
co-efficient of variation in post acquisition period.

88
Table: 3.1.9 Price Earning Ratio of Selected Companies
Companies Mean Standard Deviation
Co - efficient of Variation
Pre Post Pre Post Pre Post
BAL 25.56 20.84 19.66 3.86 76.92 18.52
HGSL 9.11 12.26 5.65 5.74 62.02 46.82
HZL 9.95 9.59 7.99 1.28 80.30 13.35
LIL 107.42 2.73 130.11 4.73 121.12 173.26
FHL 21.60 95.23 498.26 124 2306.76 130.21
JSPL 28.62 18.55 33.68 2.82 117.68 15.20
M&ML 20.13 17.63 14.66 2.10 72.83 11.91
TCL 13.61 15.25 8.42 4.31 61.87 28.26
GTLIL -57.53 -2.66 67.67 3.07 -117.63 -115.41
RPL 144.90 65.50 142.85 22.85 98.59 34.89 (Source: AGM reports of selected companies & moneycontrol.com database)
During the study period, the average Price Earning Ratio from 2007 to 2009 is
considered to be pre-acquisition period whereas 2010 to 2013 to be considered as post
acquisition period. The comparison of the pre and post-acquisition, Price Earning
Ratio of selected companies is shown in table – 3.1.9
During pre acquisition period (2007 – 2009) it is observed from the table that the pre
acquisition average Price Earning Ratio ranges between -57.53 and 144.90.The
highest average of Price Earning Ratio is found in Reliance Power Ltd and the lowest
is found in GTL Infrastructure Ltd.
During post acquisition period (2011- 2013) it also observed that the post acquisition
Price Earning Ratio ranges between -2.66 to 95.23. The highest average of Price
Earning Ratio found in Fortis Healthcare Ltd and the lowest is found in GTL
Infrastructure Ltd.
During pre acquisition period (2007 – 2009) the Standard deviation of Price Earning
Ratio ranges between 5.65 and 498.26. The highest standard deviation is found in
Fortis Healthcare Ltd and the lowest is found in Hinduja Global Solutions Ltd.

89
During post acquisition period (2011 – 2013) the Standard deviation of Price Earning
Ratio ranges between 1.28 and 124. The highest standard deviation is found in Fortis
Healthcare Ltd and the lowest is found in Hindustan Zinc Ltd.
Comparing the Co-efficient of Variation of Selected companies in the pre and post
acquisition period from 2007 to 2013 the post acquisition Co-efficient of Variation is
high with respect to Lanco Infratech Ltd. The study observed that the Price Earning
Ratio Co-efficient of Variation is considerably decreased in the post acquisition.
The analysis of Price Earning Ratio of Selected companies reveals the facts which are
as follows:
• Lower the ratio – while comparing the average of Price Earning Ratio in pre and
post acquisition period Bharti Airtel Ltd, Hindustan Zinc Ltd, Lanco Infratech
Ltd, Jindal Steel & Power Ltd, Mahindra and Mahindra Ltd and Reliance Power
Ltd have considerably decreased. It indicates decreasing trend reflects lower
market price was paid by the investors and reported less earning per share during
the post acquisition period. Less dividend payments in post acquisition period
which lead to decrease in investor’s expectation and market appraisal.
• Higher the ratio – Hinduja Global Solutions Ltd, Fortis Healthcare Ltd, Tata
Chemicals Ltd and GTL Infrastructure Ltd have considerably increased in Price
Earning Ratio due to low co-efficient of variation in post acquisition period.

90
2. Analysis of Financial, Managerial and Operational Synergies
Analysis of financial, managerial and operational performance measures the
synergetic value of the firms. Liquidity ensures short term survival and credibility and
marketability ensures long term survival. Both are essential for any company in the
long run. In order to identify the financial changes, managerial changes and
operational changes after Mergers and Acquisitions, studies are made separately for
each group. However, few ratios are used to identify the synergetic change. For
convenience the changes are identified and called by names like: Financial synergies,
Managerial synergies and Operational synergies. Under this heading, an analysis has
been done with the help of ratios like current ratio, liquid ratio, interest coverage,
operating profit margin and investment turn over ratio by using statistical tools like
mean, standard deviation and co- efficient of variance to examine the financial
soundness of selected Mergers and Acquisitions during the study period.
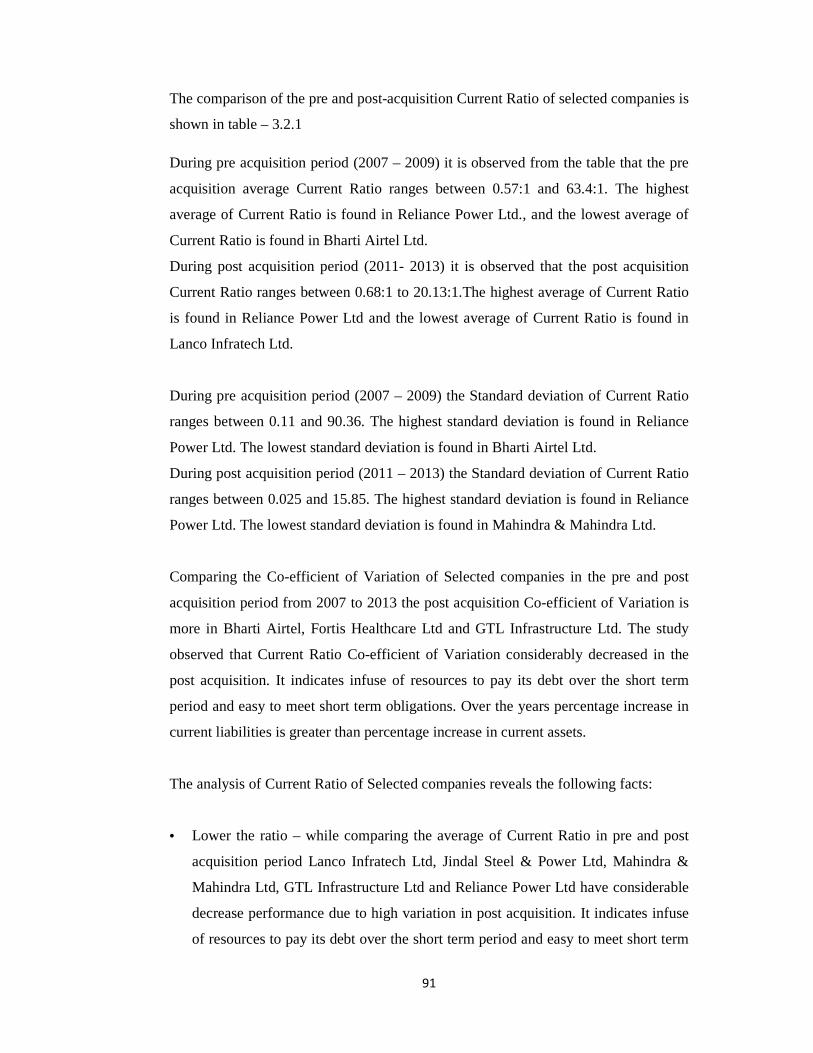
Table: 3.2.1 Current Ratio of Selected Companies
Companies Mean Standard Deviation
Co - efficient of Variation
Pre Post Pre Post Pre Post
BAL 0.568 0.767 0.11 0.22 19.37 28.68
HGSL 0.88 1.13 0.26 0.30 29.55 26.55
HZL 1.90 3.18 0.55 0.33 28.95 10.38
LIL 1.09 0.68 0.21 0.050 19.27 7.35
FHL 2.03 8.06 0.593 9.27 29.21 115.01
JSPL 0.99 0.73 0.29 0.038 29.29 5.21
M&ML 1.02 0.99 0.25 0.025 24.51 2.53
TCL 0.78 1.18 0.28 0.17 35.90 14.41
GTLIL 3.49 1.02 2.55 1.13 73.07 110.78
RPL 63.40 20.13 90.36 15.85 142.52 78.74 (Source: AGM reports of selected companies & moneycontrol.com database)
During the study period, the average Current Ratio from 2007 to 2009 is considered
as pre-acquisition period and 2010 to 2013 is considered as post acquisition period.
91
The comparison of the pre and post-acquisition Current Ratio of selected companies is
shown in table – 3.2.1
During pre acquisition period (2007 – 2009) it is observed from the table that the pre
acquisition average Current Ratio ranges between 0.57:1 and 63.4:1. The highest
average of Current Ratio is found in Reliance Power Ltd., and the lowest average of
Current Ratio is found in Bharti Airtel Ltd.
During post acquisition period (2011- 2013) it is observed that the post acquisition
Current Ratio ranges between 0.68:1 to 20.13:1.The highest average of Current Ratio
is found in Reliance Power Ltd and the lowest average of Current Ratio is found in
Lanco Infratech Ltd.
During pre acquisition period (2007 – 2009) the Standard deviation of Current Ratio
ranges between 0.11 and 90.36. The highest standard deviation is found in Reliance
Power Ltd. The lowest standard deviation is found in Bharti Airtel Ltd.
During post acquisition period (2011 – 2013) the Standard deviation of Current Ratio
ranges between 0.025 and 15.85. The highest standard deviation is found in Reliance
Power Ltd. The lowest standard deviation is found in Mahindra & Mahindra Ltd.
Comparing the Co-efficient of Variation of Selected companies in the pre and post
acquisition period from 2007 to 2013 the post acquisition Co-efficient of Variation is
more in Bharti Airtel, Fortis Healthcare Ltd and GTL Infrastructure Ltd. The study
observed that Current Ratio Co-efficient of Variation considerably decreased in the
post acquisition. It indicates infuse of resources to pay its debt over the short term
period and easy to meet short term obligations. Over the years percentage increase in
current liabilities is greater than percentage increase in current assets.
The analysis of Current Ratio of Selected companies reveals the following facts:
• Lower the ratio – while comparing the average of Current Ratio in pre and post
acquisition period Lanco Infratech Ltd, Jindal Steel & Power Ltd, Mahindra &
Mahindra Ltd, GTL Infrastructure Ltd and Reliance Power Ltd have considerable
decrease performance due to high variation in post acquisition. It indicates infuse
of resources to pay its debt over the short term period and easy to meet short term

92
obligations. Over the years percentage increase in current liabilities is greater than
percentage increase in current assets.
• Higher the ratio – Bharti Airtel Ltd, Hinduja Global Solutions Ltd, Hindustan Zinc
Ltd, Fortis Healthcare Ltd and Tata Chemicals Ltd have considerable increase in
Current Ratio due to low co-efficient of variation in post acquisition period.
Table: 3.2.2 Liquid Ratio of Selected Companies
Companies Mean Standard Deviation
Co - efficient of Variation
Pre Post Pre Post Pre Post
BAL 0.563 0.95 0.09 0.36 15.99 37.89
HGSL 1.19 1.88 0.54 0.06 45.38 3.19
HZL 1.51 2.86 0.60 0.31 39.74 10.84
LIL 1.09 0.90 0.066 0.102 6.06 11.33
FHL 4.52 12.09 2.58 6.06 57.08 50.12
JSPL 0.93 0.98 0.186 0.160 20.00 16.33
M&ML 1.02 0.99 0.25 0.025 24.51 2.53
TCL 0.98 1.05 0.05 0.205 5.10 19.52
GTLIL 3.66 1.15 2.65 1.03 72.40 89.57
RPL 63.04 65.29 90.36 29.99 143.34 45.93 (Source: AGM reports of selected companies & moneycontrol.com database)
During the study period, the average Liquid Ratio from 2007 to 2009 is considered to
be pre-acquisition period whereas 2010 to 2013 to be considered as post acquisition
period. The comparison of the pre and post-acquisition, Liquid Ratio of selected
companies is shown in table – 3.2.2
During pre acquisition period (2007 – 2009) it is observed from the table that the pre
acquisition average Liquid Ratio ranges between 0.563:1 and 63.04:1.The highest
average of Liquid Ratio is found in Reliance Power Ltd and the lowest is found in
Bharti Airtel Ltd.

93
During post acquisition period (2011- 2013) it also observed that the post acquisition
Price Earning Ratio ranges between 0.90:1 to 65.29:1 The highest average of Liquid
Ratio found in Reliance Power Ltd and the lowest is found in Lanco Infratech Ltd.
During pre acquisition period (2007 – 2009) the Standard deviation of Liquid Ratio
ranges between 0.05 and 90.36. The highest standard deviation is found in Reliance
Power Ltd and the lowest is found in Tata Chemicals Ltd.
During post acquisition period (2011 – 2013) the Standard deviation of Liquid Ratio
ranges between 0.06 and 29.99. The highest standard deviation is found in Fortis
Healthcare Ltd and the lowest is found in Hindustan Zinc Ltd.
Comparing the Co-efficient of Variation of Selected companies in the pre and post
acquisition period from 2007 to 2013 the post acquisition Co-efficient of Variation is
high with respect to Bharti Airtel Ltd, Tata Chemicals Ltd and GTL Infrastructure
Ltd. The study observed that the Liquid Ratio Co-efficient of Variation is
considerably decreased in the post acquisition.
The analysis of Liquid Ratio of Selected companies reveals the facts which are as
follows:
• Lower the ratio – while comparing the average of Liquid Ratio in pre and post
acquisition period Lanco Infratech Ltd, Mahindra and Mahindra Ltd and GTL
Infrastructure Ltd have considerably decreased. It indicates lower liquidity
positions and inability to meet immediate current liabilities. The results show less
than the standards in the post acquisition. It is also observed that Current Ratio is
much greater than the Quick Ratio. It suggests current assets are not highly
dependent on inventory and sundry creditors.
• Higher the ratio – Bharti Airtel Ltd, Hinduja Global Solutions Ltd, Hindustan Zinc
Ltd, Fortis Healthcare Ltd, Jindal Steel and Power Ltd, Tata Chemical Ltd and
GTL Infrastructure Ltd have considerably increased in Liquid Ratio due to low
co-efficient of variation in post acquisition period.

94
Table: 3.2.3 Interest Coverage of Selected Companies
Companies Mean Standard Deviation
Co - efficient of Variation
Pre Post Pre Post Pre Post
BAL 34.70 12.94 11.42 12.99 32.91 100.39
HGSL 39.41 9.31 25.06 5.399 63.59 57.99
HZL 370 1800 232.62 2508.11 62.87 139.34
LIL 7.30 1.49 4.03 0.66 55.21 44.30
FHL 0.68 1.93 0.56 1.26 82.35 65.28
JSPL 8.58 6.89 1.68 3.51 19.58 50.94
M&ML 30.52 31.40 31.89 14.33 104.49 45.64
TCL 17.85 5.08 12.64 0.925 70.81 18.21
GTLIL 0.66 0.13 0.38 0.65 57.58 500.00
RPL 0 5.03 0 1.66 0 33.00 (Source: AGM reports of selected companies & moneycontrol.com database)
During the study period, the average Interest Coverage from 2007 to 2009 is
considered to be pre-acquisition period whereas 2010 to 2013 to be considered as post
acquisition period. The comparison of the pre and post-acquisition, Interest Coverage
of selected companies is shown in table – 3.2.3
During pre acquisition period (2007 – 2009) it is observed from the table that the pre
acquisition average Interest Coverage ranges between 0 and 370.The highest average
of Interest Coverage is found in Hindustan Zinc Ltd and the lowest is found in
Reliance Power Ltd.
During post acquisition period (2011- 2013) it also observed that the post acquisition
Interest Coverage ranges between 0.13 to 1800 The highest average of Interest
Coverage found in Hindustan Zinc Ltd and the lowest is found in GTL Infrastructure
Ltd.
During pre acquisition period (2007 – 2009) the Standard deviation of Interest
Coverage ranges between 0 and 232.62. The highest standard deviation is found in
Hindustan Zinc Ltd and the lowest is found in Reliance Power Ltd.
During post acquisition period (2011 – 2013) the Standard deviation of Interest
Coverage ranges between 0.65 and 2508.11. The highest standard deviation is found
in Hindustan Zinc Ltd and the lowest is found in GTL Infrastructure Ltd.

95
Comparing the Co-efficient of Variation of Selected companies in the pre and post
acquisition period from 2007 to 2013 the post acquisition Co-efficient of Variation is
high with respect to Bharti Airtel Ltd, Hindustan Zinc Ltd, Jindal Steel and Power
Ltd, GTL Infrastructure Ltd and Reliance Power Ltd. The study observed that the
Interest Coverage Co-efficient of Variation is considerably increased in the post
acquisition.
The analysis of Interest Coverage of Selected companies reveals the facts which are
as follows:
• Lower the ratio – while comparing the average of Interest Coverage in pre and
post acquisition period Bharti Airtel Ltd, Hinduja Global Solutions Ltd, Lanco
Infratech Ltd, Jindal Steel and Power Ltd, Tata Chemicals Ltd and GTL
Infrastructure Ltd have considerably decreased. It indicates inability to honour its
debt payments due to less profit margin reported over the post three years. Post
acquisition Interest Coverage was low indicating possibility of default to creditors.
• Higher the ratio – Hindustan Zinc Ltd, Fortis Healthcare Ltd, Mahindra and
Mahindra Ltd and Reliance Power Ltd have considerably increased in Interest
Coverage due to low co-efficient of variation in post acquisition period.
Table: 3.2.4 Market Capitalisation of Selected Companies
Companies Mean Standard Deviation
Co - efficient of Variation
Pre Post Pre Post Pre Post
BAL 129100.2 125426.1 63423.78 5012.75 49.13 4.00
HGSL 470.39 747.89 436.99 232.22 92.90 31.05
HZL 33422.28 54584.08 18511.22 3785.22 55.39 6.93
LIL 11682.90 2463.99 7721.61 726.58 66.09 29.49
FHL 2189.83 4074.64 826.68 627.20 37.75 15.39
JSPL 24103.58 36200.70 20240.49 10223.13 83.97 28.24
M&ML 18848.50 52343.83 11542.41 9088.81 61.24 17.36
TCL 6773.50 7994.67 2601.88 1007.95 38.41 12.61
GTLIL 2752.65 563.20 467.24 260.91 16.97 46.33
RPL 23548.11 22207.25 15712.10 3459.99 66.72 15.58 (Source: AGM reports of selected companies & moneycontrol.com database)
96
During pre acquisition period (2007 – 2009) it is observed from the table that the pre
acquisition average Market Capitalisation ranges between 470.39Crores and
1,29,100.20Crores.The highest average of Market Capitalisation is found in Bharti
Airtel Ltd and the lowest is found in Hinduja Global Solutions Ltd.
During post acquisition period (2011- 2013) it also observed that the post acquisition
Market Capitalisation ranges between 563.20Crores to 1,25,426.10Crores. The
highest average of Market Capitalisation found in Bharti Airtel Ltd and the lowest is
found in GTL Infrastructure Ltd.
During pre acquisition period (2007 – 2009) the Standard deviation of Market
Capitalisation ranges between 436.99 and 63,423.78. The highest standard deviation
is found in Bharti Airtel Ltd and the lowest is found in Hinduja Global Solutions Ltd.
During post acquisition period (2011 – 2013) the Standard deviation of Market
Capitalisation ranges between 232.22 and 10.223.13. The highest standard deviation
is found in Jindal Steel and Power Ltd and the lowest is found in Hinduja Global
Solutions Ltd.
Comparing the Co-efficient of Variation of Selected companies in the pre and post
acquisition period from 2007 to 2013 the post acquisition Co-efficient of Variation is
high with respect to GTL Infrastructure Ltd. The study observed that the Market
Capitalisation Co-efficient of Variation is considerably decreased in the post
acquisition.
The analysis of Market Capitalisation of Selected companies reveals the facts which
are as follows:
• Lower the ratio – while comparing the average of Market Capitalisation in pre and
post acquisition period Bharti Airtel Ltd, Lanco Infratech Ltd, GTL Infrastructure
Ltd and Reliance Power Ltd have considerably decreased. It reflects on investors
by way of quoting lower prices to outstanding equity shares in the capital market.
Future growth prospects are uncertain on account of intense competition and
decrease in equity funds in the capital structure.

97
• Higher the ratio – Hinduja Global Solutions Ltd, Hindustan Zinc Ltd, Fortis
Healthcare Ltd, Jindal Steel and Power Ltd, Mahindra and Mahindra Ltd and Tata
Chemicals Ltd have considerably increased in Market Capitalisation due to low
co-efficient of variation in post acquisition period.
Table: 3.2.5 Investment Turnover Ratio of Selected Companies
Companies Mean Standard Deviation
Co - efficient of Variation
Pre Post Pre Post Pre Post
BAL 0.997 0.68 0.064 0.025 6.42 3.68
HGSL 0.520 0.823 0.197 0.051 37.88 6.20
HZL 0.73 0.42 0.364 0.025 49.86 5.95
LIL 0.78 0.89 0.46 0.32 58.97 35.96
FHL 0.15 0.073 0.010 0.006 6.67 8.22
JSPL 0.69 0.49 0.076 0.032 11.01 6.53
M&ML 1.65 2.07 0.25 0.20 15.15 9.66
TCL 0.99 0.993 0.271 0.159 27.37 16.01
GTLIL 0.047 0.10 0.0057 0.036 12.13 36.00
RPL 0.013 0.033 0.006 0.006 46.15 18.18 (Source: AGM reports of selected companies & moneycontrol.com database)
During the study period, the average Investment Turnover Ratio from 2007 to 2009 is
considered to be pre-acquisition period whereas 2010 to 2013 to be considered as post
acquisition period. The comparison of the pre and post-acquisition, Investment
Turnover Ratio of selected companies is shown in table – 3.2.5
During pre acquisition period (2007 – 2009) it is observed from the table that the pre
acquisition average Investment Turnover Ratio ranges between 0.013times and
1.65times. The highest average of Investment Turnover Ratio is found in Mahindra
and Mahindra Ltd and the lowest is found in Reliance Power Ltd.
During post acquisition period (2011- 2013) it also observed that the post acquisition
Investment Turnover Ratio ranges between 0.033times to 2.07times. The highest
98
average of Investment Turnover Ratio found in Mahindra and Mahindra Ltd and the
lowest is found in Reliance Power Ltd.
During pre acquisition period (2007 – 2009) the Standard deviation of Investment
Turnover Ratio ranges between 0.0057 and 0.46. The highest standard deviation is
found in Lanco Infratech Ltd and the lowest is found in GTL Infrastructure Ltd.
During post acquisition period (2011 – 2013) the Standard deviation of Investment
Turnover Ratio ranges between 0.006 and 0.32. The highest standard deviation is
found in Lanco Infratech Ltd and the lowest is found in Reliance Power Ltd.
Comparing the Co-efficient of Variation of Selected companies in the pre and post
acquisition period from 2007 to 2013 the post acquisition Co-efficient of Variation is
high with respect to GTL Infrastructure Ltd. The study observed that the Investment
Turnover Ratio Co-efficient of Variation is considerably decreased in the post
acquisition.
The analysis of Investment Turnover Ratio of Selected companies reveals the facts
which are as follows:
• Lower the ratio – while comparing the average of Investment Turnover Ratio in
pre and post acquisition period Bharti Airtel Ltd, Hindustan Zinc Ltd, Fortis
Healthcare Ltd and Jindal Steel and Power Ltd have considerably decreased. It
indicates that there is an inefficiency to utilise the investment to improving the
turnover.
• Higher the ratio – Hinduja Global Solutions Ltd, Lanco Infratech Ltd, Mahindra
and Mahindra Ltd, Tata Chemicals Ltd, GTL Infrastructure Ltd and Reliance
Power Ltd have considerably increased in Investment Turnover Ratio due to low
co-efficient of variation in post acquisition period.
During the study period, the average Fixed Assets Turnover Ratio from 2007 to 2009
is considered to be pre-acquisition period whereas 2010 to 2013 to be considered as
post acquisition period. The comparison of the pre and post-acquisition, Fixed Assets
Turnover Ratio of selected companies is shown in table – 3.2.6
99
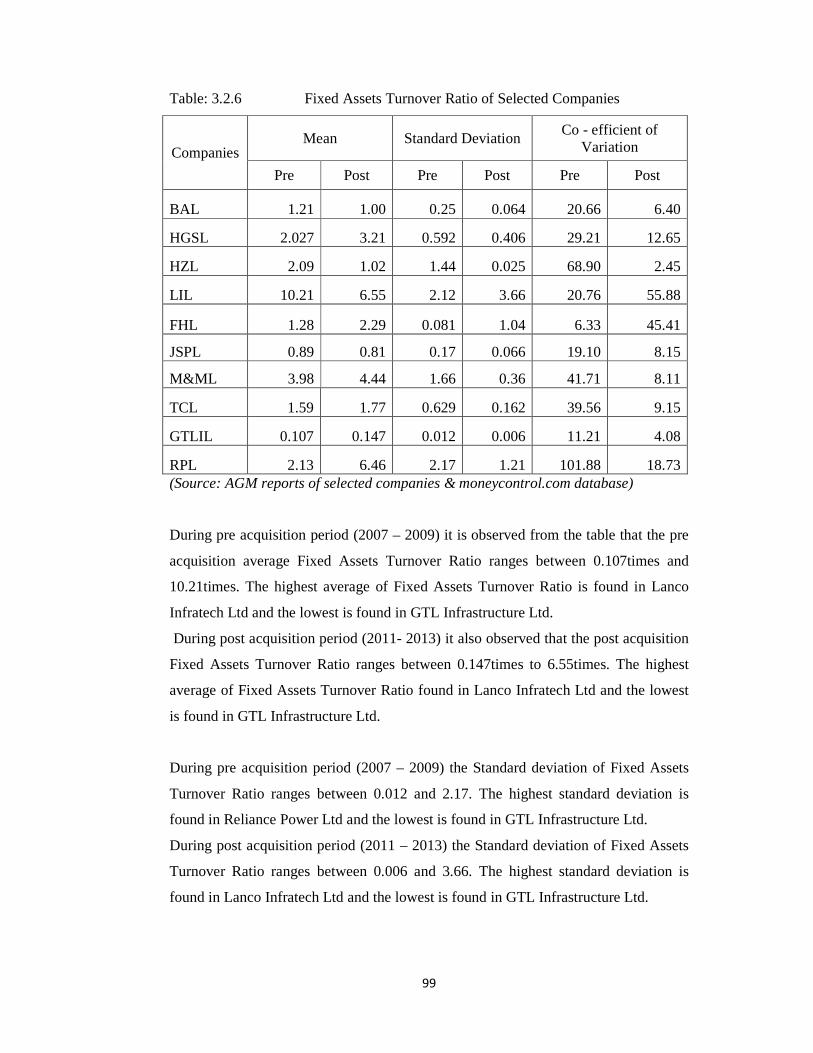
Table: 3.2.6 Fixed Assets Turnover Ratio of Selected Companies
Companies Mean Standard Deviation
Co - efficient of Variation
Pre Post Pre Post Pre Post
BAL 1.21 1.00 0.25 0.064 20.66 6.40
HGSL 2.027 3.21 0.592 0.406 29.21 12.65
HZL 2.09 1.02 1.44 0.025 68.90 2.45
LIL 10.21 6.55 2.12 3.66 20.76 55.88
FHL 1.28 2.29 0.081 1.04 6.33 45.41
JSPL 0.89 0.81 0.17 0.066 19.10 8.15
M&ML 3.98 4.44 1.66 0.36 41.71 8.11
TCL 1.59 1.77 0.629 0.162 39.56 9.15
GTLIL 0.107 0.147 0.012 0.006 11.21 4.08
RPL 2.13 6.46 2.17 1.21 101.88 18.73 (Source: AGM reports of selected companies & moneycontrol.com database)
During pre acquisition period (2007 – 2009) it is observed from the table that the pre
acquisition average Fixed Assets Turnover Ratio ranges between 0.107times and
10.21times. The highest average of Fixed Assets Turnover Ratio is found in Lanco
Infratech Ltd and the lowest is found in GTL Infrastructure Ltd.
During post acquisition period (2011- 2013) it also observed that the post acquisition
Fixed Assets Turnover Ratio ranges between 0.147times to 6.55times. The highest
average of Fixed Assets Turnover Ratio found in Lanco Infratech Ltd and the lowest
is found in GTL Infrastructure Ltd.
During pre acquisition period (2007 – 2009) the Standard deviation of Fixed Assets
Turnover Ratio ranges between 0.012 and 2.17. The highest standard deviation is
found in Reliance Power Ltd and the lowest is found in GTL Infrastructure Ltd.
During post acquisition period (2011 – 2013) the Standard deviation of Fixed Assets
Turnover Ratio ranges between 0.006 and 3.66. The highest standard deviation is
found in Lanco Infratech Ltd and the lowest is found in GTL Infrastructure Ltd.

100
Comparing the Co-efficient of Variation of Selected companies in the pre and post
acquisition period from 2007 to 2013 the post acquisition Co-efficient of Variation is
high with respect to Lanco Infratech Ltd and Fortis Healthcare Ltd. The study
observed that the Fixed Assets Turnover Ratio Co-efficient of Variation is
considerably decreased in the post acquisition.
The analysis of Fixed Assets Turnover Ratio of Selected companies reveals the facts
which are as follows:
• Lower the ratio – while comparing the average of Fixed Assets Turnover Ratio in
pre and post acquisition period Bharti Airtel Ltd, Hindustan Zinc Ltd, Lanco
Infratech Ltd and Jindal Steel and Power Ltd have considerably decreased. It
indicates that lack of operational efficiency and revenue generating activities.
• Higher the ratio – Hinduja Global Solutions Ltd, Fortis Healthcare Ltd, Mahindra
and Mahindra Ltd, Tata Chemicals Ltd, GTL Infrastructure Ltd and Reliance
Power Ltd have considerably increased in Fixed Assets Turnover Ratio due to low
co-efficient of variation in post acquisition period.
Table: 3.2.7 Total Assets Turnover Ratio of Selected Companies
Companies Mean Standard Deviation
Co - efficient of Variation
Pre Post Pre Post Pre Post
BAL 1.14 0.77 0.136 0.127 11.93 16.49
HGSL 0.434 0.682 0.186 0.043 42.86 6.30
HZL 0.74 0.42 0.37 0.027 50.00 6.43
LIL 0.78 0.89 0.462 0.321 59.23 36.07
FHL 0.15 0.073 0.010 0.006 6.67 8.22
JSPL 0.68 0.49 0.077 0.032 11.32 6.53
M&ML 1.66 2.09 .25 0.205 15.06 9.81
TCL 0.993 0.993 0.271 0.159 27.29 16.01
GTLIL 0.05 0.10 0.010 0.036 20.00 36.00
RPL 0.013 0.033 0.006 0.006 46.15 18.18 (Source: AGM reports of selected companies & moneycontrol.com database)

101
During the study period, the average Total Assets Turnover Ratio from 2007 to 2009
is considered to be pre-acquisition period whereas 2010 to 2013 to be considered as
post acquisition period. The comparison of the pre and post-acquisition, Total Assets
Turnover Ratio of selected companies is shown in table – 3.2.7
During pre acquisition period (2007 – 2009) it is observed from the table that the pre
acquisition average Total Assets Turnover Ratio ranges between 0.013times and
1.66times. The highest average of Total Assets Turnover Ratio is found in Mahindra
and Mahindra Ltd and the lowest is found in Reliance Power Ltd.
During post acquisition period (2011- 2013) it also observed that the post acquisition
Total Assets Turnover Ratio ranges between 0.033times to 2.09times. The highest
average of Total Assets Turnover Ratio found in Mahindra and Mahindra Ltd and the
lowest is found in Reliance Power Ltd.
During pre acquisition period (2007 – 2009) the Standard deviation of Total Assets
Turnover Ratio ranges between 0.006 and 0.462. The highest standard deviation is
found in Lanco Infratech Ltd and the lowest is found in Reliance Power Ltd.
During post acquisition period (2011 – 2013) the Standard deviation of Total Assets
Turnover Ratio ranges between 0.006 and 0.321. The highest standard deviation is
found in Lanco Infratech Ltd and the lowest is found in Reliance Power Ltd.
Comparing the Co-efficient of Variation of Selected companies in the pre and post
acquisition period from 2007 to 2013 the post acquisition Co-efficient of Variation is
high with respect to Bharti Airtel Ltd, Fortis Healthcare Ltd and GTL Infrastructure
Ltd. The study observed that the Total Assets Turnover Ratio Co-efficient of
Variation is considerably decreased in the post acquisition.
The analysis of Total Assets Turnover Ratio of Selected companies reveals the facts
which are as follows:
• Lower the ratio – while comparing the average of Total Assets Turnover Ratio in
pre and post acquisition period Bharti Airtel Ltd, Hindustan Zinc Ltd, Fortis
Healthcare Ltd and Jindal Steel and Power Ltd have considerably decreased. It

102
indicates lower sales revenue. The notion of low profit margin tends to have
negative impact on assets turnover.
• Higher the ratio – Hinduja Global Solutions Ltd, Lanco Infratech Ltd, Mahindra
and Mahindra Ltd, Tata Chemicals Ltd, GTL Infrastructure Ltd and Reliance
Power Ltd have considerably increased in Total Assets Turnover Ratio due to low
co-efficient of variation in post acquisition period.
Table: 3.2.8 Operating Profit Margin of Selected Companies
Companies Mean Standard Deviation
Co - efficient of Variation
Pre Post Pre Post Pre Post
BAL 40.25 32.52 1.359 2.70 3.38 8.30
HGSL 24.02 18.89 4.06 3.38 16.90 17.89
HZL 63.86 53.19 14.10 2.17 22.08 4.08
LIL 18.30 11.74 3.86 3.65 21.09 31.09
FHL 5.50 2.47 1.94 3.25 35.27 131.58
JSPL 39.04 31.40 4.29 5.60 10.99 17.83
M&ML 10.50 12.73 0.85 1.73 8.10 13.59
TCL 23.91 12.91 10.31 0.57 43.12 4.42
GTLIL 59.06 29.99 11.03 57.95 18.68 193.23
RPL 0 -469 0 386.99 0 -82.51 (Source: AGM reports of selected companies & moneycontrol.com database)
During the study period, the average Operating Profit Margin from 2007 to 2009 is
considered to be pre-acquisition period whereas 2010 to 2013 to be considered as post
acquisition period. The comparison of the pre and post-acquisition, Operating Profit
Margin of selected companies is shown in table – 3.2.8
During pre acquisition period (2007 – 2009) it is observed from the table that the pre
acquisition average Operating Profit Margin ranges between 0% and 63.86%. The
highest average of Operating Profit Margin is found in Hindustan Zinc Ltd and the
lowest is found in Reliance Power Ltd.

103
During post acquisition period (2011- 2013) it also observed that the post acquisition
Operating Profit Margin ranges between -469% to 53.19% . The highest average of
Operating Profit Margin found in Hindustan Zinc Ltd and the lowest is found in
Reliance Power Ltd.
During pre acquisition period (2007 – 2009) the Standard deviation of Operating
Profit Margin ranges between 0and 14.10. The highest standard deviation is found in
Hindustan Zinc Ltd and the lowest is found in Reliance Power Ltd.
During post acquisition period (2011 – 2013) the Standard deviation of Operating
Profit Margin ranges between 0.57 and 386.99. The highest standard deviation is
found in Reliance Power Ltd and the lowest is found in Tata Chemicals Ltd.
Comparing the Co-efficient of Variation of Selected companies in the pre and post
acquisition period from 2007 to 2013 the post acquisition Co-efficient of Variation is
high with respect to Bharti Airtel Ltd, Hinduja Global Solutions Ltd, Lanco Infratech
Ltd, Fortis Healthcare Ltd, Jindal Steel and Power Ltd, Mahindra and Mahindra Ltd
and GTL Infrastructure Ltd. The study observed that the Operating Profit Margin Co-
efficient of Variation is considerably increased in the post acquisition.
The analysis of Operating Profit Margin of Selected companies reveals the facts
which are as follows:
• Lower the ratio – while comparing the average of Operating Profit Margin in pre
and post acquisition period overall selected firms have considerably decreased
however, Mahindra and Mahindra Ltd was the exception. It indicates worsened on
account of lower cash flow streams generated by operating activities.
• Higher the ratio –Mahindra and Mahindra Ltd has considerably increased in
Operating Profit Margin due to low co-efficient of variation in post acquisition
period.
104
3. Examine the impact of Mergers and Acquisitions on value of the firms.
On analysis of examining the firm value measures, the total networth of the firms
in long run is explained herewith. Value added / shortfall ensures the percentage of
value addition and firm value ensures long term survival. In order to identify the
changes in Value added/Shortfall, economic value added and firm value after Mergers
and Acquisitions studies are made separately for each group. However, economic
value added model is used to identify the firm value. In this heading, an analysis has
been done with the help of Value added/Shortfall, economic value added and firm
value by using statistical tools like mean, standard deviation and co- efficient of
variance to examine the firm value of selected Mergers and Acquisitions during the
study period.
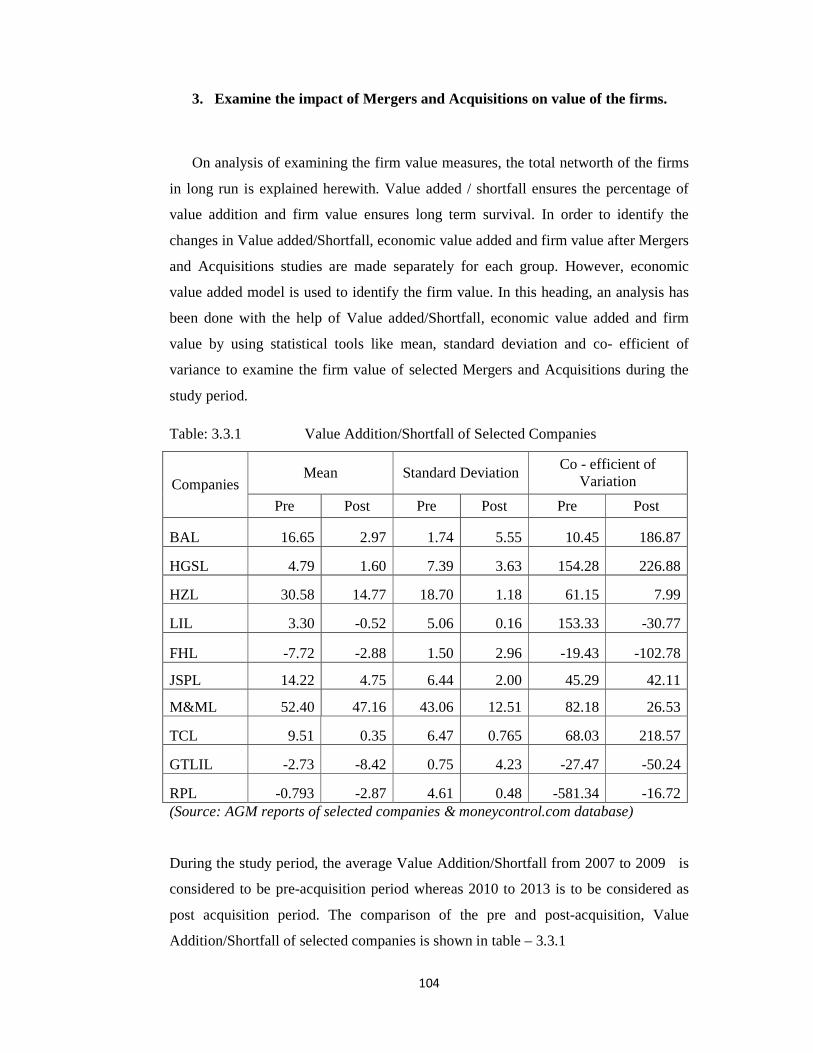
Table: 3.3.1 Value Addition/Shortfall of Selected Companies
Companies Mean Standard Deviation
Co - efficient of Variation
Pre Post Pre Post Pre Post
BAL 16.65 2.97 1.74 5.55 10.45 186.87
HGSL 4.79 1.60 7.39 3.63 154.28 226.88
HZL 30.58 14.77 18.70 1.18 61.15 7.99
LIL 3.30 -0.52 5.06 0.16 153.33 -30.77
FHL -7.72 -2.88 1.50 2.96 -19.43 -102.78
JSPL 14.22 4.75 6.44 2.00 45.29 42.11
M&ML 52.40 47.16 43.06 12.51 82.18 26.53
TCL 9.51 0.35 6.47 0.765 68.03 218.57
GTLIL -2.73 -8.42 0.75 4.23 -27.47 -50.24
RPL -0.793 -2.87 4.61 0.48 -581.34 -16.72 (Source: AGM reports of selected companies & moneycontrol.com database)
During the study period, the average Value Addition/Shortfall from 2007 to 2009 is
considered to be pre-acquisition period whereas 2010 to 2013 is to be considered as
post acquisition period. The comparison of the pre and post-acquisition, Value
Addition/Shortfall of selected companies is shown in table – 3.3.1

105
During pre acquisition period (2007 – 2009) it is observed from the table that the pre
acquisition average Value Addition/Shortfall ranges between (7.72%) and 52.40%.
The highest average of Value Addition is found in Mahindra & Mahindra Ltd and the
highest average of shortfall is found in Fortis Healthcare Ltd.
During post acquisition period (2011- 2013) it also observed that the post acquisition
Value Addition/Shortfall ranges between (8.42%) and 47.16%.The highest average of
Value Addition is found in Mahindra & Mahindra Ltd and the Highest average of
Shortfall is found in GTL Infrastructure Ltd.
During pre acquisition period (2007 – 2009) the Standard deviation of Value
Addition/Shortfall ranges between 0.75 and 43.06. The highest standard deviation is
found in Mahindra & Mahindra Ltd. The lowest standard deviation is found in GTL
Infrastructure Ltd.
During post acquisition period (2011 – 2013) the Standard deviation of Value
Addition ranges between 0.16 and 12.51. The highest standard deviation is found in
Mahindra & Mahindra Ltd. The lowest standard deviation is found in Lanco Infratech
Ltd.
Comparing the Co-efficient of Variation of Selected companies in the pre and post
acquisition period from 2007 to 2013 the post acquisition Co-efficient of Variation is
high with respect to Bharti Airtel, Hinduja Global Solutions Ltd and Tata Chemicals
Ltd. The study observed that the Value Addition Co-efficient of Variation is
considerably decreased in the post acquisition.
The analysis of Value Addition / Shortfall of Selected companies reveals the facts
which are as follows:
Lower the ratio – while comparing the average of Value Addition in pre and post
acquisition period overall selected companies have considerably decrease
performance due to high cost of capital in post acquisition. It indicates that
acceleration of the funds failed to increase its value addition.

106
Table: 3.3.2 Economic Value Added of Selected Companies
Companies Mean Standard Deviation
Co - efficient of Variation
Pre Post Pre Post Pre Post
BAL 4974.96 1737.72 2079.52 3564.20 41.80 205.11
HGSL 31.18 11.79 46.50 28.42 149.13 241.05
HZL 3084.70 4099.19 951.03 767.36 30.83 18.72
LIL 81.84 -37.94 104.15 10.55 127.26 -27.81
FHL -77.08 -118.80 5.79 127.73 -7.51 -107.52
JSPL 1236.45 1182.04 652.87 276.11 52.80 23.36
M&ML 876.44 2909.13 253.29 646.01 28.90 22.21
TCL 524.56 23.76 411.03 60.34 78.36 253.96
GTLIL -83.25 -329.51 82.69 99.92 -99.33 -30.32
RPL -170.24 -501.95 155.32 98.90 -91.24 -19.70 (Source: AGM reports of selected companies & moneycontrol.com database)
During the study period, the average Economic Value Added from 2007 to 2009 is
considered to be pre-acquisition period whereas 2010 to 2013 is to be considered as
post acquisition period. The comparison of the pre and post-acquisition, Economic
Value Added of selected companies is shown in table – 3.3.2
During pre acquisition period (2007 – 2009) it is observed from the table that the pre
acquisition average Economic Value Added ranges between (170.24)Crores and
4,974.96Crores. The highest average of Economic Value Added is found in Bharti
Airtel Ltd and the lowest average is found in Reliance Power Ltd.
During post acquisition period (2011- 2013) it also observed that the post acquisition
Economic Value Added ranges between (501.95)Crores and 4099.19Crores.The
highest average of Economic Value Added is found in Hindustan Zinc Ltd and the
Lowest average is found in Reliance Power Ltd.
During pre acquisition period (2007 – 2009) the Standard deviation of Economic
Value Added ranges between 5.79 and 2079.52. The highest standard deviation is

107
found in Bharti Airtel Ltd. The lowest standard deviation is found in Fortis Healthcare
Ltd.
During post acquisition period (2011 – 2013) the Standard deviation of Economic
Value Added ranges between 10.55 and 3564.20. The highest standard deviation is
found in Bharti Airtel Ltd. The lowest standard deviation is found in Lanco Infratech
Ltd.
Comparing the Co-efficient of Variation of Selected companies in the pre and post
acquisition period from 2007 to 2013 the post acquisition Co-efficient of Variation is
high with respect to Bharti Airtel, Hinduja Global Solutions Ltd and Tata Chemicals
Ltd. The study observed that the Economic Value Added Co-efficient of Variation is
considerably decreased in the post acquisition.
The analysis of Economic Value Added of Selected companies reveals the facts which
are as follows:
• Lower the ratio – while comparing the average of Economic Value Added in pre
and post acquisition period overall selected firms have considerably decreased
however, Hindustan Zinc Ltd and Mahindra & Mahindra Ltd was the exception. It
indicates worsened on account of lower cash flow streams generated by operating
activities.
• Higher the ratio – Hindustan Zinc Ltd and Mahindra and Mahindra Ltd has
considerably increased in Economic Value Added due to low co-efficient of
variation in post acquisition period.

108
Table: 3.3.3 Firm Value of Selected Companies
Companies Mean Standard Deviation
Co - efficient of Variation
Pre Post Pre Post Pre Post
BAL 31,032.92 63,356.63 11371.45 3987.58 36.64 6.29
HGSL 622.00 772.20 107.29 34.58 17.25 4.48
HZL 14,176.21 31,094.05 2554.44 5550.73 18.02 17.85
LIL 2,375.77 7,300.36 875.83 412.16 36.87 5.65
FHL 932.58 3,883.55 129.89 425.51 13.93 10.96
JSPL 9,235.51 26,865.20 2731.39 5624.99 29.57 20.94
M&ML 7,963.11 17,911.67 1828.09 3019.59 22.96 16.86
TCL 6,068.77 7,674.45 2056.49 146.38 33.89 1.91
GTLIL 3,005.10 5,427.08 1840.56 1227.13 61.25 22.61
RPL 9,012.03 16,941.16 7643.87 1247.68 84.82 7.36 (Source: AGM reports of selected companies & moneycontrol.com database)
During the study period, the average Firm Value from 2007 to 2009 is considered to
be pre-acquisition period whereas 2010 to 2013 is to be considered as post acquisition
period. The comparison of the pre and post-acquisition, Firm Value of selected
companies is shown in table – 3.3.3
During pre acquisition period (2007 – 2009) it is observed from the table that the pre
acquisition average Firm Value ranges between 622Crores and 31,032.92Crores. The
highest average of Firm Value is found in Bharti Airtel Ltd and the lowest average is
found in Hinduja Global Solutions Ltd.
During post acquisition period (2011- 2013) it also observed that the post acquisition
Firm Value ranges between 722Crores and 65,356.63Crores.The highest average of
Firm Value is found in Bharti Airtel Ltd and the Lowest average is found in Reliance
Hinduja Global Solutions Ltd.
During pre acquisition period (2007 – 2009) the Standard deviation of Economic
Value Added ranges between 107.29 and 11,371.45. The highest standard deviation is

109
found in Bharti Airtel Ltd. The lowest standard deviation is found in Hinduja Global
Solutions Ltd.
During post acquisition period (2011 – 2013) the Standard deviation of Economic
Value Added ranges between 34.58 and 5624.99. The highest standard deviation is
found in Jindal Steel and Power Ltd. The lowest standard deviation is found in
Hinduja Global Solutions Ltd.
Comparing the Co-efficient of Variation of Selected companies in the pre and post
acquisition period from 2007 to 2013 the post acquisition Co-efficient of Variation is
low with respect to overall selected companies. The study observed that the Firm
Value Co-efficient of Variation is considerably decreased in the post acquisition.
The analysis of Economic Value Added of Selected companies reveals the facts which
are as follows:
• Higher the ratio – All selected firms have considerably increased in Firm Value
due to low co-efficient of variation in post acquisition period.

110
4. Determining the Value Addition/ Short fall of selected Mergers and Acquisitions
This is an analysis to determine the Value Added or short fall measures of the
value addition or value destroyed. Value creation is essential for any company for
long run survival. In order to identify the value added/ shortfall, economic value
added and firm value of selected Mergers and Acquisitions during the study period
from 2007 to 2013, the studies are made separately for each group. However, few
calculations are used to identify the value creation. In this heading, an analysis has
been done with the help of the following calculations:
• Calculation of NOPAT
• Calculation of Adjusted Capital
• Calculation of WACC
• Calculation of Ke and Kd
• Consolidated EVA annual Summary
• Calculation of value added or shortfall
• Calculation of Firm Value
In this context, the value addition/ shortfall and firm value are determined through
Economic Value Added model. The value added / Short and firm value has been done
for all selected companies in such a way as to measure the different components of
Economic Value Added model namely; Economic Value Added, value added/shortfall
and firm value.

111
Table: 3.4.1 Calculation of NOPAT (Bharti Airtel Ltd)
(Rs. in Crore) Particulars 2007 2008 2009 2010 2011 2012 2013
EBDIT 7,366.16 10,766.45 11,953.93 15,084.80 13,661.50 14,268.40 14,933.80
-Depreciation 2,353.30 3,166.58 3,206.28 3,890.08 4,611.60 5,916.00 6,826.70
EBIT 5,012.86 7,599.87 8,747.65 11,194.72 9,049.90 8,352.40 8,107.10
Tax Rate (%) 12.31% 9.19% 3.98% 11.06% 11.560% 17.23% 21.05% EBIT (1-t) or
NOPAT 4,395.78 6,901.44 8,399.49 9,956.58 8,003.73 6,913.28 6,400.56
Table: 3.4.2 Calculation of Adjusted Capital (BA) (Rs. in Crore)
Years 2007 2008 2009 2010 2011 2012 2013
Equity 11443.27 20241.49 27643.97 36737.18 44111.60 49429.60 54146.20
Debt 5310.81 6570.34 7713.65 5038.92 10233.10 14129.40 12979.80
Total CE 16754.08 26811.83 35357.62 41776.10 54344.70 63559.00 67126.00
(+) Depreciation 2353.30 3166.58 3206.28 3890.08 4611.60 5916.00 6826.70
Adjusted capital 19107.38 29978.41 38563.90 45666.18 58956.30 69475.00 73952.70

112
Table: 3.4.3 Calculation of WACC (BA)
Years
Equity Rs
in Crores
Debt Rs in
Crores Total CE
Weight of
Equity
Weight of
Debt Kd Ke WACC Ko
2007 11443.27 5310.81 16,754.08 0.68 - 0.000 0.12160 0.083 8.31
2008 20241.49 6570.34 26,811.83 0.75 0.25 0.060 0.05748 0.058 5.81
2009 27643.97 7713.65 35,357.62 0.78 0.22 0.056 0.03219 0.037 3.74
2010 36737.18 5038.92 41,776.10 0.88 0.12 0.056 0.04594 0.047 4.72
2011 44111.60 10233.10 54,344.70 0.81 0.19 0.032 0.06182 0.056 5.61
2012 49429.60 14129.40 63,559.00 0.78 0.22 0.099 0.04900 0.060 6.01
2013 54146.20 12979.80 67,126.00 0.81 0.19 0.127 0.11400 0.117 11.66 Table: 3.4.4 Calculation of Ke and Kd (BA)
Years 2007 2008 2009 2010 2011 2012 2013
Beta -0.56 0.006 -0.103 -0.19 -0.07 -0.1 0.36
Market return -0.05 -0.36 0.33 0.134 0.034 0.17 0.21
Risk free rate 0.06 0.06 0.06 0.06 0.06 0.06 0.06
Interest in Crores 282.07 393.43 434.16 283.35 324.1 1396.2 1652.3
Kd 5.31 5.99 5.63 5.62 3.17 9.88 12.73
Ke 0.122 0.057 0.032 0.046 0.062 0.049 0.114
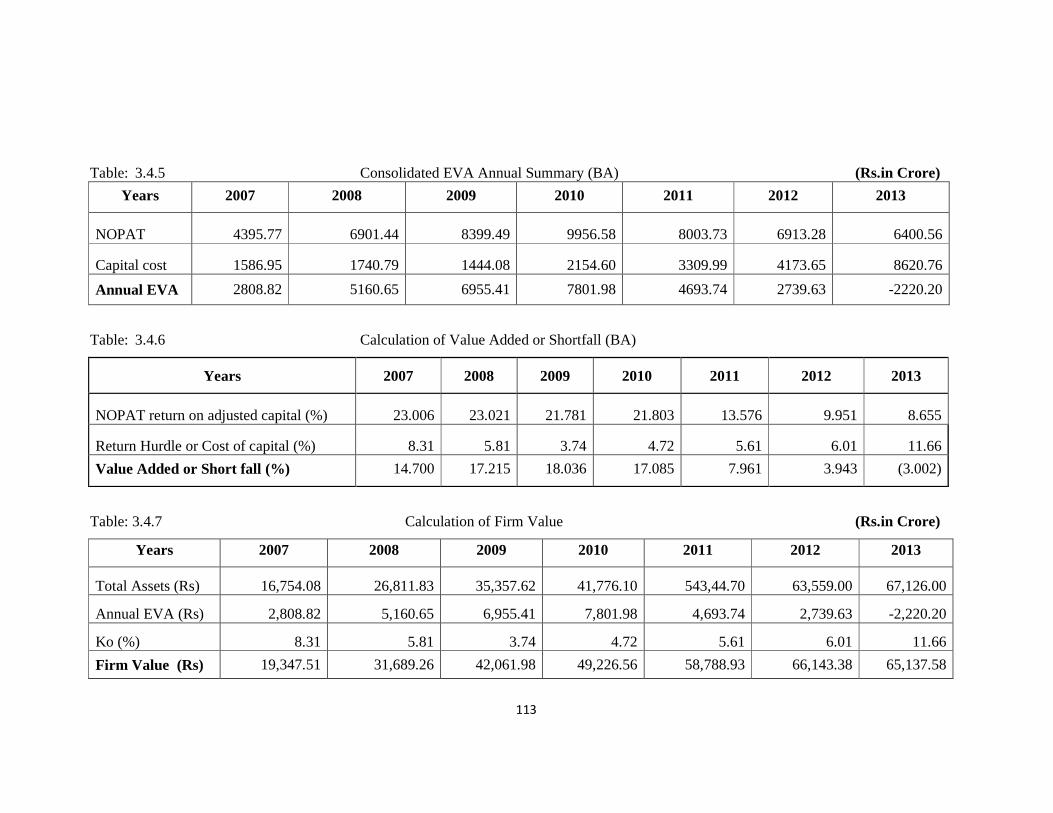
113
Table: 3.4.5 Consolidated EVA Annual Summary (BA) (Rs.in Crore)
Years 2007 2008 2009 2010 2011 2012 2013
NOPAT 4395.77 6901.44 8399.49 9956.58 8003.73 6913.28 6400.56
Capital cost 1586.95 1740.79 1444.08 2154.60 3309.99 4173.65 8620.76
Annual EVA 2808.82 5160.65 6955.41 7801.98 4693.74 2739.63 -2220.20
Table: 3.4.6 Calculation of Value Added or Shortfall (BA)
Years 2007 2008 2009 2010 2011 2012 2013
NOPAT return on adjusted capital (%) 23.006 23.021 21.781 21.803 13.576 9.951 8.655
Return Hurdle or Cost of capital (%) 8.31 5.81 3.74 4.72 5.61 6.01 11.66
Value Added or Short fall (%) 14.700 17.215 18.036 17.085 7.961 3.943 (3.002)
Table: 3.4.7 Calculation of Firm Value (Rs.in Crore)
Years 2007 2008 2009 2010 2011 2012 2013
Total Assets (Rs) 16,754.08 26,811.83 35,357.62 41,776.10 543,44.70 63,559.00 67,126.00
Annual EVA (Rs) 2,808.82 5,160.65 6,955.41 7,801.98 4,693.74 2,739.63 -2,220.20
Ko (%) 8.31 5.81 3.74 4.72 5.61 6.01 11.66
Firm Value (Rs) 19,347.51 31,689.26 42,061.98 49,226.56 58,788.93 66,143.38 65,137.58

Table: 3.4.8 Calculation of Firm Value in Pre and Post Period from 2007
Particulars
Firm Value Pre-3 years from (2007-2009)
Firm Value Post-3 years from (2011-2013)
Chart: 3.1 Total Firm Value of Bharti Airtel
2007
Firm Value in Crores 19,347.51
19,347.51
0.00
10,000.00
20,000.00
30,000.00
40,000.00
50,000.00
60,000.00
70,000.00
80,000.00
Rs.
in C
rore
s
114
Calculation of Firm Value in Pre and Post Period from 2007-2009 to 2011-2013
Firm Value (Rs.in Crore)
49,333.96
71,929.94
Total Firm Value of Bharti Airtel Ltd from 2007-2013
2008 2009 2010 2011
31,689.26 42,061.98 49,226.56 58,788.93
49,226.56
Firm Value of Bharti Airtel LtdFirm Value in Crores Poly. (Firm Value in Crores)
2013
2012 2013
66,143.38 65,137.58
65,137.58
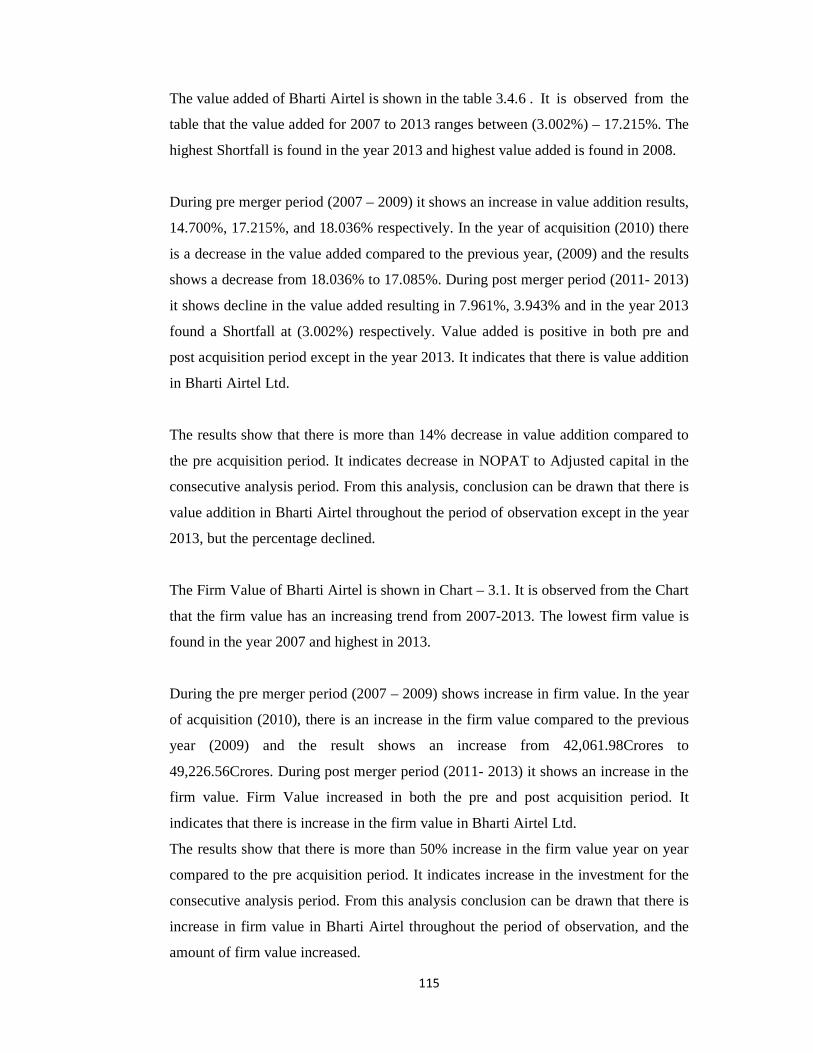
115
The value added of Bharti Airtel is shown in the table 3.4.6 . It is observed from the
table that the value added for 2007 to 2013 ranges between (3.002%) – 17.215%. The
highest Shortfall is found in the year 2013 and highest value added is found in 2008.
During pre merger period (2007 – 2009) it shows an increase in value addition results,
14.700%, 17.215%, and 18.036% respectively. In the year of acquisition (2010) there
is a decrease in the value added compared to the previous year, (2009) and the results
shows a decrease from 18.036% to 17.085%. During post merger period (2011- 2013)
it shows decline in the value added resulting in 7.961%, 3.943% and in the year 2013
found a Shortfall at (3.002%) respectively. Value added is positive in both pre and
post acquisition period except in the year 2013. It indicates that there is value addition
in Bharti Airtel Ltd.
The results show that there is more than 14% decrease in value addition compared to
the pre acquisition period. It indicates decrease in NOPAT to Adjusted capital in the
consecutive analysis period. From this analysis, conclusion can be drawn that there is
value addition in Bharti Airtel throughout the period of observation except in the year
2013, but the percentage declined.
The Firm Value of Bharti Airtel is shown in Chart – 3.1. It is observed from the Chart
that the firm value has an increasing trend from 2007-2013. The lowest firm value is
found in the year 2007 and highest in 2013.
During the pre merger period (2007 – 2009) shows increase in firm value. In the year
of acquisition (2010), there is an increase in the firm value compared to the previous
year (2009) and the result shows an increase from 42,061.98Crores to
49,226.56Crores. During post merger period (2011- 2013) it shows an increase in the
firm value. Firm Value increased in both the pre and post acquisition period. It
indicates that there is increase in the firm value in Bharti Airtel Ltd.
The results show that there is more than 50% increase in the firm value year on year
compared to the pre acquisition period. It indicates increase in the investment for the
consecutive analysis period. From this analysis conclusion can be drawn that there is
increase in firm value in Bharti Airtel throughout the period of observation, and the
amount of firm value increased.

116
Table: 3.4.9 Calculation of NOPAT (Hinduja Global Solutions Ltd) (Rs.in Crore)
Particulars 2007 2008 2009 2010 2011 2012 2013
EBDIT 31.62 89.24 109.98 142.58 129.95 117.32 133.43
-Depreciation 11.43 23.37 28.15 33.60 38.04 36.14 38.60
EBIT 20.19 65.87 81.83 108.98 91.91 81.18 94.83
Tax Rate (%) -0.05% 10.90% 17.09% 6.41% 14.970% 13.29% 30.33%
EBIT (1-t) or NOPAT 20.20 58.69 67.85 101.99 78.15 70.39 66.07
Table: 3.4.10 Calculation of Adjusted Capital (HGSL) (Rs.in Crore)
Years 2007 2008 2009 2010 2011 2012 2013
Equity 504.22 539.00 564.87 613.70 641.19 653.47 664.61
Debt 0.00 74.74 87.02 51.41 61.21 130.61 131.37
Total CE 504.22 613.74 651.89 665.11 702.40 784.08 795.98
(+) Depreciation 11.43 23.37 28.15 33.60 38.04 36.14 38.60
Adjusted capital 515.65 637.11 680.04 698.71 740.44 820.22 834.58

117
Table: 3.4.11 Calculation of WACC (HGSL)
Years
Equity Rs
in Crores
Debt Rs in
Crores Total CE
Weight of
Equity
Weight of
Debt Kd Ke WACC Ko
2007 504.22 0.00 504.22 1.00 - 0.000 0.04810 0.048 4.81
2008 539.00 74.74 613.74 0.88 0.12 0.018 -0.04730 -0.039 -3.93
2009 564.87 87.02 651.89 0.87 0.13 0.099 0.07550 0.079 7.86
2010 613.70 51.41 665.11 0.92 0.08 0.149 0.05320 0.061 6.06
2011 641.19 61.21 702.40 0.91 0.09 0.091 0.05560 0.059 5.87
2012 653.47 130.61 784.08 0.83 0.17 0.084 0.05580 0.061 6.06
2013 664.61 131.37 795.98 0.83 0.17 0.132 0.09750 0.103 10.32 Table: 3.4.12 Calculation of Ke and Kd (HGSL)
Years 2007 2008 2009 2010 2011 2012 2013
Beta 0.220 0.220 0.070 -0.090 0.069 -0.033 0.200
Market return 0.010 -0.430 0.270 0.133 -0.004 0.189 0.246
Risk free rate % 0.06 0.06 0.06 0.06 0.06 0.06 0.06
Interest in Crores 0.35 1.35 8.59 7.65 5.59 11.02 17.31
Kd 0.00 1.81 9.87 14.88 9.13 8.44 13.18
Ke 0.048 -0.047 0.076 0.053 0.056 0.056 0.098

118
Table: 3.4.13 Consolidated EVA Annual Summary (HGSL) (Rs.in Crore)
Years 2007 2008 2009 2010 2011 2012 2013
NOPAT 20.20 58.69 67.85 1,01.99 78.15 70.39 66.07
Capital cost 24.80 (25.06) 53.45 42.34 43.47 49.67 86.09
Annual EVA (4.60) 83.75 14.40 59.65 34,68 20.72 (20,02)
Table: 3.4.14 Calculation of Value Added or ShortFall (HGSL)
Years 2007 2008 2009 2010 2011 2012 2013
NOPAT return on adjusted capital (%) 3.917 9.212 9.977 4.598 10.555 8.582 7.916
Return Hurdle or Cost of capital (%) 4.81 -3.93 7.86 6.06 5.87 6.06 10.32
Value Added or Short fall (%) (0.893) 13.146 2.117 8.539 4.683 2.526 (2.399)
Table: 3.4.15 Calculation of Firm Value (HGSL) (Rs.in Crore)
Years 2007 2008 2009 2010 2011 2012 2013
Total Assets 504.22 613.74 651.89 665.11 702.40 784.08 795.98
Annual EVA -4.60 83.75 14.40 59.65 34.68 20.72 -20.02
Ko 4.81 -3.93 7.86 6.06 5.87 6.06 10.32
Firm Value 499.83 700.92 665.24 721.36 735.15 803.62 777.83

Table: 3.4.16 Calculation of Firm Value in Pre and Post Period from 2007
Particulars Firm Value Pre-3 years from (2007-2009) Firm Value Post-3 years from (2011-2013)
Chart: 3.2 Total Firm Value of Hinduja Global Solutions L
2007
Firm Value in Crores 499.83
499.83
0
100
200
300
400
500
600
700
800
900
Rs.
in C
rore
s
Firm Value of Hinduja Global solutions Ltd
119
Calculation of Firm Value in Pre and Post Period from 2007-2009 to 2011-2013
Firm Value(Rs.in Crore) 748.23 828.30
l Firm Value of Hinduja Global Solutions Ltd from 2007-2013
2008 2009 2010 2011
700.92 665.24 721.36 735.15
721.36
Firm Value of Hinduja Global solutions LtdFirm Value in Crores Poly. (Firm Value in Crores)
2012 2013
803.62 777.83
777.83
Firm Value of Hinduja Global solutions LtdPoly. (Firm Value in Crores)

120
The value addition of Hinduja Global Solutions Ltd is shown in the table – 3.4.14. It
is observed from the table that the value added for 2007 to 2013 ranges between
(2.399%) – 13.146%. The highest Shortfall is found in the year 2013 and highest
value added is found in 2008. During pre merger period (2007 – 2009), results found
in the year 2008 and 2009 declined in value added from 13.146% to 2.117%, and the
firm had Shortfall in the year 2007 at (0.893%). In the year of acquisition (2010),
there is an increase in the value added compared to the previous year, (2009) and the
result shows an increase from 2.117% to 8.539%. During post merger period (2011-
2013), results found in the year 2010 and 2011 decline in the Value Added from
4.683% to 2.526% and the firm has Shortfall in the year 2013 at (2.399%). The firm
has Value Addition in both pre and post acquisition period except in the year 2007
and 2013. It indicates that more Value Added and less Shortfall in Hinduja Global
Solutions Ltd.
The results show that there is decrease in value added comparatively to the pre
acquisition period. It indicates high variations in NOPAT to Adjusted Capital and cost
of overall capital for the consecutive analysis period. From this analysis conclusion
can be drawn that there is less value addition in Hinduja Global Solutions throughout
the period of observation, but percentage of value added is less and the firm not
improved the performance in the post period compared to the pre acquisition period.
The Firm Value of Hinduja Global Solutions is shown in the Chart 3.2. It is observed
from the Chart that the firm value has an increasing trend from 2007-2013. The
lowest firm value is found in the year 2007 and highest firm value in 2013. During pre
merger period (2007 – 2009) it shows increase in firm value. In the year of acquisition
(2010), there is an increase in the value added compared to the previous year (2009)
and the result shows an increase from 665.24Crores to 721.36Crores. During post
merger period (2011- 2013) it shows an increase in the firm value. Firm Value
increased in both the pre and post acquisition period. It indicates that there is increase
in firm value in Hinduja Global Solutions Ltd (HGSL).
The results show that there is more than 50% increase in firm value year on year
comparatively to the pre acquisition period. It indicates increase in the investment and
decrease in the cost of capital for the consecutive analysis period. From this analysis
conclusion can be drawn that there is increase in firm value in HGSL throughout the
period of observation and the amount of firm value increased.

121
Table: 3.4.17 Calculation of NOPAT (Hindustan Zinc Ltd) (Rs. in Crore)
Particulars 2007 2008 2009 2010 2011 2012 2013
EBDIT 6,630.43 6,082.31 3,657.24 5,381.65 6,450.55 7,569.16 8,496.26
-Depreciation 156.08 220.51 285.27 334.25 474.74 610.67 647.04
EBIT 6,474.35 5,861.80 3,371.97 5,047.40 5,975.81 6,958.49 7,849.22
Tax Rate (%) 31.44% 27.52% 19.56% 19.40% 17.500% 20.33% 11.65%
EBIT (1-t) or NOPAT 4,438.81 4,248.63 2,712.41 4,068.20 4,930.04 5,543.83 6,934.79
Table: 3.4.18 Calculation of Adjusted Capital (HZL) (Rs. in Crore)
Years 2007 2008 2009 2010 2011 2012 2013
Equity 7627.06 11848.19 14357.58 18123.97 22533.19 26881.26 32275.74
Debt 0.39 0.39 8.69 60.47 0.39 0.39 0.39
Total CE 7627.45 11848.58 14366.27 18184.44 22533.58 26881.65 32276.13
(+) Depreciation 156.08 220.51 285.27 334.25 474.74 610.67 647.04
Adjusted capital 7783.53 12069.09 14651.54 18518.69 23008.32 27492.32 32923.17

122
Table: 3.4.19 Calculation of WACC (HZL)
Years Equity (Rs in Crores)
Debt (Rs in Crores) Total CE
Weight of Equity
Weight of Debt Kd Ke WACC Ko
2007 7627.06 0.39 7,627.45 1.00 0.00 0.143 0.06082 0.061 6.08
2008 11848.19 0.39 11,848.58 1.00 0.00 0.143 0.08585 0.086 8.59
2009 14357.58 8.69 14,366.27 1.00 0.00 0.143 0.04336 0.043 4.34
2010 18123.97 60.47 18,184.44 1.00 0.00 0.143 0.06549 0.066 6.57
2011 22533.19 0.39 22,533.58 1.00 0.00 0.143 0.05703 0.057 5.70
2012 26881.26 0.39 26,881.65 1.00 0.00 0.143 0.06722 0.067 6.72
2013 32275.74 0.39 32,276.13 1.00 0.00 0.143 0.05925 0.059 5.92 Table: 3.4.20 Calculation of Ke and Kd (HZL)
Years 2007 2008 2009 2010 2011 2012 2013
Beta 0.137 -0.055 -0.104 0.061 0.053 0.056 -0.004
Market return 0.066 -0.41 0.22 0.15 0.004 0.189 0.248
Risk free rate % 0.06 0.06 0.06 0.06 0.06 0.06 0.06
Interest in Crores 28.44 23.05 21.88 40.75 18.28 13.95 29.1
Kd (%) 14.25 14.25 14.25 14.25 14.25 14.25 14.25
Ke (%) 6.09 8.59 4.33 6.52 5.70 6.73 5.92

123
Table: 3.4.21 Consolidated EVA Annual Summary (HZL) (Rs. in Crore)
Years 2007 2008 2009 2010 2011 2012 2013
NOPAT 4,438.81 4,248.63 2,712.41 4,068.20 4,930.04 5,543.83 6,934.79
Capital cost 473.44 1,036.15 636.17 1,217.53 1,312.24 1,848.17 1,950.67
Annual EVA 3,965.37 3,212.48 2,076.24 2,850.67 3,617.80 3.695.66 4,984.12
Table: 3.4.22 Calculation of Value Added or Shortfall (HZL)
Years 2007 2008 2009 2010 2011 2012 2013
NOPAT return on adjusted capital (%) 57.028 35.203 18.513 21.968 21.427 20.165 21.064
Return Hurdle or Cost of capital (%) 6.08 8.59 4.34 6.57 5.70 6.72 5.92
Value Added or Short fall (%) 50.946 26.617 14.171 15.393 15.724 13.443 15.139
Table: 3.4.23 Calculation of Firm Value (HZL) (Rs. in Crore)
Years 2007 2008 2009 2010 2011 2012 2013
Total Assets 7,627.45 11,848.58 14,366.27 18,184.44 22,533.58 26,881.65 32,276.13
Annual EVA 3,965.37 3,212.48 2,076.24 2,850.67 3,617.80 3.695.66 4,984.12
Ko (%) 6.08 8.59 4.34 6.57 5.70 6.72 5.92
Firm Value 11,365.45 14,807.07 16,356.11 20,859.25 25,956.18 30,344.51 36,981.46

Table: 3.4.24 Calculation of Firm Value in Pre and Post Period from 2007
Particulars
Firm Value Pre-3 years from (2007-2009) Firm Value Post-3 years from (2011-2013)
Chart: 3.3 Total
2007
Firm Value in Crores 11,365.45
11,365.45
0.00
5,000.00
10,000.00
15,000.00
20,000.00
25,000.00
30,000.00
35,000.00
40,000.00
Rs.
in C
rore
s
Firm Value in Crores
124
Calculation of Firm Value in Pre and Post Period from 2007-2009 to 2011-2013
Firm Value (Rs. in Crore)
22,838.27 43,682.25
otal Firm Value of Hindustan Zinc Ltd from 2007-2013
2008 2009 2010 2011
14,807.07 16,356.11 20,859.25 25,956.18
20,859.25
Firm Value of Hindustan Zinc LtdFirm Value in Crores Poly. (Firm Value in Crores)
2012 2013
30,344.51 36,981.46
36,981.46
Poly. (Firm Value in Crores)
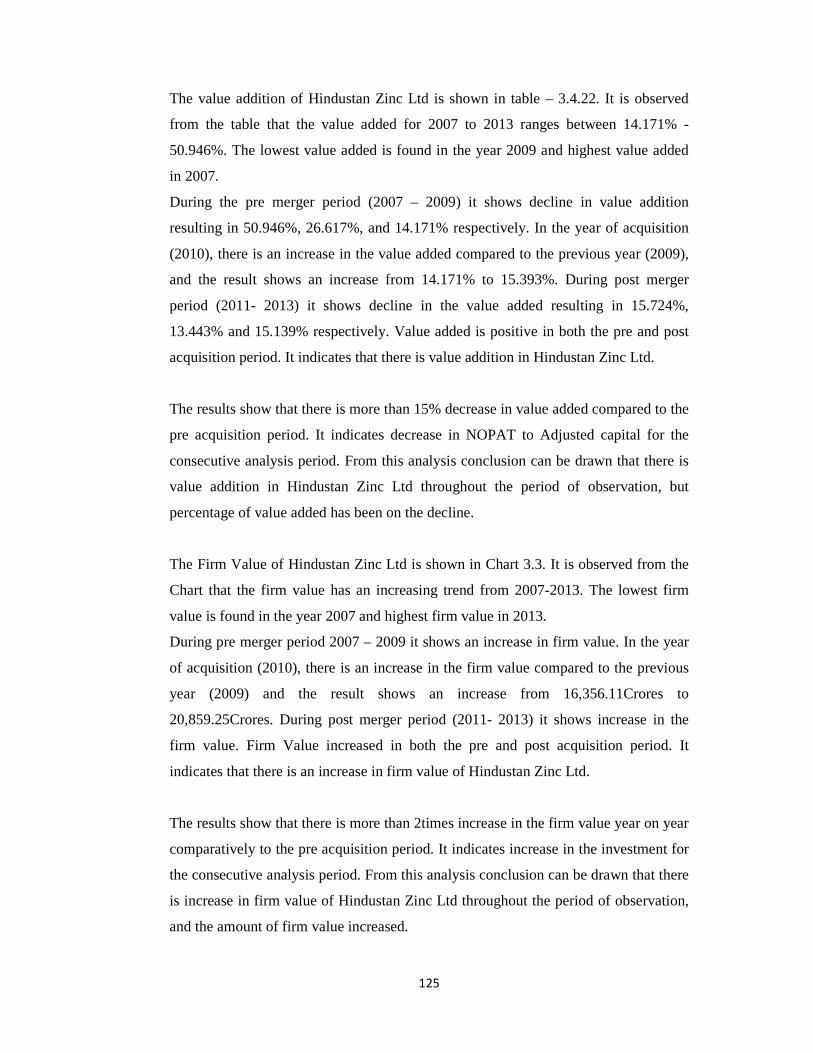
125
The value addition of Hindustan Zinc Ltd is shown in table – 3.4.22. It is observed
from the table that the value added for 2007 to 2013 ranges between 14.171% -
50.946%. The lowest value added is found in the year 2009 and highest value added
in 2007.
During the pre merger period (2007 – 2009) it shows decline in value addition
resulting in 50.946%, 26.617%, and 14.171% respectively. In the year of acquisition
(2010), there is an increase in the value added compared to the previous year (2009),
and the result shows an increase from 14.171% to 15.393%. During post merger
period (2011- 2013) it shows decline in the value added resulting in 15.724%,
13.443% and 15.139% respectively. Value added is positive in both the pre and post
acquisition period. It indicates that there is value addition in Hindustan Zinc Ltd.
The results show that there is more than 15% decrease in value added compared to the
pre acquisition period. It indicates decrease in NOPAT to Adjusted capital for the
consecutive analysis period. From this analysis conclusion can be drawn that there is
value addition in Hindustan Zinc Ltd throughout the period of observation, but
percentage of value added has been on the decline.
The Firm Value of Hindustan Zinc Ltd is shown in Chart 3.3. It is observed from the
Chart that the firm value has an increasing trend from 2007-2013. The lowest firm
value is found in the year 2007 and highest firm value in 2013.
During pre merger period 2007 – 2009 it shows an increase in firm value. In the year
of acquisition (2010), there is an increase in the firm value compared to the previous
year (2009) and the result shows an increase from 16,356.11Crores to
20,859.25Crores. During post merger period (2011- 2013) it shows increase in the
firm value. Firm Value increased in both the pre and post acquisition period. It
indicates that there is an increase in firm value of Hindustan Zinc Ltd.
The results show that there is more than 2times increase in the firm value year on year
comparatively to the pre acquisition period. It indicates increase in the investment for
the consecutive analysis period. From this analysis conclusion can be drawn that there
is increase in firm value of Hindustan Zinc Ltd throughout the period of observation,
and the amount of firm value increased.

126
Table: 3.3.25 Calculation of NOPAT (Lanco Infratech Ltd) (Rs. in Crore)
Particulars 2007 2008 2009 2010 2011 2012 2013
EBDIT 125.82 342.35 582.18 977.81 830.12 712.83 738.03
-Depreciation 3.69 11.62 40.53 59.77 72.06 101.44 127.49
EBIT 122.13 330.73 541.65 918.04 758.06 611.39 610.54
Tax Rate 27.53% 32.62% 34.28% 32.46% 33.690% -8.85% -30.43%
EBIT (1-t) or NOPAT 88.51 222.85 355.97 620.04 502.67 665.50 796.33
Table: 3.4.26 Calculation of Adjusted Capital (LIL) (Rs. in Crore)
Years 2007 2008 2009 2010 2011 2012 2013
Equity 1379.26 1593.10 1861.51 3160.64 3439.45 3595.50 3632.24
Debt 159.51 552.86 1343.14 2733.75 3797.08 3392.84 4148.40
Total CE 1538.77 2145.96 3204.65 5894.39 7236.53 6988.34 7780.64
(+) Depreciation 3.69 11.62 40.53 59.77 72.06 101.44 127.49
Adjusted capital 1542.46 2157.58 3245.18 5954.16 7308.59 7089.78 7908.13
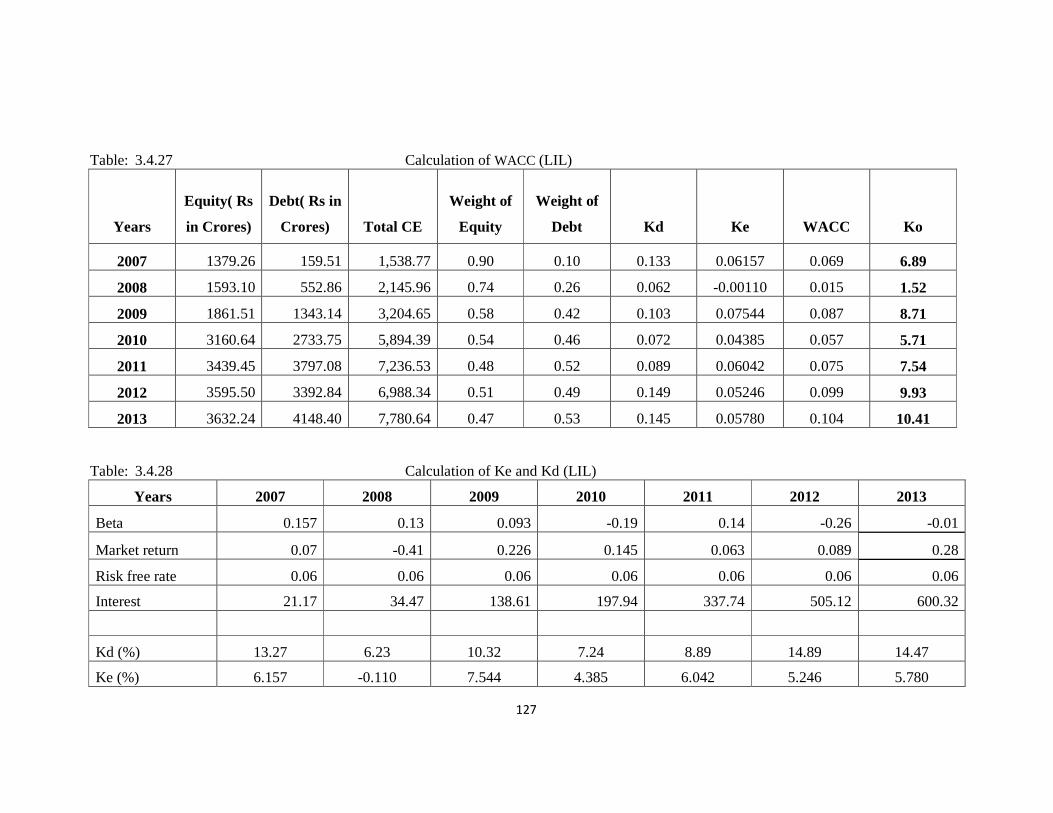
127
Table: 3.4.27 Calculation of WACC (LIL)
Years
Equity( Rs
in Crores)
Debt( Rs in
Crores) Total CE
Weight of
Equity
Weight of
Debt Kd Ke WACC Ko
2007 1379.26 159.51 1,538.77 0.90 0.10 0.133 0.06157 0.069 6.89
2008 1593.10 552.86 2,145.96 0.74 0.26 0.062 -0.00110 0.015 1.52
2009 1861.51 1343.14 3,204.65 0.58 0.42 0.103 0.07544 0.087 8.71
2010 3160.64 2733.75 5,894.39 0.54 0.46 0.072 0.04385 0.057 5.71
2011 3439.45 3797.08 7,236.53 0.48 0.52 0.089 0.06042 0.075 7.54
2012 3595.50 3392.84 6,988.34 0.51 0.49 0.149 0.05246 0.099 9.93
2013 3632.24 4148.40 7,780.64 0.47 0.53 0.145 0.05780 0.104 10.41 Table: 3.4.28 Calculation of Ke and Kd (LIL)
Years 2007 2008 2009 2010 2011 2012 2013
Beta 0.157 0.13 0.093 -0.19 0.14 -0.26 -0.01
Market return 0.07 -0.41 0.226 0.145 0.063 0.089 0.28
Risk free rate 0.06 0.06 0.06 0.06 0.06 0.06 0.06
Interest 21.17 34.47 138.61 197.94 337.74 505.12 600.32
Kd (%) 13.27 6.23 10.32 7.24 8.89 14.89 14.47
Ke (%) 6.157 -0.110 7.544 4.385 6.042 5.246 5.780

128
Table: 3.4.29 Consolidated EVA Annual Summary (LIL) (Rs. in Crore)
Years 2007 2008 2009 2010 2011 2012 2013
NOPAT 88.51 222.85 355.97 620.04 502.67 665.50 796.33
Capital cost 106.34 32.90 282.57 3,39,95 550.98 703.81 823.54
Annual EVA (17.83) 189.95 73.40 280.09 (48,31) (38,31) (27,21)
Table: 3.4.30 Calculation of Value Added or ShortFall (LIL)
Years 2007 2008 2009 2010 2011 2012 2013
NOPAT return on adjusted capital (%) 5.738 10.329 10.969 10.414 6.878 9.387 10.070
Return Hurdle or Cost of capital (%) 6.89 1.52 8.71 5.71 7.54 9.93 10.41
Value Added or Short fall (%) (1.156) 8.804 2.262 4.704 (0.661) (0.540) (0.344)
Table: 3.4.31 Calculation of Firm Value (LIL) (Rs. in Crore)
Years 2007 2008 2009 2010 2011 2012 2013
Total Assets 1,538.77 2,145.96 3,204.65 5,894.39 7,236.53 6,988.34 7,780.64
Annual EVA (17.83) 189.95 73.40 280.09 (48,31) (38,31) (27,21)
Ko (%) 6.89 1.52 8.71 5.71 7.54 9.93 10.41
Firm Value 1,522.08 2,333.06 3,272.18 6,159.36 7,191.60 6,953.49 7,755.99

Table: 3.4.32 Calculation of Firm Value in Pre and Post Period from 2007
Particulars
Firm Value Pre-3 years from (2007-2009)
Firm Value Post-3 years from (2011-2013)
Chart: 3.4 Total Firm Value of Lanco Infratech
2007
Firm Value in Crores 1,522.08
1,522.08
0.00
1,000.00
2,000.00
3,000.00
4,000.00
5,000.00
6,000.00
7,000.00
8,000.00
9,000.00
Rs.
in C
rore
s
129
Calculation of Firm Value in Pre and Post Period from 2007-2009 to 2011-2013
Firm Value(Rs. in Crore)
3,443.66
7,679.36
alue of Lanco Infratech Ltd from 2007-2013
2008 2009 2010 2011
2,333.06 3,272.18 6,159.36 7,191.60
6,159.36
Firm Value of Lanco Infratech LtdFirm Value in Crores Poly. (Firm Value in Crores)
2012 2013
6,953.49 7,755.99
7,755.99

130
The value addition of Lanco Infratech Ltd is shown in table – 3.4.30. It is observed
from the table that the value added for 2007 to 2013 ranges between (1.156%) –
8.804%. The Highest short fall is found in the year 2007 and the highest value added
is found in 2008. During pre merger period (2007 – 2009) results found in the year
2007 have Shortfall (1.156%) but in the year 2008 and 2009 the value addition was
resulted 8.804% and 2.262%. In the year of acquisition (2010), there is an increase in
the value added compared to the previous year (2009) and the result shows an
increase from 2.262% to 4.704%. During post merger period (2011- 2013) it shows
decreasse in the shortfall resulting in (0.661%), (0.540%) and (0.344%) respectively.
Value added is negative in the post acquisition period. It indicates that there is no
value addition in Lanco Infratech Ltd after the acquisition period.
The results show that there is decrease in value added comparatively to the pre
acquisition period. It indicates high variations in NOPAT to Adjusted capital and cost
of overall capital for the consecutive analysis period. From this analysis, conclusion
can be drawn that there is less value addition in Lanco Infratech Ltd throughout the
period of observation, but percentage of value added is less and the firm has improved
performance in the pre period compared to the post acquisition period.
The Firm Value of Lanco Infratech Ltd is shown in the Chart – 3.4 . It is observed
from the Chart that the firm value has an increasing trend from 2007-2013. The
lowest firm value is found in the year 2007 and highest firm value in 2013. During pre
merger period (2007 – 2009) shows increase in firm value. In the transaction
occurring year of acquisition (2010), there is an increase in the firm value compared
to the previous year 2009 and the result shows an increase from 3,272.18Crores to
6,159.36Crores. In the post merger period during (2011- 2013) it shows an increase in
the firm value. Firm Value increased in both the pre and post acquisition period. It
indicates that there is increase in firm value in Lanco Infratech Ltd.
The results show that there is more than two times increase in firm value added year
on year compared to the pre acquisition period. It indicates increase in the investment
and decrease in cost of capital for the consecutive analysis period. From this analysis
conclusion can be drawn that there is increase in firm value in Lanco Infratech Ltd
throughout the period of observation, wherein the amount of firm value increased.

131
Table: 3.4.33 Calculation of NOPAT (Fortis Healthcare Ltd) (Rs. in Crore)
Particulars 2007 2008 2009 2010 2011 2012 2013
EBDIT 13.40 43.33 26.31 63.44 200.73 316.43 189.40
-Depreciation 10.57 10.64 11.54 10.79 10.40 12.11 23.47
EBIT 2.83 32.69 14.77 52.65 190.33 304.32 165.93
Tax Rate (%) 0.70% 17.01% 8.00% 0.13% 0.035% 0.00% 46.24%
EBIT (1-t) or NOPAT 2.81 27.13 13.59 52.58 190.26 304.32 89.20
Table: 3.4.34 Calculation of Adjusted Capital (FHL) (Rs. in Crore)
Years 2007 2008 2009 2010 2011 2012 2013
Equity 443.66 885.05 800.07 1582.40 3019.25 3206.14 3205.05
Debt 413.39 182.60 284.95 1242.06 449.29 1102.44 998.00
Total CE 857.05 1067.65 1085.02 2824.46 3468.54 4308.58 4203.05
(+) Depreciation 10.57 10.64 11.54 10.79 10.40 12.11 23.47
Adjusted capital 867.62 1078.29 1096.56 2835.25 3478.94 4320.69 4226.52

132
Table: 3.4.35 Calculation of WACC (FHL)
Years Equity (Rs
in Crores)
Debt (Rs
in Crores) Total CE
Weight of
Equity
Weight of
Debt Kd Ke WACC Ko
2007 443.66 413.39 857.05 0.52 0.48 0.120 0.07602 0.097 9.73
2008 885.05 182.60 1,067.65 0.83 0.17 0.162 0.07581 0.091 9.06
2009 284.95 284.95 569.90 0.50 0.50 0.077 0.09200 0.085 8.45
2010 1582.40 1242.06 2,824.46 0.56 0.44 0.018 0.05498 0.039 3.87
2011 3019.25 449.29 3,468.54 0.87 0.13 0.119 0.06008 0.068 6.78
2012 3206.14 1102.44 4,308.58 0.74 0.26 0.093 0.07643 0.081 8.08
2013 3205.05 998.00 4,203.05 0.76 0.24 0.134 0.06854 0.084 8.41 Table: 3.4.36 Calculation of Ke and Kd (FHL)
Years 2007 2008 2009 2010 2011 2012 2013
Beta -0.237 -0.034 0.16 -0.067 -0.004 0.191 0.044
Market return -0.0076 -0.405 0.26 0.135 0.04 0.146 0.254
Risk free rate 0.06 0.06 0.06 0.06 0.06 0.06 0.06
Interest 49.65 29.62 21.95 22.28 53.65 102.93 133.86
Kd % 12.01 16.22 7.70 1.79 11.94 9.34 13.41
Ke % 7.6 7.6 9.2 5.5 6.0 7.6 6.9

133
Table: 3.4.37 Consolidated EVA Annual Summary (FHL) (Rs. in Crore)
Years 2007 2008 2009 2010 2011 2012 2013
NOPAT 2.81 27.12 13.58 52.58 190.26 304.32 89.20
Capital cost 84.41 97.67 92.68 109.69 235.75 348.94 355.50
Annual EVA (81.60) (70.55) (79.10) (57.11) (45.49) (44.62) (266.29)
Table: 3.4.38 Calculation of Value Added or Shortfall (FHL)
Years 2007 2008 2009 2010 2011 2012 2013
NOPAT return on adjusted capital (%) 0.324 2.516 1.239 1.855 5.469 7.043 2.111
Return Hurdle or Cost of capital (%) 9.73 9.06 8.45 3.87 6.78 8.08 8.41
Value Added or Short fall (%) (9.405) (6.543) (7.212) (2.014) (1.308) (1.033) (6.300) Table: 3.4.39 Calculation of Firm Value (FHL) (Rs. in Crore)
Years 2007 2008 2009 2010 2011 2012 2013
Total Assets 857.05 1067.65 1085.02 2824.46 3468.54 4308.58 4203.05
Annual EVA (81.60) (70.55) (79.10) (57.11) (45.49) (44.62) (266.29)
Ko (%) 9.73 9.06 8.45 3.87 6.78 8.08 8.41
Firm Value 782.69 1,002.96 1,012.10 2,769.48 3,425.94 4,267.29 3,957.42

Table: 3.4.40 Calculation of Firm Value in Pre and Post Period from 2007
Particulars
Firm Value Pre-3 years from (2007-2009)
Firm Value Post-3 years from (2011-2013) Chart: 3.5 Total Firm V
2007
Firm Value in Crores 782.69
782.69
0
500
1000
1500
2000
2500
3000
3500
4000
4500
5000
Rs.
In
Cro
res
Firm Value of Fortis Healthcare LtdFirm Value in Crores
134
Calculation of Firm Value in Pre and Post Period from 2007-2009 to 2011-2013
Firm Value(Rs. in Crore)
879.64
3,876.24
Total Firm Value of Fortis Healthcare ltd from 2007-2013
2008 2009 2010 2011
1,002.96 1,012.10 2,769.48 3,425.94
2,769.48
Firm Value of Fortis Healthcare LtdFirm Value in Crores Poly. (Firm Value in Crores)
2012 2013
4,267.29 3,957.42
3,957.42
135
The value addition of Fortis Healthcare Ltd is shown in table – 3.4.38. It is observed
from the table that the value added for 2007 to 2013 ranges between (9.405%) -
(1.033%). The high shortfall is found in the year 2007 and highest value added is
found in 2012. During pre merger period (2007 – 2009) results found in the pre
acquisition period declined in shortfall from (9.405%) to (7.212%) and the firm had
lowest short fall in the year 2008 at (6.543%). In the year of acquisition (2010), there
was a decrease in the Shortfall compared to the previous year 2009 and the result
shows a decrease from (7.212%) to (2.014%). During post merger period (2011-
2013) results found in the year 2010 and 2011 decreased in the Shortfall from
(1.308%) to (1.033%), and the firm had Short fall in the year 2013 at (6.300%). The
Firm had a short fall in both the pre and post acquisition period. It indicates that there
is no value addition in Fortis Healthcare Ltd.
The results show that there is decrease in value added compared to the pre acquisition
period. It indicates high variations in NOPAT to Adjusted capital and cost of overall
capital for the consecutive analysis period. From this analysis conclusion can be
drawn that there is negative value addition in Fortis Healthcare Ltd throughout the
period of observation, but percentage of value added is less and the firm improved the
performance in the post period compared to the pre acquisition period.
The Firm Value of Fortis Healthcare Ltd is shown in the Chart – 3.5. It is observed
from the Chart that the firm value has an increasing trend from 2007-2013. The
lowest firm value is found in the year 2007 and highest firm value in 2012. During pre
merger period (2007 – 2009) it shows an increase in firm value in 2008 and firm value
decrease in 2009. In the year of acquisition (2010), there is an increase in the firm
value compared to the previous year (2009) and the result shows an increase from
1,012.10Crores to 2,769.48Crores. During post merger period (2011- 2013) it shows
an increase in the firm value. Firm Value increased in both the pre and post
acquisition period. It indicates that there is an increase in firm value in Fortis
Healthcare Ltd.
The results show that there is more than four times increase in firm value added year
on year comparatively to the pre acquisition period. It indicates increase in the
investment and decrease in cost of capital for the consecutive analysis period. From
this analysis conclusion can be drawn that there is increase in firm value throughout
the period of observation, and the amount of firm value increased.

136
Table: 3.4.41 Calculation of NOPAT (Jindal Steel & Power Ltd) (Rs. in Crore)
Particulars 2007 2008 2009 2010 2011 2012 2013
EBDIT 1,453.67 2,208.65 2,692.54 2,748.35 3,725.71 4,246.97 4,097.73
-Depreciation 336.47 451.51 433.03 512.16 687.77 867.19 1048.46
EBIT 1,117.20 1,757.14 2,259.51 2,236.19 3,037.94 3,379.78 3,049.27
Tax Rate 25.60% 17.60% 23.25% 22.43% 25.00% 25.76% 28.54%
EBIT (1-t) or NOPAT
831.20 1,447.88 1,734.17 1,734.61 2,278.46 2,509.15 2,179.01
Table: 3.4.42 Calculation of Adjusted Capital (JSPL) (Rs. in Crore)
Years 2007 2008 2009 2010 2011 2012 2013
Equity 2496.73 3756.38 5415.32 6746.00 8689.34 10845.41 12348.07
Debt 3507.72 3863.35 4962.65 8383.26 11441.70 14372.46 19500.94
Total CE 6004.45 7619.73 10377.97 15129.26 20131.04 25217.87 31849.01
(+) Depreciation 336.47 451.51 433.03 512.16 687.77 867.19 1048.46
Adjusted capital 6340.92 8071.24 10811.00 15641.42 20818.81 26085.06 32897.47

137
Table: 3.4.43 Calculation of WACC (JSPL)
Years
Equity(Rs
in Crores)
Debt (Rs in
Crores) Total CE
Weight of
Equity
Weight of
Debt Kd Ke WACC Ko
2007 2496.73 3507.72 6,004.45 0.42 0.58 0.049 0.06224 0.055 5.47
2008 3756.38 3863.35 7,619.73 0.49 0.51 0.063 -0.11680 -0.026 -2.57
2009 4962.65 4962.65 9,925.30 0.50 0.50 0.054 -0.02360 0.015 1.52
2010 6746.00 8383.26 15,129.26 0.45 0.55 0.040 0.06021 0.049 4.88
2011 8689.34 11441.70 20,131.04 0.43 0.57 0.025 0.06720 0.043 4.32
2012 10845.41 14372.46 25,217.87 0.43 0.57 0.037 0.05832 0.046 4.64
2013 12348.07 19500.94 31,849.01 0.39 0.61 0.042 0.03647 0.040 3.99 Table: 3.4.44 Calculation of Ke and Kd (JSPL)
Years 2007 2008 2009 2010 2011 2012 2013
Beta 0.32 0.34 -0.38 0.021 -0.24 -0.016 -0.233
Market return 0.067 -0.46 0.28 0.07 0.03 0.165 0.161
Risk free rate 0.06 0.06 0.06 0.06 0.06 0.06 0.06
Interest 173.19 243.02 267.89 331.66 285 536.77 820.77
Kd (%) 4.94 6.29 5.40 3.96 2.49 3.73 4.21
Ke (%) 6.20 -11.7 2.40 6.00 6.70 5.80 3.60

138
Table: 3.4.45 Consolidated EVA annual Summary (JSPL) (Rs. in Crore)
Years 2007 2008 2009 2010 2011 2012 2013
NOPAT 831.19 1,447.88 1,734.17 1,734.61 2278.46 2,509.15 2,179.01
Capital cost 347.00 (207.32) 164.23 762.81 898.61 1,209.48 1,312.91
Annual EVA 484.19 1,655.21 1,569.95 971.80 1,379.85 1,299.67 866.10
Table: 3.4.46 Calculation of Value Added or Shortfall (JSPL)
Years 2007 2008 2009 2010 2011 2012 2013
NOPAT return on adjusted capital (%) 13.108 17.939 16.041 11.090 10.944 9.619 6.624
Return Hurdle or Cost of capital (%) 5.47 -2.57 1.52 4.88 4.32 4.64 3.99
Value Added or Short fall (%) 7.636 20.507 14.522 6.213 6.628 4.982 2.633
Table: 3.4.47 Calculation of Firm Value (Rs. in Crore)
Years 2007 2008 2009 2010 2011 2012 2013
Total Assets 6004.45 7619.73 10377.97 15129.26 20131.04 25217.87 31849.01
Annual EVA 484.19 1,655.21 1,569.95 971.80 1,379.85 1,299.67 866.10
Ko 5.47 -2.57 1.52 4.88 4.32 4.64 3.99
Firm Value 6,463.53 9,318.57 11,924.42 16,055.87 21,453.79 26,459.94 32,681.87

Table: 3.4.48 Calculation of Firm Value in Pre and Post Period from 2007
Particulars
Firm Value Pre-3 years from (2007-2009) Firm Value Post-3 years from (2011-2013)
Chart: 3.6 Total Firm V
2007
Firm Value in Crores 6,463.53
6,463.53
0.00
5,000.00
10,000.00
15,000.00
20,000.00
25,000.00
30,000.00
35,000.00
Rs.
In
Cro
res
Firm Value of Jindal Steel Power LtdFirm Value in Crores
139
Calculation of Firm Value in Pre and Post Period from 2007-2009 to 2011-2013
Firm Value in Crore
14,058.53 35,191.96
Total Firm Value of Jindal Steel & Power Ltd from 2007-2013
2008 2009 2010 2011
9,318.57 11,924.42 16,055.87 21,453.79
16,055.87
Firm Value of Jindal Steel Power LtdFirm Value in Crores Poly. (Firm Value in Crores)
2012 2013
26,459.94 32,681.87
32,681.87

140
The value added of Jindal Steel & Power Ltd is shown in table -3.4.46. It is observed
from the table that the value added for 2007 to 2013 ranges between 2.633% -
20.507%. The lowest value added is found in the year 2013 and the highest value
added is found in 2008.
During pre merger period (2007 – 2009) it shows fluctuating value addition results -
7.636%, 20.507%, and 14.522% respectively. In the year of acquisition (2010), there
is an increase in the value added compared to the previous year (2009) and the result
shows an increase from 14.522% to 6.213%. During post merger period (2011- 2013)
it shows a decline in the value added resulting in 6.628%, 4.982% and 2.633%
respectively. Value added is positive in both the pre and post acquisition period. It
indicates that there is value addition in Jindal Steel Power Ltd.
The results show that there is more than 9% decrease in value added comparatively to
the pre acquisition period. It indicates decrease in NOPAT to Adjusted capital for the
consecutive analysis period. From this analysis conclusion can be drawn that there is
value addition in Jindal Steel & Power Ltd throughout the period of observation, but
percentage of value Added has been on a decline.
The Firm Value of Hindustan Zinc Ltd is shown in the Chart – 3.6. It is observed
from the Chart that the firm value has increasing trend from 2007-2013. The lowest
firm value is found in the year 2007 and the highest firm value in 2013.
During pre merger period (2007 – 2009) it shows increase in firm value. In the year of
acquisition (2010), there is an increase in the firm value compared to the previous
year (2009) and the result shows an increase from 11,924.42Crores to
16,055.87Crores. During post merger period (2011- 2013) it shows an increase in the
firm value. Firm Value increased in both pre and post acquisition period. It indicates
that there is an increase in firm value of Jindal Steel & Power Ltd.
The results show that there is more than two times increase in firm value paired event
comparatively to the pre acquisition period. It indicates increase in the investment for
the consecutive analysis period. From this analysis conclusion can be drawn that there
is increase in firm value in Jindal Steel & Power Ltd throughout the period of
observation, the amount of firm value increased.

141
Table: 3.4.49 Calculation of NOPAT (Mahindra & Mahindra Ltd) (Rs. in Crore)
Particulars 2007 2008 2009 2010 2011 2012 2013
EBDIT 1,667.40 1,733.61 1,417.20 3,301.89 4,005.96 4,344.78 5,349.09
-Depreciation 209.59 238.66 291.51 370.78 413.86 576.14 710.81
EBIT 1,457.81 1,494.95 1,125.69 2,931.11 3,592.10 3,768.64 4,638.28
Tax Rate 25.00% 22.00% 13.00% 26.66% 24.36% 20.16% 24.60% EBIT (1-t) or NOPAT
1,093.36 1,166.06 979.35 2,149.68 2,717.06 3,008.88 3,497.26
Table: 3.4.50 Calculation of Adjusted Capital (M&ML) (Rs. in Crore)
Years 2007 2008 2009 2010 2011 2012 2013
Equity 3552.90 4350.07 5243.97 7830.23 10313.39 12171.09 14658.92
Debt 1636.00 2587.06 4052.76 2880.15 2321.10 3174.22 3227.07
Total CE 5188.90 6937.13 9296.73 10710.38 12634.49 15345.31 17885.99
(+) Depreciation 209.59 238.66 291.51 370.78 413.86 576.14 710.81
Adjusted capital 5398.49 7175.79 9588.24 11081.16 13048.35 15921.45 18596.80

142
Table: 3.4.51 Calculation of WACC (M&ML)
Years Equity (Rs in
Crores)
Debt (Rs in
Crores) Total CE
Weight of
Equity
Weight of
Debt Kd Ke WACC Ko
2007 3552.90 1636.00 5,188.90 0.68 0.32 0.012 0.06210 0.046 4.63
2008 4350.07 2587.06 6,937.13 0.63 0.37 0.034 0.10608 0.079 7.91
2009 4052.76 4052.76 8,105.52 0.50 0.50 0.033 0.12614 0.080 7.96
2010 7830.23 2880.15 10,710.38 0.73 0.27 0.054 0.04640 0.049 4.86
2011 10313.39 2321.10 12,634.49 0.82 0.18 0.031 0.05954 0.054 5.43
2012 12171.09 3174.22 15,345.31 0.79 0.21 0.051 0.05028 0.050 5.05
2013 14658.92 3227.07 17,885.99 0.82 0.18 0.059 0.04950 0.051 5.13 Table: 3.4.52 Calculation of Ke and Kd (M&ML)
Years 2007 2008 2009 2010 2011 2012 2013
Beta -0.21 -0.096 0.312 -0.206 0.017 -0.143 -0.05
Market return 0.05 -0.42 0.272 0.126 0.033 0.128 0.27
Risk free rate 0.06 0.06 0.06 0.06 0.06 0.06 0.06
Interest 19.8 87.59 134.12 156.85 72.49 162.75 191.19
Kd (%) 1.21 3.39 3.31 5.45 3.12 5.13 5.92
Ke (%) 6.20 10.6 12.60 4.60 6.00 5.00 5.00

143
Table: 3.4.53 Consolidated EVA Annual Summary (M&M) (Rs. in Crore)
Years 2007 2008 2009 2010 2011 2012 2013
NOPAT 1,093.36 1,166.06 979.35 2,149.68 2,717.06 3,008.88 3,497.26
Capital cost 49.57 165.57 394.30 312.81 374.08 237.33 334.42
Annual EVA 1,043.79 1,000.49 585.04 1,836.86 2,342.98 2,771.56 3,162.84
Table: 3.4.54 Calculation of Value Added or ShortFall (M&ML)
Years 2007 2008 2009 2010 2011 2012 2013
NOPAT return on adjusted capital (%) 102.198 55.739 19.775 33.378 39.469 64.003 53.604
Return Hurdle or Cost of capital (%) 4.63 7.91 7.96 4.86 5.43 5.05 5.13
Value Added or Short fall (%) 97.565 47.824 11.813 28.521 34.035 58.954 48.478
Table: 3.4.55 Calculation of Firm Value (M&ML) (Rs. in Crore)
Years 2007 2008 2009 2010 2011 2012 2013
Total Assets 5,188.90 6,937.13 9,296.73 10,710.38 12,634.49 15,345.31 17,885.99
Annual EVA 1,043.79 1,000.49 585.04 1,836.86 2,342.98 2,771.56 3,162.84
Ko (%) 4.63 7.91 7.96 4.86 5.43 5.05 5.13
Firm Value 6,186.46 7,864.24 9,838.63 12,462.16 14,856.71 17,983.68 20,894.61

Table: 3.4.56 Calculation of Firm Value in Pre and Post Period from
Particulars
Firm Value Pre-3 years from (2007-2009)
Firm Value Post-3 years from (2011-2013) Chart: 3.7 Total Firm Value of Mahindra & Mahindra L
2007
Firm Value in Crores 6,186.46
6,186.46
0.00
5,000.00
10,000.00
15,000.00
20,000.00
25,000.00
Rs.
In
Cro
res
Firm Value of Mahindra & Mahindra Ltd
144
Calculation of Firm Value in Pre and Post Period from 2007-2009 to 2011-2013
Firm Value in Crore
11,719.12
25,640.67
m Value of Mahindra & Mahindra Ltd from 2007-2013
2008 2009 2010 2011
7,864.24 9,838.63 12,462.16 14,856.71
12,462.16
Firm Value of Mahindra & Mahindra Ltd
Firm Value in Crores Poly. (Firm Value in Crores)
2012 2013
17,983.68 20,894.61
20,894.61

145
The value added of Mahindra & Mahindra Ltd is shown in table 3.4.54. It is observed
from the table that the value added for 2007 to 2013 ranges between 11.813% -
97.565%. The lowest value added is found in the year 2009 and the highest value
added is found in 2007.
During pre merger period (2007 – 2009) it shows decrease value addition results of
97.565%, 47.824%, and 11.813% respectively. In the year of acquisitions (2010),
there is an increase in the value added compared to the previous year (2009) and the
result shows an increase from 11.813% to 28.521%. During post merger period
(2011- 2013) it shows an increase in the value added resulting in 34.035%, 58.954%
and 48.478% respectively. Value added is positive in both the pre and post acquisition
period. It indicates that there is value addition in Mahindra & Mahindra Ltd.
The results show that there is more than 5% decrease in value added comparatively to
the pre acquisition period. It indicates increase in NOPAT to Adjusted capital for the
consecutive analysis period. From this analysis conclusion can be drawn that there is
value addition in Mahindra & Mahindra Ltd throughout the period of observation, but
percentage of value Added had been on a decreased.
The Firm Value of Mahindra & Mahindra Ltd is shown in Chart – 3.7. It is observed
from the Chart that the firm value has increasing trend from 2007-2013. The lowest
firm value is found in the year 2007 and the highest in 2013.
During pre merger period 2007 – 2009 it shows an increase in firm value. In the year
of acquisition (2010), there is an increase in the firm value compared to the previous
year (2009) and the result shows an increase from 9,838.63Crores to 12,462.16Crores.
During post merger period (2011- 2013) it shows an increase in the firm value. The
Firm Value increased in both the pre and post acquisition period. It indicates that
there is an increase in firm value of Mahindra & Mahindra Ltd.
The results show that there is more than two times increase in firm value paired event
compared to the pre acquisition period. It indicates increase in the investment for the
consecutive analysis period. From this analysis, conclusion can be drawn that there is
increase in firm value of Mahindra & Mahindra Ltd throughout the period of
observation, and the amount of firm value increased.

146
Table: 3.4.57 Calculation of NOPAT (Tata Chemicals Ltd) (Rs. in Crore)
Particulars 2007 2008 2009 2010 2011 2012 2013
EBDIT 814.87 1,326.66 962.55 961.13 956.79 1,199.22 1,046.37
-Depreciation 150.35 148.76 163.03 187.19 204.46 224.68 214.29
EBIT 664.52 1,177.90 799.52 773.94 752.33 974.54 832.08
Tax Rate (%) 30.00% 18.00% 33.00% 26.00% 26.00% 23.00% 22.00%
EBIT (1-t) or NOPAT 465.16 965.88 535.68 572.72 556.72 750.40 649.02
Table: 3.4.58 Calculation of Adjusted Capital (TCL) (Rs. in Crore)
Years 2007 2008 2009 2010 2011 2012 2013
Equity 2392.84 3571.68 3621.91 4275.07 4740.68 5017.23 5307.32
Debt 1041.77 2345.28 3676.10 2946.51 2975.94 2459.43 2457.06
Total CE 3434.61 5916.96 7298.01 7221.58 7716.62 7476.66 7764.38
(+) Depreciation 150.35 148.76 163.03 187.19 204.46 224.68 214.29
Adjusted Capital 3584.96 6065.72 7461.04 7408.77 7921.08 7701.34 7978.67

147
Table: 3.4.59 Calculation of WACC (TCL)
Years Equity Rs in
Crores
Debt Rs in
Crores
Total CE in
crores
Weight of
Equity
Weight of
Debt Kd Ke WACC Ko
2007 2392.84 1041.77 3,434.61 0.70 0.30 0.010 0.06101 0.046 4.56
2008 3571.68 2345.28 5,916.96 0.60 0.40 0.016 -0.01965 -0.005 -0.54
2009 3676.10 3676.10 7,352.20 0.50 0.50 0.028 0.04249 0.035 3.52
2010 4275.07 2946.51 7,221.58 0.59 0.41 0.064 0.08024 0.073 7.35
2011 4740.68 2975.94 7,716.62 0.61 0.39 0.102 0.05993 0.076 7.61
2012 5017.23 2459.43 7,476.66 0.67 0.33 0.174 0.04890 0.090 9.01
2013 5307.32 2457.06 7,764.38 0.68 0.32 0.143 0.04180 0.074 7.37 Table: 3.4.60 Calculation of Ke and Kd (TCL)
Years 2007 2008 2009 2010 2011 2012 2013
Beta -0.021 0.177 -0.103 0.11 0.004 -0.15 -0.14
Market return 0.012 -0.39 0.23 0.244 0.043 0.134 0.19
Risk free rate 0.06 0.06 0.06 0.06 0.06 0.06 0.06
Interest 10.67 37.98 102.51 187.5 302.91 428.51 350.53
Kd (%) 1.02 1.62 2.79 6.36 10.18 17.42 14.27
Ke (%) 6.10 -2.00 4.20 8.00 6.00 4.90 4.20

148
Table: 3.4.61 Consolidated EVA Annual Summary (TC) (Rs. in Crore)
Years 2007 2008 2009 2010 2011 2012 2013
NOPAT 465.16 965.88 535.68 572.72 556.72 750.40 649.02
Capital cost 163.51 (33.01) 262.54 544.28 602.58 694.10 588.17
Annual EVA 301.65 998.89 273.14 28.43 (45.86) 56.29 60.85
Table: 3.4.62 Calculation of Value Added or ShortFall (TCL)
Years 2007 2008 2009 2010 2011 2012 2013
NOPAT return on adjusted capital (%) 12.975 5.924 7.180 7.730 7.028 9.744 8.134
Return Hurdle or Cost of capital (%) 4.56 -0.54 3.52 7.35 7.61 9.01 7.37
Value Added or Short fall (%) 8.414 16.468 3.661 0.384 (0.579) 0.731 0.763
Table: 3.4.63 Calculation of Firm Value (TCL) (Rs. in Crore)
Years 2007 2008 2009 2010 2011 2012 2013
Total Assets 3,434.61 5,916.96 7,298.01 7,221.58 7,716.62 7,476.66 7,764.38
Annual EVA 301.65 998.89 273.14 28.43 (45.86) 56.29 60.85
Ko 4.56 -0.54 3.52 7.35 7.61 9.01 7.37
Firm Value 3,723.11 6,921.32 7,561.87 7,248.07 7,674.00 7,528.30 7,821.05

Table: 3.4.64 Calculation of Firm Value in Pre and Post Period from 2007
Particulars
Firm Value Pre-3 years from (2007-2009) Firm Value Post-3 years from (2011-2013)
Chart: 3.8 Total Firm Value of Tata Chemicals L
2007
Firm Value in Crores 3,723.11
3,723.11
0.00
1,000.00
2,000.00
3,000.00
4,000.00
5,000.00
6,000.00
7,000.00
8,000.00
9,000.00
Rs.
In
Cro
res
Firm Value in Crores
149
of Firm Value in Pre and Post Period from 2007-2009 to 2011-2013
Firm Value in Crore
8,842.14 7,833.09
Firm Value of Tata Chemicals Ltd from 2007-2013
2008 2009 2010 2011
6,921.32 7,561.87 7,248.07 7,674.00
7,248.07
Firm Value of Tata Chemicals LtdFirm Value in Crores Poly. (Firm Value in Crores)
2012 2013
7,528.30 7,821.05
7,821.05
150
The value added of Tata chemicals Ltd is shown in table – 3.4.62. It is observed from
the table that the value added for 2007 to 2013 ranges between (0.579%) – 16.468%.
The lowest value added is found in the year 2011 and the highest value added is found
in 2008.
During pre merger period (2007 – 2009) it shows decline in value addition results
8.414%, 16.468% and 3.661% respectively. In the year of acquisition (2010), there is
decrease in the value added compared to the previous year (2009) and the result
shows a decrease from 3.661% to 0.384%. During post merger period (2011- 2013) it
shows an increase in the short fall resulting from (0.579%), 0.731% and 0.763%
respectively. Value added is positive in the post acquisition period, but the percentage
of value addition is comparatively less compared to pre acquisition. It indicates that
there is less value addition in Tata Chemicals Ltd.
The results show that there is more than 9% decrease in value addition compared to
the pre acquisition period. It indicates decrease in NOPAT to Adjusted capital for the
consecutive analysis period. From this analysis, conclusion can be drawn that there is
very less value addition in Tata Chemicals Ltd throughout post period of observation,
also percentage of short fall increased.
The Firm Value of Tata Chemicals Ltd is shown in the Chart – 3.8. It is observed
from the chart that the firm value has an increasing trend from 2007-2013. The lowest
firm value was found in the year 2007 and the highest firm value in 2011.
During pre merger period (2007 – 2009) it shows an increase in firm value. In the
year of acquisition (2010), there is a decrease in the firm value compared to the
previous year (2009) and the result shows a decrease from 7,561.87Crores to
7,248.07Crores. During post merger period (2011- 2013) it shows an increase in the
firm value. Firm Value increased in both the pre and post acquisition period. It
indicates that there was an increase in the firm value in Tata Chemicals Ltd.
The results show that there is more than 12% decrease in the firm value paired event
compared to the pre acquisition period. It indicates decrease in the investment for the
consecutive analysis period. From this analysis conclusion can be drawn that there is
decrease in firm value in Tata Chemicals Ltd throughout the period of observation,
and the amount of firm value decreased.
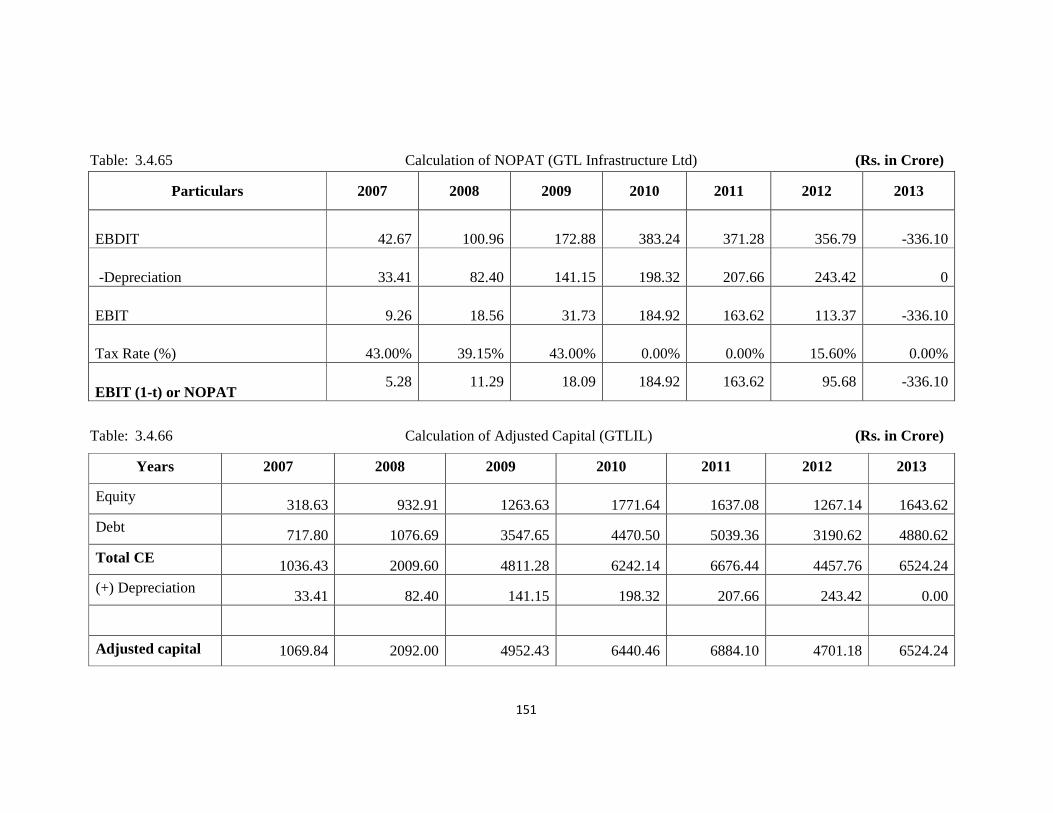
151
Table: 3.4.65 Calculation of NOPAT (GTL Infrastructure Ltd) (Rs. in Crore)
Particulars 2007 2008 2009 2010 2011 2012 2013
EBDIT 42.67 100.96 172.88 383.24 371.28 356.79 -336.10
-Depreciation 33.41 82.40 141.15 198.32 207.66 243.42 0
EBIT 9.26 18.56 31.73 184.92 163.62 113.37 -336.10
Tax Rate (%) 43.00% 39.15% 43.00% 0.00% 0.00% 15.60% 0.00%
EBIT (1-t) or NOPAT 5.28 11.29 18.09 184.92 163.62 95.68 -336.10
Table: 3.4.66 Calculation of Adjusted Capital (GTLIL) (Rs. in Crore)
Years 2007 2008 2009 2010 2011 2012 2013
Equity 318.63 932.91 1263.63 1771.64 1637.08 1267.14 1643.62
Debt 717.80 1076.69 3547.65 4470.50 5039.36 3190.62 4880.62
Total CE 1036.43 2009.60 4811.28 6242.14 6676.44 4457.76 6524.24
(+) Depreciation 33.41 82.40 141.15 198.32 207.66 243.42 0.00
Adjusted capital 1069.84 2092.00 4952.43 6440.46 6884.10 4701.18 6524.24

152
Table: 3.4.67 Calculation of WACC (GTLIL)
Years Equity Rs.
In Crores
Debt
Rs. In crores Total CE
Weight of
Equity
Weight of
Debt Kd Ke
WACC
or Ko Ko
2007 318.63 717.80 1,036.43 0.31 0.69 0.015 0.05990 0.029 2.87
2008 932.91 1076.69 2,009.60 0.46 0.54 0.035 0.01864 0.028 2.76
2009 1263.63 3547.65 4,811.28 0.26 0.74 0.029 0.06960 0.040 3.96
2010 1771.64 4470.50 6,242.14 0.28 0.72 0.042 0.06944 0.050 4.97
2011 1637.08 5039.36 6,676.44 0.25 0.75 0.060 0.06546 0.061 6.14
2012 1267.14 3190.62 4,457.76 0.28 0.72 0.134 0.06560 0.115 11.48
2013 1643.62 4880.62 6,524.24 0.25 0.75 0.072 0.06011 0.069 6.89 Table: 3.4.68 Calculation of Ke and Kd(GTLIL)
Years 2007 2008 2009 2010 2011 2012 2013
Beta -0.016 0.088 0.06 0.111 -0.107 0.07 0.0005
Market return 0.066 -0.41 0.22 0.145 0.009 0.14 0.28
Risk free rate 0.06 0.06 0.06 0.06 0.06 0.06 0.06
Interest 10.67 37.98 102.51 187.5 302.91 428.51 350.53
Kd (%) 1.49 3.53 2.89 4.19 6.01 13.43 7.18
Ke (%) 6.00 1.90 7.00 6.90 6.50 6.60 6.00

153
Table: 3.4.69 Consolidated EVA Annual Summary (GTLIL) (Rs. in Crore)
Years 2007 2008 2009 2010 2011 2012 2013
NOPAT 5.28 11.29 18.09 184.92 163.62 95.68 (336.10)
Capital cost 30.72 57.64 196.05 320.38 422.82 539.57 449.33
Annual EVA (25.43) (46.35) (177.96) (135.46) (259.20) (443.89) (785.43)
Table: 3.4.70 Calculation of Value Added or ShortFall (GTLIL)
Years 2007 2008 2009 2010 2011 2012 2013
NOPAT return on adjusted capital (%) 0.493 0.540 0.365 2.871 2.377 2.035 (5.152)
Return Hurdle or Cost of capital (%) 2.87 2.76 3.96 4.97 6.14 11.48 6.89
Value Added or Short fall (%) (2.378) (2.215) (3.593) (2.103) (3.765) (9.442) (12.039)
Table: 3.4.71 Calculation of Firm Value (Rs. in Crore)
Years 2007 2008 2009 2010 2011 2012 2013
Total Assets 1,036.43 3,408.60 4,811.28 6,242.14 6,676.44 4,457.76 6,524.24
Annual EVA (25.43) (46.35) (177.96) (135.46) (259.20) (443.89) (785.43)
Ko 2.87 2.76 3.96 4.97 6.14 11.48 6.89
Firm Value 1,011.70 3,363.50 4,640.10 6,113.10 6,432.24 4,059.57 5,789.42

Table: 3.4.72 Calculation of Firm Value in Pre and Post Period from 2007
Particulars
Firm Value Pre-3 years from (2007-2009)
Firm Value Post-3 years from (2011-2013)
Chart: 3.9 Total Firm V
2007
Firm Value in Crores 1,011.70
1,011.70
0.00
1,000.00
2,000.00
3,000.00
4,000.00
5,000.00
6,000.00
7,000.00
Rs.
In
Cro
res
154
Calculation of Firm Value in Pre and Post Period from 2007-2009 to 2011-2013
Firm Value(Rs. in Crore)
4,570.96
5,161.16
Total Firm Value of GTL Infrastructure ltd from 2007-2013
2008 2009 2010 2011
3,363.50 4,640.10 6,113.10 6,432.24
6,113.10
Firm Value of GTL Infrastructure LtdFirm Value in Crores Poly. (Firm Value in Crores)
2012 2013
4,059.57 5,789.42
5,789.42

155
The value addition of GTL Infrastructure Ltd is shown in table -3.4.70.It is observed
from the table that the value added for 2007 to 2013 ranges between (2.103%) -
(12.039%). The lowest Short fall is found in the year 2010 and the highest Short fall is
found in 2013. During pre merger (2007 – 2009) result shows an increase in shortfall
from (2.378%), (2.215%) and (3.593%) respectively. In the year of acquisition
(2010), there is a decrease in the Short fall compared to the previous year (2009) and
the result shows a decrease from (3.593%) to (2.103%). During post merger period
(2011- 2013) it shows an increase in the short fall resulting from (3.765%), (9.442%)
and (12.039%) respectively. The Firm had a short fall in both the pre and post
acquisition period. It indicates ahuge short fall in GTL Infrastructure Ltd.
The results show that there was more than 6% increase in shortfall compared to pre
acquisition period. It indicates high variations in NOPAT to Adjusted Capital and the
cost of overall capital for the consecutive analysis period. From this analysis
conclusion it can be drawn that there was high short fall in GTL Infrastructure Ltd
(GTLIL) throughout the period of observation, but the percentage of Shortfall was
high and the firm had worsened its performance in the post period compared to the
pre acquisition period.
The Firm Value of GTL Infrastructure Ltd is shown in Chart – 3.9. It is observed from
the chart that the firm value had a flexible trend from 2007-2013. The lowest firm
value was found in the year 2007 and the in 2011. During pre merger period (2007 –
2009) it shows an increase in firm value. In the year of (2010), there is an increase in
the Firm Value compared to the previous year (2009) and the result shows an increase
from 4,640.10Crores to 6,113.10Crores. During post merger period (2011- 2013) it
shows a decrease in the firm value. Firm Value decreased in both the pre and post
acquisition period. It indicates that there was a decrease in firm value in (GTLIL)
The results show that there is more than 12% increase in firm value added Year on
Year comparatively to the pre acquisition period. It indicates increase in the
investment and decrease in cost of capital for the consecutive analysis period. From
this analysis, conclusion can be drawn that there is least increase in firm value in GTL
Infrastructure Ltd throughout the period of observation. The amount of firm value has
been increased.

156
Table: 3.4.73 Calculation of NOPAT (Reliance Power Ltd)
(Rs. in Crore)
Particulars 2007 2008 2009 2010 2011 2012 2013
EBIT 1.37 107.17 258.45 291.15 297.16 374.21 538.58
Tax Rate 69.00% 0.06% 0.03% 0.05% 0.01% 0.03% 0.01%
EBIT (1-t) or NOPAT 0.42 107.11 258.37 290.99 297.13 374.10 538.52
Table: 3.4.74 Calculation of Adjusted capital (RPL) (Rs. in Crore)
Years 2007 2008 2009 2010 2011 2012 2013
Equity 200.06 13542.67 13792.81 14066.04 15896.57 16101.33 16825.19
Debt 0 0 0 0 1554.05 0 1877.78
Total CE 200.06 13542.67 13792.81 14066.04 17450.62 16101.33 18702.97
(+) Depreciation 0 0 .20 .51 1.14 2.93 3.14
Adjusted Capital 200.06 13542.67 13793.01 14066.55 17451.76 16104.26 18706.11

157
Table: 3.4.75 Calculation of WACC (RPL)
Years Equity Rs .in
Crores
Debt Rs.in
Crores
Total CERs.in
Crores
Weight of
(Equity)
Weight of
(Debt) Kd Ke WACC Ko
2007 200.06 0 200.06 1 0 0 0.06283 0.063 6.283
2008 13,542.67 0 13,542.67 1 0 0 0.0321 0.032 3.21
2009 13,792.81 0 13,792.81 1 0 0 0.0315 0.031 3.15
2010 14,066.04 0 14,066.04 1 0 0 0.0575 0.057 5.75
2011 15,896.57 1,554.05 17,450.62 0.91 0.09 0.0273 0.0534 0.051 5.11
2012 16,101.33 0 16,101.33 1 0 0.0479 0.048 4.79
2013 16,825.19 1,877.78 18,702.97 0.9 0.1 0.0117 0.0613 0.056 5.63
Table: 3.4.76 Calculation of Ke and Kd (RPL)
Years 2007 2008 2009 2010 2011 2012 2013
Beta 0.404 0.058 -0.162 -0.0296 0.097 -0.11 0.006
Market return 0.067 -0.421 0.236 0.146 -0.008 0.17 0.27
Risk free rate 0.06 0.06 0.06 0.06 0.06 0.06 0.06
Interest 0.82 5.72 1.77 1.69 42.35 60.34 22.06
Kd =Interest*100/Debt
2.73
1.17
Ke= Rf+(Rm-Rf)β 6.28 3.21 3.15 5.75 5.34 4.79 6.13

158
Table: 3.4.77 Consolidated EVA Annual Summary (RPL) (Rs. in Crore)
Years 2007 2008 2009 2010 2011 2012 2013
NOPAT 0.42 107.10 258.37 290.99 297.13 374.10 538.52
Capital cost 12.57 434.74 434.31 808.19 890.99 771.39 10,53,23
Annual EVA (12,15) (327.64) (175.94) (517.20) (593.86) (397.29) (514.71)
Table: 3.4.78 Calculation of Value Added or ShortFall (RPL)
Years 2007 2008 2009 2010 2011 2012 2013
NOPAT return on adjusted capital (%) 0.212 0.791 1.873 2.069 1.703 2.323 2.879
Return Hurdle or Cost of capital (%) 6.2828 3.21 3.15 5.75 5.11 4.79 5.63
Value Added or Short fall (6.071) (2.419) (1.276) (3.677) (3.403) (2.467) (2.752)
Table: 3.4.79 Calculation of Firm Value (RPL) (Rs. in Crore)
Years 2007 2008 2009 2010 2011 2012 2013
Total Assets 200.06 13,542.67 13,792.81 14,066.04 17,450.62 16,101.33 18,702.97
Annual EVA (12,15) (327.64) (175.94) (517.20) (593.86) (397.29) (514.71)
Ko (%) 6.283 3.21 3.149 5.75 5.105 4.79 5.630
Firm Value 188.63 13,225.22 13,622.24 13,576.95 16,885.60 15,722.19 18,215.70

Table: 3.4.80 Calculation of Firm Value in Pre and Post Period from 2007
Particulars
Firm Value Pre-3 years from (2007-2009) Firm Value Post-3 years from (2011-2013)
Chart: 3.10 Total Firm V
2007
Firm Value in Crores 188.63
188.63
0
2000
4000
6000
8000
10000
12000
14000
16000
18000
20000
Rs.
In
Cro
res
159
of Firm Value in Pre and Post Period from 2007-2009 to 2011-2013
Firm Value(Rs. in Crore)
13,294.04 17,298.99
Total Firm Value of Reliance Power ltd from 2007-2013
2008 2009 2010 2011
13,225.22 13,622.24 13,576.95 16,885.60
13,576.95
Firm Value of Reliance Power LtdFirm Value in Crores Poly. (Firm Value in Crores)
2012 2013
15,722.19 18,215.70
18,215.70

160
The value added of Reliance Power Ltd is shown in table -3.4.78. It is observed from
the table that the Shortfall for 2007 to 2013 ranges between (1.276%) - (6.071%). The
lowest Shortfall is found in the year 2009 and the highest Shortfall is found in 2007.
During pre merger period (2007 – 2009) it shows decrease in Shortfall results
(6.071%), (2.419%) and (1.276%) respectively. In the year of acquisition (2010),
there is an increase in the Shortfall compared to the previous year (2009) and the
result shows an increase from (1.276%) to (3.677%). During post merger period
(2011- 2013) it shows decline in the Shortfall resulting in (3.403%), (2.467%) and
(2.752%) respectively. Value Addition is negative in both the pre and post acquisition
period. It indicates that there is no value addition in Reliance Power Ltd.
The results show that there is less than 2% increase in Shortfall compared to the pre
acquisition period. It is due to the decrease in NOPAT to Adjusted Capital for the
consecutive analysis period. From this analysis conclusion can be drawn that there is
negative value addition in Reliance Power Ltd throughout the period of observation,
but percentage of Shortfall decreased in both the pre and post acquisition period.
The Firm Value of Reliance Power Ltd is shown in Chart – 3.10. It is observed from
the chart that the firm value has increasing trend from 2007-2013. The lowest firm
value is found in the year 2007 and highest in 2013.
During pre merger period (2007 – 2009) it shows less increase in firm value. In the
year of acquisition (2010), there is more or less constant in the firm value compared to
the previous year (2009) and the result shows an increase from 13,622.24Crores to
13,576.95Crores. During post merger period (2011- 2013) it shows an increase in the
firm value. Firm Value increased in both the pre and post acquisition period. It
indicates that there is increase in firm value of Reliance Power Ltd.
The results show that there is more than 30% increase in Firm Value paired event
compared to the pre acquisition period. It indicates increase in the investment for the
consecutive analysis period. From this analysis conclusion can be drawn that there is
increase in Firm Value in Reliance Power Ltd throughout the period of observation,
the amount of Firm Value increased.
161
5. Comparative analysis of financial performance standards, synergy standards, firm value and value added/ shortfall in pre and post period of selected Mergers and Acquisitions.
The comparative analysis of all performance standards is receiving serious
attention to evaluate the performance by comparing the pre and post acquisition
period. Under this heading, an analysis has been done on aspects of financial health
and synergies, aspects with the help of ratios like
• Profitability ratios
• Leverage ratios
• Capital market ratios
• Financial synergy ratios
• Managerial synergy ratios
• Operational synergy ratio
Evaluation of the firm value and value added/shortfall aspects with the help of
economic value added model has also been done. During the study period the overall
performance of each selected firm has been examined by using statistical tools like
• Paired t-test
• Skewness
• Kurtosis

162
Table: 3.5.1 T –test, Skewness and Kurtosis for Gross Profit Margin
Companies T- Value P-value Skewness S E Kurtosis SE
BAL 3.359 0.078 -0.640 0.845 1.373 1.741
HGSL 5.112 0.036 -0.309 0.845 2.535 1.741
HZL 1.535 0.264 0.919 0.845 0.902 1.741
LIL 2.190 0.160 -0.085 0.845 -0.718 1.741
FHL -0.570 0.626 -2.029 0.845 4.267 1.741
JSPL 2.063 0.175 -0.719 0.845 0.026 1.741
M&ML -0.624 0.596 0.646 0.845 0.975 1.741
TCL 2.357 0.143 0.968 0.845 1.500 1.741
GTLIL -0.534 0.647 -0.303 0.845 0.622 1.741
RPL 2.088 0.172 -1.700 0.845 2.640 1.741 (Source: AGM reports of selected companies & moneycontrol.com database)
Pre and Post M&A financial performance standards of acquiring firms are
compared to see if there are any statistically significant changes in the financial
performance after M&A, using “paired sample t-test” at significance level of 0.05 or
95% and also descriptive statistics analysis has been performed to ascertain the
difference between pre and post acquisition period. The results are shown in table –
3.5.1 related to the Gross Profit Margin.
All selected companies Gross Profit margin results are more than the significance
level. Therefore null hypothesis is accepted. Hence forth null hypothesis states that
there is no significant difference between profitability in pre and post acquisition
period. The profitability ratio results indicate decline in post acquisition period
performance due to the high operational charges and financial charges.
Further, it has been observed that the skewness is not high. Whereas, it seems to be
more or less in the normal range between -2.029 to 0.968 in pre and post acquisition
period. The kurtosis is observed that it is less than 3 except in Fortis Healthcare Ltd. It
indicates that platykurtic is distributed over a wider range. The Gross Profit Margin of
Fortis Healthcare Ltd negatively decreased in the post acquisition.

163
Table: 3.5.2 T –test, Skewness and Kurtosis for Net Profit Margin
Companies T- Value P-value Skewness S E Kurtosis SE
BAL 2.783 0.109 -0.858 0.845 1.334 1.741
HGSL 1.688 0.233 -0.656 0.845 0.301 1.741
HZL 0.655 0.580 0.116 0.845 0.987 1.741
LIL 6.001 0.027 0.314 0.845 -1.874 1.741
FHL -2.263 0.152 0.040 0.845 -0.112 1.741
JSPL 1.513 0.269 -1.171 0.845 0.925 1.741
M&ML -1.013 0.418 -0.642 0.845 0.401 1.741
TCL 1.18 0.360 2.053 0.845 4.304 1.741
GTLIL -0.837 0.491 1.963 0.845 4.119 1.741
RPL -1.386 0.300 0.961 0.845 2.362 1.741 (Source: AGM reports of selected companies & moneycontrol.com database)
Pre and Post M&A financial performance standards of acquiring firms are
compared to see if there are any statistically significant changes in the financial
performance after M&A, using “paired sample t-test” at significance level of 0.05 or
95% and also descriptive statistics analysis has been performed to ascertain the
difference between pre and post acquisition period. The results are shown in table –
3.5.2 related to the Net Profit Margin.
All selected companies Net Profit Margin results are more than the significance level.
Therefore null hypothesis is accepted. Hence forth null hypothesis states that there is
no significant difference between profitability in pre and post acquisition period. The
Net Profit Margin results indicate decline in post acquisition period performance due
to the high financial charges and high overheads.
Further, it has been observed that the skewness is not high. Whereas, it seems to be
more or less in the normal range between -1.171 to 2.053 in pre and post acquisition
period. The kurtosis is observed that it is less than three except in Tata Chemicals Ltd
and GTL Infrastructure Ltd. It indicates that platykurtic is distributed over a wider
range. The Net Profit Margin of Tata Chemicals Ltd and GTL Infrastructure Ltd have
more than two times variation in post acquisition period.

164
Table: 3.5.3 T –test, Skewness and Kurtosis for Return on Assets
Companies T- Value P-value Skewness S E Kurtosis SE
BAL -1.526 0.266 -1.345 0.845 1.851 1.741
HGSL -0.767 0.523 -0.350 0.845 0.988 1.741
HZL 5.062 0.037 0.591 0.845 1.786 1.741
LIL 9.540 0.011 0.184 0.845 -2.796 1.741
FHL -23.05 0.002 -0.074 0.845 -3.019 1.741
JSPL 1.933 0.193 1.831 0.845 3.428 1.741
M&ML -2.889 0.102 0.676 0.845 1.115 1.741
TCL -5.759 0.029 -0.643 0.845 0.211 1.741
GTLIL -0.116 0.918 -0.107 0.845 0.780 1.741
RPL -0.993 0.425 -2.423 0.845 5.899 1.741 (Source: AGM reports of selected companies & moneycontrol.com database)
Pre and Post M&A financial performance standards of acquiring firms are
compared to see if there are any statistically significant changes in the financial
performance after M&A, using “paired sample t-test” at significance level of 0.05 or
95% and also descriptive statistics analysis has been performed to ascertain the
difference between pre and post acquisition period. The results are shown in table –
3.5.3 related to the Return on Assets.
Among the selected companies, Return on Assets of Bharti Airtel Ltd, Hinduja Global
Solutions Ltd, Jindal Steel and Power Ltd, Mahindra and Mahindra Ltd, GTL
Infrastructure Ltd and Reliance Power Ltd have shown more than the significance
level. Therefore null hypothesis is accepted. Hence forth null hypothesis states that
there is no significant difference between profitability of selected firms in pre and
post acquisition period. In case of Hindustan Zinc Ltd, Lanco Infratech Ltd, Fortis
Healthcare Ltd and Tata Chemicals Ltd, the result was less than the significance level
at 0.05. Therefore null hypothesis is rejected. The Return on Assets results indicate
decline in post acquisition period performance. It indicates lower sales revenue
generated through ineffective utilisation of optimum assets.
Further, it has been observed that the skewness is not high. Whereas, it seems to be
more or less in the normal range between -2.423 to 1.831 in pre and post acquisition
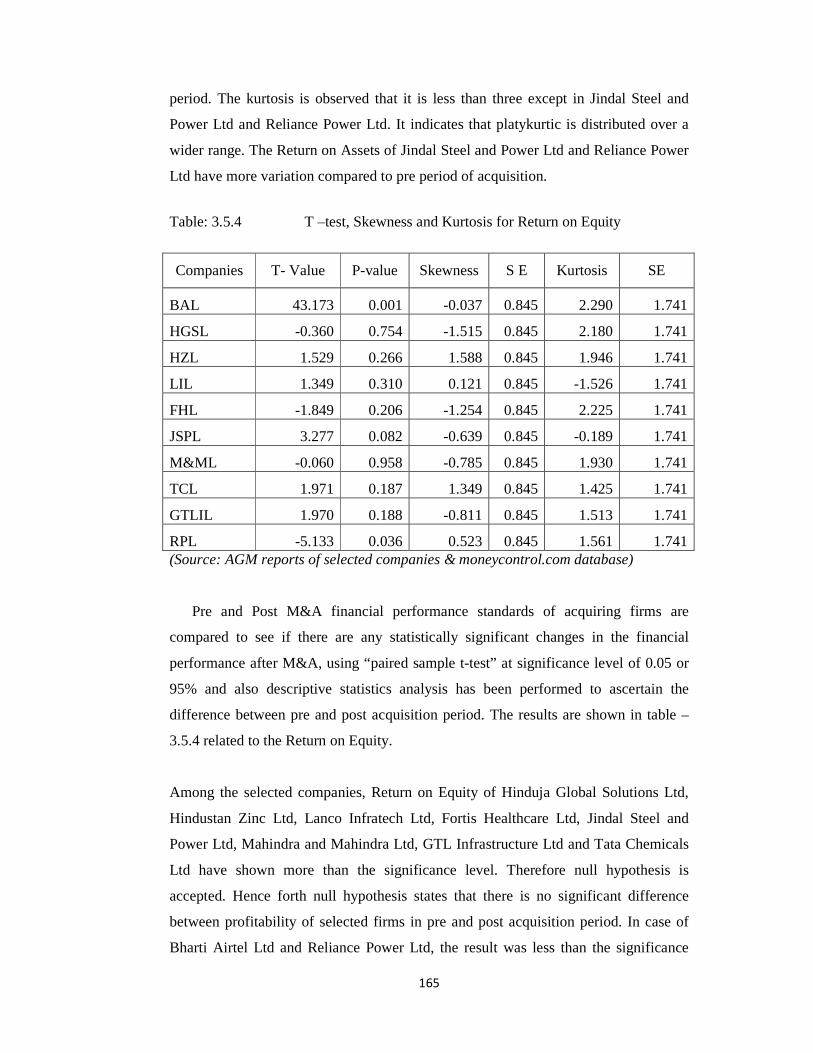
165
period. The kurtosis is observed that it is less than three except in Jindal Steel and
Power Ltd and Reliance Power Ltd. It indicates that platykurtic is distributed over a
wider range. The Return on Assets of Jindal Steel and Power Ltd and Reliance Power
Ltd have more variation compared to pre period of acquisition.
Table: 3.5.4 T –test, Skewness and Kurtosis for Return on Equity
Companies T- Value P-value Skewness S E Kurtosis SE
BAL 43.173 0.001 -0.037 0.845 2.290 1.741
HGSL -0.360 0.754 -1.515 0.845 2.180 1.741
HZL 1.529 0.266 1.588 0.845 1.946 1.741
LIL 1.349 0.310 0.121 0.845 -1.526 1.741
FHL -1.849 0.206 -1.254 0.845 2.225 1.741
JSPL 3.277 0.082 -0.639 0.845 -0.189 1.741
M&ML -0.060 0.958 -0.785 0.845 1.930 1.741
TCL 1.971 0.187 1.349 0.845 1.425 1.741
GTLIL 1.970 0.188 -0.811 0.845 1.513 1.741
RPL -5.133 0.036 0.523 0.845 1.561 1.741 (Source: AGM reports of selected companies & moneycontrol.com database)
Pre and Post M&A financial performance standards of acquiring firms are
compared to see if there are any statistically significant changes in the financial
performance after M&A, using “paired sample t-test” at significance level of 0.05 or
95% and also descriptive statistics analysis has been performed to ascertain the
difference between pre and post acquisition period. The results are shown in table –
3.5.4 related to the Return on Equity.
Among the selected companies, Return on Equity of Hinduja Global Solutions Ltd,
Hindustan Zinc Ltd, Lanco Infratech Ltd, Fortis Healthcare Ltd, Jindal Steel and
Power Ltd, Mahindra and Mahindra Ltd, GTL Infrastructure Ltd and Tata Chemicals
Ltd have shown more than the significance level. Therefore null hypothesis is
accepted. Hence forth null hypothesis states that there is no significant difference
between profitability of selected firms in pre and post acquisition period. In case of
Bharti Airtel Ltd and Reliance Power Ltd, the result was less than the significance

166
level at 0.05. Therefore null hypothesis is rejected. The Return on Equity results
indicate decline in post acquisition period performance due to less reserve
accumulation and declined profits in the post acquisition period.
Further, it has been observed that the skewness is not high. Whereas, it seems to be
more or less in the normal range between -1.254 to 1.588 in pre and post acquisition
period. The kurtosis is observed that it is less than three in all selected companies. It
indicates that platykurtic is distributed over a wider range.
Table: 3.5.5 T –test, Skewness and Kurtosis for Return on Capital Employed
Companies T- Value P-value Skewness S E Kurtosis SE
BAL 12.72 0.006 -0.126 0.845 2.290 1.741
HGSL -0.439 0.704 -0.799 0.845 1.230 1.741
HZL 1.597 0.251 1.755 0.845 2.675 1.741
LIL 1.242 0.340 0.808 0.845 -1.621 1.741
FHL -1.65 0.242 -0.210 0.845 -0.138 1.741
JSPL 3.048 0.093 0.066 0.845 -1.401 1.741
M&ML -2.196 0.159 -1.068 0.845 0.103 1.741
TCL 0.294 0.797 0.397 0.845 0.019 1.741
GTLIL 0.062 0.956 -1.476 0.845 2.755 1.741
RPL -2.155 0.164 1.821 0.845 3.488 1.741
(Source: AGM reports of selected companies & moneycontrol.com database)
Pre and Post M&A financial performance standards of acquiring firms are
compared to see if there are any statistically significant changes in the financial
performance after M&A, using “paired sample t-test” at significance level of 0.05 or
95% and also descriptive statistics analysis has been performed to ascertain the
difference between pre and post acquisition period. The results are shown in table –
3.5.5 related to the Return on Capital Employed.
Among the selected companies, Return on Capital Employed of Hinduja Global
Solutions Ltd, Hindustan Zinc Ltd, Lanco Infratech Ltd, Fortis Healthcare Ltd, Jindal

167
Steel and Power Ltd, Mahindra and Mahindra Ltd, GTL Infrastructure Ltd, Tata
Chemicals Ltd and Reliance Power Ltd have shown more than the significance level.
Therefore null hypothesis is accepted. Hence forth null hypothesis states that there is
no significant difference between profitability of selected firms in pre and post
acquisition period. In case of Bharti Airtel Ltd, the result was less than the
significance level at 0.05. Therefore null hypothesis is rejected. The Return on Capital
Employed of Bharti Airtel Ltd has decreased more than 50% in post period of
acquisition. It indicates declines in profits earned on capital employed.
Further, it has been observed that the skewness is not high. Whereas, it seems to be
more or less in the normal range between -1.476 to 1.821 in pre and post acquisition
period. The kurtosis is observed that it is less than three except in Reliance Power Ltd.
It indicates that platykurtic is distributed over a wider range. The Return on Capital
Employed of Reliance Power Ltd has more variation compared to pre period of
acquisition.
Table: 3.5.6 T –test, Skewness and Kurtosis for Debt Equity Ratio
Companies T- Value P-value Skewness S E Kurtosis SE
BAL 2.514 0.128 1.069 0.845 0.636 1.741
HGSL -4.583 0.044 -1.190 0.845 1.411 1.741
LIL -3.892 0.060 -0.604 0.845 -1.432 1.741
FHL 0.974 0.433 2.101 0.845 4.842 1.741
JSPL -1.258 0.335 -0.466 0.845 -0.089 1.741
M&ML 3.977 0.058 0.697 0.845 1.198 1.741
TCL 0.811 0.503 1.559 0.845 2.545 1.741
GTLIL -0.421 0.715 -1.125 0.845 0.167 1.741
RPL -1.993 0.184 0.983 0.845 1.786 1.741 (Source: AGM reports of selected companies & moneycontrol.com database)
Pre and Post M&A financial performance standards of acquiring firms are
compared to see if there are any statistically significant changes in the financial
performance after M&A, using “paired sample t-test” at significance level of 0.05 or
95% and also descriptive statistics analysis has been performed to ascertain the

168
difference between pre and post acquisition period. The results are shown in table –
3.5.6 related to the Debt Equity Ratio.
Among the selected companies, Debt Equity Ratio of Bharti Airtel Ltd, Hindustan
Zinc Ltd, Lanco Infratech Ltd, Fortis Healthcare Ltd, Jindal Steel and Power Ltd,
Mahindra and Mahindra Ltd, GTL Infrastructure Ltd, Tata Chemicals Ltd and
Reliance Power Ltd have shown more than the significance level. Therefore null
hypothesis is accepted. Hence forth null hypothesis states that there is no significant
difference between leverage position of selected firms in pre and post acquisition
period. In case of Hinduja Global Solutions Ltd, the result was less than the
significance level at 0.05. Therefore null hypothesis is rejected. The Debt Equity
Ratio of Hinduja Global Solutions Ltd has increased in post period of acquisition. It
indicates higher leverage policy by infusing more debt funds in its capital structure.
Further, it has been observed that the skewness is not high. Whereas, it seems to be
more or less in the normal range between -1.190 to 2.101 in pre and post acquisition
period. The kurtosis is observed that it is less than three except in Fortis Healthcare
Ltd. It indicates that platykurtic is distributed over a wider range. The Debt Equity
Ratio of Fortis Healthcare Ltd has less variation compared to pre period of
acquisition.
Table: 3.5.7 T –test, Skewness and Kurtosis for Total Capitalisation
Companies T- Value P-value Skewness S E Kurtosis SE
BAL 1.900 0.198 1.418 0.845 2.061 1.741
HGSL -3.928 0.059 -1.291 0.845 1.779 1.741
HZL 1.561 0.259 1.885 0.845 3.369 1.741
LIL -3.330 0.080 -0.993 0.845 -0.158 1.741
FHL 0.706 0.553 1.416 0.845 2.768 1.741
JSPL -1.485 0.276 -0.701 0.845 0.731 1.741
M&ML 5.03 0.037 0.442 0.845 1.809 1.741
TCL 0.680 0.566 1.072 0.845 0.846 1.741
GTLIL -0.961 0.438 -1.214 0.845 1.257 1.741
RPL -1.992 0.185 0.986 0.845 1.767 1.741 (Source: AGM reports of selected companies & moneycontrol.com database)

169
Pre and Post M&A financial performance standards of acquiring firms are
compared to see if there are any statistically significant changes in the financial
performance after M&A, using “paired sample t-test” at significance level of 0.05 or
95% and also descriptive statistics analysis has been performed to ascertain the
difference between pre and post acquisition period. The results are shown in table –
3.5.6 related to the Total Capitalisation.
Among the selected companies, Total Capitalisation of Bharti Airtel Ltd, Hinduja
Global Solutions Ltd, Hindustan Zinc Ltd, Lanco Infratech Ltd, Fortis Healthcare Ltd,
Jindal Steel and Power Ltd, GTL Infrastructure Ltd, Tata Chemicals Ltd and Reliance
Power Ltd have shown more than the significance level. Therefore null hypothesis is
accepted. Hence forth null hypothesis states that there is no significant difference
between leverage position of selected firms in pre and post acquisition period. In case
of Mahindra and Mahindra Ltd, the result was less than the significance level at 0.05.
Therefore null hypothesis is rejected. The Total Capitalisation of Mahindra &
Mahindra Ltd has decreased in post period of acquisition. It indicates less debt
addition to the capital structure compared to the pre acquisition period.
Further, it has been observed that the skewness is not high. Whereas, it seems to be
more or less in the normal range between -1.291 to 1.885 in pre and post acquisition
period. The kurtosis is observed that it is less than three in all selected companies. It
indicates that platykurtic is distributed over a wider range.
Pre and Post M&A financial performance standards of acquiring firms are
compared to see if there are any statistically significant changes in the financial
performance after M&A, using “paired sample t-test” at significance level of 0.05 or
95% and also descriptive statistics analysis has been performed to ascertain the
difference between pre and post acquisition period. The results are shown in table –
3.5.8 related to the Earnings per Share.

170
Table: 3.5.8 T –test, Skewness and Kurtosis for Earnings per Share
Companies T- Value P-value Skewness S E Kurtosis SE
BAL 1.991 0.185 -0.314 0.845 1.875 1.741
HGSL 1.062 0.399 2.449 0.845 5.998 1.741
HZL 5.28 0.034 0.359 0.845 2.533 1.741
LIL 2.630 0.119 0.916 0.845 -1.139 1.741
FHL -2.41 0.138 0.389 0.845 -0.655 1.741
JSPL 2.512 0.129 1.572 0.845 2.452 1.741
M&ML -0.949 0.443 -0.968 0.845 2.613 1.741
TCL 0.789 0.513 1.738 0.845 3.497 1.741
GTLIL -1.425 0.290 -2.100 0.845 4.421 1.741
RPL -9.969 0.010 0.014 0.845 0.285 1.741 (Source: AGM reports of selected companies & moneycontrol.com database)
Among the selected companies, Earnings per Share of Bharti Airtel Ltd Hinduja
Global Solutions Ltd, Lanco Infratech Ltd, Fortis Healthcare Ltd, Jindal Steel and
Power Ltd, Mahindra and Mahindra Ltd, GTL Infrastructure Ltd and Tata Chemicals
Ltd have shown more than the significance level. Therefore null hypothesis is
accepted. Hence forth null hypothesis states that there is no significant difference
between capital market performance of selected firms in pre and post acquisition
period. In case of, Hindustan Zinc Ltd and Reliance Power Ltd the result was less
than the significance level at 0.05. Therefore null hypothesis is rejected. The Earnings
per Share of Hindustan Zinc Ltd and Reliance Power Ltd has more than 50% variation
in post period of acquisition. It indicates higher operating expenses and proportionate
decrease in sales revenue.
Further, it has been observed that the skewness is not high. Whereas, it seems to be
more or less in the normal range between -2.100 to 2.449 in pre and post acquisition
period. The kurtosis is observed that it is less than three except in Hinduja Global
Solutions Ltd and Tata Chemicals Ltd. It indicates that platykurtic is distributed over
a wider range. The Earnings per Share of Hinduja Global Solutions Ltd and Tata
Chemicals Ltd have less variation compared to pre period of acquisition.
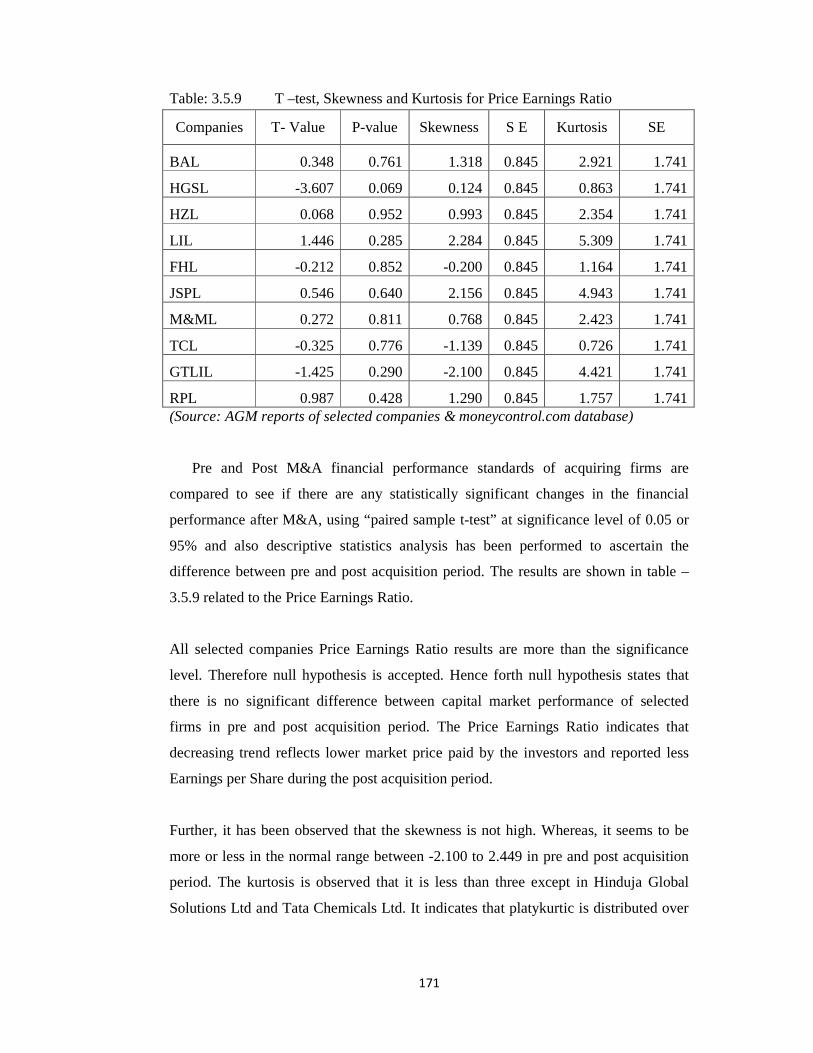
171
Table: 3.5.9 T –test, Skewness and Kurtosis for Price Earnings Ratio
Companies T- Value P-value Skewness S E Kurtosis SE
BAL 0.348 0.761 1.318 0.845 2.921 1.741
HGSL -3.607 0.069 0.124 0.845 0.863 1.741
HZL 0.068 0.952 0.993 0.845 2.354 1.741
LIL 1.446 0.285 2.284 0.845 5.309 1.741
FHL -0.212 0.852 -0.200 0.845 1.164 1.741
JSPL 0.546 0.640 2.156 0.845 4.943 1.741
M&ML 0.272 0.811 0.768 0.845 2.423 1.741
TCL -0.325 0.776 -1.139 0.845 0.726 1.741
GTLIL -1.425 0.290 -2.100 0.845 4.421 1.741
RPL 0.987 0.428 1.290 0.845 1.757 1.741 (Source: AGM reports of selected companies & moneycontrol.com database)
Pre and Post M&A financial performance standards of acquiring firms are
compared to see if there are any statistically significant changes in the financial
performance after M&A, using “paired sample t-test” at significance level of 0.05 or
95% and also descriptive statistics analysis has been performed to ascertain the
difference between pre and post acquisition period. The results are shown in table –
3.5.9 related to the Price Earnings Ratio.
All selected companies Price Earnings Ratio results are more than the significance
level. Therefore null hypothesis is accepted. Hence forth null hypothesis states that
there is no significant difference between capital market performance of selected
firms in pre and post acquisition period. The Price Earnings Ratio indicates that
decreasing trend reflects lower market price paid by the investors and reported less
Earnings per Share during the post acquisition period.
Further, it has been observed that the skewness is not high. Whereas, it seems to be
more or less in the normal range between -2.100 to 2.449 in pre and post acquisition
period. The kurtosis is observed that it is less than three except in Hinduja Global
Solutions Ltd and Tata Chemicals Ltd. It indicates that platykurtic is distributed over
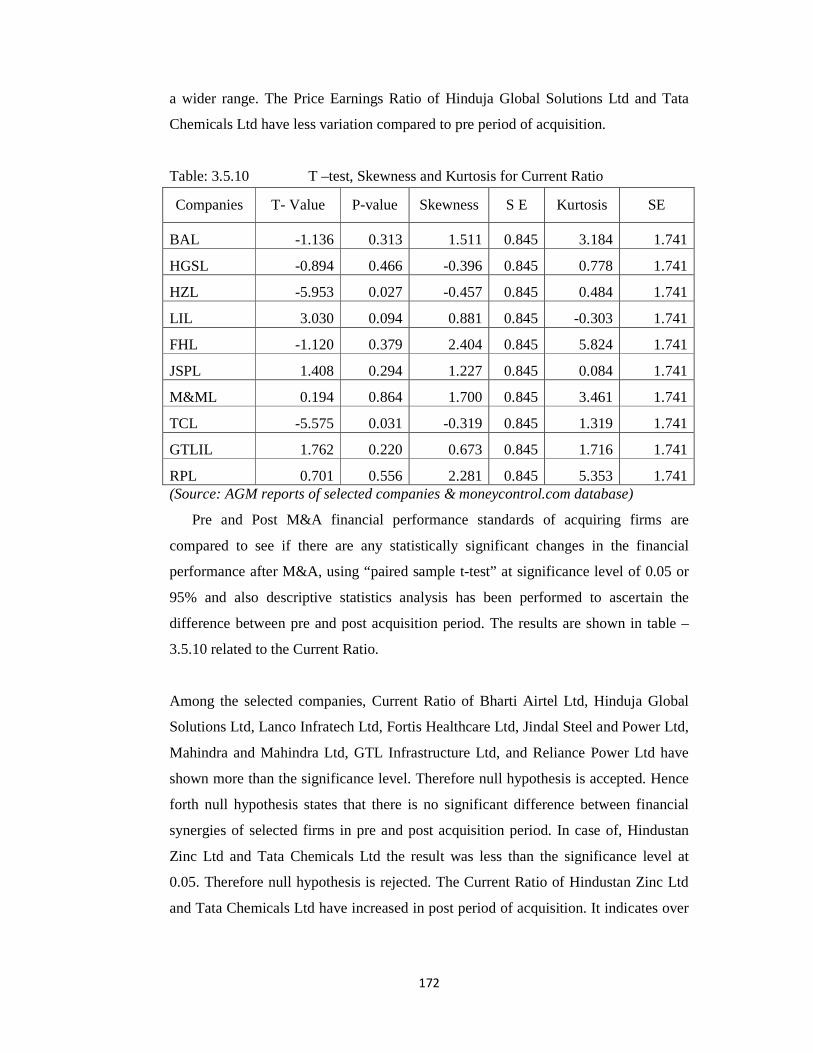
172
a wider range. The Price Earnings Ratio of Hinduja Global Solutions Ltd and Tata
Chemicals Ltd have less variation compared to pre period of acquisition.
Table: 3.5.10 T –test, Skewness and Kurtosis for Current Ratio
Companies T- Value P-value Skewness S E Kurtosis SE
BAL -1.136 0.313 1.511 0.845 3.184 1.741
HGSL -0.894 0.466 -0.396 0.845 0.778 1.741
HZL -5.953 0.027 -0.457 0.845 0.484 1.741
LIL 3.030 0.094 0.881 0.845 -0.303 1.741
FHL -1.120 0.379 2.404 0.845 5.824 1.741
JSPL 1.408 0.294 1.227 0.845 0.084 1.741
M&ML 0.194 0.864 1.700 0.845 3.461 1.741
TCL -5.575 0.031 -0.319 0.845 1.319 1.741
GTLIL 1.762 0.220 0.673 0.845 1.716 1.741
RPL 0.701 0.556 2.281 0.845 5.353 1.741 (Source: AGM reports of selected companies & moneycontrol.com database)
Pre and Post M&A financial performance standards of acquiring firms are
compared to see if there are any statistically significant changes in the financial
performance after M&A, using “paired sample t-test” at significance level of 0.05 or
95% and also descriptive statistics analysis has been performed to ascertain the
difference between pre and post acquisition period. The results are shown in table –
3.5.10 related to the Current Ratio.
Among the selected companies, Current Ratio of Bharti Airtel Ltd, Hinduja Global
Solutions Ltd, Lanco Infratech Ltd, Fortis Healthcare Ltd, Jindal Steel and Power Ltd,
Mahindra and Mahindra Ltd, GTL Infrastructure Ltd, and Reliance Power Ltd have
shown more than the significance level. Therefore null hypothesis is accepted. Hence
forth null hypothesis states that there is no significant difference between financial
synergies of selected firms in pre and post acquisition period. In case of, Hindustan
Zinc Ltd and Tata Chemicals Ltd the result was less than the significance level at
0.05. Therefore null hypothesis is rejected. The Current Ratio of Hindustan Zinc Ltd
and Tata Chemicals Ltd have increased in post period of acquisition. It indicates over
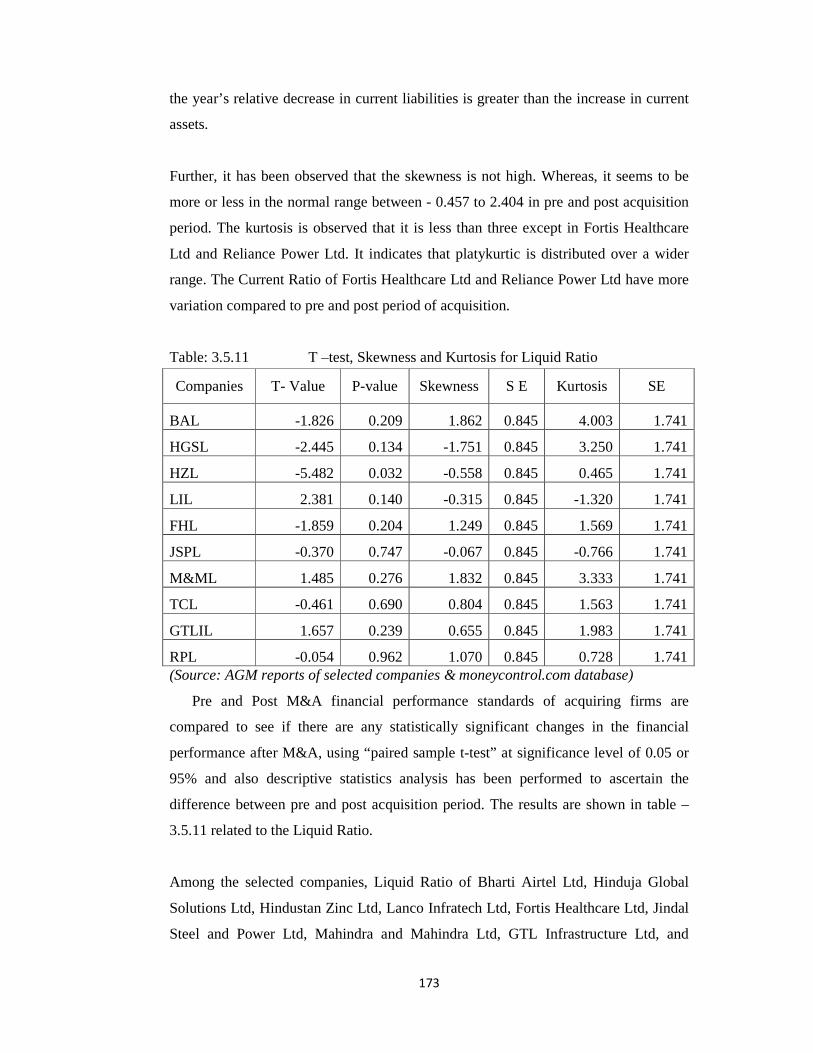
173
the year’s relative decrease in current liabilities is greater than the increase in current
assets.
Further, it has been observed that the skewness is not high. Whereas, it seems to be
more or less in the normal range between - 0.457 to 2.404 in pre and post acquisition
period. The kurtosis is observed that it is less than three except in Fortis Healthcare
Ltd and Reliance Power Ltd. It indicates that platykurtic is distributed over a wider
range. The Current Ratio of Fortis Healthcare Ltd and Reliance Power Ltd have more
variation compared to pre and post period of acquisition.
Table: 3.5.11 T –test, Skewness and Kurtosis for Liquid Ratio
Companies T- Value P-value Skewness S E Kurtosis SE
BAL -1.826 0.209 1.862 0.845 4.003 1.741
HGSL -2.445 0.134 -1.751 0.845 3.250 1.741
HZL -5.482 0.032 -0.558 0.845 0.465 1.741
LIL 2.381 0.140 -0.315 0.845 -1.320 1.741
FHL -1.859 0.204 1.249 0.845 1.569 1.741
JSPL -0.370 0.747 -0.067 0.845 -0.766 1.741
M&ML 1.485 0.276 1.832 0.845 3.333 1.741
TCL -0.461 0.690 0.804 0.845 1.563 1.741
GTLIL 1.657 0.239 0.655 0.845 1.983 1.741
RPL -0.054 0.962 1.070 0.845 0.728 1.741 (Source: AGM reports of selected companies & moneycontrol.com database)
Pre and Post M&A financial performance standards of acquiring firms are
compared to see if there are any statistically significant changes in the financial
performance after M&A, using “paired sample t-test” at significance level of 0.05 or
95% and also descriptive statistics analysis has been performed to ascertain the
difference between pre and post acquisition period. The results are shown in table –
3.5.11 related to the Liquid Ratio.
Among the selected companies, Liquid Ratio of Bharti Airtel Ltd, Hinduja Global
Solutions Ltd, Hindustan Zinc Ltd, Lanco Infratech Ltd, Fortis Healthcare Ltd, Jindal
Steel and Power Ltd, Mahindra and Mahindra Ltd, GTL Infrastructure Ltd, and

174
Reliance Power Ltd have shown more than the significance level. Therefore null
hypothesis is accepted. Hence forth null hypothesis states that there is no significant
difference between financial synergies of selected firms in pre and post acquisition
period. In case of, Tata Chemicals Ltd the result was less than the significance level at
0.05. Therefore null hypothesis is rejected. The Liquid Ratio of Tata Chemicals Ltd
has increased in post period of acquisition. It indicates that current assets are not
highly dependent on inventory and sundry debtors.
Further, it has been observed that the skewness is not high. Whereas, it seems to be
more or less in the normal range between – 1.751 to 1.862 in pre and post acquisition
period. The kurtosis is observed that it is less than three except in Bharti Airtel Ltd. It
indicates that platykurtic is distributed over a wider range. The Liquid Ratio of Bharti
Airtel Ltd has more variation compared to pre period of acquisition.
Table: 3.5.12 T –test, Skewness and Kurtosis for Interest Coverage
Companies T- Value P-value Skewness S E Kurtosis SE
BAL 1.596 0.252 0.010 0.845 1.179 1.741
HGSL 2.471 0.132 1.041 0.845 0.890 1.741
HZL -0.942 0.445 2.408 0.845 5.835 1.741
LIL 2.432 0.140 1.412 0.845 1.690 1.741
FHL -1.195 0.354 1.520 0.845 3.542 1.741
JSPL 0.567 0.628 -0.423 0.845 -0.631 1.741
M&ML -0.086 0.939 1.044 0.845 0.113 1.741
TCL 1.726 0.226 1.813 0.845 3.039 1.741
GTLIL 3.323 0.080 -1.071 0.845 1.386 1.741
RPL -5.245 0.034 0.428 0.845 2.416 1.741 (Source: AGM reports of selected companies & moneycontrol.com database)
Pre and Post M&A financial performance standards of acquiring firms are
compared to see if there are any statistically significant changes in the financial
performance after M&A, using “paired sample t-test” at significance level of 0.05 or
95% and also descriptive statistics analysis has been performed to ascertain the
difference between pre and post acquisition period. The results are shown in table –
3.5.12 related to the Interest Coverage.

175
Among the selected companies, Interest Coverage of Bharti Airtel Ltd, Hinduja
Global Solutions Ltd, Hindustan Zinc Ltd, Lanco Infratech Ltd, Fortis Healthcare Ltd,
Jindal Steel and Power Ltd, Mahindra and Mahindra Ltd, Tata Chemicals Ltd and
GTL Infrastructure Ltd have shown more than the significance level. Therefore null
hypothesis is accepted. Hence forth null hypothesis states that there is no significant
difference between financial synergies of selected firms in pre and post acquisition
period. In case of, Reliance Power Ltd the result was less than the significance level at
0.05. Therefore null hypothesis is rejected. The Interest Coverage of Reliance Power
Ltd has increased in post period of acquisition. It indicates ability to honour its debt
payments due to high profit margin over the post 3 years.
Further, it has been observed that the skewness is not high. Whereas, it seems to be
more or less in the normal range between – 1.071 to 2.408 in pre and post acquisition
period. The kurtosis is observed that it is less than three except in Hindustan Zinc Ltd
and Fortis Healthcare Ltd. It indicates that platykurtic is distributed over a wider
range. The Interest Coverage of Hindustan Zinc Ltd and Fortis Healthcare Ltd have
increased more than 3 times compared to pre period of acquisition.
Table: 3.5.13 T –test, Skewness and Kurtosis for Market Capitalisation
Companies T- Value P-value Skewness S E Kurtosis SE
BAL 0.104 0.927 -0.164 0.845 2.237 1.741
HGSL -2.266 0.152 -0.140 0.845 1.417 1.741
HZL -1.848 0.206 -1.449 0.845 1.441 1.741
LIL 1.927 0.194 1.234 0.845 -0.130 1.741
FHL -2.901 0.101 -0.216 0.845 -1.391 1.741
JSPL -1.270 0.332 -0.228 0.845 -2.472 1.741
M&ML -3.799 0.063 -0.228 0.845 1.421 1.741
TCL -0.621 0.598 -1.590 0.845 2.877 1.741
GTLIL 12.805 0.006 0.144 0.845 2.642 1.741
RPL 0.154 0.892 -0.427 0.845 1.294 1.741 (Source: AGM reports of selected companies & moneycontrol.com database)
Pre and Post M&A financial performance standards of acquiring firms are
compared to see if there are any statistically significant changes in the financial
176
performance after M&A, using “paired sample t-test” at significance level of 0.05 or
95% and also descriptive statistics analysis has been performed to ascertain the
difference between pre and post acquisition period. The results are shown in table –
3.5.13 related to the Market Capitalisation.
Among the selected companies, Market Capitalisation of Bharti Airtel Ltd, Hinduja
Global Solutions Ltd, Hindustan Zinc Ltd, Lanco Infratech Ltd, Fortis Healthcare Ltd,
Jindal Steel and Power Ltd, Mahindra and Mahindra Ltd, Tata Chemicals Ltd and
Reliance Power Ltd have shown more than the significance level. Therefore null
hypothesis is accepted. Hence forth null hypothesis states that there is no significant
difference between financial synergies of selected firms in pre and post acquisition
period. In case of, GTL Infrastructure Ltd the result was less than the significance
level at 0.05. Therefore null hypothesis is rejected. The Market Capitalisation of GTL
Infrastructure Ltd has increased in post period of acquisition. It indicates future
growth prospects are uncertain on account of intense competition and decrease in
equity funds in the capital structure.
Further, it has been observed that the skewness is not high. Whereas, it seems to be
more or less in the normal range between – 1.590 to 1.234 in pre and post acquisition
period. The kurtosis is observed that it is less than three in all selected firms. It
indicates that platykurtic is distributed over a wider range.
Pre and Post M&A financial performance standards of acquiring firms are
compared to see if there are any statistically significant changes in the financial
performance after M&A, using “paired sample t-test” at significance level of 0.05 or
95% and also descriptive statistics analysis has been performed to ascertain the
difference between pre and post acquisition period. The results are shown in table –
3.5.14 related to the Investment Turnover Ratio.

177
Table: 3.5.14 T –test, Skewness and Kurtosis for Investment Turnover Ratio
Companies T- Value P-value Skewness S E Kurtosis SE
BAL 12.095 0.007 0.181 0.845 2.563 1.741
HGSL -3.418 0.076 -1.265 0.845 1.476 1.741
HZL 1.599 0.251 1.856 0.845 3.213 1.741
LIL -0.271 0.812 0.113 0.845 -1.238 1.741
FHL 23 0.020 0.060 0.845 -3.006 1.741
JSPL 4.462 0.047 0.420 0.845 -2.064 1.741
M&ML -1.60 0.251 -0.276 0.845 0.489 1.741
TCL -0.015 0.989 -1.073 0.845 0.714 1.741
GTLIL -2.219 0.157 1.385 0.845 1.634 1.741
RPL 0 0 0.075 0.845 1.550 1.741 (Source: AGM reports of selected companies & moneycontrol.com database)
Among the selected companies, Investment Turnover Ratio of Hinduja Global
Solutions Ltd, Hindustan Zinc Ltd, Lanco Infratech Ltd, Mahindra and Mahindra Ltd,
GTL Infrastructure Ltd, and Reliance Power Ltd have shown more than the
significance level. Therefore null hypothesis is accepted. Hence forth null hypothesis
states that there is no significant difference between managerial synergies of selected
firms in pre and post acquisition period. In case of Bharti Airtel Ltd, Fortis Healthcare
Ltd, Jindal Steel and Power Ltd and Tata Chemicals Ltd, the result was less than the
significance level at 0.05. Therefore null hypothesis is rejected. The Investment
Turnover Ratio of Bharti Airtel Ltd, Fortis Healthcare Ltd, Jindal Steel and Power Ltd
and Tata Chemicals Ltd have decreased in post period of acquisition. It indicates that
there was an inefficiency to utilise the investment to improving turnover.
Further, it has been observed that the skewness is not high. Whereas, it seems to be
more or less in the normal range between – 1.265 to 1.856 in pre and post acquisition
period. The kurtosis is observed that it is less than three in all selected companies. It
indicates that platykurtic is distributed over a wider range.

178
Table: 3.5.15 T –test, Skewness and Kurtosis for Fixed Assets Turnover Ratio
Companies T- Value P-value Skewness S E Kurtosis SE
BAL 1.907 0.197 0.683 0.845 1.873 1.741
HGSL -4.387 0.048 -0.500 0.845 0.596 1.741
HZL 1.293 0.325 2.237 0.845 5.068 1.741
LIL 1.670 0.237 -0.717 0.845 -0.810 1.741
FHL -1.169 0.247 2.130 0.845 4.764 1.741
JSPL 0.911 0.458 0.616 0.845 -0.187 1.741
M&ML -0.40 0.728 0.310 0.845 0.341 1.741
TCL -0.530 0.649 0.362 0.845 0.675 1.741
GTLIL -4 0.057 -0.245 0.845 2.414 1.741
RPL -7.17 0.19 -0.504 0.845 0.631 1.741 (Source: AGM reports of selected companies & moneycontrol.com database)
Pre and Post M&A financial performance standards of acquiring firms are
compared to see if there are any statistically significant changes in the financial
performance after M&A, using “paired sample t-test” at significance level of 0.05 or
95% and also descriptive statistics analysis has been performed to ascertain the
difference between pre and post acquisition period. The results are shown in table –
3.5.15 related to the Fixed Assets Turnover Ratio.
Among the selected companies, Fixed Assets Turnover Ratio of Bharti Airtel Ltd,
Hindustan Zinc Ltd, Lanco Infratech Ltd, Fortis Healthcare Ltd, Jindal Steel and
Power Ltd, Mahindra and Mahindra Ltd, Tata Chemicals Ltd and Reliance Power Ltd
have shown more than the significance level. Therefore null hypothesis is accepted.
Hence forth null hypothesis states that there is no significant difference between
managerial synergies of selected firms in pre and post acquisition period. In case of,
Hinduja Global Solutions Ltd and GTL Infrastructure Ltd the result was less than the
significance level at 0.05. Therefore null hypothesis is rejected. The Fixed Assets
Turnover Ratio of Reliance Power Ltd has increased in post period of acquisition. It
indicates lack of operational efficiency and lack of revenue generating activities.
Further, it has been observed that the skewness is not high. Whereas, it seems to be
more or less in the normal range between – 0.717 to 2.237 in pre and post acquisition

179
period. The kurtosis is observed that it is less than three except in Hindustan Zinc Ltd
and Fortis Healthcare Ltd. It indicates that platykurtic is distributed over a wider
range. The Fixed Assets Turnover Ratio of Hindustan Zinc Ltd and Fortis Healthcare
Ltd have more variation in the pre and post period of acquisition.
Table: 3.5.16 T –test, Skewness and Kurtosis for Total Assets Turnover Ratio
Companies T- Value P-value Skewness S E Kurtosis SE
BAL 41.57 0.01 0.005 0.845 1.373 1.741
HGSL -2.853 0.104 -1.547 0.845 2.659 1.741
HZL 1.561 0.259 1.885 0.845 3.369 1.741
LIL -0.278 0.807 0.121 0.845 -1.260 1.741
FHL 23 0.020 0.060 0.845 -3.006 1.741
JSPL 3.929 0.059 0.491 0.845 -1.808 1.741
M&ML -1.646 0.242 -0.244 0.845 0.548 1.741
TCL 0 1.00 -1.049 0.845 0.839 1.741
GTLIL -1.987 0.185 1.367 0.845 1.844 1.741
RPL 0 1.00 0.075 0.845 1.550 1.741
(Source: AGM reports of selected companies & moneycontrol.com database)
Pre and Post M&A financial performance standards of acquiring firms are
compared to see if there are any statistically significant changes in the financial
performance after M&A, using “paired sample t-test” at significance level of 0.05 or
95% and also descriptive statistics analysis has been performed to ascertain the
difference between pre and post acquisition period. The results are shown in table –
3.5.16 related to the Total Assets Turnover Ratio.
Among the selected companies, Total Assets Turnover Ratio of Hinduja Global
Solutions Ltd, Hindustan Zinc Ltd, Lanco Infratech Ltd, Jindal Steel and Power Ltd,
Mahindra and Mahindra Ltd, Tata Chemicals Ltd, GTL Infrastructure Ltd and
Reliance Power Ltd have shown more than the significance level. Therefore null
hypothesis is accepted. Hence forth null hypothesis states that there is no significant
difference between managerial synergies of selected firms in pre and post acquisition
period. In case of Bharti Airtel Ltd and Fortis Healthcare Ltd the result was less than
the significance level at 0.05. Therefore null hypothesis is rejected. The Total Assets

180
Turnover Ratio of Reliance Power Ltd has increased in post period of acquisition. It
indicates lack of operational efficiency and lack of revenue generating activities.
Further, it has been observed that the skewness is not high. Whereas, it seems to be
more or less in the normal range between – 1.547 to 1.885 in pre and post acquisition
period. The kurtosis is observed that it is less than three in all selected companies. It
indicates that platykurtic is distributed over a wider range.
Table: 3.5.17 T –test, Skewness and Kurtosis for Operating Profit Margin
Companies T- Value P-value Skewness S E Kurtosis SE
BAL 7.104 0.019 -0.401 0.845 -1.518 1.741
HGSL 1.322 0.317 0.643 0.845 0.323 1.741
HZL 1.535 0.264 0.919 0.845 0.902 1.741
LIL 1.828 0.209 -0.215 0.845 -0.178 1.741
FHL 1.060 0.400 -0.530 0.845 -1.339 1.741
JSPL 2.722 0.113 -0.344 0.845 -0.977 1.741
M&ML -4.274 0.051 1.254 0.845 2.225 1.741
TCL 1.954 0.190 0.960 0.845 1.842 1.741
GTLIL 0.977 0.432 -2.231 0.845 5.201 1.741
RPL 2.103 0.170 -1.679 0.845 2.529 1.741 (Source: AGM reports of selected companies & moneycontrol.com database)
Pre and Post M&A financial performance standards of acquiring firms are
compared to see if there are any statistically significant changes in the financial
performance after M&A, using “paired sample t-test” at significance level of 0.05 or
95% and also descriptive statistics analysis has been performed to ascertain the
difference between pre and post acquisition period. The results are shown in table –
3.5.17 related to the Operating Profit Margin.
Among the selected companies, Operating Profit Margin of Hinduja Global Solutions
Ltd, Hindustan Zinc Ltd, Lanco Infratech Ltd, Fortis Healthcare Ltd, Jindal Steel and
Power Ltd, Mahindra and Mahindra Ltd, Tata Chemicals Ltd, GTL Infrastructure Ltd
and Reliance Power Ltd have shown more than the significance level. Therefore null
hypothesis is accepted. Hence forth null hypothesis states that there is no significant

181
difference between operating synergies of selected firms in pre and post acquisition
period. In case of Bharti Airtel Ltd the result was less than the significance level at
0.05. Therefore null hypothesis is rejected. Operating Profit Margin of Bharti Airtel
Ltd has increased in post period of acquisition. It indicates that lower cash flow
streams generated by operating activities.
Further, it has been observed that the skewness is not high. Whereas, it seems to be
more or less in the normal range between – 2.231 to 1.254 in pre and post acquisition
period. The kurtosis is observed that it is less than three except in GTL Infrastructure
Ltd. It indicates that platykurtic is distributed over a wider range. The Operating
Profit Margin of GTL Infrastructure Ltd has decreased more than 2 times compared to
pre period of acquisition.
Table: 3.5.18 T –test, Skewness and Kurtosis for Value Addition/Shortfall
Companies T- Value P-value Skewness S E Kurtosis SE
BAL 3.311 0.08 -0.635 0.845 -1.018 1.741
HGSL 0.675 0.569 -0.140 0.845 -1.417 1.741
HZL 1.501 0.272 1.918 0.845 4.459 1.741
LIL 1.315 0.319 1.982 0.845 3.884 1.741
FHL -2.303 0.148 0.483 0.845 -1.509 1.741
JSPL 2.172 0.162 1.014 0.845 -0.031 1.741
M&ML 0.174 0.878 0.664 0.845 1.555 1.741
TCL 2.484 0.131 1.384 0.845 1.331 1.741
GTLIL 2.610 0.121 -1.038 0.845 -0.904 1.741
RPL 0.871 0.476 0.249 0.845 -0.875 1.741 (Source: AGM reports of selected companies & moneycontrol.com database)
Pre and Post M&A financial performance standards of acquiring firms are
compared to see if there are any statistically significant changes in the financial
performance after M&A, using “paired sample t-test” at significance level of 0.05 or
95% and also descriptive statistics analysis has been performed to ascertain the
difference between pre and post acquisition period. The results are shown in table –
3.5.18 related to the Value Addition.

182
All selected companies Value Addition results that more than the significance level.
Therefore null hypothesis is accepted. Hence forth null hypothesis states that there is
no significant difference between value addition in pre and post acquisition period.
The Value Addition results indicate decline in post acquisition period performance
due to the increase in cost of overall capital.
Further, it has been observed that the skewness is not high. Whereas, it seems to be
more or less in the normal range between – 1.038 to 1.982 in pre and post acquisition
period. The kurtosis is observed that it is less than three except in Hindustan Zinc Ltd
and Lanco Infratech Ltd It indicates that platykurtic is distributed over a wider range.
The Value Addition of Hindustan Zinc Ltd and Lanco Infratech Ltd have decreased
more than 2 times compared to pre period of acquisition.
Table: 3.5.19 T –test, Skewness and Kurtosis for Economic Value Added
Companies T- Value P-value Skewness S E Kurtosis SE
BAL 0.060 0.420 -1.136 0.845 1.865 1.741
HGSL 0.636 0.590 0.985 0.845 1.398 1.741
HZL -1.039 0.408 -0.273 0.845 1.487 1.741
LIL 2.069 0.174 1.530 0.845 1.629 1.741
FHL 0.573 0.624 -2.247 0.845 5.256 1.741
JSPL 0.112 0.921 -0.926 0.845 -0.281 1.741
M&ML -3.940 0.059 0.403 0.845 -1.653 1.741
TCL 2.233 0.155 1.795 0.845 3.526 1.741
GTLIL 2.933 0.099 -0.305 0.845 -0.663 1.741
RPL 2.265 0.152 0.449 0.845 -0.726 1.741 (Source: AGM reports of selected companies & moneycontrol.com database)
Pre and Post M&A financial performance standards of acquiring firms are
compared to see if there are any statistically significant changes in the financial
performance after M&A, using “paired sample t-test” at significance level of 0.05 or
95% and also descriptive statistics analysis has been performed to ascertain the
difference between pre and post acquisition period. The results are shown in table –
3.5.19 related to the Economic Value Added.
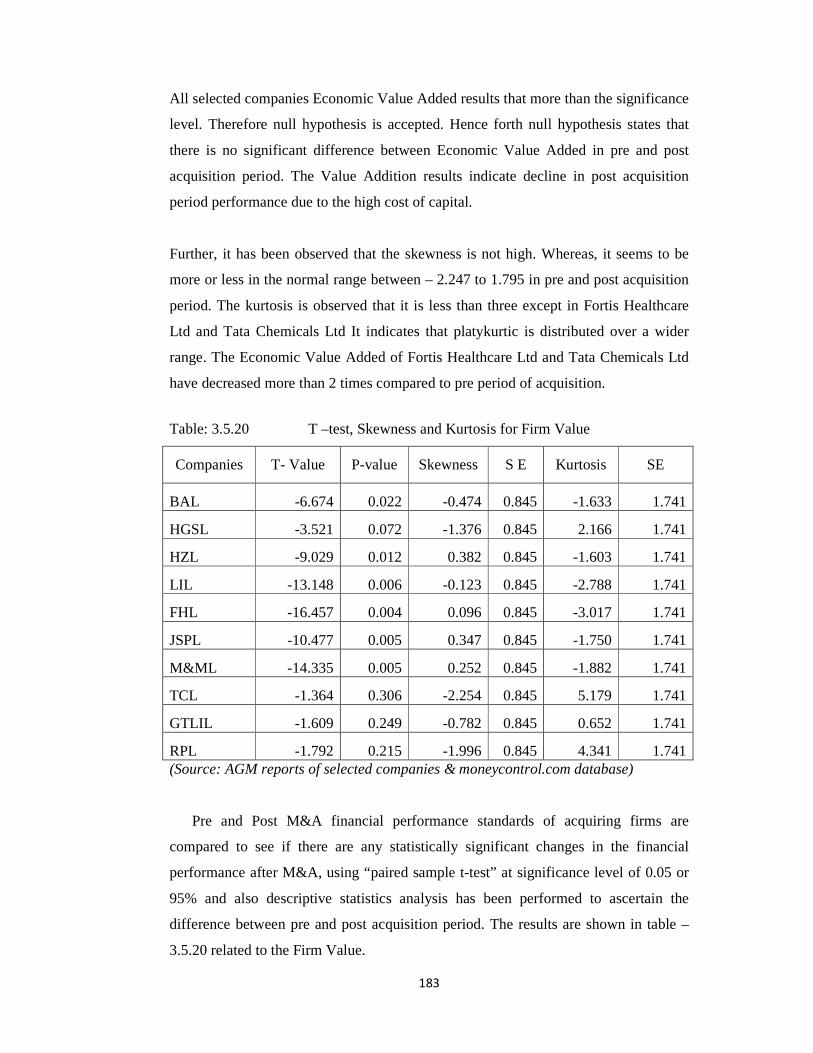
183
All selected companies Economic Value Added results that more than the significance
level. Therefore null hypothesis is accepted. Hence forth null hypothesis states that
there is no significant difference between Economic Value Added in pre and post
acquisition period. The Value Addition results indicate decline in post acquisition
period performance due to the high cost of capital.
Further, it has been observed that the skewness is not high. Whereas, it seems to be
more or less in the normal range between – 2.247 to 1.795 in pre and post acquisition
period. The kurtosis is observed that it is less than three except in Fortis Healthcare
Ltd and Tata Chemicals Ltd It indicates that platykurtic is distributed over a wider
range. The Economic Value Added of Fortis Healthcare Ltd and Tata Chemicals Ltd
have decreased more than 2 times compared to pre period of acquisition.
Table: 3.5.20 T –test, Skewness and Kurtosis for Firm Value
Companies T- Value P-value Skewness S E Kurtosis SE
BAL -6.674 0.022 -0.474 0.845 -1.633 1.741
HGSL -3.521 0.072 -1.376 0.845 2.166 1.741
HZL -9.029 0.012 0.382 0.845 -1.603 1.741
LIL -13.148 0.006 -0.123 0.845 -2.788 1.741
FHL -16.457 0.004 0.096 0.845 -3.017 1.741
JSPL -10.477 0.005 0.347 0.845 -1.750 1.741
M&ML -14.335 0.005 0.252 0.845 -1.882 1.741
TCL -1.364 0.306 -2.254 0.845 5.179 1.741
GTLIL -1.609 0.249 -0.782 0.845 0.652 1.741
RPL -1.792 0.215 -1.996 0.845 4.341 1.741 (Source: AGM reports of selected companies & moneycontrol.com database)
Pre and Post M&A financial performance standards of acquiring firms are
compared to see if there are any statistically significant changes in the financial
performance after M&A, using “paired sample t-test” at significance level of 0.05 or
95% and also descriptive statistics analysis has been performed to ascertain the
difference between pre and post acquisition period. The results are shown in table –
3.5.20 related to the Firm Value.

184
Among the selected companies, Firm Value of Bharti Airtel Ltd, Hindustan Zinc Ltd,
Lanco Infratech Ltd, Fortis Healthcare Ltd, Jindal Steel and Power Ltd and Mahindra
and Mahindra Ltd have shown more than the significance level. Therefore null
hypothesis is accepted. Hence forth null hypothesis states that there is no significant
difference between operating synergies of selected firms in pre and post acquisition
period. In case of Hinduja Global Solutions Ltd, Tata Chemicals Ltd, GTL
Infrastructure Ltd and Reliance Power Ltd the result was less than the significance
level at 0.05. Therefore null hypothesis is rejected. Operating Profit Margin of
Hinduja Global Solutions Ltd, Tata Chemicals Ltd, GTL Infrastructure Ltd and
Reliance Power Ltd have increased in post period of acquisition. It indicates that
lower cash flow streams generated by operating activities.
Further, it has been observed that the skewness is not high. Whereas, it seems to be
more or less in the normal range between – 2.247 to 1.795 in pre and post acquisition
period. The kurtosis is observed that it is less than three except in Fortis Healthcare
Ltd, Tata Chemicals Ltd and Reliance Power Ltd. It indicates that platykurtic is
distributed over a wider range. The Firm Value of Fortis Healthcare Ltd, Tata
Chemicals Ltd and Reliance Power Ltd have increased more than 2 times compared to
pre period of acquisition.

185
Table: 3.5.21 Overall Analysis of Selected Companies on Overall Performance Standards
Ratios Mean Co-efficient of variance
t- Value P value Pre Post Pre Post
Profitability Ratios
GPM 16.96 -34.09 78.34 -18.42 1.554 0.131
NPM 16.22 26.56 57.03 56.18 -1.491 0.147
ROA 160.03 118.54 98.12 126.98 1.473 0.151
ROE 15.03 8.27 92.55 60.45 3.13 0.004
ROCE 16.19 11.63 93.26 136.98 1.94 0.062
Leverage Ratios
DER 0.67 0.69 84.07 80.05 -0.271 0.788
TC 0.367 0.342 139.02 159.81 0.671 0.508
Capital Market Ratios
EPS 62.13 15.34 41.84 97.83 1.783 0.085
PER 32.14 25.49 21.15 57.31 0.208 0.836
Financial Synergies
CR 7.58 3.78 25.02 49.28 0.670 0.508
QR 7.83 8.79 25.87 41.78 -0.269 0.790
In Cv 50.97 187.45 40.59 21.90 -0.914 0.368
M cp 25,289.19 30,660.63 61.09 80.27 -1.312 0.200
Managerial Synergies
ITOR 0.657 0.656 125.38 110.44 0.01 0.992
FAOR 2.55 2.77 86.44 111.24 -0.521 0.607
TAOR 0.664 0.655 122.96 108.99 0.141 0.889
Operational Synergy
OPM 28.44 -26.41 130.88 -14.46 1.723 0.096
EVA Model – Firm Value
VASF 12.02 5.69 179.53 276.63 2.139 0.041
EVA 1047.96 897.54 167.71 200.23 0.407 0.687
FV 8442.40 18122.63 112.78 101.09 -5.173 0.0001

186
The Pre and Post M&A financial performance standards of acquiring firms are
compared to see if there are any statistically significant changes in the overall
financial performance after M&A, using “paired sample t-test” at significance level of
0.05 or 95%. Also, descriptive statistics analysis has been performed to ascertain the
mean difference. The results are shown in table – 3.5.21 related to overall analysis of
selected companies.
Pre and post acquisition period overall analysis table evolves that overall profitability
ratio had drastically decreased in the post acquisition period. Among the profitability
ratios results, statistically were not significant except in the case of Return on Equity.
In the case of leverage ratios it increased from 0.67 to 0.69. It indicates increased
leverage in capital structure. The paired t-test results showed more than the
significance level. The capital market performance declined compared to the pre
acquisition period and statistical t-test proved that there was no significant difference
in leverage ratio compared to the pre and post acquisition period.
The synergy ratios were not able to improve their performance in the post acquisition
period. Financial synergy ratios results increased in the post period performance
except current ratio. Managerial synergy ratio decreased except on fixed assets
turnover ratio. Operational synergy ratio also declined in performance in post
acquisition period. The paired t-test results statistically were not significant in all the
synergy ratios.
Economic value added model shows increasing trend in respect to economic value
added and firm value except value addition. The analysis found more variation in the
post period of acquisition. The paired t-test results that evolved were statistically not
significant at 5% except in firm value and value addition.


