51
CHAPTER-3
HEALTH SCENARIO IN INDIA
Health and socio-economic developments are so closely intertwined
that it is impossible to achieve one without the other. Health is a priority
goal in its own right, as well as central input into economic development and
poverty reduction. Improving the health of individuals, particularly those
belonging to socially and economically disadvantaged groups, is a key
objective of the Indian government and a major consequence of a
Constitution that repeatedly directs the state to this end. Moreover, the
Indian government has, at various points in time, embraced the objective of
promoting the health of the poor and the disadvantaged in its policy
statements and actions, one being its signing of the Alma Ata Declaration of
1978, emphasizing „Health for All‟. Although the National Health Policy
(NHP) in India was not framed until 1983, India initiated several national
health programmes over last five decades in government, voluntary and
private sectors under the guidance and direction of various committees
(Bhore, Mudaliar, Kartar Singh, Srivastava), the Constitution, the Planning
Commission, the Central Council of Health and Family Welfare, and
Consultative Committees attached to the Ministry of Health and Family
Welfare. The period after 1983 witnessed several major developments in the
policies impacting the health sector-adoption of National Health Policy in
1983, National Health Policy 2002, National Policy on Indian System of
Medicine and Homeopathy in 2002, Drug Policy in 2002, introduction of
Universal Health Insurance schemes for the poor in 2003 and inclusion of
health in Common Minimum Programme of the United Progressive Alliance
(UPA) government in 2004.
52
The concern for health improvements, especially among the poor and
the disadvantaged, whether espoused in government policies or elsewhere,
stems from several considerations. One is the increasing recognition that
improvements in health translate into substantial gains in economic
performance and overall well-being of society. Second, good health may be
considered an end in itself, irrespective of any contribution it can potentially
make to enhance economic growth. Third, poor health has significant
adverse implications for the economic well-being of affected households and
individuals, particularly for poor households (Sundar Ramamani and
Abhilasha Sharma, 2002). Recognising „health‟ as an important contributory
factor in the utilization of manpower and the uplifting of the economic
condition of the country, the Planning Commission gave considerable
importance to health programmes in five year plans. From the First Five
Year Plan efforts were made to build up primary, secondary and tertiary care
centres and to link through appropriate referral system. National
programmes for combating major public health problems were evolved and
implemented. India‟s achievement in the health front is significant
particularly in attainment of development indicators, viz., reduction in birth
rate, death rate, infant mortality rate and increase in life expectancy
(Ambedkar S. Nagendra and Shilaja Nagendra, 2006). But still the health
indicators vary widely across states reflecting the differing levels of
resources available to state governments, but one trend that is totally
consistent is that these indicators are much worse in rural areas than in urban
areas (Economist Intelligence Unit, 2009). A comparison of the health
indicators of India with other developing countries of Asia reveals the real
position and condition of the health of the Indian population. The countries
like China, Sri Lanka and Bangladesh have better health indices than that of

53
India (Rawat Deepa, Kalpna Aggarwal and Manish Dev, 2006).
The ailing public health services in the country are manifested in the
poor health infrastructure besides the health indicators. The public sector
health infrastructure consists of a three-tier structure with around 4000
community health centres, 22000 primary health centres and 145000
sub-centres spread in semi-urban and rural areas. Tertiary medical care is
provided at multi and super-speciality hospitals and medical colleges. There
are around 750000 doctors, 1000000 nurses, 7500 hospitals and 493000 beds
(National Health Profile, 2009). But still, the health infrastructure in India
has a long way to go towards achieving 100 per cent quality, technology and
superior health care delivery system, as the private sector provides
80 per cent of the health care services and only 20 per cent are provided by
the government (www.buyusa.gov/india).
The condition of expenditure on health services in India is no less
dismal. India is estimated to be spending around 5 per cent of Gross
Domestic Product (GDP) on health, and much of the expenditure is incurred
on the private account. The public expenditure incurred on health is only
0.9 per cent of GDP (Sathayamala, C. and N.J. Kurian, 2008). The high
private expenditure on health points more to the failure of the public sector
to provide health care services and is a reflection of the relatively high
disease burden and the high cost of health care in the country rather than
choice on the part of the people. The cost of health care has been rising over
the years. It is estimated that 7-9 per cent of annual household consumption
expenditure is spent on health care needs. The burden of treatment is the
highest for the poorest sections of society in rural areas. It is estimated that
the poor spend 12 per cent of their incomes on health care as opposed to
2 per cent spent by the rich (Misra et al., 2003). The state governments in

54
India bear the major responsibility for health care as in the constitutional
division of responsibilities across the union government and the states;
health has been identified as a state subject. The union government plays an
important role in influencing health outcomes of states through its
expenditure on centrally sponsored programmes, loans, transfers and grants.
The role of the central allocations in health spending varies across states
(Prabhu, K. Seeta and V. Selvaraju, 2006).
In the present chapter an attempt has been made to provide a broad
overview of the health scenario in India, in terms of vital health indicators,
public health infrastructure and public health expenditure.
Health Indicators
Health is a basic component of human development, and hence,
determines society‟s well being. It is a means to empower the deprived
sections of society and thus, an important element in the strategy for poverty
alleviation. Access to preventive and protective health care enhances
entitlements of the poor by enabling steady employment, improving
productivity and facilitating demographic transition. India‟s performance in
ensuring basic health care facilities has left much to be desired. To assess the
overall health conditions of each country, a new index known as Health
Index (HI) for 177 countries of the world were presented in the report-
Human Development in South Asia, 2004 of UNDP. In this report India was
ranked 140th out of 177 countries (with health index value of 0.476) which
was quite lower than those of other countries of the world like Japan (21),
United States (10), Australia (9), Canada (5), Germany (2) and
Sweden (1).Table 3.1 displays information regarding some health indicators
like life expectancy, infant mortality rate, under-five mortality rate, maternal

55
Table 3.1: Selected Health Indicators: South Asian Countries
Countries Life
Expectancy
at
birth(years)
(2000-05)
Infant
Mortality
Rate
(per 1000
live births)
2003
Under-five
Mortality
Rate
(per 1000
live births)
2003
Maternal
Mortality
Rate
(per 100000
live births)
Adjusted
2000
Probability at
birth of surviving
to age 65
(%of cohort)
(2000-05)
Females Males
India 63.1 63 87 540 67.4 59.2
Pakistan 62.9 81 103 500 65.6 62.7
Bangladesh 62.6 46 69 380 63.7 59.3
Nepal 61.4 61 82 740 61.0 57.9
Sri Lanka 73.9 13 15 92 85.6 76.1
Bhutan 62.7 70 85 420 65.3 60.2
All developing countries 64.9 60 88 NA 69.6 62.3
All countries 67.0 54 80 NA 73.1 64.5
Source: Human Development Report, 2005.
mortality rate and probability at birth of surviving to age 65 of India
vis-à-vis world as well as other developing countries of the world. It shows
that the average life expectancy at birth for India i.e. 63.1 years was lower
than that of the world i.e. 67 years and of developing countries i.e. 64.9
years during 2000-05. The Infant Mortality Rate (IMR) in India at 63 years
(per 1000 live births) was higher than that of the world (54) as well as
developing countries (60) in 2003. Mortality of children under 5 years at 87
(per 1000 live births) in India too was higher than the world average at 80.
The Maternal Mortality Rate (MMR) in India at 540 (per 100000 live births)
in 2000 was higher than that of other South Asian countries such as Pakistan
(500), Bangladesh (380) and Sri Lanka (92).The probability at birth of
surviving to age 65 in India was more for females i.e. 67.4 than that of males
i.e. 59.2, but lesser than the world average of 73.1 and 64.5 respectively.
Thus the performance of India‟s health status vis-à-vis other countries of the
world in terms of the most frequently used health indicators does not present

56
an encouraging picture. The poor health infrastructure combined with low-
income level and poverty has been a major cause of the poor health
achievements of the country.
The vital statistics like Crude Birth Rate (CBR), Crude Death Rate
(CDR), Infant Mortality Rate (IMR) and life expectancy at birth provide the
base for information on the health status and human development of any
region or country. These health parameters affect the prioritization of health
issues, allocation of public resources for health, formulation of effective
strategies and implementation of health programmes. To examine the
progress in health status of the people in India, various health indicators
have been analyzed over the period 1981-2008. To view the inter-period
changes and trends this period has been disaggregated into three time
periods as follows:(i) First period-1981-90 ; (ii) Second period-1991-2000;
(iii) Third period-2001-08.
Table 3.2 gives data pertaining to crude birth rate, crude death rate
and natural growth rate in India during the period 1981-2008. Crude Birth
Rate (CBR) which is the number of live births in a year per 1000 population
of the mid-year population declined continuously from 33.9 births per 1000
population in 1981 to 22.8 births per 1000 population in 2008 i.e. a decline
of 32.74 per cent. It declined from 33.9 to 30.2 during 1981-90 (10.91per
cent), slid down from 29.5 to 25.8 (12.54 per cent) during 1991-2000 and it
further reduced from 25.4 to 22.8 (10.24 per cent) during 2001-08. This
decline was observed to be the highest during the second period. Similarly, a
declining trend has been observed in both rural and urban areas during the
period 1981-2008, but still a large gap persists between them (Figure 3.1).
During the first period, the percentage decline in crude birth rate was higher
in rural areas than that of urban areas while during the second period the rate

57
Table 3.2: Area-wise Crude Birth Rate, Crude Death Rate and Natural Growth Rate in India
(per thousand population per annum)
Year Crude Birth Rate Crude Death Rate Natural Growth Rate
Rural Urban Combined Rural Urban Combined Rural Urban Combined
1981 35.6 27.0 33.9 13.7 7.8 12.5 21.9 19.2 21.4
1982 35.5 27.6 33.8 13.1 7.4 11.9 22.4 20.2 21.9
1983 35.3 28.3 33.7 13.1 7.9 11.9 22.2 20.4 21.8
1984 35.3 29.4 33.9 13.8 8.6 12.6 21.5 20.8 21.3
1985 34.3 28.1 32.9 13.0 7.8 11.8 21.3 20.3 21.1
1986 34.2 27.1 32.6 12.2 7.6 11.1 22.0 19.5 21.5
1987 33.7 27.4 32.2 12.0 7.4 10.9 21.7 20.0 21.3
1988 33.1 26.3 31.5 12.0 7.7 11.0 21.1 18.6 20.5
1989 32.2 25.2 30.6 11.1 7.2 10.3 21.1 18.0 20.3
1990 31.7 24.7 30.2 10.5 6.8 9.7 21.2 17.9 20.5
1991 30.9 24.3 29.5 10.6 7.1 9.8 20.3 17.2 19.7
1992 30.9 23.1 29.2 10.9 7.0 10.1 20.0 16.1 19.1
1993 30.4 23.7 28.7 10.6 5.8 9.3 19.8 17.9 19.4
1994 30.5 23.1 28.7 10.1 6.7 9.3 20.4 16.4 19.4
1995 30.0 22.7 28.3 9.8 6.6 9.0 20.2 16.1 19.3
1996 29.3 21.6 27.5 9.7 6.5 9.0 19.6 15.1 18.5
1997 28.9 21.5 27.2 9.6 6.5 8.9 19.3 15.0 18.3
1998 28.0 21.1 26.5 9.7 6.6 9.0 18.3 14.5 17.5
1999 27.6 20.8 26.1 9.4 6.3 8.7 18.2 14.5 17.4
2000 27.6 20.7 25.8 9.3 6.3 8.5 18.3 14.4 17.3
2001 27.1 20.3 25.4 9.1 6.3 8.4 18.0 14.0 17.0
2002 26.6 20.0 25.0 8.7 6.1 8.1 17.9 13.9 16.9
2003 26.4 19.8 24.8 8.7 6.0 8.0 17.8 13.8 16.8
2004 25.9 19.0 24.1 8.2 5.8 7.5 17.8 13.3 16.6
2005 25.6 19.1 23.8 8.1 6.0 7.6 17.5 13.1 16.3
2006 25.2 18.8 23.5 8.1 6.0 7.5 17.2 12.8 16.0
2007 24.7 18.6 23.1 8.0 6.0 7.4 16.8 12.7 15.7
2008 24.4 18.5 22.8 8.0 5.9 7.4 16.5 12.6 15.4
Source: Statistical Abstract of India, Various Issues.
of decline was higher in urban areas than that of the rural areas. During the
third period again, the percentage decline in CBR was slightly higher in rural
areas as compared to the urban areas. Thus, a large number of factors such
as increasing incomes, increasing literacy rate especially of women,
reduction in child mortality rates, increasing awareness and use of birth
control have led to reductions in crude birth rate in the country as a whole
and in both rural and urban areas over a period of time.
58
Figure 3.1: Area-wise Crude Birth Rate in India.
Source: Statistical Abstract of India, Various Issues.
0
5
10
15
20
25
30
35
401
98
1
19
82
19
83
19
84
19
85
19
86
19
87
19
88
19
89
19
90
19
91
19
92
19
93
19
94
19
95
19
96
19
97
19
98
19
99
20
00
20
01
20
02
20
03
20
04
20
05
20
06
20
07
20
08
Ra
te
(per
th
ou
san
d p
op
ula
rio
n p
er a
nn
um
)
Years
Crude Birth Rate Rural
Crude Birth Rate Urban
Crude Birth Rate Combined
59
Figure 3.2: Area-wise Crude Death Rate in India.
Source: Statistical Abstract of India, Various Issues.
0
2
4
6
8
10
12
14
16
19
81
19
82
19
83
19
84
19
85
19
86
19
87
19
88
19
89
19
90
19
91
19
92
19
93
19
94
19
95
19
96
19
97
19
98
19
99
20
00
20
01
20
02
20
03
20
04
20
05
20
06
20
07
20
08
Ra
te
(per
th
ou
san
d p
op
ula
tio
n p
er a
nn
um
)
Years
Crude Death Rate Rural
Crude Death Rate Urban
Crude Death Rate Combined

60
Crude Death Rate (CDR) is another important measure as it, in
combination with the crude birth rate determines population growth rate. It
is the number of deaths in a year per 1000 population of the mid-year
population. It registered a decline from 12.5 deaths per 1000 population in
1981 to 7.4 deaths per 1000 population in 2008 i.e. a decline of 40.8 per
cent. It went down from 12.5 to 9.7 during 1981-90 (22.40 per cent),
declined from 9.8 to 8.5 (13.27 per cent) during 1991-2000 and it further
dropped from 8.4 to 7.4 (11.90 per cent) during 2001-08. Thus, the
maximum decline in CDR was observed during the first period. On
comparing the CDR in rural and urban areas, it has been found that though
the CDR declined in both rural and urban areas but still a big difference
exists between them (Figure 3.2). During the first period, the percentage
decline in CDR was quite high for rural areas than the urban areas; during
1991-2000 though the rate of decline was higher in rural areas than that of
the urban areas, but the gap between both the areas narrowed down than
before, while during the third period this gap widened as the decline was
higher in rural areas as compared to the urban areas. Better control of
famines, better management of natural disasters, better medical facilities,
improvement in public health and sanitation, decline of major killer diseases
like cholera, tuberculosis etc, better control of epidemics, spread of
education and immunization programmes have helped to bring down the
crude death rate in India.
The Natural Growth Rate (NGR) of population is computed simply by
subtracting the crude death rate from the crude birth rate. The figures in the
table exhibit that natural growth rate declined from 21.4 in 1981 to 15.4 in
2008, registering a decline of 28.04 per cent. It declined moderately from
21.4 to 20.5 (4.21 per cent) during 1981-90, slid down from 19.7 to 17.3

61
(12.18 per cent) during 1991-2000 and it further reduced from 17 to 15.4
(9.41 per cent) during 2001-08. The maximum decline in NGR was observed
during the second period. On comparing the rate of decline in NGR in rural
and urban areas, it has been found that the rate of decline in NGR of
population during all the three periods i.e. first, second and third was lower
in rural areas as compared to those of the urban areas.
Table 3.3 depicts data regarding Infant Mortality Rate (IMR) by
locality in India during the period 1981-2008. It is the number of infant
deaths per 1000 live births. Infant mortality rate is one of the most telling
indicators on the health services, health awareness and satisfactory health
practices. It dropped significantly from 110 per 1000 live births in 1981 to
53 per 1000 live births in 2008, registering a decline of more than
50 per cent. It dwindled from 110 to 80 (27.27 per cent) during 1981-90,
reduced from 80 to 68 (15 per cent) during 1991-2000 and went down from
66 to 53 (19.70 per cent) during 2001-08. The maximum decline in IMR was
recorded during the first period. The rate at which the decline of IMR has
occurred has slowed down over the period of time. The important causes of
infant deaths in India in the recent years have been, pneumonia, diarrhoea
and neonatal sepsis, mainly because of lack of timely attention and treatment
of infants and low rates of routine immunization. Further, IMR has shown a
falling trend in both rural and urban areas during the period 1981-2008
(Figure 3.3). During the first period, the percentage decline in IMR was
remarkable in rural areas as compared to that of the urban areas while during
the second period, the rate of decline was greater in urban areas than that of
rural areas. During the third period, the rate of decline in IMR was recorded
to be higher in rural areas than that of the urban areas. The IMR in rural
areas accounted to be higher than that of urban areas throughout the study

62
Table 3.3: Area-wise Infant Mortality Rate in India
(per thousand live births)
Year Infant Mortality Rate
Rural Urban Combined
1981 119 62 110
1982 114 65 105
1983 114 66 105
1984 113 66 104
1985 107 59 97
1986 105 62 96
1987 104 61 95
1988 102 62 94
1989 98 58 91
1990 86 50 80
1991 87 53 80
1992 85 53 79
1993 82 45 74
1994 80 52 74
1995 80 48 74
1996 77 46 72
1997 77 45 71
1998 77 45 72
1999 75 44 70
2000 74 44 68
2001 72 42 66
2002 69 40 63
2003 66 38 60
2004 64 40 58
2005 64 40 58
2006 62 39 57
2007 61 37 55
2008 58 36 53
Source: National Health Profile, Various Issues.
period depicting marked rural-urban differences. This may be due to
inadequate health facilities, illiteracy and poverty etc. in rural areas. Thus, it
may be stated that despite policy commitments to provide equal access to
health care provision in rural as well as urban areas, marked rural-urban
differences remain unchanged due to lack of efficient implementation of
these policies.

63
Figure 3.3: Area-wise Infant Mortality Rate in India
Source: National Health Profile, Various Issues.
0
20
40
60
80
100
120
1401
98
1
19
82
19
83
19
84
19
85
19
86
19
87
19
88
19
89
19
90
19
91
19
92
19
93
19
94
19
95
19
96
19
97
19
98
19
99
20
00
20
01
20
02
20
03
20
04
20
05
20
06
20
07
20
08
Ra
te
(per t
ho
usa
nd
liv
e b
irth
s)
Years
Infant Mortality Rate Rural
Infant Mortality Rate Urban
Infant Mortality Rate Combined

64
Table 3.4 manifests data regarding life expectancy at birth by sex in
India during the period 1981-85 and 2002-06. Life expectancy of an
individual is the number of years a person is expected to live given the
prevailing age-specific mortality rates of the population to which he/she
belongs. It is a general measure of mortality that captures prevailing
mortality rates of a population at different age groups. Moreover, life
expectancy provides more than sufficient material to assess the quality of
life. Besides there is a conceptual appeal in having a summary measure that
provides some indication on the longevity that a person is likely to enjoy in
any society. The data in the table show that the life expectancy at birth
underwent a significant change from 55.4 years during 1981-85 to 63.4 years
during 2002-06, registering an increase of 8 years. The life expectancy at
birth for females was 55.7 years during 1981-85 which increased to 64.2
years during 2002-06. For males, the life expectancy was 55.4 years during
1981-85 which moved up to 62.6 years during 2002-06 (Figure 3.4). The life
expectancy increased by 8.5 years for females and 7.2 years for males.
Besides, it has been observed that female life expectancy remained higher
than male life expectancy throughout the study period. The discovery of
wonder medicines to control epidemics like plague, cholera, influenza or
small pox, the general improvement in medical assistance, increase in
number of hospitals, doctors, nurses, medicines and better control of
diseases and decline in mortality have helped to raise life expectancy in
India.
Within India there exists wide inter-state variation in health indicators,
as can be seen from Table 3.5. This table presents the health indicators like
birth rate, death rate, infant mortality rate and life expectancy at birth for
fifteen major states. The table reveals that average birth rate of India was

65
Table 3.4: Life Expectancy at Birth by Sex, India
(in years)
Period Life Expectancy
Male Female Total
1981-85 55.4 55.7 55.4
1986-90 57.7 58.1 57.7
1987-91 58.1 58.6 58.3
1988-92 58.6 59.0 58.7
1989-93 59.0 59.7 59.4
1990-94 59.4 60.4 60.0
1991-95 59.7 60.9 60.3
1992-96 60.1 61.4 60.7
1993-97 60.4 61.8 61.1
1994-98 60.6 62.2 61.4
1995-99 60.8 62.5 61.7
1996-00 61.0 62.7 61.9
1997-01 61.3 63.0 62.2
1998-02 61.6 63.3 62.5
1999-03 61.8 63.5 62.7
2000-04 62.1 63.7 63.0
2001-05 62.3 63.9 63.2
2002-06 62.6 64.2 63.4
Source : SRS Abridged Life Tables, 2002-06
Figure: 3.4: Life Expectancy at Birth by Sex, India
Source : SRS Abridged Life Tables, 2002-06
50
52
54
56
58
60
62
64
66
19
81-
85
19
86-
90
19
87-
91
19
88-
92
19
89-
93
19
90-
94
19
91-
95
19
92-
96
19
93-
97
19
94-
98
19
95-
99
19
96-
00
19
97-
01
19
98-
02
19
99-
03
20
00-
04
20
01-
05
20
02-
06
(in
yea
rs)
Years
Life Expectancy Male
Life Expectancy Female

66
22.8 per 1000 population in 2008. Out of the fifteen states, six states had
birth rate at more than this level. Uttar Pradesh (29.1) had the highest birth
rate followed by Bihar (28.9), Madhya Pradesh (28.0), Rajasthan (27.5) and
Assam (23.9). Remaining nine states including Punjab (17.3) had birth rate
lower than the national average. The lowest birth rate was found in Kerala
(14.6). The average death rate of India was 7.4 per 1000 population in 2008.
There also exist wide inter-state variations in death rate. Out of the fifteen
states, five states had death rate more than the national average. The highest
death rate was observed for Orissa (9.0) followed by Madhya Pradesh (8.6),
Assam (8.6), Uttar Pradesh (8.4) and Andhra Pradesh (7.5).Tamil Nadu and
Karnataka recorded death rate same as the national average. Remaining eight
states had death rate lower than the national average. The lowest death rate
was observed in West Bengal (6.2) followed by Kerala (6.6) and
Maharashtra (6.6). Punjab state had death rate slightly lower than the
national average. The average Infant Mortality Rate (IMR) of India was 53
in 2008 and there were seven Indian states that had IMR at more than this
level, with Madhya Pradesh (70) at the top followed by Orissa (69), Uttar
Pradesh (67), Assam (64), Rajasthan (63), Bihar (56) and Haryana (54).
Remaining eight states including Punjab had IMR lower than the national
average. The lowest IMR was found in Kerala at 12. The diversity in the
states regarding IMR is visible from the fact that on the one hand there is
state like Kerala and on the other, there are states like Madhya Pradesh,
Orissa and Uttar Pradesh. Life expectancy at birth for India was 62.6 and
64.2 years for male and female respectively in 2008. Kerala had the highest
life expectancy for male and female followed by that of Punjab and
Maharashtra, while Madhya Pradesh had the lowest life expectancy for both
male (58.1) and female (57.9) as compared to other states. Except Madhya

67
Pradesh, Uttar Pradesh and Bihar, all the states have been observed to have
higher life expectancy for female than that of male. It has been found that
the state of Punjab fares a better position than that of India in all these health
indicators.
Table 3.5 Health Indicators for Major States, 2008
State
Birth Rate
(per 1000
population)
Death Rate
(per 1000
population)
Infant
Mortality
Rate
(per 1000
population)
Life Expectancy (in years)
Male
Female
Andhra
Pradesh 18.4 7.5 52 62.9 65.5
Assam 23.9 8.6 64 58.6 59.3
Bihar 28.9 7.3 56 62.2 60.4
Gujarat 22.6 6.9 50 62.9 65.2
Haryana 23.0 6.9 54 65.9 66.3
Karnataka 19.8 7.4 45 63.6 67.1
Kerala 14.6 6.6 12 71.4 76.3
Madhya
Pradesh 28.0 8.6 70 58.1 57.9
Maharashtra 17.9 6.6 33 66.0 68.4
Orissa 21.4 9.0 69 59.5 59.6
Punjab 17.3 7.2 41 68.4 70.4
Rajasthan 27.5 6.8 63 61.5 62.3
Tamil Nadu 16.0 7.4 31 65.0 67.4
Uttar Pradesh 29.1 8.4 67 60.3 59.5
West Bengal 17.5 6.2 35 64.1 65.8
India 22.8 7.4 53 62.6 64.2
Source: National Health Profile, 2009
While considerable progress has been achieved by India in these
health indicators over a period of time, but the situation is far from
satisfactory. India continues to lag behind several other countries of the
world. Inter-state diversities in the health indicators are quite remarkable.
Moreover, within the country urban areas are faring better than rural areas.
Health Infrastructure
India‟s performance in health can be judged from the performance of
the healthcare system. Table 3.6 presents data regarding the number of

68
Table 3.6: Hospitals, Dispensaries and Beds in India
Year
Number
of
Hospitals
Number of
hospitals per 1
million
population
Number
of
Dispensaries
Number of
dispensaries
per 1 million
population
Number of
Beds
( ’000)
Number
of beds per
1 lakh
population
1981 6804 10 16751 25 569 83
1982 6897 10 17409 25 584 83
1983 7189 10 21777 30 599 84
1984 7369 10 21872 30 625 86
1985 7474 10 25584 34 657 88
1986 9843 13 25193 33 694 91
1987 N.A. - N.A. - N.A. -
1988 10156 13 28841 36 741 94
1989 10172 13 28304 35 795 99
1990 11571 14 28321 34 806 98
1991 11571 14 27994 33 806 95
1992 13692 16 27431 32 835 98
1993 14867 17 28279 33 860 99
1994 15033 17 28200 32 864 98
1995 15097 17 28225 31 870 97
1996 15097 16 28225 30 870 93
1997 15170 16 25653 27 893 94
1998 15188 16 25670 26 897 92
1999 15501 16 22967 23 908 92
2000 18218 18 23065 23 909 90
2001 17952 17 22306 22 904 88
2002 15393A - 22291 22 915 92
2003 5479B - - - 381C -
2004 7029B - - - 470 -
2005 7008B - - - 470 -
2006 7663B - - - 493 -
Note: A- Total hospitals reduced from 2001 due to exclusion of CHCs and non-reporting.
B- Relates to government allopathic hospitals only.
C- Estimated at 30 beds per one CHC.
#- Year 2003 onwards, CBHI did not compile the information on number of dispensaries.
Source: Directorate General of Health Services (CBHI)
hospitals, dispensaries and beds in India. The number of hospitals increased
nearly 2.5 times during 1981-2001, but then reduced in 2002 due to
exclusion of CHCs and non-reporting. The figures showed a further decline
in 2006 because these included only allopathic hospitals. The number of
hospitals showed an increase of 1.70 times during 1981-90 and it further
increased by 1.57 times during 1991-2000. The number of hospitals per 1
million population increased from 10 to 17 during 1981-2001. The number

69
of dispensaries went up 1.33 times during 1981-2002. The number of
dispensaries showed a significant rise during 1981-90, while it declined
during 1991-2000. The number of dispensaries per 1 million population
rather declined from 25 to 22 during 1981-2002. The number of beds
increased 1.61 times during 1981-2002, but later reduced in 2006. The
number of beds increased by 1.42 times during 1981-90, while it rose by
1.13 times during 1991-2000. The number of beds per 1 lakh population
increased from 83 to 92 during 1981-2002.
Table 3.7: Share of Public and Private Sector Hospitals and Beds
(in percentage)
Year Hospitals Hospital Beds
Public Private Total Public Private Total
1974 81.4 18.6 100 78.5 21.5 100
1979 64.7 35.3 100 74.2 25.8 100
1984 54.6 45.4 100 72.5 27.5 100
1988 44.1 55.9 100 70.1 29.9 100
1996 31.9 68.1 100 63.4 36.6 100
2002 26 74 100 61.6 38.4 100
Source: Health Information of India, CBHI, Government of India, Various Issues.
Table 3.7 provides information regarding share of public and private
sector hospitals in India during 1974-2002. The data in the table show that in
1974, out of total hospitals the proportionate share of public and private
hospitals were 81.4 per cent and 18.6 per cent respectively. In 2002, the
corresponding shares were 26 per cent and 74 per cent. Thus, private
hospitals have grown sharply (Figure 3.5). On observing the share of public
and private sector hospital beds, it has been found that in 1974, out of total
hospital beds the proportionate share of public and private hospital beds
were 78.5 per cent and 21.5 per cent respectively. In 2002, the
corresponding shares were 61.6 per cent and 38.4 per cent. Thus, the share
of private sector hospital beds has also shown an upward trend although not
as significant as the number of hospitals (Figure 3.6).
70
Figure 3.5: Share of Public and Private Sector Hospitals
Source: Health Information of India, CBHI, Government of India, Various Issues.
Figure 3.6: Share of Public and Private Sector Beds
Source: Health Information of India, CBHI, Government of India, Various Issues.
The data relating to public and private hospitals and beds according to
area have been shown in Table 3.8. It reveals that during the nineties,
75 per cent of government hospitals were located in urban areas and only
0
10
20
30
40
50
60
70
80
90
1974 1979 1984 1988 1996 2002
Ho
spit
als
(in
percen
tag
e)
Years
Hospitals Public
Hospitals Private
0
10
20
30
40
50
60
70
80
90
1974 1979 1984 1988 1996 2002
Bed
s
(in
per
cen
tag
e)
Years
Hospital Beds Public
Hospital Beds Private
71
25 per cent were located in rural areas. Even the proportion of private
hospitals was found to be more in urban areas (69 per cent) than that of the
rural areas (31 per cent). Further it revealed that both government and
private hospital beds were located more in urban areas as compared to the
rural areas. It indicates acute rural-urban disparities. Thus, the health care
facilities were available more in the private sector and in the urban areas
during nineties.
Table 3.8: Rural-Urban Distribution of Hospitals/Hospital Beds: Public and Private Sectors,
1990s
(in percentage)
Area Hospitals Hospital Beds
Government Private Government Private
Rural 25 31 10 29
Urban 75 69 90 71
Total 100 100 100 100
Source: Nandraj 2000 and Directory of Hospitals in India, Various Issues
In India, most people belonging to different strata of society, primarily
in rural areas, resort to Indian systems of medicine for health care. India has
perhaps the world‟s largest community-based tradition of indigenous
systems of medicine. Due to its countrywide presence, easy availability,
affordability and safety, it has been institutionalized in modern India as far
as education and service delivery are concerned. It has been integrated with
government health services at the central and state level and is currently
being given a further impetus by the government. Since the creation of a
separate department of AYUSH, a positive impact has been observed in
growth of almost all AYUSH infrastructural facilities due to departmental
investment and focus on overall development of these systems. Though the
government is making an effort to expand these facilities by adopting
various measures, growth has been rather slow over the years. The data
relating to the ayurvedic, unani, siddha and homeopathic institutions in India

72
during the period 1981-2009 have been presented in Table 3.9. The data in
the table revealed that the number of AYUSH institutions spiralled up from
15823 to 25074 during 1981-2009, indicating a growth rate of 1.60 per cent
per annum. During the first period, the number of these institutions increased
from 15823 in 1981 to 22155 in 1990 depicting growth rate of 4.59 per cent
per annum. During the second period, their number went up from 26049 in
1991 to 27267 in 2000, showing growth rate of 0.12 per cent per annum,
whereas during the third period, their number rather shrank from 27254 in
2001 to 25074 in 2009, exhibiting a negative growth rate i.e. -0.96 per cent
per annum. Thus, these institutions registered maximum growth during the
eighties.
Further, it has been found that during the period 1981-2009,
maximum growth has been observed in the number of homeopathic
institutions (3.35 per cent) followed by siddha (2.66 per cent), ayurvedic
(1.20 per cent) and unani (0.97 per cent) institutions. During the first period,
the homeopathic institutions registered maximum growth rate
(17.03 per cent per annum) followed by ayurvedic (1.90 per cent per annum)
and unani institutions (0.44 per cent per annum), while the siddha
institutions exhibited a negative growth rate i.e. -2.19 per cent per annum.
During the second period, the situation reversed where maximum growth
was noticed for the siddha institutions (4.28 per cent per annum) followed by
ayurvedic institutions (1.34 per cent per annum) and unani institutions (0.88
per cent per annum), while the homeopathic institutions depicted a negative
growth rate i.e. -2.70 per cent per annum. This scenario changed a little

73
Table 3.9: Number of Ayurvedic, Unani, Siddha and Homeopathic (AYUSH) Institutions in India
Year Ayurvedic Unani Siddha Homeopathic Total
1981 12394 1009 503 1917 15823
1982 12502 1070 536 2260 16368
1983 12777 1070 349 2307 16503
1984 12552 958 416 2284 16210
1985 13571 967 421 2423 17382
1986 13578 972 334 6765 21649
1987 13840 1066 342 7267 22515
1988 14013 1055 409 5364 20841
1989 14366 1067 413 5875 21721
1990 14510 1073 413 6159 22155
1991 15239 1117 418 9275 26049
1992 15393 1131 426 9299 26249
1993 15726 1135 438 9585 26884
1994 15779 1145 443 6824 24191
1995 15840 1144 448 6891 24323
1996 15872 1152 452 6933 24409
1997 16173 1141 495 7184 24993
1998 16441 1155 561 7280 25437
1999 16633 1169 587 7452 25841
2000 17724 1275 592 7676 27267
2001 17677 1270 589 7718 27254
2002 17457 1245 583 7478 26763
2003 16179 1136 675 5688 23678
2004 N.A. N.A. 700 N.A. N.A.
2005 15946 1227 720 5857 23750
2006 16281 1271 743 6031 24326
2007 16312 1278 745 6066 24401
2008 16976 1292 765 6277 25310
2009 16407 1273 805 6589 25074
Compound Annual Growth Rate (per cent)
1981-2009 1.20 0.97 2.66 3.35 1.60
1981-1990 1.90 0.44 -2.19 17.03 4.59
1991-2000 1.34 0.88 4.28 -2.70 0.12
2001-2009 -0.74 0.67 4.59 -2.01 -0.96
Source: (1) AYUSH in India (2005), Planning and Evaluation Cell, Department of Ayurveda,
Yoga and Naturopathy, Unani, Siddha and Homeopathy (AYUSH), MOHFW, GOI.
(2) National Health Profile,Various Issues.
during the third period as the siddha institutions again showed maximum
growth rate (4.59 per cent per annum) this time followed by unani
institutions (0.67 per cent per annum), while the homeopathic and ayurvedic
institutions showed negative growth rates i.e. -2.01 per cent per annum and

74
-0.74 per cent per annum. Thus, it can be concluded that during the first
period, maximum growth rate was recorded for homeopathic institutions
whereas during the second and third period siddha institutions registered
maximum growth rate.
The health infrastructure in rural areas has been developed as a three
tier system. The sub-centre (SC) is the most peripheral and the first contact
point between the primary health care system and the community.
Sub-centres are assigned tasks relating to interpersonal communication in
order to bring about behavioural change and provide services in relation to
maternal and child health, family welfare, nutrition , immunization,
diarrhoea control and control of communicable diseases programmes. The
sub-centres are provided with basic drugs for minor ailments needed for
taking care of essential health needs of men, women and children. The
Ministry of Health and Family Welfare has been providing 100 per cent
central assistance to all the sub-centres in the country since April 2002 in the
form of salary of auxiliary nurse midwives (ANMs) and lady health visitors
(LHVs), rent at the rate of Rs. 3000 per annum and contingency at the rate of
Rs. 3200 per annum, in addition to drugs and equipment kits. Primary Health
Centre (PHC) is the first contact point between village community and the
medical officer. The primary health centres (PHCs) are envisaged to provide
an integrated curative and preventive health care to the rural population with
emphasis on preventive and promotive aspects of health care. These are
established and maintained by the state governments under the Minimum
Needs Programme (MNP)/Basic Minimum Services (BMS) Programme. A
PHC acts as a referral unit for six sub-centres. It has 4-6 beds for patients.
The activities of PHC involve curative, promotive and family welfare
services. The community health centres (CHCs) are being established and
75
maintained by the state government under the MNP/ BMS programme. It
serves as a referral centre for four PHCs and also provides facilities for
obstetric care and specialist consultations.
Table 3.10: Number of Primary Health Centres, Sub-centres and Community Health Centres in
India
Period Community Health
Centres
Primary Health
Centres Sub-centres
1st Five Year Plan - 725 -
2nd
Five Year Plan - 2565 -
3rd
Five Year Plan - 4631 -
Inter Plan Period - -
As on 31.3.67 - 4793 17521
As on 31.3.68 - 4946 21539
As on 31.3.69 - 4919 22826
4th Five Year Plan - 5283 33509
5th Five Year Plan 214 5484 47112
6th Five Year Plan 761 9115 84376
7th Five Year Plan 1910 18671 130165
Inter-Plan Period - - -
As on 31.3.91 2070 20139 130984
As on 31.3.92 2188 20407 131369
8th Five Year Plan 2633 22149 136258
9th Five Year Plan 3054 22875 137311
10th Five Year Plan 4045 22370 145272
Source: National Health Profile, Various Issues.
Plan-wise total number of sub-centres, primary health centres and
community health centres, in India have been shown in Table 3.10.A look at
the number of sub-centres over the years reveals that during the fourth plan
there were 33509 sub-centres which increased to 47112 and then to 84376
during the Fifth and Sixth Five Year Plan respectively. Their number further
rose to 130165 and 136258 during the Seventh and Eighth Five Year Plan
respectively. The number of sub-centres further climbed up from 137311
during the Ninth Five Year Plan to 145272 during the Tenth Five Year Plan.
Thus, the number of sub-centres increased by 4.34 times from Fourth Plan to
Tenth Plan. During the First Plan the number of PHCs was 725 which
increased to 2565 and 4631 during Second and Third plan respectively. The

76
number of PHCs registered increase from 5283 during Fourth Plan to 5484
during the Fifth Plan. During Sixth Plan number of PHCs was 9115 and it
almost doubled as 18671 during the Seventh Plan. Their number further rose
to 22149 and 22875 during the Eighth and Ninth Five Year Plan
respectively, but during the Tenth Plan their number reduced slightly to
22370. Thus, the number of PHCs increased by 30.85 times since the First
Five Year Plan. In accordance with the progress in the number of SCs and
PHCs, the number of CHCs have also shown an upward trend. The number
of community health centres increased from 214 during Fifth Five Year Plan
to 761 and then to 1910 during Sixth and Seventh Five Year Plan
respectively. Their number rose to 2633 during Eighth Plan and to 3054 and
4045 during Ninth and Tenth Plan respectively. Thus, the number of CHCs
increased by 18.90 times since the Fifth Five Year Plan. Although public
health care facilities in terms of SCs, PHCs and CHCs have been expanding
fairly and rapidly across India, still they are in shortage. The figures of
population based on 2001 population census revealed that there is still a
shortfall of 20903 (13.16 per cent) sub-centres, 4803 (18.46 per cent)
primary health centres and 2653 (40.87 per cent) community health centres
in the rural health infrastructure. Maximum shortage at the community
health centres (CHCs) level is adversely affecting the secondary health care.
Table 3.11 incorporates data on the number of allopathic medical
practitioners and the ratio of population served by them. The number of
medical practitioners zoomed up from 268700 to 757400 during 1981-2009,
showing a growth rate of 3.87 per cent per annum. The growth rate of
allopathic medical practitioners was 4.11 per cent per annum during the first
period, 3.97 per cent per annum during the second period and 3.35 per cent
per annum during the third period. Thus, the maximum growth rate in the
77
Table 3.11: Number of Allopathic Medical Practitioners Registered with Medical Council of
India
Year Medical Practitioners Registered
with Medical Council of India (00)
Medical Practitioners per 100000
population
1981 2687 39.32
1982 2715 38.77
1983 2842 39.73
1984 2965 40.59
1985 3082 41.32
1986 3254 42.75
1987 3378 43.51
1988 3503 44.25
1989 3643 45.15
1990 3787 46.07
1991 3936 46.51
1992 4097 48.06
1993 4265 49.15
1994 4426 50.12
1995 4597 51.18
1996 4776 51.05
1997 4969 52.11
1998 5152 53.01
1999 5360 54.13
2000 5556 55.09
2001 5771 56.11
2002 6071 58.10
2003 6254 58.87
2004 6440 59.24
2005 6609 60.24
2006 6821 61.22
2007 7080 62.60
2008 7367 64.18
2009 7574 65.06
Compound Annual Growth Rate (per cent)
1981-2009 3.87 1.88
1981-1990 4.11 2.00
1991-2000 3.97 1.75
2001-2009 3.35 1.77
Source: 1) Health Information of India, Various Issues
2) National Health Profile, Various Issues
number of medical practitioners was witnessed during the eighties. The
medical practitioners per 100000 population climbed up from 39.32 to 65.06
during 1981-2009, depicting a growth rate of 1.88 per cent per annum. The
growth rate of medical practitioners per 100000 population was 2 per cent

78
per annum during the first period, 1.75 per cent per annum during the second
period and 1.77 per cent per annum during the third period. Thus, the
maximum growth rate in the number of medical practitioners per 100000
population was observed during the eighties.
The growth in the number of registered nursing personnel in India has
been presented in Table 3.12. It shows that during 1981-2008, the number of
nurses and midwives increased from 295218 to 1043363, depicting a growth
rate of 5.32 per cent per annum; health visitors rose from 9486 to 51776
indicating a growth rate of 6.83 per cent per annum and the number of
auxiliary nurses/midwives (ANMs) shot up from 73161 to 557022,
exhibiting a growth rate of 8.69 per cent per annum. It shows that there has
been a significant increase in the number of registered nursing personnel.
The number of auxiliary nurses/ midwives witnessed maximum growth rate
followed by that of health visitors and nurses and midwives. On observing
the growth of registered nursing personnel period-wise, it has been revealed
that during the first period, the auxiliary nurses/midwives registered
maximum growth i.e. 8.57 per cent per annum followed by health visitors
(7.15 per cent per annum), while the number of nurses and midwives
depicted a negative growth rate of -1.08 per cent per annum. During the
second period also the maximum growth was recorded for the ANMs
(11.69 per cent per annum), this time followed by the nurses and midwives
(9.19 per cent per annum) and health visitors (7.94 per cent per annum).
During the third period, the maximum growth was witnessed in case of
health visitors (6.22 per cent per annum) followed by ANMs (3.85 per cent
per annum) and nurses and midwives (3.71 per cent per annum). Thus it can
be concluded that there has been a consistent increase in the number of

79
Table 3.12: Number of Registered Nursing Personnel in India
Year Nurses and Midwives Health Visitors Auxiliary
Nurses/Midwives
1981 295218 9486 73161
1982 319745 10912 80012
1983 321790 10918 86520
1984 339359 11556 89952
1985 369325 12411 98543
1986 392670 13248 108511
1987 400622 14273 118230
1988 245405 15817 132923
1989 261504 16635 141191
1990 311235 17892 150431
1991 340208 17302 150658
1992 385410 17910 165143
1993 449351 22144 203451
1994 512495 24411 229304
1995 562966 26046 278172
1996 565696 26578 283195
1997 607396 24824 301691
1998 671341 32249 335485
1999 737280 32249 380593
2000 776355 35890 419077
2001 805827 35904 428568
2002 805827 35904 428568
2003 839862 40536 502503
2004 865135 50393 506924
2005 908962 50715 521593
2006 930528 51186 527482
2007 971574 51497 549292
2008 1043363 51776 557022
Compound Annual Growth Rate (per cent)
1981-2008 5.32 6.83 8.69
1981-1990 -1.08 7.15 8.57
1991-2000 9.19 7.94 11.69
2001-2008 3.71 6.22 3.85
Source: 1) Statistical Abstract of India, Various Issues.
2) National Health Profile, Various Issues.
registered nursing personnel except during the first period for the number of
nurses and midwives where their number registered a decline. Besides it has
been observed that the growth has been slower in case of nurses and
midwives and health visitors as compared to the growth of ANMs during the
study period.
80
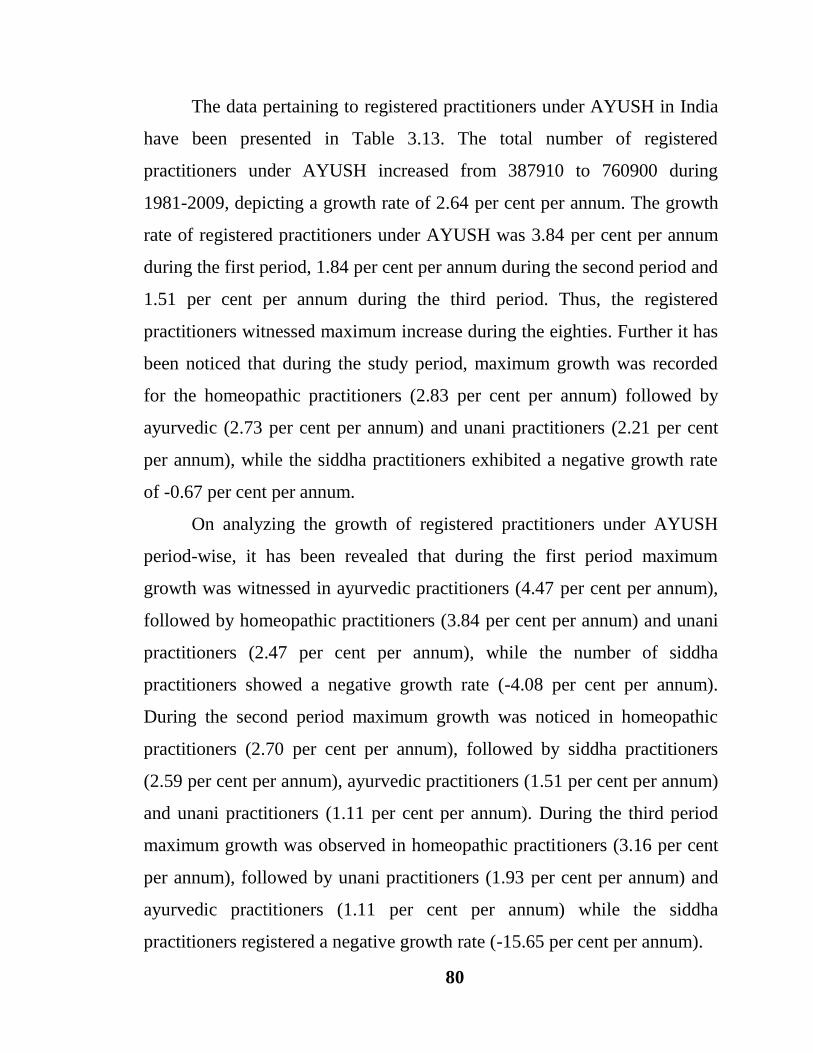
The data pertaining to registered practitioners under AYUSH in India
have been presented in Table 3.13. The total number of registered
practitioners under AYUSH increased from 387910 to 760900 during
1981-2009, depicting a growth rate of 2.64 per cent per annum. The growth
rate of registered practitioners under AYUSH was 3.84 per cent per annum
during the first period, 1.84 per cent per annum during the second period and
1.51 per cent per annum during the third period. Thus, the registered
practitioners witnessed maximum increase during the eighties. Further it has
been noticed that during the study period, maximum growth was recorded
for the homeopathic practitioners (2.83 per cent per annum) followed by
ayurvedic (2.73 per cent per annum) and unani practitioners (2.21 per cent
per annum), while the siddha practitioners exhibited a negative growth rate
of -0.67 per cent per annum.
On analyzing the growth of registered practitioners under AYUSH
period-wise, it has been revealed that during the first period maximum
growth was witnessed in ayurvedic practitioners (4.47 per cent per annum),
followed by homeopathic practitioners (3.84 per cent per annum) and unani
practitioners (2.47 per cent per annum), while the number of siddha
practitioners showed a negative growth rate (-4.08 per cent per annum).
During the second period maximum growth was noticed in homeopathic
practitioners (2.70 per cent per annum), followed by siddha practitioners
(2.59 per cent per annum), ayurvedic practitioners (1.51 per cent per annum)
and unani practitioners (1.11 per cent per annum). During the third period
maximum growth was observed in homeopathic practitioners (3.16 per cent
per annum), followed by unani practitioners (1.93 per cent per annum) and
ayurvedic practitioners (1.11 per cent per annum) while the siddha
practitioners registered a negative growth rate (-15.65 per cent per annum).
81
Table 3.13: Number of Registered Practitioners under AYUSH in India
Year Ayurveda Unani Siddha Homeopathy Total
1981 232227 28000 18190 109493 387910
1982 233824 28737 18357 112638 393556
1983 232190 27736 11476 115710 387112
1984 243153 28021 11509 122173 404856
1985 251071 28382 11532 123852 414837
1986 264800 28715 11581 131091 436187
1987 271696 29097 11632 137507 449932
1988 306740 29701 11644 143380 491465
1989 315719 34886 11717 148866 511188
1990 337966 35350 11801 148707 533824
1991 339200 35633 11615 152521 538969
1992 354423 39469 11990 156134 562016
1993 353924 39802 11994 162766 568486
1994 354684 39550 11895 167097 573226
1995 355816 40827 12437 172623 581703
1996 358564 41420 12450 174564 586998
1997 360290 39497 12780 178943 591510
1998 363885 39958 12911 184894 601648
1999 366812 40748 12915 188527 609002
2000 427504 42445 16599 194147 680695
2001 430890 43108 17097 197252 688347
2002 430263 43330 17392 200003 690988
2003 432625 42833 17550 201484 694492
2004 N.A. N.A. N.A. N.A. N.A.
2005 438721 43578 17560 217460 717319
2006 443634 46230 17560 216858 724282
2007 453661 46558 6381 217850 724450
2008 458418 47456 6601 238627 751102
2009 463485 48679 6877 241859 760900
Compound Annual Growth Rate (per cent)
1981-2009 2.73 2.21 -0.67 2.83 2.64
1981-1990 4.47 2.47 -4.08 3.84 3.84
1991-2000 1.51 1.11 2.59 2.70 1.84
2001-2009 1.11 1.93 -15.65 3.16 1.51
Source: AYUSH in India (2005), Planning and Evaluation Cell, Department of Ayurveda, Yoga
and Naturopathy, Unani, Siddha and Homeopathy (AYUSH), MOHFW,GOI.
There has been a large scale expansion of medical facilities in India so
that the health requirements of the population could be met. A vast health
care infrastructure in government and private sector has been created which
has helped to improve the health of the people. But still, the governmental
measures are quite disheartening in terms of infrastructure. The inadequate
82
health infrastructure of the government has resulted in mushrooming growth
of private hospitals and clinics throughout the country. Thus, there is an
urgent need to expand and improve public health services.
Health Expenditure
Health expenditure in India is dominated by private spending which is
a clear reflection of the inadequate public spending. India‟s performance is
not very impressive in terms of commitment to improve the health services.
One of the indicators of the inadequacy of public health spending in India is
the very small amount of such spending relative to GDP. Table 3.14 shows
India‟s performance vis-à-vis other South Asian countries regarding health
expenditure. During 2002, India‟s public expenditure on health care
(including spending on water supply and sanitation) was 1.3 per cent of
GDP, while it was 1.4 per cent in Nepal, 1.8 per cent in Sri Lanka and
4.1 per cent in Bhutan. Of 174 countries for which information was
presented in the Human Development Report (UNDP, 2005), India‟s rank in
proportion of health expenditures to GDP was 159 and only 15 countries
incurred lower expenditure than India. Infact, private health expenditure in
India was highest amongst all the South Asian countries i.e. 4.8 per cent, as
against 0.4 per cent in Bhutan, 1.9 per cent in Sri Lanka, 2.1 per cent in
Pakistan, 2.3 per cent in Bangladesh and 3.8 per cent in Nepal. The low level
of public expenditures is not the only concern; an overwhelming proportion
of health spending is on curative rather than preventive healthcare. Spending
on preventive health care has a pro-poor impact. This is because, affluent
sections of population already have access to facilities like protected water
supply and immunization and additional spending enhances the coverage of
the facilities to hitherto uncovered areas and provides greater access to the

83
Table 3.14: Commitment to Health in India and other South Asian Countries
Country
Health Expenditure (2002)
One year olds fully
immunized (2003)
(per cent)
Contraceptive
Prevalence
Rate
(1995-2003)
(per cent)
Births attended by
skilled Health
Personnel (1995-2003)
(per cent)
Physicians per
one population
(1990-2004) Public
(Per cent of
GDP)
Private
(Per cent
of GDP)
Per Capita
(PPPUS$)
Against
Tuberculosis
Against
Measles
India 1.3 4.8 96 81 67 48 43 51
Pakistan 1.1 2.1 62 82 61 28 23 66
Bangladesh 0.8 2.3 54 95 77 58 14 23
Nepal 1.4 3.8 64 91 75 39 11 5
Sri Lanka 1.8 1.9 131 99 99 70 97 43
Bhutan 4.1 0.4 76 93 88 19 24 5
Developing
Countries NA NA NA 85 75 NA 59 NA
All
Countries NA NA NA 85 77 NA 62 NA
Source: Human Development Report, 2005
84
poor. Preventive health care also has greater impact in enhancing
“capabilities” of the poor. The coverage of immunization for both
tuberculosis and measles is lower than the world average as well as
developing countries average. Infact, the coverage in India is lower than all
South Asian countries except Pakistan. The percentage of births attended by
skilled health personnel in India is lower than the developing countries
average though it is higher than other South Asian countries except
Sri Lanka. India has the second highest physician-population ratio- next only
to Pakistan among the South Asian countries, but this does not ensure easy
access to the poor as predominant proportion of the physicians could be in
the private sector and in urban areas and poor can not afford to pay for their
services.
It is very important to understand how resources are invested over the
period of time in India. The role of the government is to make available
more infrastructure and health professionals. It is mainly done through the
five year plans and annual budgets of central and state governments. The
data regarding the pattern of central government investment on health and
family welfare and AYUSH during different plan periods have been
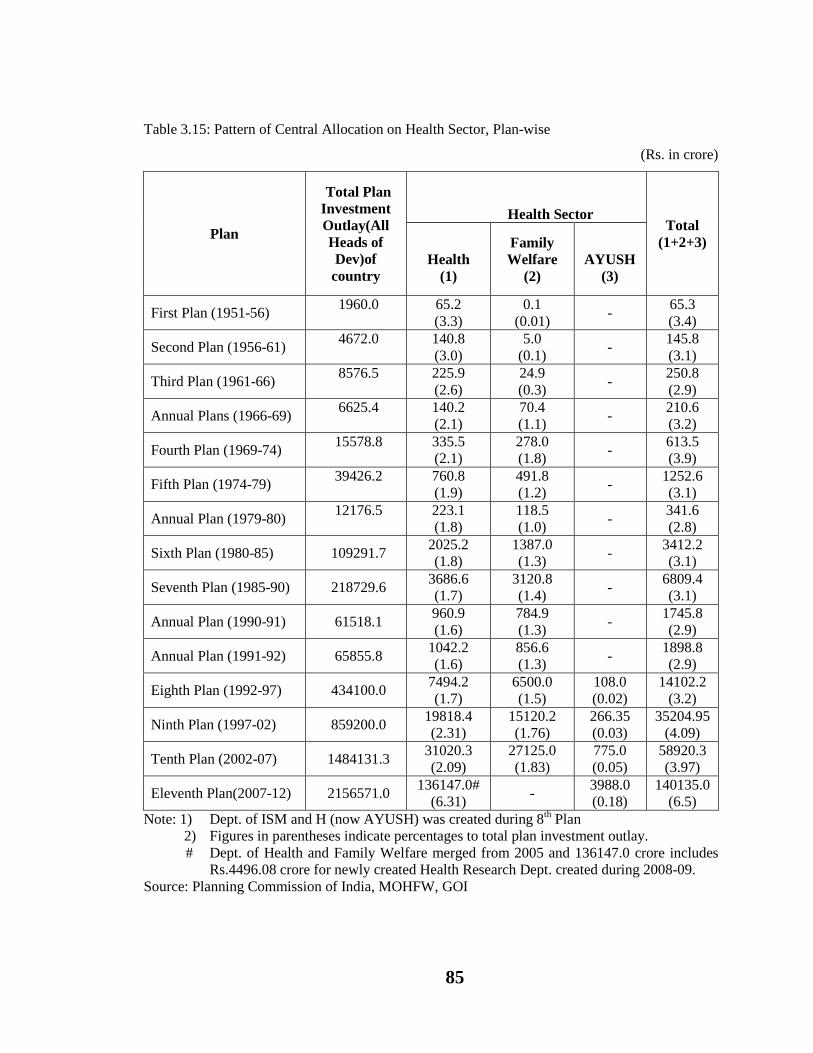
presented in Table 3.15. During the First Plan period total investment was
Rs. 1960 Cr which increased to Rs. 2156571 Cr during the Eleventh Plan.
On analyzing the investment on health, family welfare and AYUSH
separately it has been observed that investment on health in absolute terms
increased from Rs. 65.2 Cr during the First Plan to Rs. 31020.3 Cr during
the Tenth Plan. Investment on health during the First Plan was 3.3 per cent
of total plan investment. It came down to 3.0 per cent in Second Plan,
2.6 per cent in Third Plan and showed a consistent decline thereafter till the
Tenth Plan where it settled at 2.09 per cent. On the contrary, investment on
85
Table 3.15: Pattern of Central Allocation on Health Sector, Plan-wise
(Rs. in crore)
Plan
Total Plan
Investment
Outlay(All
Heads of
Dev)of
country
Health Sector Total
(1+2+3)
Health
(1)
Family
Welfare
(2)
AYUSH
(3)
First Plan (1951-56) 1960.0
65.2
(3.3)
0.1
(0.01) -
65.3
(3.4)
Second Plan (1956-61) 4672.0
140.8
(3.0)
5.0
(0.1) -
145.8
(3.1)
Third Plan (1961-66) 8576.5
225.9
(2.6)
24.9
(0.3) -
250.8
(2.9)
Annual Plans (1966-69) 6625.4
140.2
(2.1)
70.4
(1.1) -
210.6
(3.2)
Fourth Plan (1969-74) 15578.8
335.5
(2.1)
278.0
(1.8) -
613.5
(3.9)
Fifth Plan (1974-79) 39426.2
760.8
(1.9)
491.8
(1.2) -
1252.6
(3.1)
Annual Plan (1979-80) 12176.5
223.1
(1.8)
118.5
(1.0) -
341.6
(2.8)
Sixth Plan (1980-85) 109291.7 2025.2
(1.8)
1387.0
(1.3) -
3412.2
(3.1)
Seventh Plan (1985-90) 218729.6 3686.6
(1.7)
3120.8
(1.4) -
6809.4
(3.1)
Annual Plan (1990-91) 61518.1 960.9
(1.6)
784.9
(1.3) -
1745.8
(2.9)
Annual Plan (1991-92) 65855.8 1042.2
(1.6)
856.6
(1.3) -
1898.8
(2.9)
Eighth Plan (1992-97) 434100.0 7494.2
(1.7)
6500.0
(1.5)
108.0
(0.02)
14102.2
(3.2)
Ninth Plan (1997-02) 859200.0 19818.4
(2.31)
15120.2
(1.76)
266.35
(0.03)
35204.95
(4.09)
Tenth Plan (2002-07) 1484131.3 31020.3
(2.09)
27125.0
(1.83)
775.0
(0.05)
58920.3
(3.97)
Eleventh Plan(2007-12) 2156571.0 136147.0#
(6.31) -
3988.0
(0.18)
140135.0
(6.5)
Note: 1) Dept. of ISM and H (now AYUSH) was created during 8th Plan
2) Figures in parentheses indicate percentages to total plan investment outlay.
# Dept. of Health and Family Welfare merged from 2005 and 136147.0 crore includes
Rs.4496.08 crore for newly created Health Research Dept. created during 2008-09.
Source: Planning Commission of India, MOHFW, GOI
86
family welfare increased considerably in absolute terms from a meagre sum
of Rs. 0.10 Cr during First Plan to Rs. 27125 Cr during Tenth Plan. The
investment on family welfare as a percentage of total plan investment also
increased from .01 per cent during the First Plan to 1.83 per cent during the
Tenth Plan. An amount of Rs. 136147.0 (6.31 per cent) during Eleventh Plan
indicates investment on both health and family welfare, as department of
health and family welfare merged together from 2005 onwards. This amount
also included Rs. 4496.08 Cr for newly created health research department
created during 2008-09. Investment on AYUSH increased in absolute terms
from Rs. 108 Cr during Eighth Plan to Rs. 3988 Cr during Eleventh Plan and
in relative terms rose from 0.02 per cent to 0.18 per cent. Central
government allocation on health sector (i.e. health and family welfare and
AYUSH) taken as a whole jumped from 65.3 Cr during the First Plan to
Rs. 58920.3 Cr during the Tenth Plan. Thus, total health investment as a
percentage of total plan investment showed gradual and steady increase from
3.4 per cent to 3.97 per cent during the corresponding period. During the
eleventh plan, this percentage grew to 6.5 per cent.
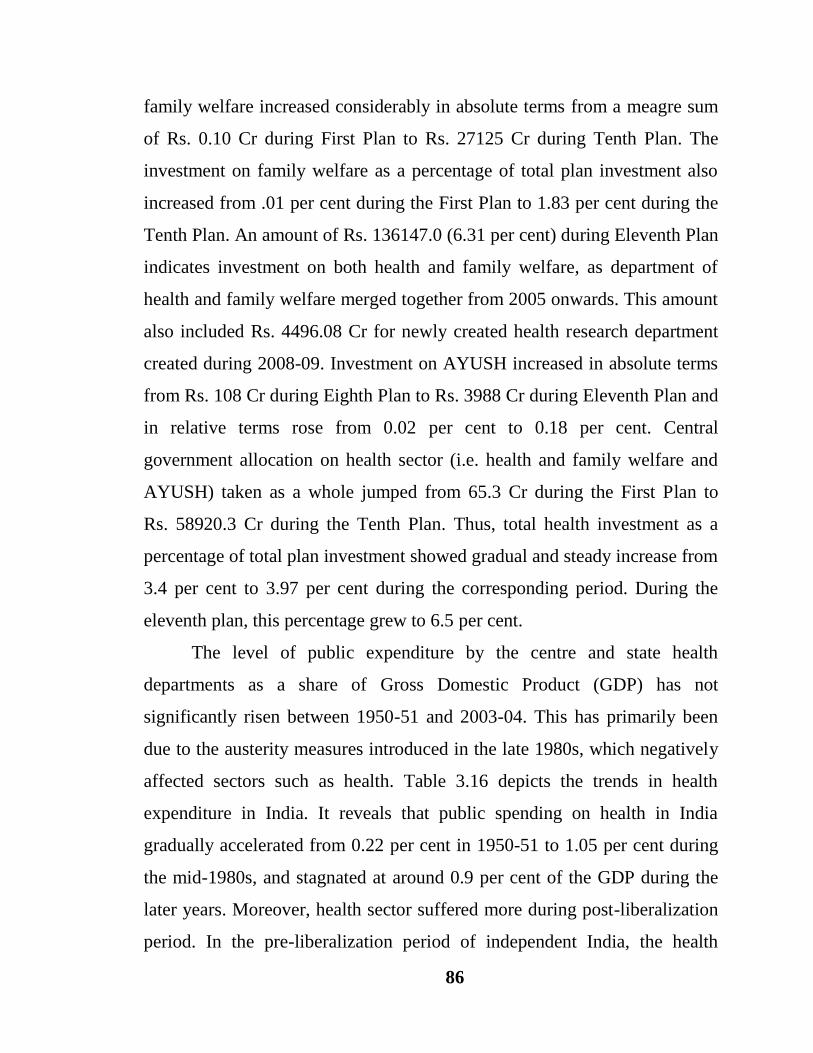
The level of public expenditure by the centre and state health
departments as a share of Gross Domestic Product (GDP) has not
significantly risen between 1950-51 and 2003-04. This has primarily been
due to the austerity measures introduced in the late 1980s, which negatively
affected sectors such as health. Table 3.16 depicts the trends in health
expenditure in India. It reveals that public spending on health in India
gradually accelerated from 0.22 per cent in 1950-51 to 1.05 per cent during
the mid-1980s, and stagnated at around 0.9 per cent of the GDP during the
later years. Moreover, health sector suffered more during post-liberalization
period. In the pre-liberalization period of independent India, the health
87
Table 3.16: Trends in Public Health Expenditure in India
Year Public Health Expenditure as per cent of GDP
Per Capita
Public
Expenditure on
Health (Rs.) Revenue Capital Total
1950-51 0.22 N.A. 0.22 0.61
1955-56 0.49 N.A. 0.49 1.36
1960-61 0.63 N.A. 0.63 2.48
1965-66 0.61 N.A. 0.61 3.47
1970-71 0.74 N.A. 0.74 6.22
1975-76 0.73 0.08 0.81 11.15
1980-81 0.83 0.09 0.91 19.37
1985-86 0.96 0.09 1.05 38.63
1990-91 0.89 0.06 0.96 64.83
1995-96 0.82 0.06 0.88 112.21
2000-01 0.86 0.04 0.90 184.56
2001-02 0.79 0.04 0.83 183.56
2002-03 0.82 0.04 0.86 202.22
2003-04 0.86 0.06 0.91 214.62
Note: GDP is at market price, with base year 1993-94
N.A- Not Available
Source:1. Report on Currency and Finance, RBI, Various Issues
2. Statistical Abstract of India, Govt. of India, Various Issues
3. Handbook of Statistics of India, RBI, Various Issues quoted in Financing and Delivery
of Health Care in India, NCMH, 2005.
expenditure as percentage of the GDP increased as a whole from
0.22 per cent in 1950-51 to 0.96 per cent in 1990-91. However, it has seen a
steady decline ever since in the post-liberalization period from 0.96 per cent
in 1990-91 to 0.91 per cent in 2003-04. Of this, recurring expenditures like,
salaries and wages, drugs, consumables, etc., accounted for more than 90 per
cent and has been on the rise in the recent years. In terms of per capita
expenditure, it increased significantly from less than Re. 1 in 1950-51 to
about Rs. 215 in 2003-04, but the per capita spending by the government
was far below the international aspiration of US$ 12 recommended for an
essential health package by the World Development Report 1993 and again
by the Commission on Macroeconomics and Health (World Health
Organisation, 2002) for low-income countries. As a result of stagnant

88
budgetary allocations, the quality of care suffered substantially and
adversely impacted the utilization of government services by households.
The salient feature of health spending in India has been noted to be
just 0.9 per cent of GDP, which is really inadequate. Besides, its distribution
is not proper. Much of the allocation of health expenditure is on curative
health leaving very little resources for preventive healthcare. Even more
important is the inter-state differences in per capita health expenditures.
Generally, in the states with low per capita incomes and with high
concentration of poverty, per capita public expenditure on health and family
welfare is very low. Low per capita expenditure on health services in states
with larger concentration of poverty results in high out-of-pocket
expenditure. The out-of-pocket expenditure being highly regressive in nature
leads to low access to health care services to the poor.
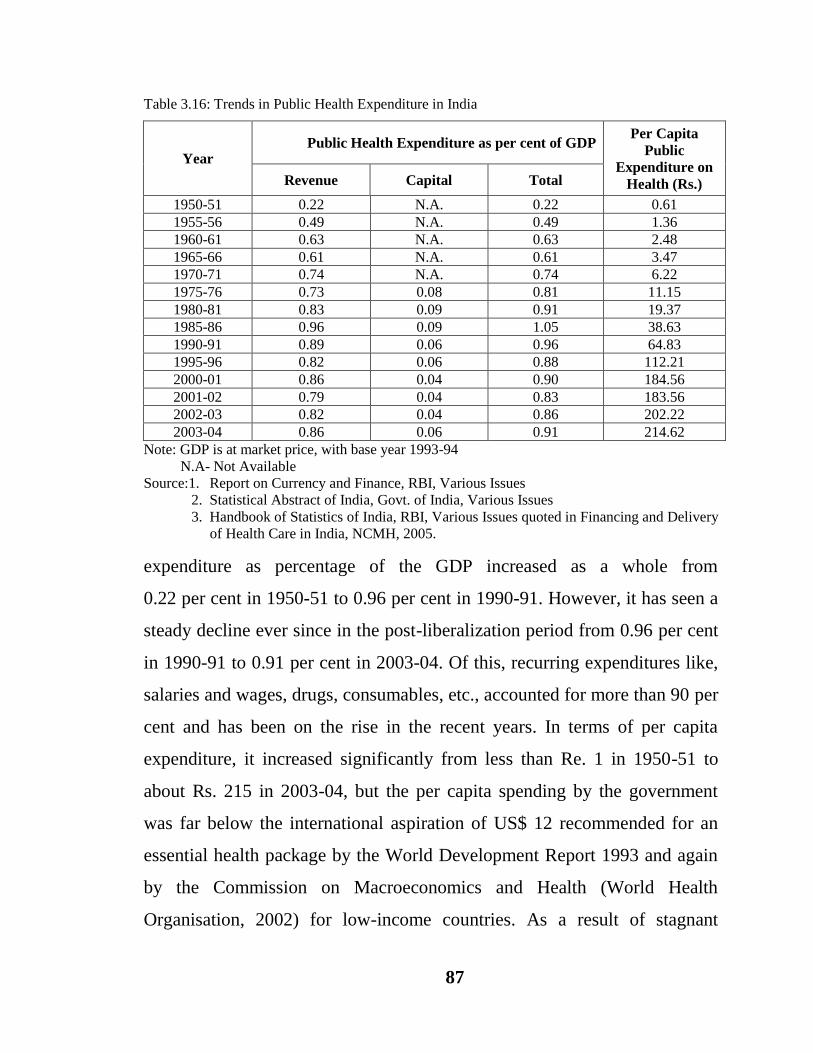
Table 3.17 presents per capita public expenditure on health and family
welfare incurred by the state governments. The expenditures are shown in
both per capita terms and as a percentage of Gross State Domestic Product
(GSDP). The table reveals that the aggregate spending on health services as
a ratio of GSDP has been extremely low and has been declining over the
time. The aggregate spending on health services relative to GSDP showed a
marginal increase from 1.23 per cent in 1995-96 to 1.37 per cent in 2000-01
mainly due to the pay revision in the states in 1998-99 and declined
thereafter to 1.18 per cent in 2004-05. The inter-state inequalities in per
capita spending on health services has been observed, which has steadily
increased over the years. During 1995-96 the per capita health expenditure
89
Table 3.17: State-wise Public Health Expenditure in India
State
Per capita Health Expenditure (Rs.) Per cent of GSDP
1995-96 2000-01 2004-05 1995-96 2001-01 2004-05
Andhra Pradesh 117.33 229.03 282.09 1.06 1.24 1.10
Assam 128.58 208.09 259.29 1.63 1.74 1.69
Bihar 91.59 108.18 100.12 2.69 1.89 1.55
Gujarat 135.24 397.88 345.69 0.85 1.84 1.04
Haryana 171.42 297.16 418.42 1.06 1.13 1.14
Karnataka 149.13 263.70 284.10 1.30 1.32 1.06
Kerala 166.57 270.65 354.31 1.31 1.23 1.17
Madhya Pradesh 146.72 222.49 210.05 1.65 1.81 1.33
Maharashtra 141.78 252.50 316.33 0.78 1.02 0.87
Orissa 115.01 183.64 238.61 1.45 1.73 1.55
Punjab 159.22 324.32 344.68 0.91 1.19 1.00
Rajasthan 250.01 353.14 408.91 2.60 2.50 2.25
Tamil Nadu 166.07 299.00 447.51 1.25 1.31 1.53
Uttar Pradesh 87.88 99.59 156.58 1.21 0.95 1.19
West Bengal 101.38 236.36 206.90 1.02 1.35 0.84
Mean 131.37 224.29 262.24 1.23 1.37 1.18
Standard
Deviation 40.33 81.74 98.98 0.57 0.42 0.37
Co-efficient of
Variation 0.31 0.36 0.38 0.467 0.31 0.315
Source: Finance Accounts of State Governments.
was lowest in Uttar Pradesh (Rs. 87.88) and highest in Rajasthan
(Rs. 250.01), showing a difference of about three times. During 2000-01,
again the lowest per capita health expenditure was observed in Uttar Pradesh
(Rs. 99.59) while it was highest in Gujarat (Rs. 397.88) showing a difference
of about four times, and during 2004-05, per capita health expenditure varied
from Rs. 100.12 in Bihar to Rs. 447.51 in Tamil Nadu, thus showing the
difference of four and a half times between the lowest and highest
expenditure. The co-efficient of variation in per capita health expenditure
increased steadily from 0.31 in 1995-96 to 0.38 in 2004-05, which indicates
a steady increase in inter- state inequalities.
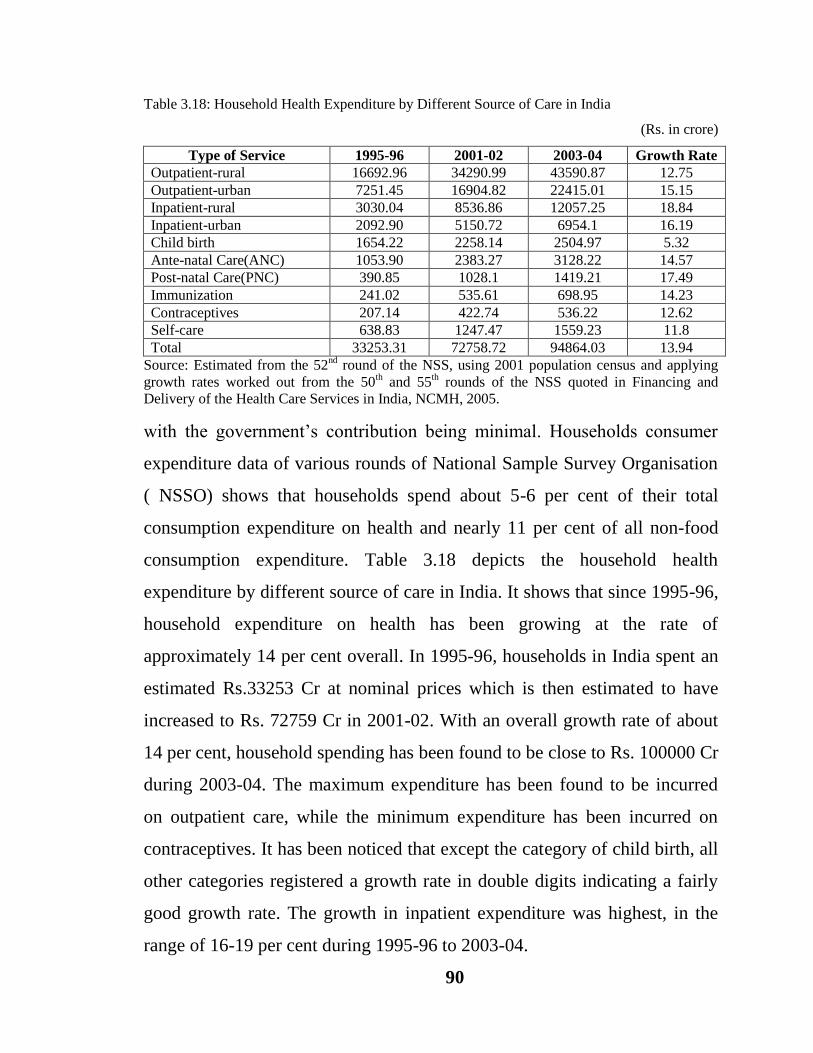
India is one among the developing countries where households spend
a disproportionate share of their consumption expenditure on health care,
90
Table 3.18: Household Health Expenditure by Different Source of Care in India
(Rs. in crore)
Type of Service 1995-96 2001-02 2003-04 Growth Rate
Outpatient-rural 16692.96 34290.99 43590.87 12.75
Outpatient-urban 7251.45 16904.82 22415.01 15.15
Inpatient-rural 3030.04 8536.86 12057.25 18.84
Inpatient-urban 2092.90 5150.72 6954.1 16.19
Child birth 1654.22 2258.14 2504.97 5.32
Ante-natal Care(ANC) 1053.90 2383.27 3128.22 14.57
Post-natal Care(PNC) 390.85 1028.1 1419.21 17.49
Immunization 241.02 535.61 698.95 14.23
Contraceptives 207.14 422.74 536.22 12.62
Self-care 638.83 1247.47 1559.23 11.8
Total 33253.31 72758.72 94864.03 13.94
Source: Estimated from the 52nd
round of the NSS, using 2001 population census and applying
growth rates worked out from the 50th and 55
th rounds of the NSS quoted in Financing and
Delivery of the Health Care Services in India, NCMH, 2005.
with the government‟s contribution being minimal. Households consumer
expenditure data of various rounds of National Sample Survey Organisation
( NSSO) shows that households spend about 5-6 per cent of their total
consumption expenditure on health and nearly 11 per cent of all non-food
consumption expenditure. Table 3.18 depicts the household health
expenditure by different source of care in India. It shows that since 1995-96,
household expenditure on health has been growing at the rate of
approximately 14 per cent overall. In 1995-96, households in India spent an
estimated Rs.33253 Cr at nominal prices which is then estimated to have
increased to Rs. 72759 Cr in 2001-02. With an overall growth rate of about
14 per cent, household spending has been found to be close to Rs. 100000 Cr
during 2003-04. The maximum expenditure has been found to be incurred
on outpatient care, while the minimum expenditure has been incurred on
contraceptives. It has been noticed that except the category of child birth, all
other categories registered a growth rate in double digits indicating a fairly
good growth rate. The growth in inpatient expenditure was highest, in the
range of 16-19 per cent during 1995-96 to 2003-04.
91
Table 3.19: Health Care Expenditure in Major States, 2004-05
State Per Capita Health
Expenditure (Rs.)
Percent Spent By
Households Public Other
Andhra Pradesh 1118 73.4 19.4 7.2
Assam 4365 86.5 13.5 0
Bihar 1497 90.2 8.3 1.5
Gujarat 1187 77.5 15.8 6.7
Haryana 1786 85 10.6 4.4
Karnataka 997 70.4 23.2 6.4
Kerala 2952 86.3 10.8 2.9
Madhya Pradesh 1200 83.4 13.6 3
Maharashtra 1576 73.3 22.1 4.6
Orissa 995 79.1 18 2.9
Punjab 1813 76.1 18 5.9
Rajasthan 808 70 24.5 5.5
Tamil Nadu 933 60.7 26.6 12.7
Uttar Pradesh 1152 84.3 13 2.7
West Bengal 1188 78.4 17.3 4.3
India 1377 73.5 22 4.5
Source: Report of National Commission on Macroeconomics and Health, Government of India,
2005
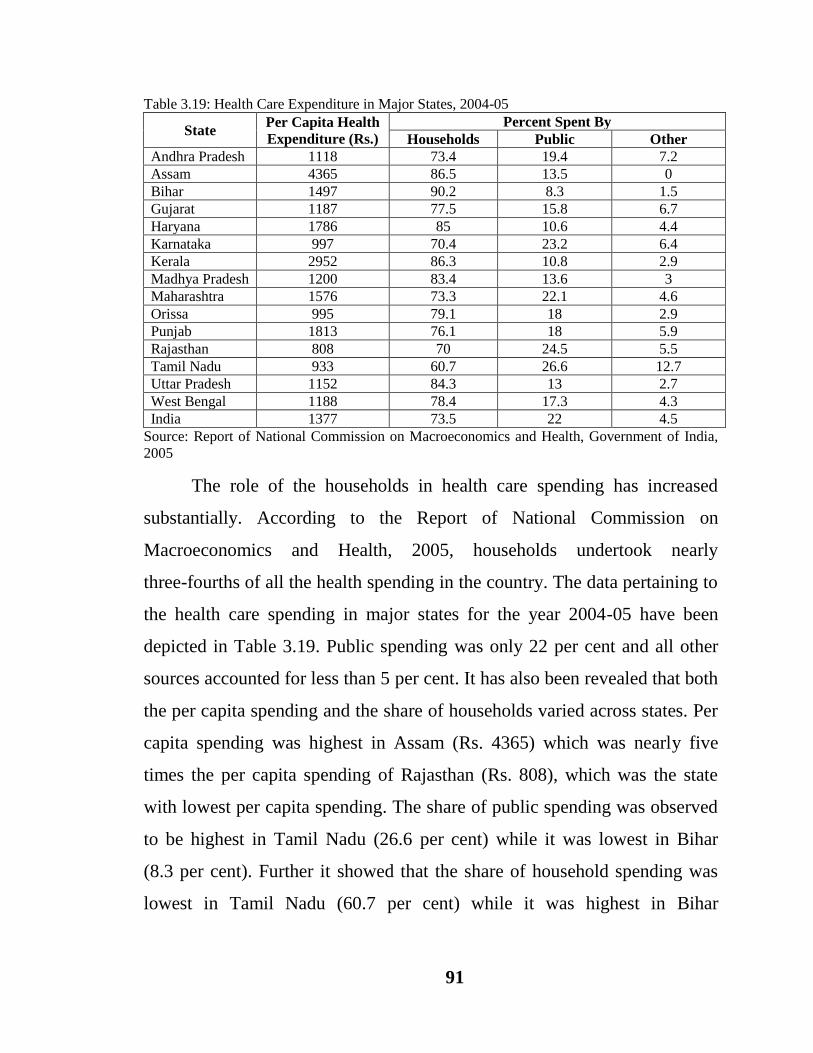
The role of the households in health care spending has increased
substantially. According to the Report of National Commission on
Macroeconomics and Health, 2005, households undertook nearly
three-fourths of all the health spending in the country. The data pertaining to
the health care spending in major states for the year 2004-05 have been
depicted in Table 3.19. Public spending was only 22 per cent and all other
sources accounted for less than 5 per cent. It has also been revealed that both
the per capita spending and the share of households varied across states. Per
capita spending was highest in Assam (Rs. 4365) which was nearly five
times the per capita spending of Rajasthan (Rs. 808), which was the state
with lowest per capita spending. The share of public spending was observed
to be highest in Tamil Nadu (26.6 per cent) while it was lowest in Bihar
(8.3 per cent). Further it showed that the share of household spending was
lowest in Tamil Nadu (60.7 per cent) while it was highest in Bihar

92
Figure 3.7: Health Care Expenditure in Major States, 2004-05
Source: Report of National Commission on Macroeconomics and Health, Government of India, 2005
(90.2 per cent). Many of the states undertook more than 75 per cent of all
health spending indicating an exceptionally high burden upon them
(Figure 3.7).
Thus the health sector in India has been accorded very low priority in
terms of allocation of resources. Public expenditure on health is less than
one per cent of GDP in India. It has further witnessed decline during the post
economic liberalization period because of which households account for the
bulk of health expenditure.
There has been an improvement in health facilities and as a
consequence there has been appreciable improvement in birth rate, death
rate, infant mortality rate and life expectancy, but within India, wide
inter-sector and inter-state disparities exist in the health status. India has
invested substantially in developing the health infrastructure but still there
are gaps and inadequacies in health infrastructure. The public expenditure on
health has not been an issue of high priority. The states have been allocating
0102030405060708090
100
An
dh
ra P
rad
esh
Ass
am
Bih
ar
Gu
jara
t
Har
yan
a
Kar
nat
aka
Ker
ala
Mad
hya
Pra
des
h
Mah
aras
htr
a
Ori
ssa
Pu
nja
b
Raj
asth
an
Tam
il N
adu
Utt
ar P
rad
esh
Wes
t B
enga
l
Ind
ia
Exp
end
itu
re
(in
per
cen
tag
e)
States
Percent Spent By Households
Percent Spent By Public
Percent Spent By Other

93
very low levels of expenditure on health sector because of which a
disproportionately large share of the burden of health care has to be borne by
the households. Health security in India needs to become an urgent national
priority. Rapid improvements in health are needed not only to accelerate and
sustain India‟s economic growth; they are also fundamental to India‟s
gaining recognition as a distinguished country with improved standards of
living and reduced levels of human deprivation. Focusing on health equity
and increasing the allocation on health will be critical to enhance human
capabilities and advancing the progress of Indian society over the next
decade.


