
275
CHAPTER 7
SIMULATIONS OF EXPERIMENTAL WORK PERFORMED
ON COMPOSITE SPECIMENS BY USING ANSYS
7.1 INTRODUCTION 275
7.2 EXPERIMENTAL CONFIGURATIONS 275
7.2.1 Tensile Test 275
7.2.2 Compression Test 278
7.2.3 Impact Test 281
7.2.4 Flexure Test 285
276
CHAPTER 7
SIMULATIONS OF EXPERIMENTAL WORK PERFORMED
ON COMPOSITE SPECIMENS BY USING ANSYS
7.1 INTRODUCTION
The ANSYS Computer Aided Engineering (CAE) software
program, in conjunction with, 3D Computer-Aided Design (CAD)
software is used to replicate the performance of composites under
loaded conditions. The software generates the results and is thus
recorded in this thesis.
Each test presented below indicates the tests conducted on
different electroplated samples. The data to be fed as an input
includes, factors such as: material properties of the body, behaviour of
parts in assembled conditions, types and amount of the load applied
on the body.
The results of the tests provide an understanding as to how the
bodies may perform under practical situations and how their design
might be improved.
7.2 EXPERIMENTAL CONFIGURATIONS
7.2.1 Tensile Test
The dimensions of the tensile samples as per ASTM D638 to be
tested are fed into the software. The CAD model of the specimen is
shown in fig. 7.1. The specimen is fixed in the jaws of the testing
machine and the gauge length is adjusted as 50 mm. The tensile load

277
is applied steadily till the specimen breaks. The tensile load values for
normal, 24 hours water absorbed, and EP-ABS samples vary between
3.06 KN – 4.6 KN, 2.95 KN - 3.01 KN and 2.4 KN – 2.64 KN
respectively.
Fig. 7.1 Tensile test specimen (ABS)
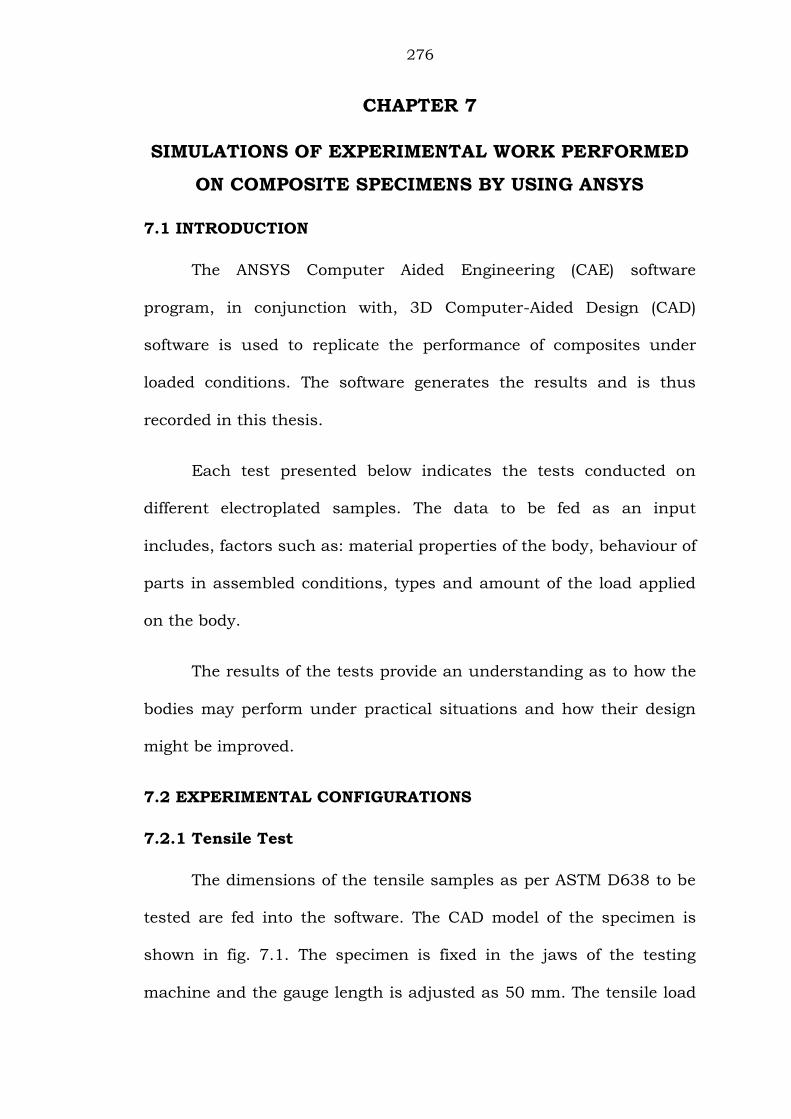
The finite element model is created by using ANSYS workbench 10
software. A solid 185 Geometry, with 8 nodes is used to mesh the
geometry of the specimen. Fig. 7.2 shows the meshed model of the
tensile test specimen obtained with 450 elements and 2880 nodes.
The test process is simulated on the computer by running ANSYS
simulation program. The testing is performed by applying the above
said loads for different samples. The tensile strength obtained in
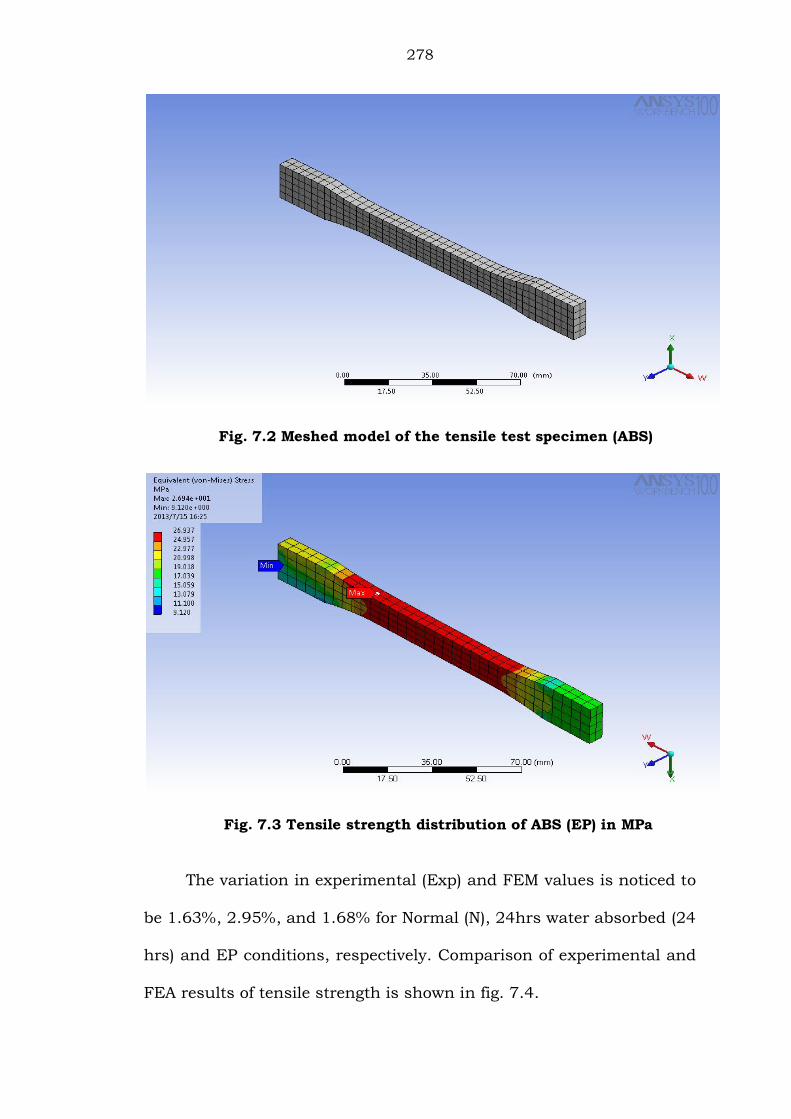
ANSYS is 26.654 MPa, as shown in fig. 7.3. This is very near to the
experimental value of 27.4 MPa.
278
Fig. 7.2 Meshed model of the tensile test specimen (ABS)
Fig. 7.3 Tensile strength distribution of ABS (EP) in MPa
The variation in experimental (Exp) and FEM values is noticed to
be 1.63%, 2.95%, and 1.68% for Normal (N), 24hrs water absorbed (24
hrs) and EP conditions, respectively. Comparison of experimental and
FEA results of tensile strength is shown in fig. 7.4.

279
Fig. 7.4 Comparison of experimental and FEA results of Tensile
Strength samples
7.2.2 Compression Test
The compression test is conducted according to ASTM D695
standards. The specimen is placed on the compression plates of the
UTM. The compressive load is gradually applied to the specimen. The
compressive load values for Normal, 24 hours water absorbed, and
EP-N6 samples vary between 5.9 KN - 6.98 KN, 10.68 KN – 13.83 KN
and 13.64 KN – 17.04 KN respectively. The CAD model of the
compression specimen is as shown in the fig. 7.5.
33.732.5
27.4
33.1531.54
26.94
0
5
10
15
20
25
30
35
40
Normal 24 hrs EP
Ten
sile
Str
en
gth
, M
Pa
Condition of the Materials
ABS(Exp)
ABS(FEM)

280
Fig. 7.5 Compression test specimen (N6)
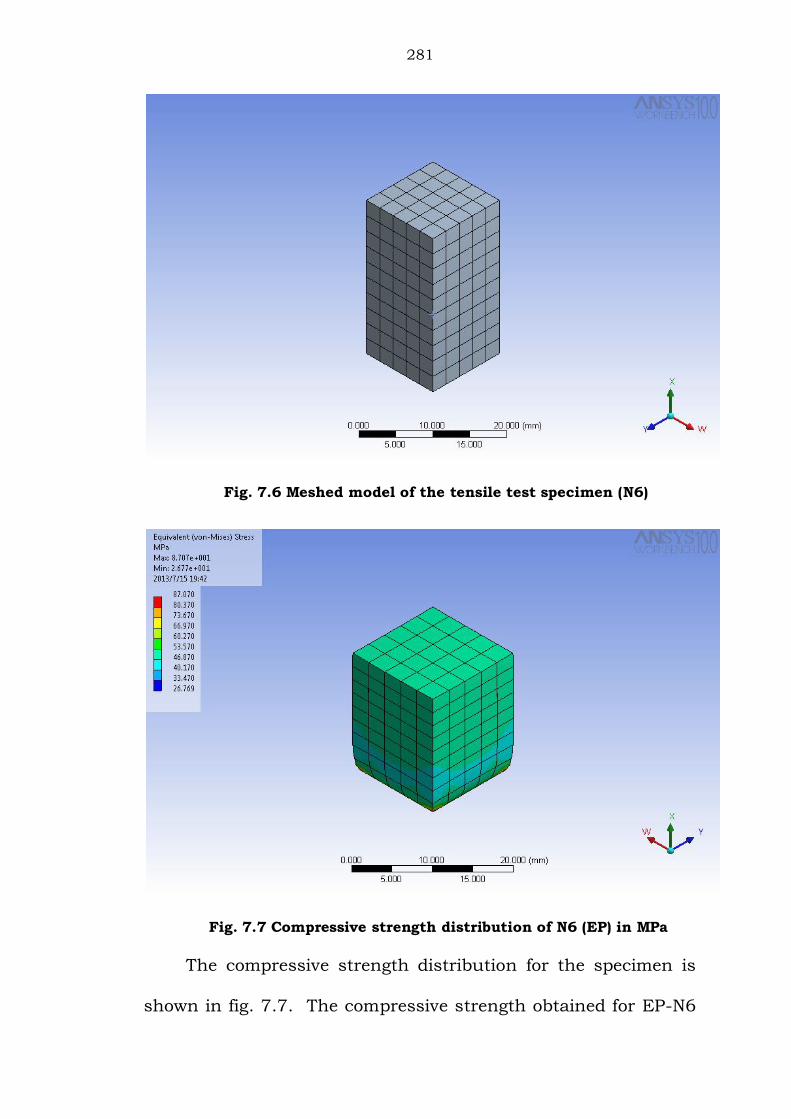
The finite element model is created by using ANSYS software. A
solid 185 Geometry, with 8 nodes is used for meshing of the specimen
geometry. Fig. 7.6 shows the finite element model of the compression
test specimen obtained with 376 elements and 165 nodes. The test
process is simulated on the computer by running ANSYS simulation
program. The computer simulations are performed by applying the
above said loads for different samples.
281
Fig. 7.6 Meshed model of the tensile test specimen (N6)
Fig. 7.7 Compressive strength distribution of N6 (EP) in MPa
The compressive strength distribution for the specimen is
shown in fig. 7.7. The compressive strength obtained for EP-N6

282
specimen from this analysis is 87.707 MPa. Its experimental
value is observed to be 88.944 MPa. The variation in the two
values is noticed to be 1.39%. Fig. 7.8 shows the results of the
tests conducted on the tensile samples by simulation in FEA and
as well as, by the experimental methods.
Fig. 7.8 Comparison of experimental and FEA results of Compressive
Strength samples.
7.2.3 Impact Test
Finite element analysis test method for impact resistance of flat,
rigid plastic specimen by means of a modified impactor (falling weight)
is discussed. The test method followed is slightly modified from ASTM
D5420 standard.
36.60
67.20
88.94
35.84
66.186
87.07
0
10
20
30
40
50
60
70
80
90
100
Normal 24 hrs EP
Com
press
ive S
tren
gth
, M
pa
Condition of Materials
Nylon6(Exp)
Nylon6(FEM)

283
According to ASTM D5420, a drop of known weight descends
through a tube and collides with the striker that is made to rest on
the specimen under study. The weight is dropped from different
heights and sometimes varying weights are dropped from fixed
heights. But, in case of modified dart/drop impact test, the dart is
made to directly fall on the specimen instead of falling on the striker.
The details of the modified drop test have been dealt in detail in
chapter 5.
The geometric model is created using ANSYS software as shown
in the fig. 7.9. A 3D structural solid 185 element with 8 nodes is used
to mesh the geometry of the specimen. A refined mesh is obtained
after convergence check with a total number of 648 elements having
3857 nodes as shown in fig. 7.10. The test simulation is conducted for
samples with varying dart load and drop heights as shown in fig. 7.13.
Fig. 7.9 Impact test specimen (N6+1%)

284
Fig. 7.10 Meshed model of the Impact test specimen (N6+1%)
Fig. 7.11 Impact stress distribution of N6+1% (EP) in MPa

285
Fig. 7.12 Deformation due to impact in N6+1% CaSiO3 Electroplated
The impact process is simulated on the computer by using the
impact load data as recorded in the actual experiment. The
deformation obtained from ANSYS is 0.05748 mm as shown in Fig.
7.12, whereas the actual experimental value for the specimen is
0.05846 mm. The percentage variation is 1.7. The stress distribution
is shown in fig. 7.11. The maximum stress obtained is 1.4078 MPa.
The experimental value is 1.469 MPa. It is observed that there is a
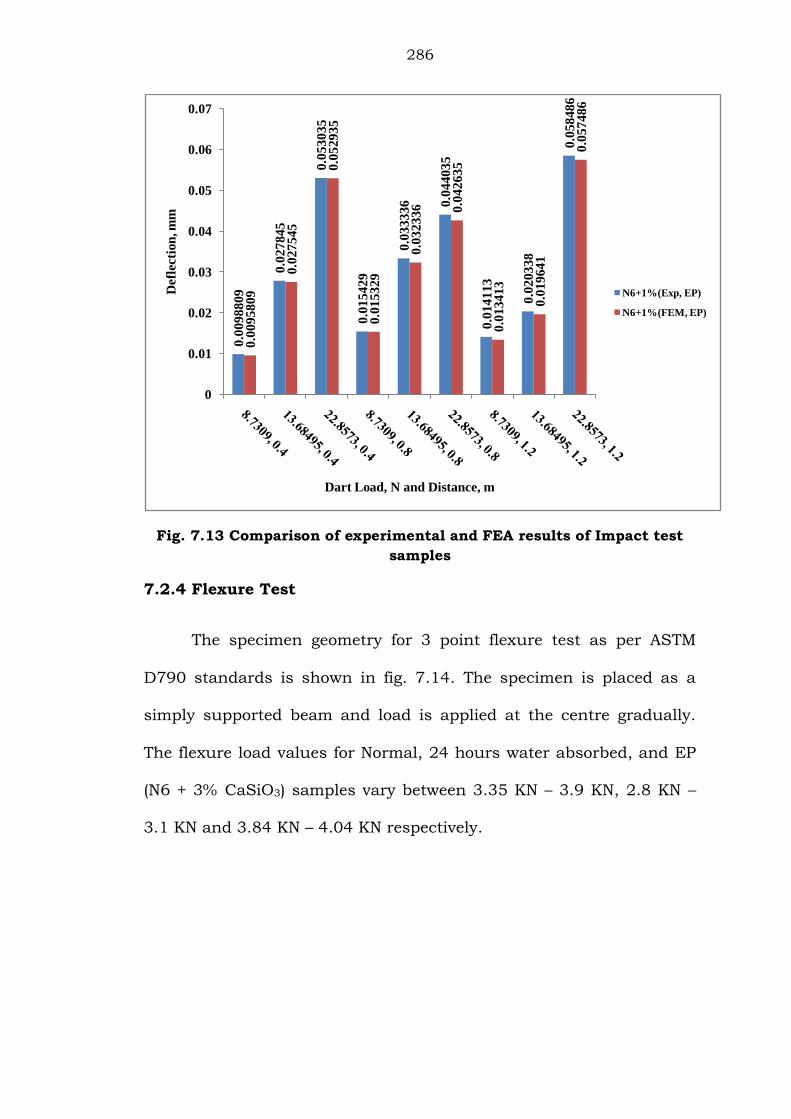
variation of 4.16%. Comparison of experimental and FEA results is
shown in fig. 7.13.
286
Fig. 7.13 Comparison of experimental and FEA results of Impact test
samples
7.2.4 Flexure Test
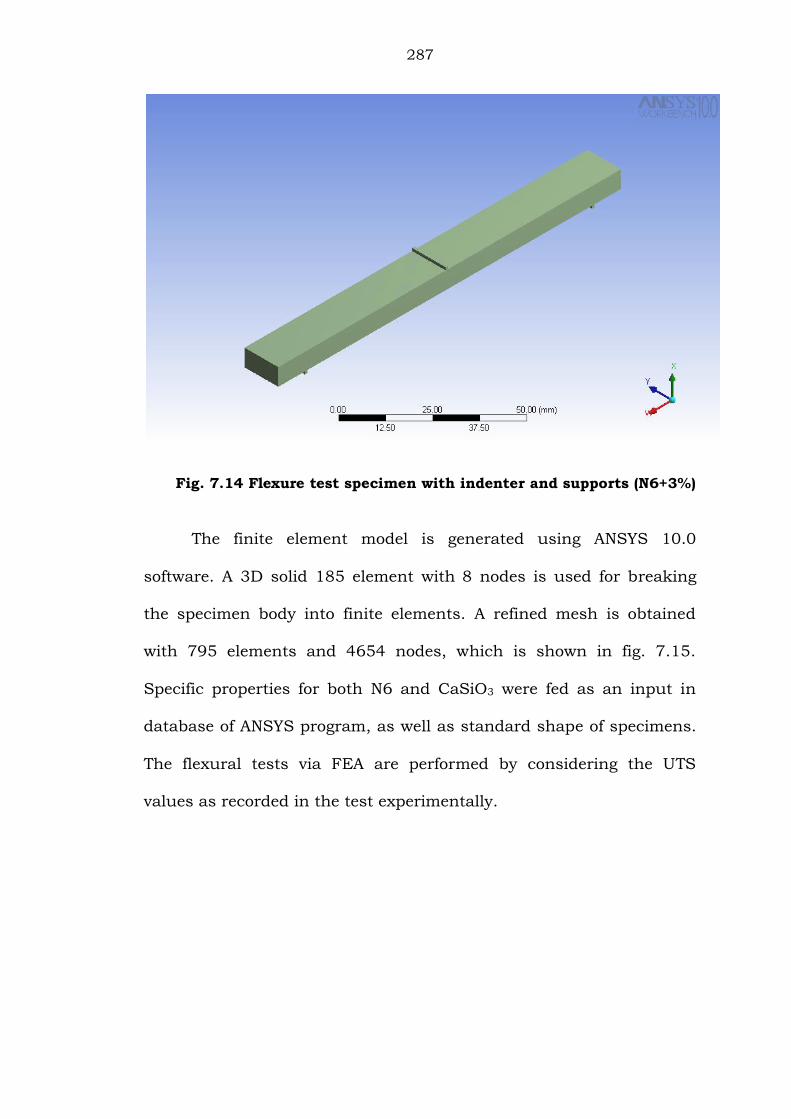
The specimen geometry for 3 point flexure test as per ASTM
D790 standards is shown in fig. 7.14. The specimen is placed as a
simply supported beam and load is applied at the centre gradually.
The flexure load values for Normal, 24 hours water absorbed, and EP
(N6 + 3% CaSiO3) samples vary between 3.35 KN – 3.9 KN, 2.8 KN –
3.1 KN and 3.84 KN – 4.04 KN respectively.
0.0
098809
0.0
27845
0.0
530
35
0.0
15429
0.0
33336 0.0
440
35
0.0
14113
0.0
203
38
0.0
58486
0.0
095809
0.0
27545
0.0
52935
0.0
153
29
0.0
32336 0.0
42635
0.0
134
13
0.0
19641
0.0
574
86
0
0.01
0.02
0.03
0.04
0.05
0.06
0.07
Defl
ecti
on
, mm
Dart Load, N and Distance, m
N6+1%(Exp, EP)
N6+1%(FEM, EP)
287
Fig. 7.14 Flexure test specimen with indenter and supports (N6+3%)
The finite element model is generated using ANSYS 10.0
software. A 3D solid 185 element with 8 nodes is used for breaking
the specimen body into finite elements. A refined mesh is obtained
with 795 elements and 4654 nodes, which is shown in fig. 7.15.
Specific properties for both N6 and CaSiO3 were fed as an input in
database of ANSYS program, as well as standard shape of specimens.
The flexural tests via FEA are performed by considering the UTS
values as recorded in the test experimentally.

288
Fig. 7.15 Meshed model of the Flexure test specimen (N6+3%)
Fig. 7.16 Flexure stress distribution of N6+3% (EP) in MPa
The flexural stress distribution is shown in fig. 7.16. The
maximum flexural strength obtained by computer analysis for EP

289
specimen is 46.81 MPa where as its experimental value is 47.27 MPa.
The variation is 0.96 %, which is within acceptable range.
Fig. 7.17 Comparison of experimental and FEA results of Flexural test
samples.
42.32
34.51
47.27
41.27
33.50
46.81
0
5
10
15
20
25
30
35
40
45
50
Normal 24hrs EP
Fle
xu
ral
Str
ess,
Mp
a
Condition of materials
N6+3%(Exp)
N6+3%(FEM)


