
22
Chapter Three
MACHINE TOOL INDUSTRY AND SENSOR TECHNOLOGY
In this chapter we describe machine tool industry and sensor technology. It begins with a
brief introduction to machine tool followed by discussion on the evolution, structure and
production and trade of the world machine tool industry. The following section analyses
structure, growth and production and trade of Indian Machine Tool Industry in general and
CNC segment of the industry in particular. The chapter is supplemented with discussion on
sensor technology and its application in performance measurements. The last section
presents the conclusions.
3.1 Machine Tool: An Introduction
A machine tool, a power driven mechanical device, changes the geometry of a metal work piece
by removing excess material by cutting, forming, physic-chemical processing or a combination
of these techniques (Groover, 1987; Krar and Check, 1998). Some common machine tools are
lathe, drilling machine, grinding machine, milling machine, machining center, press, and bending
machine etc. Figure 3.1 depicts the classification2
in terms of function (metal cutting, metal
forming), means of control (conventional, numerical) or use (general purpose, special purpose).
________________________
2 As regards to industrial and trade classifications, Machine Tool is classified under serial
number D 2922 of the International Standard Industrial Classification (ISIC); serial number 73
“Metal working machinery” in the Standard International Trade Classification (SITC) Revision 3
and serial 8456 to 8466 of International Harmonized Commodity Description and Coding
System ITC (HS) (Kumar, 2003).

23
Chapter III: Machine Tool Industry and Sensor Technology
Figure 3.1 : Classification of Machine Tool
A metal cutting machine tool account for over 80% of the machine tools in use worldwide. It
shapes a metal work piece by removing metal e.g. lathes, drills, milling machine etc. A metal

24
Ergonomic Studies Pertaining to the Design of Human-CNC Machine Interface
forming machine tool shapes metal without the use of a cutting tool either by pressing, forging,
punching, shearing or bending etc. A general purpose machine (GPM) tool could machine a
variety of different shapes, sizes and materials in any sequence either in batches or as one-off
piece e.g. lathes, machining centers and grinders etc. Whereas a special purpose machine (SPM)
tool can machine economically a specific work piece or a family of work pieces or perform a
specific precision job. They are less flexible than the general-purpose machines due to their
dedication.
A machine tool, which is essentially controlled by an operator, is known as conventional
machine tool. Here a skilled machinist manually feeds control information e.g. speed, feed and
depth of cut etc. to the machine; does the selection of tool based on his interpretation of the
drawing and loads or unloads the tools and work piece manually. When all these operations
which are done manually by operators in a conventional machine tool, are performed
automatically with the help of electronic controls and computers, then such machine tool is often
known as computer numerically controlled (CNC) machine tool. It uses a program of
instructions that is electronically transmitted to the machine to regulate its operations. It saves
time; imparts accuracy, efficiency and flexibility to the process and lesser reliance on scarce
skilled labor. For the ease of understanding we have nomenclature conventional machine tool as
non-CNC machine tool in our discussions. A metal cutting/ metal forming machine tool or a
GPM/SPM may be either conventional i.e. non-CNC or numerically controlled and therefore
depicted through two-way arrow in Figure 3.1. These days CNC machine tools are increasingly
being preferred worldwide due to the inherent advantages of computer numerical controls.
3.2 The World Machine Tool Industry
3.2.1 Overview
Worldwide the machine tool industry is a small part of national manufacturing sector, but widely
regarded as an industry of strategic importance due to its major role in the improvement of

25
Chapter III: Machine Tool Industry and Sensor Technology
overall industrial productivity through supplying embodied technology. The countries with long
traditions of manufacturing machine tool namely the USA, Germany, Japan, Switzerland and
Italy dominates the world market. Among the developing countries China, Korea and Taiwan is
the main.
3.2.2 Evolution
The roots of machine tool industry could be traced in the late 18th
century (1774) when John
Wilkinson- a British iron master, developed a new type of boring mill to bore cylinders for
James Watt’s improved steam engine. Since then many typical machine tools e.g. lathe, shaper,
planer, boring-, drilling- and slotting machine were developed in the UK. The process of
specialization in design and manufacture, and application to mass production in industries like
firearms, sewing machine and bicycle etc. started in the 1840s in the USA where labor was
comparatively scarce (Sciberras and Payne, 1985). By the beginning of the 20th
century
automobile industry became its major user. Since 1913, Ford’s moving assembly line stimulated
the demand for special purpose machine tools (SPMs). Automobile and armament industry
continued to be the main driving force till 1940. During the World War II aircraft industry
became the key driver for innovation in the industry and led to the introduction of numerical
control (NC) machine tool in 1948 in the USA. Kearney and Trecker, USA was the first to
introduce the first machining center in 1958. The German and Japanese industry also emerged in
the fifties. The USA was the undisputed market leader till the eighties. Then Japan took over the
leadership with the introduction of low cost, standardized and reliable microprocessor based
CNC machine tool in the eighties. The eighties also saw the emergence of developing countries
mainly catering to the lower ends of automobile and general engineering industries. In the
nineties and later electronic and consumer goods industry became the main driving force for
technological innovation (Arnold, 2001).

26
Ergonomic Studies Pertaining to the Design of Human-CNC Machine Interface
3.2.3 Structure
Machine tool industry is a small industry. The developments in microelectronics and
telecommunications have rejuvenated this industry, which was otherwise on decline. It has
brought significant changes in controls and overall environment of the machine tool. The
introduction of numerical controls has facilitated the combination of several cutting processes
into one machine with higher flexibility. Now drilling, planning, boring and milling operations
could be performed on one machine like machining center. Similarly operations like turning and
grinding could be done on turning centers. The convergence of technology of the three separate
areas: machine-tool, computers and communication technology have forced a significant shift in
the boundaries of the markets and technology. With these developments the market for non-CNC
machine tool has shrunk to less than 20% (Kumar, 2003). Nowadays in the developed countries
the firms are identified more as a supplier of industrial automation systems rather than machine
tools. Therefore the importance of R&D has increased even more compared to earlier years. A
study done by Arnold (2001) indicates that worldwide firms spend 4-10% of annual sales on
R&D. Volume producers of standardized machine tools spend less compared to producers of
high-end SPMs and system providers.
3.2.4 Production and Trade
World turnover by the 28 principal machine tool manufacturing countries totaled 66.3 billion US
Dollars in 2010 and represented a gain of 21% over the previous year (IMTMA, 2012). In this
area China dominance continued during January-December 2010. For years, China has been the
largest machine tool consuming country. In 2009, it became the largest manufacturing nation as
well. In 2010, China made substantial gains in shipments leading to a further enhanced share of
total world production to 30% (Figure 3.2). Japan achieves a growth of 69% in 2010 as well as
retains the second position in the global ranking of the leading machine tool manufacturers. 2010
was a year of delight for the other Asian performers- Korea, Taiwan and India. All three

27
Chapter III: Machine Tool Industry and Sensor Technology
countries grew at over 65% and secured leading positions of fifth, sixth and thirteenth,
respectively in the overall production ranking (IMTMA, 2012). Sluggish market conditions in
Europe led to a slump in fortunes in most of its machine tool manufacturing countries during
2010. Germany, Italy, Switzerland , Austria, Spain, France, Czech Republic, Netherlands,
Belgium- either had flat growth or witnessed decline in production. United Kingdom managed a
marginal 7% growth. United States of America mirrored a similar business scenario- dropping by
9% in total machine tool turnover and falling to the eighth position in 2010. It is the second
successive year of decline for USA- with production worth 2026 million US Dollar, being less
than half of what it achieved in 2008 (IMTMA, 2012). With Asia being seen as the future
destination for global machine tool market, it is expected that 2012 would be the year of
resurgence for all regions across the board.
Figure 3.2 : World Machine Tool Production in 2010 (in %)
Source: IMTMA (2012) and world machine tool output survey by Gardner Publications (2011)
Exports of metalworking machine tools by 28 countries in 2010 totaled 32.7 billion US Dollars,
registering an 18% increase- almost maintaining parity with global turnover. Japan was the
largest exporter of metalworking machine tools, followed by Germany. While the former
recorded a quantum 86% growth in export orders, the latter had a decline of 9% over the
German
15%
1
28
Ergonomic Studies Pertaining to the Design of Human-CNC Machine Interface
previous year of 2009. Among other key manufacturing countries that made substantial
percentage increases in machine tool exports in 2009 include Taiwan, China and Korea. Global
imports fared better with a higher growth of 23% on a total machine tool shipment worth 26.2
billion in 2010. China led the pack, with an estimated 9.1 billion US Dollars worth of
metalworking machine tools shipped in, and topping it with a 54% increase over. It was followed
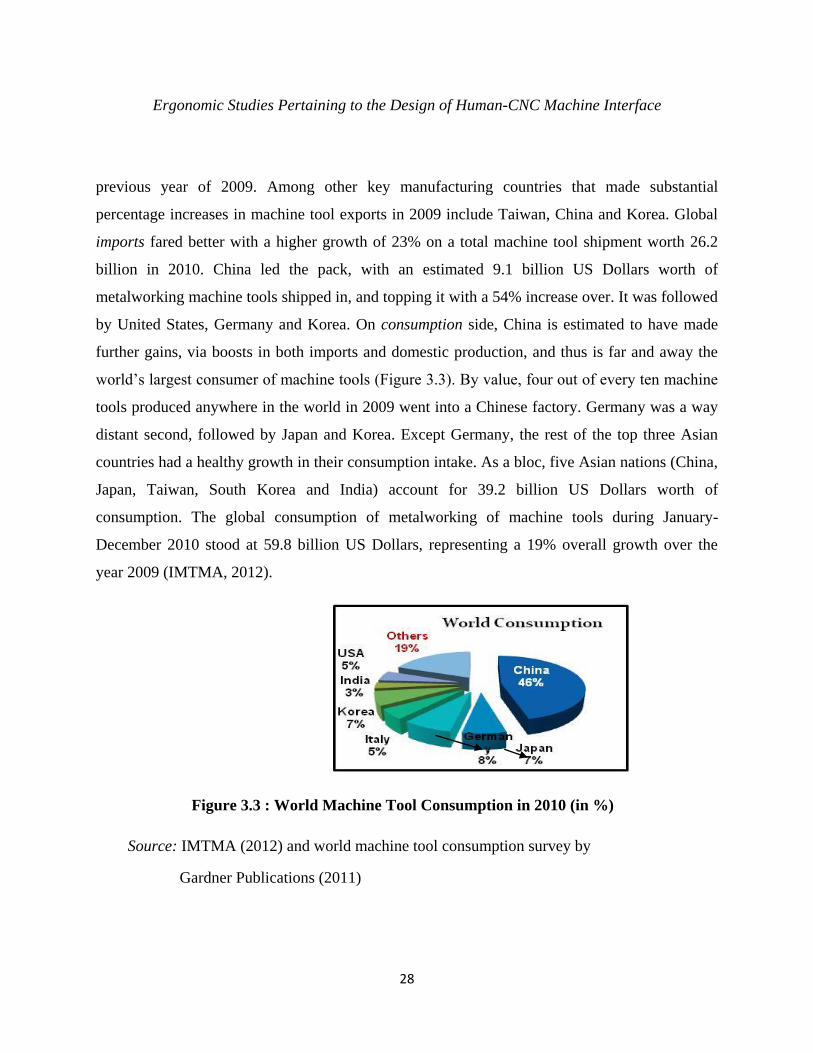
by United States, Germany and Korea. On consumption side, China is estimated to have made
further gains, via boosts in both imports and domestic production, and thus is far and away the
world’s largest consumer of machine tools (Figure 3.3). By value, four out of every ten machine
tools produced anywhere in the world in 2009 went into a Chinese factory. Germany was a way
distant second, followed by Japan and Korea. Except Germany, the rest of the top three Asian
countries had a healthy growth in their consumption intake. As a bloc, five Asian nations (China,
Japan, Taiwan, South Korea and India) account for 39.2 billion US Dollars worth of
consumption. The global consumption of metalworking of machine tools during January-
December 2010 stood at 59.8 billion US Dollars, representing a 19% overall growth over the
year 2009 (IMTMA, 2012).
Figure 3.3 : World Machine Tool Consumption in 2010 (in %)
Source: IMTMA (2012) and world machine tool consumption survey by
Gardner Publications (2011)

29
Chapter III: Machine Tool Industry and Sensor Technology
3.3 Machine Tool Industry in India
3.3.1 Overview
India, where machine tool production dates back to late nineteenth century, started production in
an organized manner after independence in the mid 1950s as a result of the thrust given by the
government on the development of heavy industries. After the independence, this industry has
largely grown under a protected environment to achieve the national objective of self-reliance.
As a result the industry recorded significant growth and diversification. However, the prolonged
protection has hampered innovation and international competitiveness. Now a wide range of
relatively less complex non-CNC and CNC machine tools are manufactured in the country. The
industry has been able to absorb and adapt technology for wide range of GPM and SPMs. An
emerging positive feature is the increase in share of CNC machine tools in total production
during the last few years both in terms of quality as well as value.
The Indian machine tool industry is a widely dispersed industry comprising units of various
sizes. The industry has an estimated 750-800 company in all, producing machine tools,
accessories and sub-systems. Of these, around 400 produce complete machine tools of all types
and sizes. Between 25 and 50 are large industries and the rest are SMEs. A majority of the
machine tool manufacturers have ISO certification (IMTMA, 2012). The Indian machine tool
industry manufactures almost the complete range of metal-cutting and metal-forming machine
tools and SPMs. The products comprise conventional machine tools as well as CNC machines
and include SPMs, robots and handling systems.
3.3.2 Evolution and Growth of Machine Tools
It was in the late seventies when the government of India recognized the importance of
productivity and efficiency of investment, the scenario started to change. The government
30
Ergonomic Studies Pertaining to the Design of Human-CNC Machine Interface
encouraged firms to modernize by way of importing disembodied and embodied technology
(Kumar, 2003). Growth of the Indian machine tool industry has an immense bearing on the entire
economy, especially India’s manufacturing industry. The machine tool industry is crucial for
development of the country’s strategic segments such as defense, railways, space and atomic
energy. World over developed countries have created market niches on the back of a well-
developed and supportive machine tool sector. In India as well, machine tools have a high impact
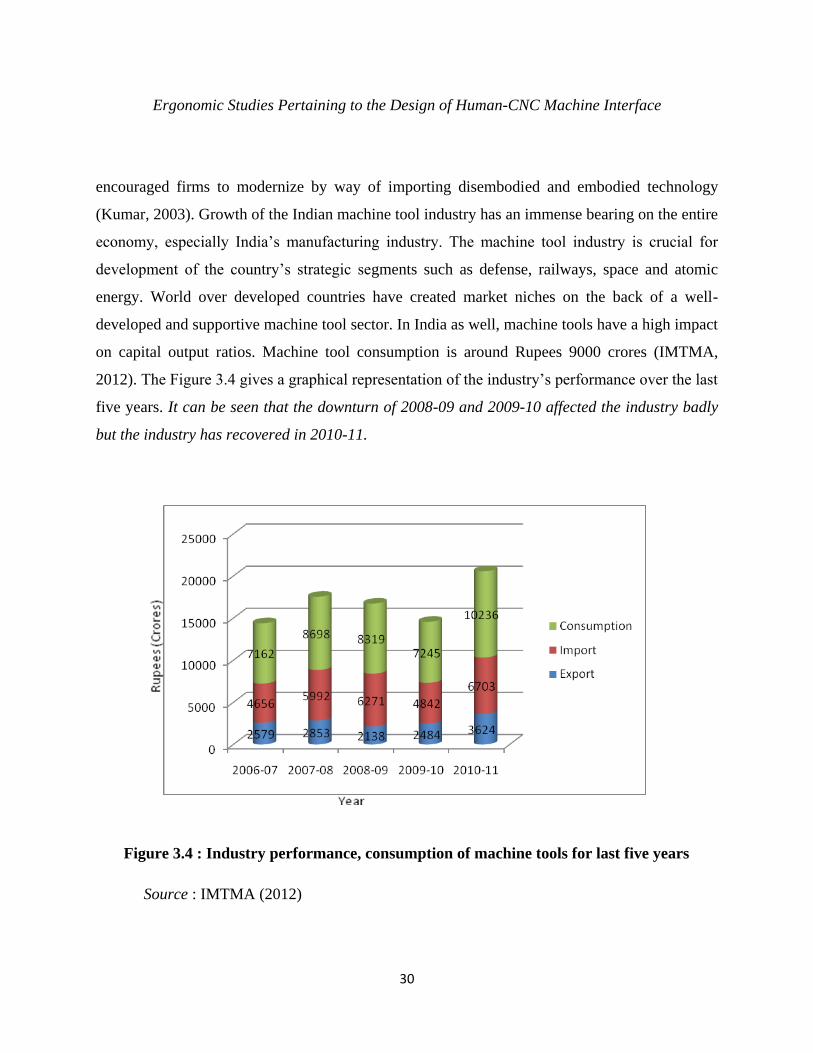
on capital output ratios. Machine tool consumption is around Rupees 9000 crores (IMTMA,
2012). The Figure 3.4 gives a graphical representation of the industry’s performance over the last
five years. It can be seen that the downturn of 2008-09 and 2009-10 affected the industry badly
but the industry has recovered in 2010-11.
Figure 3.4 : Industry performance, consumption of machine tools for last five years
Source : IMTMA (2012)

31
Chapter III: Machine Tool Industry and Sensor Technology
The future outlook for the industry is optimistic and the machine tool industry can expect a
continued growth in demand. An aggregate demand of rupees 60,000 to 70,000 crores is
anticipated over the next five years. If the industry can overcome its constraints in technology
and products to meet the high end requirements and reach a market share of at least 50%, the
future of the industry can indeed be bright. This is also essential to meet technology denial from
advanced countries which compromise national security. Based on the anticipated demand
growth rate and desired production rate, the data for the period 2011-12 to 2019-2020 work out
as depicted in the Figure 3.5 (IMTMA, 2012). These data may be taken as an indication of the
demand for machine tools for the purpose of working out suitable strategies for the industry to
upgrade, invest and ramp up its production in the long run.
Year
Figure 3.5 : Future outlook Demand and Production projections to 2019-20
Source : IMTMA (2012)

32
Ergonomic Studies Pertaining to the Design of Human-CNC Machine Interface
3.3.3 Production and Trade of CNC and Non-CNC Machines
Machine tools production in India has increased to rupees 24158 million during 2010-11 from
rupees 16562 million compared to 2009-2010 registering the annual growth rate of 46%
(IMTMA, 2012). Figure 3.6 depicts production of metal working machines-CNC and non-CNC.
Figure 3.6 : Production of metal working machines- CNC and Non-CNC (Millions
of rupees)
Source : IMTMA (2012)
Production of metal cutting machines reached rupees 21075 million during 2010-11 compared to
rupees 13918 during 2009-10 registering annual growth rate of 51%. Figure 3.7 indicates
production of metal cutting machines- CNC and non-CNC.

33
Chapter III: Machine Tool Industry and Sensor Technology
Figure 3.7 : Production of metal cutting machines- CNC and Non-CNC (Millions of rupees)
Source : IMTMA (2012)
Production of metal forming machines has reached rupees 3084 million during 2010-11
compared to rupees 2643 million during 2009-10 registering a growth rate of 17%. Figure 3.8
depicts production of metal forming machines- CNC and non-CNC.
Figure 3.8: Production of metal forming machines-CNC and Non-CNC(Millions of rupees)
Source : IMTMA (2012)

34
Ergonomic Studies Pertaining to the Design of Human-CNC Machine Interface
Machine tools export from India has reached rupees 905 million during 2010-11 compared to
rupees 810 million during 2009-10 registering annual growth rate of 12%. All types of machines
CNC, non-CNC, metal cutting and metal forming were exported from India to various countries
(IMTMA, 2012). Metal cutting machine export from India was rupees 843 million during 2010-
11 compared to rupees 560 million during 2009-10. The growth rate was 50%. While as metal
forming machine exports declined to rupees 62 million during 2010-11 compared to rupees 249
million during 2009-10. The decline was 75%.
Machine tools import to India has reached rupees 67032 million during 2010-11 compared to
rupees 48422 million during 2009-10 registering an annual growth rate of 38%. All types of
machines CNC, non-CNC, metal cutting, metal forming, used and new machines are imported to
India from various countries (IMTMA, 2012). Metal cutting machine imports to India has
reached rupees 47571 million during 2010-11 as compared to rupees 28539 million during 2009-
10 registering growth rate of 67%. The metal forming machine imports has declined marginally
to rupees 19462 million during 2010-11 compared to rupees 19884 million during 2009-10
registering decline of 2%.
Machine tool consumption in India (Production-Export+Import) has reached rupees 90285
million during 2010-11 as compared to rupees 64174 million during 2009-10 registering a
growth rate of 41%. All types of machines CNC, non-CNC, metal cutting and metal forming are
consumed in India (IMTMA, 2012). Metal cutting machine consumption was rupees 67803
million during 2010-11 as compared to rupees 41897 million during 2009-10. The growth was
62%. While as metal forming machine consumption in India was rupees 22484 million during
2010-11 as compared to rupees 22277 million during 2009-10. The growth rate was only 1%.

35
Chapter III: Machine Tool Industry and Sensor Technology
3.4 Sensor Technology
3.4.1 Introduction
During the past two decades, there has been an unprecedented growth in the number of products
and services, which utilize information gained by monitoring and measuring using different
types of sensors. The development of sensors to meet the need is referred to as sensor technology
and is applicable in a very broad domain including the environment, medicine, commerce and
industry. Governments and policy makers throughout the world are realizing the potential
benefits of encouraging the growth in sensor technology not only as a result of new technological
trends, and hence new products, for the indigenous industry to effect improved product quality
and efficiency by broadening the level of control over their processes, but also in support of the
implementation and enforcement of government legislation on environmental and safety issues.
Such awareness has been copiously demonstrated in the recent UK national Technology
Foresight exercise conducted to examine potential opportunities and to promote wealth creation
and enhance quality (http://www.dcu.ie). Through the 15 independent Technology Foresight
panels, covering a wide range of industrial sectors, the worldwide need for sensor technology
was reinforced. In 13 out of 15 panels, sensor technology was seen as an integral element in the
overall development of products and services. In fact it emerged as the key technology to support
a wide variety of research and industrial applications.
A sensor is a device that receives a stimulus and responds with an electrical signal. The purpose
of a sensor is to respond to some kind of an input physical property (stimulus) and to convert it
into an electrical signal which is compatible with electronic circuits. The sensor’s output signal
may be in the form of voltage, current or charge. These may be further described in terms of
amplitude, frequency, phase or digital code. Any sensor is an energy converter. The process of
sensing is a particular case of information transfer and any transmission of information require
transmission of energy. The transmission of energy can flow both ways-it may be, with a

36
Ergonomic Studies Pertaining to the Design of Human-CNC Machine Interface
positive sign that is flow from an object to the sensor or with a negative sign that is from the
sensor to the object.
Data Acquisition System
Sensor
Sensor
Figure 3.9 : Positions of sensors in a data acquisition system. Sensor 1 is noncontact,
sensor 2 and 3 are passive, sensor 4 is active and sensor 5 is internal to a
data acquisition system.
Source : Fraden (2006), Hand Book of Modern Sensors, Third Edition, AIP Press, Springer.
The sensor does not function by itself; it is always a part of a large system that may incorporate
many other detectors, signal conditioners, signal processors, memory devices, data recorders and
Interface
Object
Actuator
Interface
Excitation
Circuit
Multiplexer Computer
Peripheral
Device
Analog to
Digital
Converter 3
4
2
1
5

37
Chapter III: Machine Tool Industry and Sensor Technology
actuators. The sensor’s place in a device is either intrinsic or extrinsic. It may be positioned at
the input of a device to perceive the outside effects and to signal the system about variations in
the outside stimuli. Also, it may be an internal part of a device that monitors the devices’ own
state to cause the appropriate performance. A sensor is always a part of some kind of a data
acquisition system. Often, such a system may be a part of a larger control system that includes
various feedback mechanisms. Figure 3.9 shows a block diagram of a data acquisition and
control device.
Data are collected from an object by a number of sensors. Some of them (2, 3 and 4), as shown
in Figure 3.9, are positioned directly on or inside the object. Sensor 1 perceives the object
without a physical contact and, therefore is called a noncontact sensor. Sensor 5 monitors
internal conditions of a data acquisition itself. Some sensors (1 and 3) cannot be directly
connected to standard electronic circuits because of inappropriate output signal format. They
require the use of interface devices (signal conditioners). Sensors 1, 2, 3 and 5 are passive. They
generate electric signals without energy consumption from the electronic circuits. Sensor 4 is
active. It requires an operating signal, which is provided by an excitation circuit. This signal is
modified by the sensor in accordance with the converted information.
Electrical signals from the sensors are fed into a multiplexer (MUX), which is a switch or a gate.
Its function is to connect sensors one at a time to an analog-to-digital (A/D) converter if a sensor
produces an analog signal, or directly to a computer if a sensor produces signals in a digital
format. The computer controls a multiplexer and an A/D converter for the appropriate timing.
Also, it may send control signals to the actuator, which acts on the object. The system contains
some peripheral devices (a data recorder, a display, an alarm, etc.) and a number of components.
The sensor’s input signals (stimuli) may have almost any conceivable physical or chemical
nature (e.g., light flux, temperature, pressure, vibration, displacement, position, velocity, ion
concentration, etc.). The sensor’s design may be of a general purpose. A special packaging and
housing should be built to adapt it for a particular application. Some sensors are specifically

38
Ergonomic Studies Pertaining to the Design of Human-CNC Machine Interface
designed to be very selective in a particular range of input stimulus and be quite immune to
signals outside of the desirable limits.
3.4.2 Piezoelectric Sensors
A piezoelectric sensor is a device that uses the piezoelectric effect to measure pressure,
acceleration, strain or force by converting them to an electrical charge. The piezoelectric effect
is the generation of electric charge by a crystalline material upon subjecting it to stress. The
effect exists in natural crystals, such as quartz (SiO2) and poled (artificially polarized) human-
made ceramics and some polymers, such as polyvinylidene fluoride. To pickup an electric
charge, conductive electrodes must be applied to the crystal. As a result, a piezoelectric sensor
becomes a capacitor with a dielectric material which is a piezoelectric crystal. The dielectric acts
as a generator of electric charge. Although charge in a crystalline dielectric is formed at the
location of an acting force, metal electrodes equalize charges along the surface, making the
capacitor not selectively sensitive. However, if electrodes are formed with a complex pattern, it
is possible to determine the exact location of the applied force by measuring the response from a
selected electrode.
The piezoelectric effect is a reversible physical phenomenon. This means that applying voltage
across the crystal produces mechanical strain. By placing several electrodes on the crystal, it is
possible to use one pair of electrodes to deliver voltage to the crystal and the other pair of
electrodes to pick up charge resulting from developed strain. This method is used quite
extensively in various piezoelectric transducers.
3.4.3 Load Cell
A load cell is a transducer that is used to convert a force into electrical signal. This conversion is
indirect and happens in two stages. Through a mechanical arrangement, the force being sensed

39
Chapter III: Machine Tool Industry and Sensor Technology
deforms a strain gauge. The strain gauge measures the deformation (strain) as an electrical
signal, because the strain changes the effective electrical resistance of the wire. A load cell
usually consists of four strain gauges in a Wheatstone bridge configuration. The electrical signal
output is typically in the order of a few millivolts and requires amplification by an
instrumentation amplifier before it can be used. The output of the transducer is plugged into an
algorithm to calculate the force applied to the transducer.
Although strain gauge load cells are the most common, there are other types of load cells as
well. In industrial applications, hydraulic (or hydrostatic) is probably the second most common,
and these are utilized to eliminate some problems with strain gauge load cell devices. A
hydraulic load cell is immune to transient voltages (lightning) so might be a more effective
device in outdoor environments. Other types include piezoelectric load cells (useful for dynamic
measurements of force), and vibrating wire load cells, which are useful in geomechanical
applications due to low amounts of drift.
Every load cell is subject to "ringing" when subjected to abrupt load changes. This stems from
the spring-like behavior of load cells. In order to measure the loads, they have to deform. As
such, a load cell of finite stiffness must have spring-like behavior, exhibiting vibrations at its
natural frequency. An oscillating data pattern can be the result of ringing. Ringing can be
suppressed in a limited fashion by passive means. Alternatively, a control system can use an
actuator to actively damp out the ringing of a load cell. This method offers better performance at
a cost of significant increase in complexity. Load cells are used in several types of measuring
instruments.
3.4.4 Performance Measurement in CNC Machine Environment
In this study piezoelectric load cells were used to measure human performance in a CNC
machine interaction environment. A similar CNC machine panel was mounted on the designed

40
Ergonomic Studies Pertaining to the Design of Human-CNC Machine Interface
combination of load cells. The complete panel arrangement was stationed on a well designed
working platform in the controlled laboratory arrangements. Signals from all sensors go to the
A/D converter through channel 1. A signal through microprocessor from this location also goes
to a peripheral device (VDU screen). This arrangement was used to ensure zero error human
performance results. Another signal through channel 2 goes to same A/D converter. This signal
was supplied through a switch board used for initial visual stimuli with the help of various
colored LEDs. These LEDs were displayed on a board (with controlled arrangements) in front of
the working platform. All the signals were stored in the computer. For analysis, the
microprocessor identifies sensor’s signal in the form of search time, motor action time and force
applied. This system can be used to measure human performance based on other therbligs and
cognitive models, in several types of working environments.
3.5 Conclusions
Machine tool industry around the world is a small manufacturing sector, but widely regarded as
a strategic industry. The developments in microelectronics and telecommunications in general
and CNC in particular have rejuvenated the market. The production and trade have been mostly
concentrated in industrialized countries accounting for more than two-thirds of share. However,
it is gaining importance among developing countries. The production of high-end machines is
concentrated in the China, Japan, USA, Germany and Switzerland. No country has a machine
tool sector that can boast of breadth in its product and technology to satisfy the entire local
demand. Firms therefore rely on external markets for sustained growth.
This industry in India has largely grown under a protected environment to achieve the objective
of self-reliance. As a result it recorded significant growth and diversification but a fragmented
industry evolved. The notions of diversification and fragmentation are common for both CNC
and non-CNC segment of the industry. The basic structure of the industry is similar to the world
machine tool industry i.e. coexistence of a few large firms with large number of SMEs. In fact

41
Chapter III: Machine Tool Industry and Sensor Technology
most of the firms in India have graduated from non-CNC to CNC segment and still continue to
produce the same. The progressive abolition of barriers to entry has led to emergence of techno-
entrepreneurs setting up SMEs with proactive approach adopting modern business practices.
They have been comparatively more successful and gaining market shares. These firms are
trying to build capability in the standardized CNC machine tools in line with the practices
adopted by China, Japan, Taiwan or Korea. A notable feature, which is evolving is the efforts
towards building networks. However for sustained development the industry needs to build
technological capabilities through higher emphasis on product and process R&D, new skills,
fresh investments, system integration component of machine tool building, higher networking
and integration with the global market. These could be achieved through combined and
coordinated efforts of both the industry and the government.
Sensor technology is applicable in a very broad domain including the environment, medicine,
commerce and industry. Worldwide the governments and policy makers are realizing the
potential benefits of encouraging the growth in sensor technology. The sensor’s input signals
(stimuli) may have almost any conceivable physical or chemical nature (e.g., light flux,
temperature, pressure, vibration, displacement, position, velocity, ion concentration, etc.). The
sensor’s design may be of a general purpose. A special packaging and housing should be built to
adapt it for a particular application. Some sensors are specifically designed to be very selective in
a particular range of input stimulus and be quite immune to signals outside of the desirable
limits. Sensor is always a part of some kind of a data acquisition system. Often, such a system
may be a part of a larger control system that includes various feedback mechanisms. A load cell
converts a force into electrical signal. Load cells are used in several types of measuring
instruments. In this study piezoelectric load cells were used to measure human performances. An
extensive literature review under the heading “related researches” is presented in the next chapter
(Chapter IV).


