
Chapter 2 – Literature Review: Soil Moisture Measurement Page 2-1
CCHHAAPPTTEERR TTWWOO
2. LITERATURE REVIEW: SOIL MOISTUREMEASUREMENT
Monitoring of volumetric soil moisture content in the field calls for a fast
and accurate method, which allows repeated measurements through time. There
are currently two approaches for measuring the spatial distribution and temporal
variation of soil moisture content: (i) point measurements; and (ii ) remote sensing.
This chapter reviews these techniques. However, the reader is reminded that this
chapter is a review of the current measurement techniques and their inference for
soil moisture content, and that not all of these techniques will be used in the
subsequent chapters. The remote sensing interpretation techniques that will be
used in later chapters are the Integral Equation Model (section 2.4.5.2.2) and the
Modified Integral Equation Model (section 2.4.5.3). The intention of this chapter
is to give an overview of soil moisture measurement methodologies, and to
highlight the essential characteristics of the point measurement and remote
sensing measurement techniques, in relation to estimating the spatial and temporal
variation of soil moisture profiles. This allows the development of a soil moisture
profile estimation algorithm in later chapters, which will be applicable to the soil
moisture measurements available. The review of soil moisture profile estimation
techniques is provided in Chapter 3.
2.1 POINT MEASUREMENT OF SOIL MOISTUREPROFILES
It has long been recognised that reliable, robust and automated methods
for the measurement of soil moisture content can be extremely useful, if not
essential, in hydrologic, environmental and agricultural applications. Over the last
70 years, this recognition has fostered the investment of a considerable amount of
ingenuity in developing such methods. The following sections review these
methods.

Chapter 2 – Literature Review: Soil Moisture Measurement Page 2-2
2.1.1 THERMOGRAVIMETRIC METHOD
The standard method of measuring the volumetric moisture content of a
soil sample is the thermogravimetric method (AS 1289.2.1.1-1992), which
consists of oven drying at 105°C and relating the change in mass to the volume of
the sample.
w
b
d
w
W
W
ρρ
θ = (2.1)
where θ is the volumetric soil moisture content fraction, Ww is the weight of water
contained in the voids of the moist soil , Wd is the weight of dry soil , ρb is the soil
bulk density (from collecting a known volume of soil ), and ρw is the density of
water.
The advantages of this method are that it is inexpensive and soil moisture
is easily calculated. However, it is time consuming, diff icult to obtain
representative samples and destructive. Hence, this method cannot be used for
repetiti ve measurements at exactly the same location (Roth et al., 1990).
This method is prone to large errors due to sampling, transporting,
handling and repeated weighing. In addition, soils with organic matter may
exhibit a mass loss during oven drying due to oxidation and decomposition of the
organic matter, while some clays will retain appreciable amounts of adsorbed
water. Measurement errors may be reduced by increasing the size and number of
samples (Zegelin, 1996).
2.1.2 NEUTRON SCATTERING METHOD
The neutron scattering method is an indirect way of determining soil
moisture content. In this method, neutrons with high energy are emitted by a
radioactive source into the soil and are slowed down by elastic colli sions with
nuclei of atoms. The energy loss is much greater for neutrons colli ding with atoms
of low atomic weight (primarily hydrogen in soils) than for colli sions with heavier
atoms. As a result, hydrogen can slow fast neutrons much more effectively than
any other element present in the soil , thus giving a relationship with soil moisture
Chapter 2 – Literature Review: Soil Moisture Measurement Page 2-3
content. The number of slow neutrons returning to the detector per unit time are
counted, and the soil moisture content estimated from a previously determined
calibration curve of counts versus volumetric moisture content (Wilson, 1971;
Schmugge et al., 1980; Zegelin, 1996). The sphere of influence or effective
volume of measurement varies from a radius of less than 10 cm in a wet soil to 25
cm or more in a dry soil (Zegelin, 1996).
Calibration of the Neutron Moisture Meter (NMM) depends on the
strength of the radioactive source, the nature of the detector, the geometry of the
source and the detector in the probe (McCauley and Stone, 1972), the materials
used to construct the probe, the size and composition of the access tube, and the
physical and chemical properties of the soil (Wilson, 1971). Therefore, if an
accurate moisture content determination is desired, the probe should be calibrated
for each soil type (Wilson, 1971; Schmugge et al., 1980; Zegelin, 1996).
However, field calibration of the neutron probe is extremely diff icult (Grimaldi et
al., 1994; Grismer et al., 1995). Furthermore, electrical equipment can drift,
requiring standards for periodic re-calibration (Schmugge et al., 1980; Zegelin,
1996).
The advantages of this system are that average moisture contents can be
determined with depth, measurements are insensitive to temperature, it can
accommodate automatic reading, and temporal soil moisture content changes can
be monitored at the same site. Apart from calibration, the major disadvantages are
a poor depth resolution, limited measurements of soil moisture content near the
soil surface, and the potential health risks from exposure to radioactive materials
(Schmugge et al., 1980; Zegelin, 1996).
2.1.3 GAMMA RAY ATTENUATION METHOD
The gamma ray attenuation method is a radiation technique that can be
used to determine soil moisture content within a 1 to 2 cm soil l ayer. This method
assumes that scattering and absorption of gamma rays are related to the density of
the matter in their path and that the bulk density of soil remains relatively constant
as the wet density changes with moisture content. Changes in wet density are
measured by the gamma ray attenuation method and the soil moisture content

Chapter 2 – Literature Review: Soil Moisture Measurement Page 2-4
determined from this density change (Wilson, 1971; Schmugge et al., 1980;
Zegelin, 1996).
The advantages of this system are that it is non-destructive and that data
can be obtained over very small vertical distances. Its disadvantages are that it is
costly and diff icult to use, and that extreme care must be taken to ensure that the
radioactive source is not a health hazard (Schmugge et al., 1980). Gamma ray
scanners are generally only used in laboratory situations due to the cumbersome
nature of the equipment (Zegelin, 1996).
2.1.4 SOIL ELECTRICAL CONDUCTIVITY METHOD
Soil electrical conductivity is a function of the volumetric soil moisture
content, electrical conductivity of the soil -water mixture, and contribution of
surface charges to the bulk conductivity. Many techniques for measuring soil
electrical conductivity have been proposed. However, all electrical conductance
measurements, whether direct or indirect, suffer from similar diff iculties, being
that it is not water that conducts electricity, but rather the ions dissolved in the
water (Zegelin, 1996).
2.1.4.1 Electrical Condu ctivity Probes
Electrical conductivity probes consist of both two and four electrode probe
types. A four electrode probe is used to measure soil electrical conductivity in
preference to a two electrode probe, as this eliminates the problem of contact
resistance, by measuring current and voltage between different pairs of electrodes
(Zegelin, 1996).
The principal advantages of the electrical conductivity probe for
measuring soil moisture content are its ease of use, simplicity, low cost of
equipment, and the relatively large volume of soil sampled (Zegelin, 1996).
2.1.4.2 Electrical Resistance Blocks
The direct insertion electrical conductivity probe technique of measuring
electrical conductivity suffers, because of the differing contributions to bulk
conductivity of surface charge and soil pore structure, and their spatial

Chapter 2 – Literature Review: Soil Moisture Measurement Page 2-5
distributions in field soils. To overcome these uncertainties, electrodes have been
embedded in porous materials such as gypsum and fibreglass blocks (Zegelin,
1996).
This indirect technique relies on the equili bration of soil water potential in
the block with that in the surrounding soil . Because of this, natural wetting and
drying cycles give rise to hysteresis in the block response, so that blocks must be
calibrated under both wetting and drying regimes (Zegelin, 1996).
The advantages of resistance blocks lie in their cheapness, their ease of
installation, their relative simplicity of operation, and the fact that many blocks
may be multiplexed from a single bridge (Zegelin, 1996). However, some
resistance blocks have a high failure rate and are sensitive to soil rock content,
resulting in over-estimation of soil moisture content and a need for in-situ
calibration (Amer et al., 1994).
2.1.4.3 Electromagnetic Induction
In the Electromagnetic Induction (EMI) technique, primary and secondary
magnetic fields are imposed in the soil -water mixture through a transmitter coil
placed on the soil surface. The ratio of these two fields at the receiver coil provide
an estimate of the apparent electrical conductivity of the soil (Zegelin, 1996).
The major advantages of EMI are that it does not need to be inserted in the
ground, it is easy and quick to operate, and can provide estimates over large areas
and substantial depths (of order 10 m). A disadvantage of this method is that the
task of isolating the effects from soil moisture content at a particular depth is
diff icult (Zegelin, 1996).
2.1.5 TENSIOMETER METHOD
Tensiometers measure the capill ary tension (energy with which water is
held by the soil ), through a liquid fill ed porous cup connected by a continuous
liquid column to a manometer (Wilson, 1971; Schmugge et al., 1980).
The advantages of this system are that they have relatively low cost, and
can read both water table elevation and soil moisture tension. The disadvantages

Chapter 2 – Literature Review: Soil Moisture Measurement Page 2-6
are that they provide direct measurements of soil moisture tension but only
indirect measurements of soil moisture content, can be easily broken during
installation, and results can only be determined within the 0 to 800 cm water
tension range (Schmugge et al., 1980). In comparison, the permanent wilti ng
point of plants is about 15000 cm (Wilson, 1971).
2.1.6 HYGROMETRIC METHOD
The relationship between moisture content in porous materials and the
relative humidity of the immediate atmosphere is well known. Therefore, several
relatively simple sensors for measuring relative humidity have been designed.
Basically, these sensors can be classified into seven types of hygrometers:
electrical resistance, capacitance, piezoelectric sorption, infra-red absorption and
transmission, dimensionally varying element, dew point, and psychometric.
The advantages of the hygrometric method are simplicity of the apparatus
and low cost. The disadvantages are deterioration of the sensing element through
interactions with the soil components and the special calibration required for each
material that is tested (Schmugge et al., 1980).
2.1.7 SOIL DIELECTRIC METHOD
The dielectric constant (also known as permittivity or specific inductive
capacity) ε, is a measure of how polarisable a material is when subjected to an
electric field (Zegelin, 1996). This material property is usually measured relative
to that of free space, and is referred to as the relative dielectric constant εr.
Soil consists of air, soil particles and water. Therefore the relative
dielectric constant of soil i s a composite of its components (Jackson et al., 1996).
Soil moisture content can be determined from measurements of the soil dielectric
constant, as a result of the large difference between the relative dielectric
properties of liquid water (approximately 80) and dry soil (2 to 5) (Jackson et al.,
1981; Schmugge, 1985; Engman and Chauhan, 1995). Since the dielectric
constant is a volume property, the volumetric fraction of each component is
involved. Thus, as the soil moisture content increases, the relative dielectric
constant can increase to 20 or greater (Schmugge, 1985). Further details regarding

Chapter 2 – Literature Review: Soil Moisture Measurement Page 2-7
the dielectric behaviour of moist soil and the commonly used dielectric mixing
models are given in a subsequent section.
2.1.7.1 Capacitance Probes
When a potential is placed across the plates of a capacitor containing a
dielectric, charges induced by polarisation of the material act to counter the
charges imposed on the plates. Hence, the capacitance between two parallel plates
is a function of the dielectric constant of the dielectric (Zegelin, 1996).
Parallel plate probes have been widely used in laboratory determination of
moisture content of porous materials, but their use in the field is less convenient
because of the problem with plate insertion and soil disturbance. More recent
capacitance probes are split cylindrical electrodes that may be buried in the soil or
positioned at different depths down plastic access tubes embedded in soil
(Zegelin, 1996).
The strengths of the modern probes include: (i) their abilit y to be left in-
situ to log soil moisture content changes; (ii ) the rapidity and ease of
measurements; (iii ) their extreme sensitivity to small changes in soil moisture
content, particularly at dry soil moisture contents; (iv) their precise depth
resolution; and (v) the relative cheapness of the probe. The weaknesses of the
capacitance probe technique include: (i) the fact that there is a relatively small
zone of influence for capacitance probes; (ii ) their sensitivity to the region
immediately adjacent to the probe; and (iii ) their sensitivity to air gaps
surrounding the probes (Zegelin, 1996).
2.1.7.2 Time Domain Reflectometry Probes
In Time Domain Reflectometry (TDR), an electromagnetic wave is
propagated along a wave guide embedded in a material whose dielectric constant
is required. The down and return travel time t of the electromagnetic wave in the
wave guide of length L, depends on the dielectric constant of the material in
contact with the wave guide (D’Urso et al., 1994; Zegelin, 1996). As the dielectric
constant of the material in contact with the wave guide is increased, the speed of
the electromagnetic wave decreases (Soil Moisture Equipment Corp., 1989;

Chapter 2 – Literature Review: Soil Moisture Measurement Page 2-8
Zegelin, 1996). In commercial TDR instruments, the reflections of multiple step
electromagnetic waves due to impedance variations along the wave guide are
sampled and recorded (D’Urso et al., 1994). The analysis of such output allows
for the measurement of travel time through the soil , and estimation of the
propagation speed for the electromagnetic waves through the medium (v = 2L/t).
In turn, assuming that the loss tangent is much less than 1, the average relative
dielectric constant of the soil can then be derived from the velocity. This is
achieved by using v = co/√εr, where co is the velocity of an electromagnetic wave
in a vacuum (≈ 3 × 1010 cm s-1) and εr is the relative dielectric constant (Soil
Moisture Equipment Corp., 1989; D’Urso et al., 1994; Zegelin, 1996).
Two wire probes (wave guides) are mismatched to the coaxial TDR
system, and require a balancing transformer (balun) to be placed between the
probes and the coaxial cable to reduce signal loss. However, the balun itself can
be a source of noise and cause problems in analysing signals from short probes or
probes in conducting soils. To overcome these problems, 3 and 4 wire probes
have been used, which do not require a balun. The diff iculty of insertion and
degree of soil disturbance increases with the number of wires attached to the
probe. The balance between this and signal clarity is reached by the 3 wire probe
(Zegelin, 1996).
Vertically inserted TDR probes provide an average soil moisture content
measurement over the depth of insertion, whilst probes inserted horizontally
provide an average soil moisture content measurement at the plane of insertion. In
addition, surface probes have been used to prevent soil disturbance and to
measure soil moisture content close to the soil surface. However, these probes
have about half the sensitivity to soil moisture content changes to that of insertion
probes (Zegelin, 1996).
The advantages of TDR include: (i) the probes can be installed at any
depth and accommodate automatic reading, allowing easy monitoring of the soil
moisture profile; (ii ) the portabilit y of the technique; (iii ) the approximately
“universal” calibration curve for light textured soils, particularly at high soil
moisture contents; and (iv) the precise depth resolution when horizontally inserted
probes are used. The main disadvantages of the system include: (i) the relatively
Chapter 2 – Literature Review: Soil Moisture Measurement Page 2-9
small zone of influence of TDR probes and their sensitivity to the region
immediately adjacent to the probe wires; (ii ) the sensitivity to air gaps
surrounding the probes; (iii ) attenuation of the signal caused by salinity or highly
conductive heavy clay soils; and (iv) the failure of the “universal” calibration
curve for heavy clay soils and at low moisture contents (Schmugge et al., 1980;
Zegelin, 1996).
2.2 MICROWAVE DIELECTRIC BEHAVIOUR OFMOIST SOIL
Soil i s a mixture of soil particles, air, and both bound and free water
(Ulaby et al., 1986). Microwave techniques for the measurement of soil moisture
content rely on the clear distinction between the dielectric properties of water and
those of the soil particles. The dielectric properties are measured by the dielectric
constant ε, which is a complex number representing the response of a material to
an applied electric field, such as an electromagnetic wave (Schmugge, 1985). This
property consists of both real and imaginary parts by the relationship ε = ε′ + iε″,
and is usually measured relative to that of free space (ie. εr = ε/εo).
The real (in phase) component of ε determines the propagation
characteristics of the electromagnetic wave in the material (ie. its velocity), while
the complex (out of phase) component determines the energy losses or absorption
as the electromagnetic wave travels through the material (Schmugge, 1985;
D’Urso et al., 1994; Engman and Chauhan, 1995; Zegelin, 1996; Bolognani et al.,
1996), and is often referred to as the dielectric loss factor (Zegelin, 1996). The
energy losses are due to vibration and/or rotation of the water molecules
(Wütherich, 1997).
For dry soil particles, the real part of the relative dielectric constant εr′
varies from a value of 2 to 5 (depending on soil bulk density) independent of
frequency (Dobson and Ulaby, 1986a), with an imaginary part εr″ typically less
than 0.05 (Ulaby et al., 1996). In contrast, for free water the relative dielectric
constant at 1 GHz and room temperature is approximately 80 for the real
component and 4 for the imaginary component (Ulaby et al., 1996). It is this large
difference that makes the use of microwave techniques possible for the

Chapter 2 – Literature Review: Soil Moisture Measurement Page 2-10
measurement of soil moisture content, with the addition of water to soil causing
the relative dielectric constant of the mixture to increase to a value of 20 or greater
(Schmugge, 1985). However, li ke other mixtures involving water, the dielectric
constant of the moist soil i s not simply a weighted average of its components. The
mixing model is complex and there are many influencing factors (Jackson and
Schmugge, 1989).
The large value of εr for free water results from the fact that water is a
polar molecule which is free to rotate along the direction of an applied electric
field (Schmugge, 1985; Engman and Chauhan, 1995), allowing alignment of the
water molecules electric dipoles (Engman, 1990). Bound water has a lower
dielectric constant than free water contained in the pore spaces, because its water
molecules are adsorbed to the surfaces of particles and the dipoles are
immobili sed (Jackson and Schmugge, 1989; Njoku and Entekhabi, 1996). Hence,
dielectric mixing models need to account for the contributions to dielectric
constant from both bound and free water. Furthermore, as the dielectric constant
of moist soil i s proportional to the number of water dipoles per unit volume, the
preferred measurement for soil moisture content in the mixing models is
volumetric, rather than gravimetric (Dobson and Ulaby, 1986a).
In addition to total moisture content, the degree of alignment of the water
molecule dipoles (and thus the magnitude of ε) is a function of the observation
frequency, soil temperature, soil texture and soil salinity (Topp et al., 1980;
Schmugge, 1985; Ulaby et al., 1986; Heimovara, 1994). As soil temperature
increases, ε′ decreases because of the decreased dipole alignment resulting from
thermal agitation. Roth et al. (1990) indicate that the most sensitive frequency
range for soil moisture content determination from measurements of soil dielectric
constant, lies between approximately 50 MHz and 10 GHz.
At frequencies below about 50 MHz, soil type has a marked impact on
dielectric constant (Zegelin, 1996). However, in the normal microwave sensing
range (0.4 to 10 GHz), the dielectric constant has relatively weak sensitivity to
soil type. Figure 2.1 shows the relationship between dielectric constant and
volumetric soil moisture content for a variety of soil types at a frequency of
1.4 GHz. The dependence on soil type is due to the different percentages of water

Chapter 2 – Literature Review: Soil Moisture Measurement Page 2-11
bound to the particle surfaces in the different soils (Dobson and Ulaby, 1986a;
Njoku and Entekhabi, 1996) and the soil porosity (Dobson and Ulaby, 1986a). For
soil moisture contents greater than 5% v/v, the soil porosity does not influence ε
as long as the moisture content is expressed on a volumetric basis (Ulaby et al.,
1996).
The effect of salinity on the dielectric constant is to add an ionic
conductivity term for ε″. This produces a large increase in ε″ at low frequencies,
but has littl e effect on ε′ (Schmugge, 1985). Therefore, high soil salinity may
significantly influence the soil dielectric properties. As the imaginary part of the
dielectric constant is related to the electrical conductivity of the soil , it may be
used to study soil salinity (Dalton and van Genuchten, 1986).
Several relationships between soil moisture content and the soil dielectric
constant have been proposed. According to Topp et al. (1980), the volumetric soil
Figure 2.1: Dielectric constant as a function of volumetric soil moisture content for five soil typesat 1.4 GHz and a soil temperature of 23°C. Smooth curves were drawn through measured datapoints (Ulaby et al., 1986).

Chapter 2 – Literature Review: Soil Moisture Measurement Page 2-12
moisture content can be determined simply from the real part of the dielectric
constant by means of an empirical regression equation. This regression equation
was derived from multiple regression analysis of experimental data for
frequencies between 1 MHz and 1 GHz. The main advantage of this relationship
is that it does not require the determination of any soil parameters and does not
require information on the observation frequency or soil temperature. Over this
frequency range, Topp et al. (1980) found the real part of the dielectric constant to
be almost independent of soil density, soil texture, soil salinity and soil
temperature for temperatures between 10°C and 36°C. However, the validity of
this relationship has not been demonstrated for the whole range of possible soil
moisture contents and porosities (Roth et al., 1990).
Wang and Schmugge (1980) have derived a simple empirical model to
describe the observed dielectric constant of soil -water mixtures at frequencies
between 1.4 and 5 GHz. In their model, the dielectric constant of a soil -water
mixture is computed from the known dielectric constants of air, ice, dry soil and
water, and the volume fraction of each constituent in the mixture. The frequency
dependence of this model is imposed through the values given to the dielectric
constant of water. Wang and Schmugge (1980) found that the relationship of
dielectric constant to soil moisture content changed after reaching some transition
moisture content, which varied with soil type. Hence, Wang and Schmugge
(1980) presented two relationships for dielectric constant, depending on whether
the soil moisture content is above or below the transition soil moisture content. An
empirical relationship between the transition soil moisture content and the wilti ng
point moisture content, given as a function of the sand and clay content, was also
presented. The explanation given for this transition in dielectric constant with soil
moisture content is as follows. The first water added to a soil i s tightly bound to
the surface of the soil particles, thus inhibiting the rotational motion of the dipole.
As more water is added, the water molecules are further away from the surface of
the particles and may rotate more freely. Since the surface area in a soil depends
on its particle size distribution, clay soils can hold more of this tightly bound
water than sandy soils (Schmugge, 1985).
Halli kainen et al. (1985) have derived empirical relationships with
separate polynomial expressions for both the real and imaginary parts of the

Chapter 2 – Literature Review: Soil Moisture Measurement Page 2-13
dielectric constant between observation frequencies of 1.4 and 18 GHz. These
polynomial expressions relate the real and imaginary parts of the complex
dielectric constant, to the volumetric soil moisture content and the percentages of
sand and clay, with coefficients that depend on the observation frequency.
Dobson et al. (1985) have presented both theoretical and semi-empirical
dielectric mixing models. The theoretical model apportions the soil -water mixture
into a bound water volume fraction and a free water volume fraction, in
accordance with the pore-size distribution calculated from the particle size
distribution. The mixing model uses a multi -phase formula for a mixture
containing randomly oriented inclusions. The mixture consists of the soil solid as
host material and three types of inclusions (bound water, free water, and air), all
of which are assumed to be disc-shaped and whose size is governed by the
particle-size distribution and total amount of water in the mixture.
The semi-empirical dielectric mixing model of Dobson et al. (1985) gives
the dielectric constant as a function of soil temperature, soil moisture content, soil
texture, and observation frequency, for both the real and imaginary parts of the
dielectric constant. This model is valid for frequencies between 1.4 and 18 GHz.
Dobson et al. (1985) showed their semi-empirical mixing model to yield an
excellent fit to the measured data at frequencies above 4 GHz. At frequencies less
than this, the mixing model does not fully account for the dielectric properties of
bound water at low soil moisture contents. It has also been noted that if the model
is limited to frequencies higher than 4 GHz, the effects of soil salinity may be
ignored (Ulaby et al., 1986).
Peplinski et al. (1995) have extended the semi-empirical dielectric mixing
model of Dobson et al. (1985) to be valid over the whole range of frequencies
between 0.3 and 18 GHz. In this mixing model, a small li near adjustment has been
introduced to correct the expression of Dobson et al. (1985) for the real part of the
relative dielectric constant, at frequencies between 0.3 and 1.3 GHz. For the
imaginary part of the relative dielectric constant, a new equation was proposed for
the effective conductivity σeff at frequencies between 0.3 and 1.3 GHz.
The model of Peplinski et al. (1995) is currently the most commonly used
soil -water-air dielectric mixing model, being a compromise between the

Chapter 2 – Literature Review: Soil Moisture Measurement Page 2-14
complexity of the theoretical model and the simplicity of the empirical models.
Furthermore, this mixing model has the widest validity range in terms of
observation frequency and accounts for the most important factors, including
observation frequency, soil texture and soil temperature. This model is presented
below in terms of the volumetric soil moisture fraction θ, soil bulk density ρb
(g cm-3), soil specific density ρs (≈ 2.66 g cm-3), and an empirically determined
constant υ = 0.65.
( ) υυβυ θεθε
ρρ
ε
1
11
−′+−+=′ ′
fwss
br (2.2a)
[ ]υυβ εθε1
fwr ′′=′′ ′′ (2.2b),
where β′ and β″ are empirically determined soil type constants expressed as a
function of the sand (S) and clay (C) mass fractions by
CS 152.0519.02748.1 −−=′β (2.3a)
CS 166.0603.033797.1 −−=′′β (2.3b).
The quantities ′ε fw and ′′ε fw are the real and imaginary parts of the relative
dielectric constant of free water respectively, given by
( )2 21 w
wwowfw
fτπεε
εε+
−+=′ ∞
∞ (2.4a)
( )( )
( )θρρρ
πεσ
τπεετπ
εs
bs
o
eff
w
wwowfw ff
f −+
+−
=′′ ∞
2 21
22
(2.4b),
where εw∞ = 4.9 is the high frequency limit of ε′ fw, εo is the dielectric constant of
free space (8.854 × 10⁻¹² F.m-1), and f is the observation frequency in Hertz.

Chapter 2 – Literature Review: Soil Moisture Measurement Page 2-15
The relative dielectric constant of the soil solids εs, is given by the
relationship
( ) 062.044.001.1 2 −+= ss ρε (2.5).
For frequencies between 0.3 and 1.3 GHz the real part of the relative
dielectric constant is given by the linear adjustment in (2.6), while for frequencies
between 1.4 and 18 GHz it is given directly by (2.2a).
68.015.1)2.2a(
−′=′ rr εε (2.6),
where ′ ε r( 2.2a) is the real component of the relative dielectric constant from (2.2a).
In evaluating the imaginary part of the relative dielectric constant, the
effective conductivity given in (2.7a) is used for frequencies between 0.3 and
1.3 GHz, while that given in (2.7b) is used for frequencies between 1.4 and
18 GHz.
CSbeff 6614.04111.022049.00467.0 +−+= ρσ (2.7a)
CSbeff 594.125622.2939.1645.1 +−+−= ρσ (2.7b)
The relaxation time for water τw and the static dielectric constant of water
εwo are given as a function of soil temperature T (°C) by (Ulaby et al., 1986)
( )316214
1210
10096.510938.6
10824.3101109.12
TT
TTw
−−
−−
×−×+
×−×=πτ(2.8)
( )35
24
10075.1
102958.64147.0045.88
T
TTTwo
−
−
×+
×+−=ε(2.9).
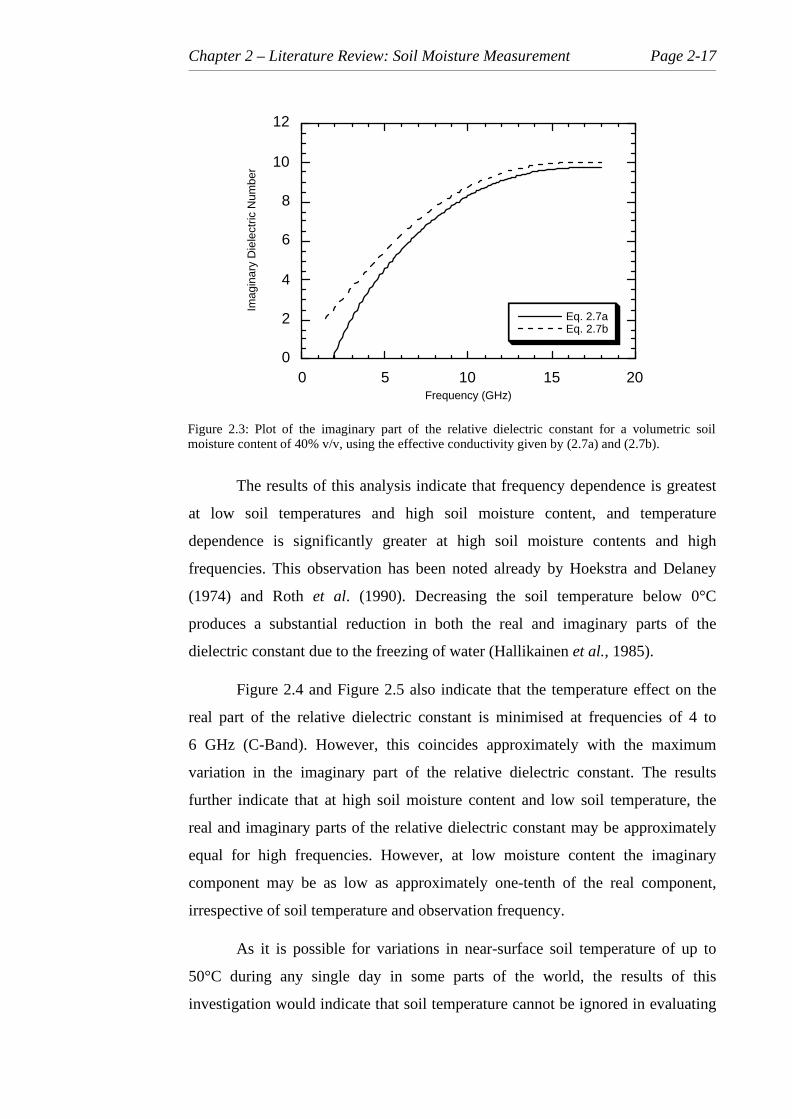
The necessity of using (2.7a) to evaluate the imaginary part of the relative
dielectric constant for frequencies less than 1.3 GHz and (2.7b) for frequencies

Chapter 2 – Literature Review: Soil Moisture Measurement Page 2-16
greater than 1.4 GHz has been investigated as part of this thesis. By evaluating εr″
using both relationships for two soil moisture conditions over the frequency range
of 1.4 to 18 GHz, the sensitivity of estimating the imaginary relative dielectric
constant at frequencies less than 1.3 GHz with (2.7b) is ill ustrated. The results of
this analysis are given in Figure 2.2 for 5% volumetric soil moisture content and
Figure 2.3 for 40% volumetric soil moisture content.
From Figure 2.2 and Figure 2.3, it can be seen that the difference
introduced in evaluation of εr″ by using (2.7a) for frequencies greater than
1.4 GHz is greatest for low frequencies and high soil moisture content, with a
maximum variation in εr″ of 2. It would therefore appear that the relationship for
effective conductivity given in (2.7a) may be used over the range of frequencies
from 0.3 to 18 GHz, given the variation in the data used to derive the relationship.
The above dielectric constant model of Peplinski et al. (1995) was also
evaluated for two soil moisture conditions and four soil temperature states, with
the results given in Figure 2.4 and Figure 2.5. The purpose of this investigation
was to quantify the contribution of the imaginary part of the relative dielectric
constant to the complex dielectric constant, and the sensitivity of the dielectric
model to observation frequency and soil temperature as a function of soil moisture
content.
0
0.1
0.2
0.3
0.4
0.5
0.6
0 5 10 15 20
Eq. 2.7aEq. 2.7b
Imag
inar
y D
iele
ctric
Num
ber
Frequency (GHz)
Figure 2.2: Plot of the imaginary part of the relative dielectric constant for a volumetric soilmoisture content of 5% v/v, using the effective conductivity given by (2.7a) and (2.7b).
Chapter 2 – Literature Review: Soil Moisture Measurement Page 2-17
The results of this analysis indicate that frequency dependence is greatest
at low soil temperatures and high soil moisture content, and temperature
dependence is significantly greater at high soil moisture contents and high
frequencies. This observation has been noted already by Hoekstra and Delaney
(1974) and Roth et al. (1990). Decreasing the soil temperature below 0°C
produces a substantial reduction in both the real and imaginary parts of the
dielectric constant due to the freezing of water (Halli kainen et al., 1985).
Figure 2.4 and Figure 2.5 also indicate that the temperature effect on the
real part of the relative dielectric constant is minimised at frequencies of 4 to
6 GHz (C-Band). However, this coincides approximately with the maximum
variation in the imaginary part of the relative dielectric constant. The results
further indicate that at high soil moisture content and low soil temperature, the
real and imaginary parts of the relative dielectric constant may be approximately
equal for high frequencies. However, at low moisture content the imaginary
component may be as low as approximately one-tenth of the real component,
irrespective of soil temperature and observation frequency.
As it is possible for variations in near-surface soil temperature of up to
50°C during any single day in some parts of the world, the results of this
investigation would indicate that soil temperature cannot be ignored in evaluating
0
2
4
6
8
10
12
0 5 10 15 20
Eq. 2.7aEq. 2.7b
Imag
inar
y D
iele
ctric
Num
ber
Frequency (GHz)
Figure 2.3: Plot of the imaginary part of the relative dielectric constant for a volumetric soilmoisture content of 40% v/v, using the effective conductivity given by (2.7a) and (2.7b).

Chapter 2 – Literature Review: Soil Moisture Measurement Page 2-18
0
5
10
Die
lect
ric N
umbe
r
Frequency (GHz)
L S C X Band
0 oC 10 oC 30 oC 50 oC
RealComponent
ImaginaryComponent
moisture 5%v/v
1
Figure 2.4: Plot of real and imaginary components of the complex relative dielectric constant for asoil at 5% volumetric moisture content, with soil temperatures of 0, 10, 30 and 50°C.
0
30
10
Die
lect
ric N
umbe
r
Frequency (GHz)
L S C X Band
0 oC
10 oC30 oC 50 oC
RealComponent
ImaginaryComponent
moisture 40%v/v
1
Figure 2.5: Plot of real and imaginary components of the complex relative dielectric constant for asoil at 40% volumetric moisture content, with soil temperatures of 0, 10, 30 and 50°C.

Chapter 2 – Literature Review: Soil Moisture Measurement Page 2-19
the soil dielectric constant. It would also appear that observation frequency needs
to be accounted for in evaluating the dielectric constant, and the imaginary
component of the dielectric constant should not be disregarded, as suggested by
some researchers (eg. Chen et al., 1995; Jackson et al., 1996) especially for high
observation frequency and soil moisture content.
2.3 REMOTE SENSING SYSTEMS
This section gives a short review of the remote sensing systems that are
currently available. Firstly, there is a short discussion of the types of platforms
that have been used for carrying the remote sensing instruments, including the
advantages and disadvantages of each. This is followed by a review of the main
types of remote sensing instruments that are used by the various remote sensing
systems, and finally there is a brief review of the most commonly used remote
sensing satellit es.
2.3.1 REMOTE SENSING PLATFORMS
Platforms for supporting remote sensing instruments have varied from
ground-based supports to aircraft and satellit es. Ground-based systems can be
mounted on trucks or on special structures such as rails, which allow limited
movement of the sensor. The main application of these types of platforms is in the
development of new sensor systems and the verification of sensor response with
respect to target characteristics. An example of a truck-mounted sensor is given in
Figure 2.6. The advantage of these systems is the relatively small footprint of the
sensor, allowing for easier control of the conditions under which the
measurements are made (Jackson et al., 1996). However, a major disadvantage of
the ground-based systems is their limitations on coverage of large areas
(Bolognani and Altese, 1994).
This situation is partly overcome by the adoption of aircraft mounted
systems. Aircraft based instruments are especially useful in the mapping of large
areas, and can also serve as prototypes for future satellit e sensors. In most cases
they offer better spatial resolution than satellit e systems as well as more control
over the frequency and timing of coverage (Jackson et al., 1996).

Chapter 2 – Literature Review: Soil Moisture Measurement Page 2-20
Satellit e based remote sensing provides the optimal solution, due to the
capabilit y of monitoring large areas with long term repetiti ve coverage. However,
the length of the repeat cycle (time between satellit e overpasses of the same area
on the ground) can be a criti cal problem in studies involving rapidly changing
conditions, such as soil moisture (Jackson et al., 1996).
2.3.2 SENSOR TYPES
The most commonly used remote sensing instruments in the field of soil
moisture estimation are the Multi -Spectral Scanner (MSS), Thematic Mapper
(TM), thermal infra-red line scanner, microwave radiometer and the Synthetic
Aperture Radar (SAR).
2.3.2.1 Multi-Spectral Scanner
The MSS has a very high radiometric resolution in narrow and
simultaneously recorded wavebands, covering wavelengths in the electromagnetic
spectrum from ultra-violet (0.3 µm) to thermal infra-red wavelengths (14 µm)
(Curran, 1985). MSSs measure the radiance of the earth’s surface along a scan
line, perpendicular to the line of f light, by use of either a rotating mirror (whisk-
broom) or a linear array of detectors (push-broom). The advantage of push-broom
scanners over whisk-broom is that they allow a longer dwell time over which to
Figure 2.6: An example of a ground-based system. The system comprises a "truck"-mountedradiometer, making observations of a sand target area. Data processing equipment is containedwithin the van (Njoku and Kong, 1977).

Chapter 2 – Literature Review: Soil Moisture Measurement Page 2-21
measure the energy from each ground resolution cell . This enables a much
stronger signal to be recorded and a greater range in the levels of signal that can
be sensed. The disadvantages of the push-broom arrangement are that many more
detectors require calibration, and they are not readily available for wavelengths
longer than near infra-red (Lill esand and Kiefer, 1994).
2.3.2.2 Thematic Mapper
The TM is a highly advanced sensor incorporating a number of spectral,
radiometric and geometric design improvements relative to the MSS, covering
wavelengths from blue (0.45 µm) to thermal infra-red (12.5 µm). Unlike the MSS,
the TM uses a bi-directional whisk-broom scanner that employs an increased
number of sensors in comparison to the MSS, allowing for an increase in
resolution. The TM has the added advantage over the MSS in that it measures
spectral radiance over a range of 256 digital numbers rather than 64 (Lill esand and
Kiefer, 1994).
2.3.2.3 Thermal Infra-Red L inescanner
Thermal infra-red line scanners are a particular type of whisk-broom MSS
whose detector only senses in the thermal portion of the spectrum. These sensors
usually collect data in two different wavebands, defined by the two atmospheric
windows with least atmospheric attenuation, located between the wavelengths of
3 and 5 µm and between 8 and 14 µm (Lill esand and Kiefer, 1994). Thermal
infra-red line scanners are now commonly part of the MSS mentioned above
(Curran, 1985).
2.3.2.4 Microwave Radiometer
Passive microwave remote sensors are radiometers that measure the
thermal emission from the ground at microwave wavelengths. These radiometers
are similar to thermal scanners, but have antennas rather than photon detectors,
and scan a scene by having a multiple antenna array. As radiometers measure a
very weak signal, measurement of the thermal emission requires very sensitive
instruments. These sensors consist of a large antenna, and a very sensitive radio
receiver, in order to collect enough energy to yield a detectable signal. The effect

Chapter 2 – Literature Review: Soil Moisture Measurement Page 2-22
of having a large antenna is to have a large beam width, and hence poor spatial
resolution (Lill esand and Kiefer, 1994). Calibration of microwave radiometers is
generally made in-flight over large bodies of water (Wang et al., 1987).
2.3.2.5 Synthetic Aperture Radar
Active microwave remote sensors are known as radars, from the acronym
for RAdio Detection And Ranging. A typical radar sensor consists of a transmitter
and an antenna. The transmitter produces pulses of electromagnetic energy at
microwave wavelengths, which are timed by a synchroniser and standardised to a
known power by a modulator. For a fraction of a second the transmit/receive
switch is switched to transmit, as the transmitter releases a microwave pulse from
the antenna. The transmit/receive switch then returns to its original position and
the antenna receives echoes corresponding to backscattering by objects located on
the transmitted wave path (Curran, 1985; Barbier, 1996). The information that can
be extracted from these echoes is two-fold. Firstly, the distance from the target to
the radar can be determined by measuring the time delay between pulse
transmission and reception of the corresponding echo. Secondly, the relative
intensity of the echo provides a measure of the target reflectivity and is known as
the backscattering coefficient σo (Barbier, 1996). The backscattering coeff icient,
usually in decibels (dB), is evaluated from the ratio of the backscattered power to
the emitted power (Fung, 1994).
The spatial resolution of radar data is controlled by the pulse length and
the antenna beam width, which is governed by the length of the antenna. Thus, by
increasing the length of the antenna, radar data with a finer resolution may be
obtained. Due to the physical constraints in having an antenna of suff icient length
to produce the desired resolution (10 m resolution requires a 4 km long antenna),
the antenna length is simulated by appropriate processing of a large number of
return signals along the flight trajectory. This process of synthesising a long
antenna is known as SAR (Barbier, 1996).
Electromagnetic waves may be either horizontally (h) or vertically (v)
polarised, with h polarised waves having an electric field parallel to the soil
surface and v polarised waves having an electric field perpendicular to the soil

Chapter 2 – Literature Review: Soil Moisture Measurement Page 2-23
surface (Schmugge et al., 1980). If an incident electromagnetic wave is h
polarised, the energy backscattered towards the radar will , in general, consist of an
electromagnetic wave that is also h polarised, as well as an electromagnetic wave
that is v polarised. The latter is referred to as cross-polarised. Radars are capable
of measuring the backscattering response for various polarisation configurations.
A polarimetric radar is capable of measuring the radar response for vv, hh, hv, and
vh, where the first letter denotes the polarisation of the transmit antenna and the
second letter denotes the polarisation of the receive antenna. Because of the
reciprocity property of radar scattering, the responses for hv and vh are identical
(Ulaby et al., 1996).
SAR can provide a unique perspective on the spatial and temporal
variation in soil moisture content both at a relatively high resolution and at a
global scale, because of its’ characteristically high resolution combined with a
global coverage. Furthermore, the increased number of SAR systems has made
SAR data more readily available (Dubois and van Zyl, 1994).
2.3.3 REMOTE SENSING SATELLITES
Although numerous remote sensing systems are in existence and have
been used for measurement of soil moisture content, only the most appropriate
satellit e systems for soil moisture measurement are discussed below.
In the case of passive microwave systems, there are no appropriate satellit e
systems currently available for soil moisture measurement. Hence, all l arge area
research has utili sed aircraft sensors. In recent years NASA has supported two
airborne L-Band radiometers, the Push-Broom Microwave Radiometer (PBMR)
and the Electronically Scanned Thinned Array Radiometer (ESTAR). The
ESTAR instrument doubles the number of footprints to eight, which makes it a
more efficient mapping instrument. It is also a prototype for a new synthetic
aperture antenna technology that can potentially solve the high altitude spatial
resolution problem. There are three planned multiple wavelength satellit e systems
that will i nclude C-Band microwave radiometers: the Multi -frequency Imaging
Microwave Radiometer (MIMR), the Advanced Microwave Scanning
Radiometer (AMSR), and the Russian system PRIRODA (Jackson et al., 1996).

Chapter 2 – Literature Review: Soil Moisture Measurement Page 2-24
2.3.3.1 Landsat
The United States Landsat 5 (Figure 2.7) was launched in 1984 with a
MSS and TM in a near-polar sun-synchronous orbit of 705 km altitude having a
repeat cycle of 16 days. The MSS has 4 bands, being green, red, near infra-red and
infra-red, with a swath of 185 km and pixel size of 82 m. The TM has 7 bands,
being blue, green, red, near infra-red, near mid infra-red, mid infra-red and
thermal infra-red. The TM has a swath of 185 km and pixel size of 30 m, except
for the thermal infra-red band which is 120 m (Lill esand and Kiefer, 1994).
2.3.3.2 Systeme Pour l’Observation de la Terre
The SPOT (Systeme Pour l’Observation de la Terre) satellit es are a
French system developed in conjunction with Sweden and Belgium. SPOT 3
(Figure 2.8) is the current satellit e, and was launched in 1993 into a sun-
synchronous orbit with an altitude of 832 km and repeat cycle of 26 days.
However, due to the possibilit y of varying the satellit e look angle of pointing by
±27° using a mirror, it is possible to have up to 11 repeat images in a 26 day
period. SPOT 3 has two push-broom High Resolution Visible (HRV) sensors that
can operate in both multi -spectral and panchromatic (black and white) modes,
with a swath of 60 km. When operating in the multi -spectral mode it can obtain
data in three bands, being green, red, and infra-red, with a pixel size of 20 m. In
the panchromatic mode, it has a resolution of 10 m. SPOT images also measure
spectral radiance over a range of 256 digital numbers (Lill esand and Kiefer,
1994).
2.3.3.3 European Remote Sensing Satelli te
The European Remote Sensing (ERS-2) satellit e was launched in 1995
and carries on board various advanced instruments for earth observation
(Figure 2.9). Of interest for hydrologic applications is the Active Microwave
Instrument (AMI), which comprises two separate radars: a SAR and a wind
scatterometer. The AMI-SAR instrument operates at C-Band (5.3 GHz) with a vv
polarisation. In SAR image mode it provides high resolution two-dimensional
images with a spatial resolution of 26 m in range and between 6 and 30 m in

Chapter 2 – Literature Review: Soil Moisture Measurement Page 2-25
Figure 2.7: Landsat 5 satellit e configuration (Lill esand and Kiefer, 1994).
Figure 2.8: SPOT 3 satellit e configuration (Lill esand and Kiefer, 1994).

Chapter 2 – Literature Review: Soil Moisture Measurement Page 2-26
Figure 2.9: ERS-2 satellit e configuration (Bolognani and Altese, 1994).
Figure 2.10: JERS-1 satellit e configuration (Bolognani and Altese, 1994).

Chapter 2 – Literature Review: Soil Moisture Measurement Page 2-27
azimuth. ERS precision radar images are 3 look images corrected for the in-flight
SAR antenna pattern and compensated for range spreading loss with a pixel size
of 12.5 m × 12.5 m (D’Urso et al., 1994). The satellit e has a swath of 100 km to
the right side of the satellit e track. The mid swath incidence angle of the system in
normal operation mode is 23°. The ERS satellit e has a sun-synchronous orbit of
785 km with a repeat cycle of 35 days repeat cycle, and also has an infra-red
radiometer on board (Bolognani and Altese, 1994; Lill esand and Kiefer, 1994; Su
et al., 1995).
2.3.3.4 Japanese Earth Resources Satelli te
The Japanese Earth Resources Satellit e (JERS-1) was launched in
February 1992 and carries on board a 1.2 GHz (L-Band) SAR instrument with hh
polarisation (Figure 2.10). The spatial and temporal resolutions of this sun-
synchronous polar orbiting satellit e at 568 km altitude are comparable with the
ERS-2 satellit e, having a swath width of 75 km, pixel size of 18 m and repeat
cycle of 44 days. The mid swath incidence angle of this system in normal
operation is 35°. JERS-1 also has an optical sensor that operates in 5 bands,
consisting of 2 visible and 3 near infra-red bands (Lill esand and Kiefer, 1994).
2.3.3.5 RADARSAT
The Canadian RADAR SATellit e (RADARSAT) was launched in 1995
with a C-Band hh polarisation SAR instrument (Figure 2.11). The RADARSAT
SAR has the unique abilit y to shape and steer its radar beam to image swaths from
35 km to 500 km, with resolutions from 10 m to 100 m respectively. Incidence
angles can also be varied from less than 20° to more than 50°. RADARSAT is in a
sun-synchronous polar orbit at an altitude of 798 km, with a repeat cycle every 6
days using the 500 km swath and every 24 days using the standard 100 km swath
mode (Lill esand and Kiefer, 1994; http://radarsat.space.gc.ca/eng/radarsat/
description.html). RADARSAT also has the abilit y to swing the SAR beam from
the right to the left side (Ahmed et al., 1990).

Chapter 2 – Literature Review: Soil Moisture Measurement Page 2-28
2.4 REMOTE SENSING MEASUREMENT OF NEAR-SURFACE SOIL MOISTURE
While remote sensing can be defined as any non-contact method of
determining information regarding an objects nature, properties or state, in this
thesis it will be defined as the acquisition of digital data, either reflected or
emitted by the earth’s surface, in the visible, thermal or microwave portions of the
electromagnetic spectrum (McVicar and Jupp, 1998).
Numerous researchers have shown that near-surface soil moisture content
can be measured by visible and thermal infra-red remote sensing, as well as active
and passive microwave remote sensing techniques. The main difference between
these four techniques is the wavelength region of the electromagnetic spectrum
that is used by the sensor, and the source of the electromagnetic energy. This
section presents an overview of the current state of near-surface soil moisture
measurement from these four types of remote sensing observations. A summary of
the relative merits of the different remote sensing techniques is provided in
Table 2.1.
Figure 2.11: RADARSAT satellit e configuration (Ahmed et al., 1990).

Chapter 2 – Literature Review: Soil Moisture Measurement Page 2-29
As remote sensors do not measure soil moisture content directly,
mathematical models that relate the measured response of a particular remote
sensing system to the soil moisture content must be derived (de Troch et al.,
1996). Forward modelli ng develops a set of mathematical relationships to
simulate the instrument’s response for a given set of model parameters. In the
context of soil moisture remote sensing, these parameters generally include soil
properties and the geometry and phenology of the overlying vegetation canopy.
To solve the inverse problem, it is crucial to choose a forward modelli ng
procedure that adequately describes the observations. It is also important to know
how many model parameters should be used to depict the subjects being
measured, and which parameters are most sensitive to the returned signal (Su et
al., 1995).
An alternative approach to that of f inding an exact relationship between
remote sensing observations and near-surface soil moisture content for active
microwave observations is through change detection (Engman, 1990; Kite and
Pietroniro, 1996). The change detection method minimises the impact of target
variables such as soil texture, surface roughness, and vegetation, because these
tend to change slowly, if at all , with time (Engman and Chauhan, 1995). Thus, it
is assumed that the only change in the target is from a change in soil moisture
content (Engman, 1990). This approach for measuring the near-surface soil
moisture content is not reviewed in this thesis.
Table 2.1: Summary of remote sensing techniques for measurement of near-surface soil moisturecontent (Schmugge et al., 1979 and Engman, 1991).
Property Observed Advantages Limitations Noise Sources
Visible Soil AlbedoIndex of refraction
Lots of data Many noisesources
Numerous
ThermalInfra-Red
Surface temperature High resolutionLarge swathCoverage frequencyPhysics wellunderstood
Cloud coverlimits frequencyof coverage
MeteorologicalconditionsTopographyVegetation cover
ActiveMicrowave
Backscatter coefficientDielectric properties
Low atmospheric noiseHigh resolution
Limited swathwidthCalibration ofSAR
RoughnessSurface slopeVegetation cover
PassiveMicrowave
Brightness temperatureDielectric propertiesSoil temperature
Low atmospheric noiseModerate vegetationpenetration
Low ResolutionMan maderadiation limitsoperating range
RoughnessVegetation coverTemperature

Chapter 2 – Literature Review: Soil Moisture Measurement Page 2-30
Due to the limitations of measuring near-surface soil moisture content with
remote sensing in the visible region of the electromagnetic spectrum, only a very
brief overview is given. Discussion is concentrated on near-surface soil moisture
measurement from passive and active microwave remote sensing, with detailed
explanation of the interpretation algorithms currently proposed.
2.4.1 VISIBLE REMOTE SENSING
Remote sensing of near-surface soil moisture content using the visible
region of the electromagnetic spectrum measures the reflected radiation of the sun
from the earth’s surface, known as albedo (Sadeghi et al., 1984), and uses
wavelengths between 0.4 and 0.8 µm. Soil albedo is defined as the ratio of
reflected to incoming radiation (Idso et al., 1975), and has long been recognised
as having a dependence upon the moisture status of the soil surface (Ångström,
1925). The effect of increasing soil moisture content is to reduce the albedo by a
factor of about 2 for all soils except sands (Jackson et al., 1976). However, this
provides only a poor indication of soil moisture content, since soil reflectance is
also influenced by organic matter, soil texture, surface roughness, angle of
incidence, plant cover and colour (Engman, 1991; de Troch et al., 1996), causing
a wide variation in albedo of different soil types even when dry (Sadeghi et al.,
1984). These complicating factors, plus the fact that reflected solar energy
responds to only the top few millimetres of the soil profile (Idso et al., 1975),
limit the utility of solar reflectance measurements for soil moisture content
determination, and thus will not be further discussed in this thesis.
2.4.2 THERMAL INFRA-RED REMOTE SENSING
Thermal infra-red remote sensing operates in a slightly longer wavelength
region of the electromagnetic spectrum (3 to 14 µm) than visible remote sensing,
and measures the thermal emission of the earth (Curran, 1985).
Methods for inferring near-surface soil moisture content using thermal
infra-red remote sensors rely upon using the thermal infra-red data to measure the
soil surface temperature, as soil moisture influences the thermal properties of the
soil . The diff iculty with this is that radiation emitted from the soil surface and

Chapter 2 – Literature Review: Soil Moisture Measurement Page 2-31
measured by the remote sensor depends both on surface temperature and
emissivity, after correction for atmospheric effects. Therefore, measurement of the
soil surface temperature requires either measuring, or making an assumption
about, the soil surface emissivity (Ottlé and Vidal-Madjar, 1994).
As soil moisture content has a strong influence on the thermal properties
(heat capacity, thermal conductivity and latent heat of vaporisation of water) of
the earth’s surface, relatively minor changes in moisture content have a large
effect on the bulk thermal properties of the ground (Ellyett and Pratt, 1975). Thus,
areas having higher soil moisture content are cooler during the day and warmer at
night (van de Griend and Engman, 1985).
The amplitude of the diurnal range of soil surface temperature is a function
of both internal and external factors. The internal factors are the soil thermal
conductivity λ and the soil heat capacity CT, where P = √(λCT) defines what is
known as the soil thermal inertia. The external factors are primarily
meteorological: solar radiation, air temperature, relative humidity, cloudiness and
wind. The combined effect of these external factors is what drives the diurnal
variation of soil surface temperature, while the thermal inertia is an indication of
the soil ’s resistance to these driving forces (Schmugge et al., 1980). To accentuate
the difference in thermal properties of moist and dry areas, data is ideally
collected around midday (Pickerill and Malthus, 1998).
In addition to one time of day thermal infra-red observations for inferring
soil moisture content, day-night temperature differences may be used. The
difference between day and night surface temperature is a function of the thermal
inertia of the system, which is controlled by the amount of water in the soil . For a
given soil i n a wet phase, the diurnal temperature range will be smaller than for
dry soils, with everything else being equal (McVicar and Jupp, 1998). The
amplitude of the diurnal range of soil surface temperature has been found to have
a good correlation with the soil moisture content in the 0 to 2 and 0 to 4 cm layers
of the soil (Schmugge et al., 1980).
The effectiveness of thermal infra-red measurements is limited by cloud
cover, vegetation and meteorological factors (Engman, 1990; de Troch et al.,
1996), with measurements being severely hampered by the presence of even slight

Chapter 2 – Literature Review: Soil Moisture Measurement Page 2-32
amounts of vegetation (Sadeghi et al., 1984). If the vegetation cover consists of
brush or trees, and obscures more than about 10 to 20% of the soil surface, then
the resulting image produced by the remote sensor may have no relation to the
radiation temperature of the earth’s surface below. If the vegetation cover is
predominantly low grass, then the resulting image is closely related to the earth’s
surface temperature (Ellyett and Pratt, 1975).
For densely vegetated soils, the plant canopy temperature difference with
the surrounding air yields information about the soil moisture status (van de
Griend and Engman, 1985). However, the use of thermally emitted radiation over
dense vegetation to deduce substrate moisture is complex, due to the soil -
vegetation-atmosphere interaction. Furthermore, leaf temperature does not rise
very far above air temperature until very low soil moisture contents are reached,
because the plant makes use of the available water in the root zone (Wüthrich,
1997). However, thermal infra-red observations may be used to give an indication
of plant moisture stress through rising leaf temperatures (McVicar and Jupp,
1998). Because of the complicating factors from vegetation, inference of soil
moisture content from thermal infra-red imagery is usually performed in
conjunction with imagery from the visible wave bands, in order to give some
measure of the vegetation cover. Several of the approaches that have been used to
infer near-surface soil moisture content from thermal infra-red remote sensing are
described below.
Jordon and Shih (1993) have investigated the possibilit y of inferring soil
moisture content using thermal infra-red observations alone. In their approach,
they considered bare soil covered with a layer of vegetation. In the case of bare
soil and soil covered with a layer of non-transpiring vegetation, the near-surface
soil moisture content was inferred from the soil thermal inertia, which was
evaluated by inverting a harmonic soil temperature function. For soil covered with
a layer of non-transpiring vegetation, the only difference to that of the approach
described above, was that the vegetation was considered as an insulating layer in
the soil temperature model. In the case of soil with a transpiring vegetation cover,
root-zone soil moisture content was inferred from its relation to vegetation water
stress. By relating surface temperature to evapotranspiration rate, the vegetation

Chapter 2 – Literature Review: Soil Moisture Measurement Page 2-33
water stress was evaluated, using a relationship between evapotranspiration rate,
vapour pressure deficit, vegetation type and vegetation water stress.
Ottlé and Vidal-Madjar (1994) have used a similar approach to infer near-
surface soil moisture content using thermal infra-red observations. In this
instance, the soil moisture content was inferred by inverting a one-dimensional
Soil -Vegetation-Atmosphere-Transfer (SVAT) model using thermal infra-red
observations of surface temperature. The SVAT model used by Ottlé and Vidal-
Madjar (1994) calculated the surface fluxes, surface temperature and near-surface
soil moisture content by solving simultaneously the energy budget equation on the
bare soil surface and that above the canopy. The thermal and hydraulic transfers
were described by three important parameters: thermal inertia, hydraulic
diffusivity and evaporation. Atmospheric data necessary to run the model were
daily variation in incoming radiation, air temperature, humidity and the 2 m wind
speed. The three key vegetation parameters of the SVAT model were the height of
the vegetation, minimum leaf resistance to evaporation and the Leaf Area Index
(LAI).
The spectral properties of leaves, and particularly of chlorophyll , lead to
vegetation having a low reflectance in the visible range and a high reflectance in
the near infra-red range. Therefore a combination of these two reflectances is a
good indicator of vegetation properties. The Normalised Difference Vegetation
Index (NDVI) is determined from the reflectance levels in both the near infra-red
(anir) and a visible (avis) waveband, by the relationship
visnir
visnir
aa
aa
+−
=NDVI (2.10).
The vegetation fractional cover fc can be deduced from the study of yearly
variation of this index using
minmax
min
NDVINDVI
NDVINDVI
−−
=fc (2.11),

Chapter 2 – Literature Review: Soil Moisture Measurement Page 2-34
where NDVImin and NDVImax are the minimum and maximum values observed
during the whole vegetative period.
In the study by Ottlé and Vidal-Madjar (1994) for inferring near-surface
soil moisture content, LAI was estimated by a relationship with fc, and the height
of vegetation was estimated from a relationship with LAI. To invert the SVAT
model for near-surface soil moisture content, the SVAT model was run with
different soil moisture values until the difference between the modelled and
observed surface temperatures was less than 1.5 K.
As surface radiant temperature depends on the soil moisture content and
the distribution of vegetation, Gilli es and Carlson (1995) developed a method for
determining near-surface soil moisture availabilit y (Mo), using a physical
relationship between NDVI and surface radiant temperature. While the surface
radiant temperature was inferred directly from the thermal infra-red observations,
NDVI is determined from the reflectance levels in both the near infra-red and a
visible waveband, by the relationship in (2.10). When NDVI was plotted against
surface radiant temperature, a warm edge was said to exist when the warm side of
the distribution in the scatterplot was both sharply defined and smoothly varying,
as shown in Figure 2.12. This warm edge represented the zero soil moisture
content for varying proportions of vegetation cover. The rounded top to the
distribution was due to maximum reflection from the 100% vegetation cover,
while the relatively wide and flat base of the distribution corresponded to sunlit
bare soil .
Once the 0% and 100% vegetation cover limits were evaluated, and the
0% moisture availabilit y line defined, running simulations in the SVAT model for
varying fc amounts allowed for determination of a relationship between NDVI
and fc. Likewise, simulations in the SVAT model over the theoretical range of soil
moisture availabilit y (0 - 1.0) within the full range of fractional vegetation cover
yielded a relationship for soil moisture availabilit y at any surface radiant
temperature and NDVI, as indicated in Figure 2.12.
A limitation of this method for determining soil moisture availabilit y is
that the truncated vertex of the “triangle” constitutes a zone in which isopleths of
Mo converge. This is due to the fact that most of the soil i s obscured at high fc.

Chapter 2 – Literature Review: Soil Moisture Measurement Page 2-35
Thus, the upper part of the triangle is an area where the errors in the inferred soil
moisture content will be largest. Therefore, Gilli es and Carlson (1995) suggest
that reliable results may be obtained by limiti ng evaluation of Mo to the range of
fractional vegetation cover from 0 to 80%.
2.4.3 MICROWAVE REMOTE SENSING
Microwave remote sensing measures the electromagnetic radiation in the
microwave region of the electromagnetic spectrum, which has wavelengths
between 0.5 and 100 cm. This region is subdivided into bands, which are often
referred to by a lettering system (Table 2.2). However, for remote sensing in the
microwave region, only wavelengths greater than about 5 cm are particularly
effective, as they have fewer problems with the atmosphere and vegetation, sense
a deeper soil l ayer, and maximise soil moisture sensitivity (Schmugge, 1985;
Jackson et al., 1996).
The difference between passive and active microwave remote sensing is
the source of the electromagnetic energy. All matter at temperatures above
absolute zero emits electromagnetic radiation due to the motion of the charged
particles of its atoms and molecules (de Troch et al., 1996). Passive microwave
remote sensing measures this naturally emitted radiation from the earth in the
Figure 2.12: Normalised NDVI versus normalised temperature, with isopleths of near-surface soilmoisture availabilit y overlaid (Gilli es and Carlson, 1995).

Chapter 2 – Literature Review: Soil Moisture Measurement Page 2-36
microwave region of the electromagnetic spectrum. In contrast, active microwave
remote sensing, otherwise known as radar, sends out a pulse of electromagnetic
radiation and measures the amount that is scattered back in the direction of the
sensor (Jackson et al., 1996), defined as the average scattering cross-section per
unit area (de Troch et al., 1996).
The fundamental basis of microwave remote sensing for soil moisture
content is the contrast in dielectric properties of water and dry soil , and the
relationship between the Fresnel reflection coefficient and dielectric constant. By
assuming that the target being observed is a plane surface with surface geometric
variations and volume discontinuities much smaller than the wavelength, only
refraction and absorption of the media need to be considered. Thus, the Fresnel
reflection equations predict the surface reflectivity as a function of the refractive
index (related to the ratio of the dielectric constants of the two media) of the target
and the viewing angle, based on the polarisation of the sensor. For a land surface,
the target consists of the interface between air and soil . Since the dielectric
constant of the air is a known value, the reflectivity provides a measurement of
the dielectric constant of the soil medium (Jackson et al., 1996).
The main advantage of microwave remote sensing over remote sensing in
the visible and infra-red regions, is the effect of atmospheric gases and clouds on
the attenuation of the signal received by the sensor. The attenuation by
atmospheric gases, and in particular clouds, is significant for radiation in the high
frequency (short wavelength) region of the electromagnetic spectrum. However,
the attenuation is negligible for frequencies below 10 GHz (wavelength above
Table 2.2: Microwave band designations (Lill esand and Kiefer, 1994).
Band Designation Wavelength (cm) Frequency (GHz)
Ka 0.75 – 1.10 40.0 – 26.5
K 1.10 – 1.67 26.5 – 18.0
Ku 1.67 – 2.40 18.0 – 12.5
X 2.40 – 3.75 12.5 – 8.0
C 3.75 – 7.50 8.0 – 4.0
S 7.50 – 15.0 4.0 – 2.0
L 15.0 – 30.0 2.0 – 1.0
P 30.0 – 100 1.0 – 0.3

Chapter 2 – Literature Review: Soil Moisture Measurement Page 2-37
3 cm). Clouds of ice particles also have a negligible effect on microwave radiation
due to small particle sizes and the low dielectric constant of ice. The effects of
non-raining clouds on microwave radiation are negligible for frequencies below
about 15 GHz, but the effects of raining clouds are only negligible if frequencies
are below 3 GHz (Schmugge, 1985). The placement of microwaves in the
electromagnetic spectrum is shown in Figure 2.13. By looking at the atmospheric
transmissivity (transmissivity = 1 – attenuation) at the bottom of this figure, the
advantage of microwave wavelengths for remote sensing becomes obvious.
Another unique advantage of microwave remote sensing is that vegetation is
semi-transparent at longer microwave wavelengths (Jackson and Schmugge,
1991). Microwave measurements are also independent of solar ill umination and
can be made at any time of the day (Jackson et al., 1996).
One important difference between active and passive microwave remote
sensing systems is the resolution of the resulting data. Active sensors have the
capabilit y to provide high spatial resolution (on the order of tens of metres) but
are more sensitive to surface roughness, topographic features and vegetation than
passive systems. On the other hand, the passive systems can only provide spatial
resolutions on the order of tens of kilometres and may be as large as 100 km.
Therefore, consideration must be given to how the data will be used. If the soil
moisture data is for meteorological and climate models with a low spatial
Figure 2.13: Schematic representation of the electromagnetic spectrum on a logarithmic scale. Thebottom half of this figure shows atmospheric transmissivity as a function of frequency (Schmugge,1985).

Chapter 2 – Literature Review: Soil Moisture Measurement Page 2-38
resolution, passive systems may be appropriate. However, if the soil moisture data
is for detailed hydrologic process studies and partial area hydrology, the passive
data would appear of littl e use (Engman, 1990; Engman and Chauhan, 1995),
requiring spatial resolutions on the order of 10 m or less (van de Griend and
Engman, 1985). It has also been noted by Ulaby et al. (1978) that it is diff icult to
provide a reliable measurement of soil moisture content from a sensor with a
resolution cell of the size obtained from passive microwave sensors, unless the
terrain is free from lakes and cultural features. A comparison of passive and active
microwave systems is made in Table 2.3.
To account for the low resolution of passive microwave sensors, Kumar
(1999) has recently proposed a technique for relating the large passive microwave
footprint to the small scale variabilit y in soil moisture content through a tree
structure arrangement and a multiple scale Kalman-filtering algorithm. This
technique utili ses a state-space model that relates the soil moisture content with
the underlying soil hydrologic properties by a fractal process.
2.4.4 PASSIVE MICROWAVE REMOTE SENSING
Passive microwave radiometric measurements in the 1 to 10 GHz range
(L- to X-Band) are recognised to be of the greatest utilit y in measuring soil
moisture content. However, L-Band radiation is considered to yield the most
accurate results over the widest range of conditions (Entekhabi et al., 1994), as
roughness and heterogeneity effects and attenuation by the atmosphere and
vegetation are minimised (Galantowicz et al., 1999). Accurate soil moisture
Table 2.3: Comparison of passive and active microwave remote sensing (Engman, 1992).
Characteristic Passive Microwave Active Microwave
Signal to Noise good – very good fair – good
Data Rate low very high
Spatial Resolution 10 – 100 km 10 m
Swath Width wide narrow – moderate
Vegetation Effect moderate – serious moderate
Roughness Effect slight serious
Topographic Effect slight serious
Revisit Time good poor – moderate

Chapter 2 – Literature Review: Soil Moisture Measurement Page 2-39
measurements are limited to regions that have either bare soil or low to moderate
amounts of vegetation cover (Njoku and Entekhabi, 1996).
A microwave radiometer measures the self emitted and/or reflected
radiation from the earth’s surface in the microwave region of the electromagnetic
spectrum, whose intensity is characterised by the brightness temperature Tb, which
is often referred to as the radio-brightness. The amount of energy generated at any
point within the soil volume depends on the soil dielectric properties and the soil
temperature at that point. Hence, the brightness temperature is highly variable
during the course of the day, as the depth of soil which actually contributes to Tb is
quite shallow (Jackson, 1997).
As the energy propagates upward through the soil , it is affected by the
dielectric gradient along the path of propagation. In addition, as the energy crosses
the surface boundary, it is reduced by the effective transmission coefficient
(emissivity), which is determined by the dielectric characteristics of the near-
surface soil (Schmugge et al., 1980). The variation in soil emissivity in the
microwave region is rather weak, with a range from about 0.95 for dry soil
(5% v/v) to 0.6 or less for wet soil (40% v/v) (Schmugge, 1985; Jackson et al.,
1996; Njoku and Entekhabi, 1996). However, for soil at a temperature of 300 K,
this variation in emissivity corresponds to a brightness temperature variation of
90 K, which is much larger than the noise sensitivity threshold of a microwave
radiometer, being typically less than 1 K (Njoku and Entekhabi, 1996).
2.4.4.1 Brightness Temperature Models
Brightness temperature is dependent on both the soil moisture and
temperature profiles of the soil , and is essentially the product of soil temperature
and emissivity at the soil surface through the Rayleigh-Jeans approximation to
Plank’s law (Jackson et al., 1981; Schmugge, 1985). By this relationship, the
value of Tb measured by a radiometer above a surface is given by
( ) atmsoilpskypb TTeTTp
++Γ=τ (2.12),
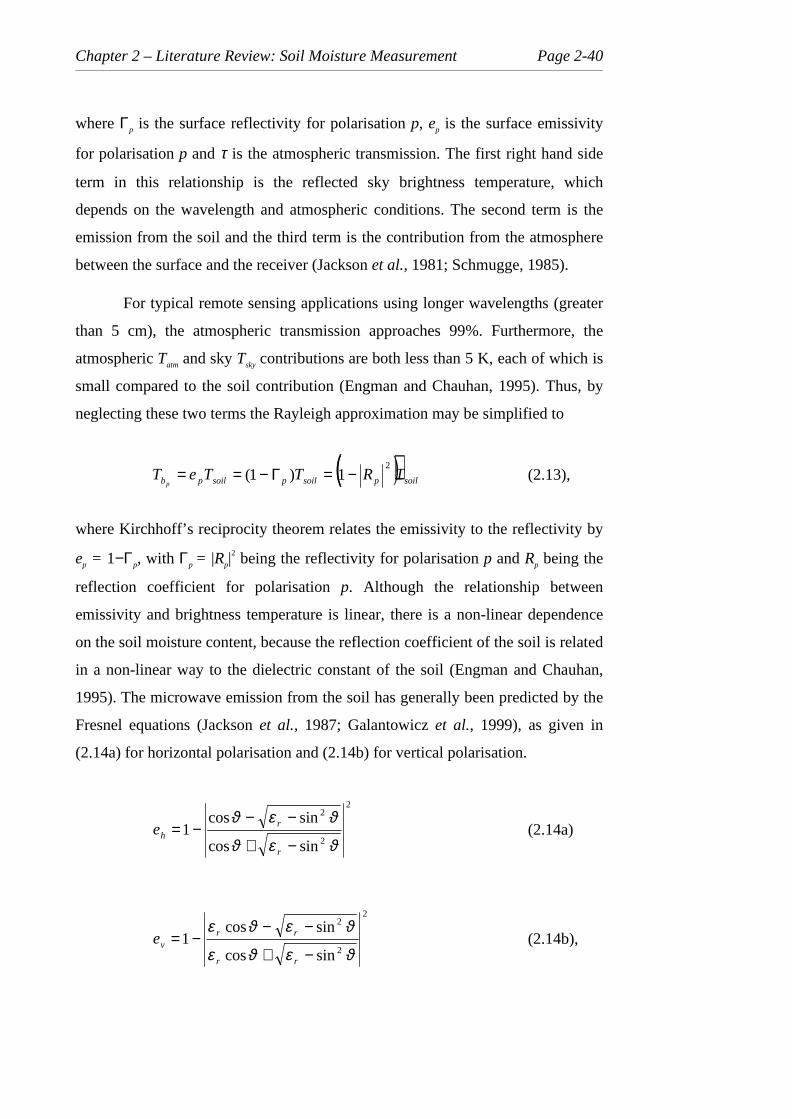
Chapter 2 – Literature Review: Soil Moisture Measurement Page 2-40
where Γp is the surface reflectivity for polarisation p, ep is the surface emissivity
for polarisation p and τ is the atmospheric transmission. The first right hand side
term in this relationship is the reflected sky brightness temperature, which
depends on the wavelength and atmospheric conditions. The second term is the
emission from the soil and the third term is the contribution from the atmosphere
between the surface and the receiver (Jackson et al., 1981; Schmugge, 1985).
For typical remote sensing applications using longer wavelengths (greater
than 5 cm), the atmospheric transmission approaches 99%. Furthermore, the
atmospheric Tatm and sky Tsky contributions are both less than 5 K, each of which is
small compared to the soil contribution (Engman and Chauhan, 1995). Thus, by
neglecting these two terms the Rayleigh approximation may be simpli fied to
( ) soilpsoilpsoilpb TRTTeTp
21)1( −=Γ−== (2.13),
where Kirchhoff’ s reciprocity theorem relates the emissivity to the reflectivity by
ep = 1−Γp, with Γp = |Rp|2 being the reflectivity for polarisation p and Rp being the
reflection coefficient for polarisation p. Although the relationship between
emissivity and brightness temperature is linear, there is a non-linear dependence
on the soil moisture content, because the reflection coefficient of the soil i s related
in a non-linear way to the dielectric constant of the soil (Engman and Chauhan,
1995). The microwave emission from the soil has generally been predicted by the
Fresnel equations (Jackson et al., 1987; Galantowicz et al., 1999), as given in
(2.14a) for horizontal polarisation and (2.14b) for vertical polarisation.
2
2
2
sincos
sincos1
ϑεϑ
ϑεϑ
−+
−−−=
r
rhe (2.14a)
2
2
2
sincos
sincos1
ϑεϑε
ϑεϑε
−+
−−−=
rr
rrve (2.14b),

Chapter 2 – Literature Review: Soil Moisture Measurement Page 2-41
where ϑ is the look angle for the instrument measured from nadir (degrees), and
εr is the relative dielectric constant of the soil .
The majority of brightness temperature models presented in the literature
are based on the simpli fied Rayleigh approximation given in (2.13), and are easily
invertible for soil moisture content. These models consist of two types, being the
emissivity and radiative transfer models, and differ only in their treatment of Tsoil
(Galantowicz et al., 1999).
The emissivity model assumes a grey body approximation by assigning a
constant soil temperature with depth (Galantowicz et al., 1999), which can lead to
errors in regions where the diurnal soil surface temperature variations are large
(Njoku and Kong, 1977). The temperature and moisture contents of soils exhibit
natural variabilit y as a function of depth. Therefore it is not strictly correct to
represent soil brightness temperature and emissivity by such approximations,
especially at longer wavelengths, which may respond to soil moisture and
temperature conditions over depths of several centimetres (Njoku and Entekhabi,
1996).
Current radiative transfer models consist of the conventional radiative
transfer and the gradient radiative transfer, which impose a varying soil
temperature profile. The conventional radiative transfer determines Tsoil by
integrating soil temperature over the soil profile, where each soil l ayers
contribution to Tsoil is a function of a local extinction coefficient and the optical
distance to the soil surface. The gradient radiative transfer model is an
approximation of the conventional radiative transfer model, by taking Tsoil as a
linear function of depth, and the extinction coefficient as a constant (Galantowicz
et al., 1999). In cases where the sub-surface dielectric properties vary rapidly with
respect to wavelength in the medium, radiative transfer models become inaccurate
and the brightness temperature must be modelled using a coherent
electromagnetic wave approach (Njoku and Kong, 1977). A coherent wave
treatment is necessary to interpret the effects of sharp discontinuities in the soil
moisture profile (Njoku and Entekhabi, 1996).
Other approaches for direct modelli ng of the brightness temperature
assume complete knowledge of the soil temperature and moisture profiles, and are
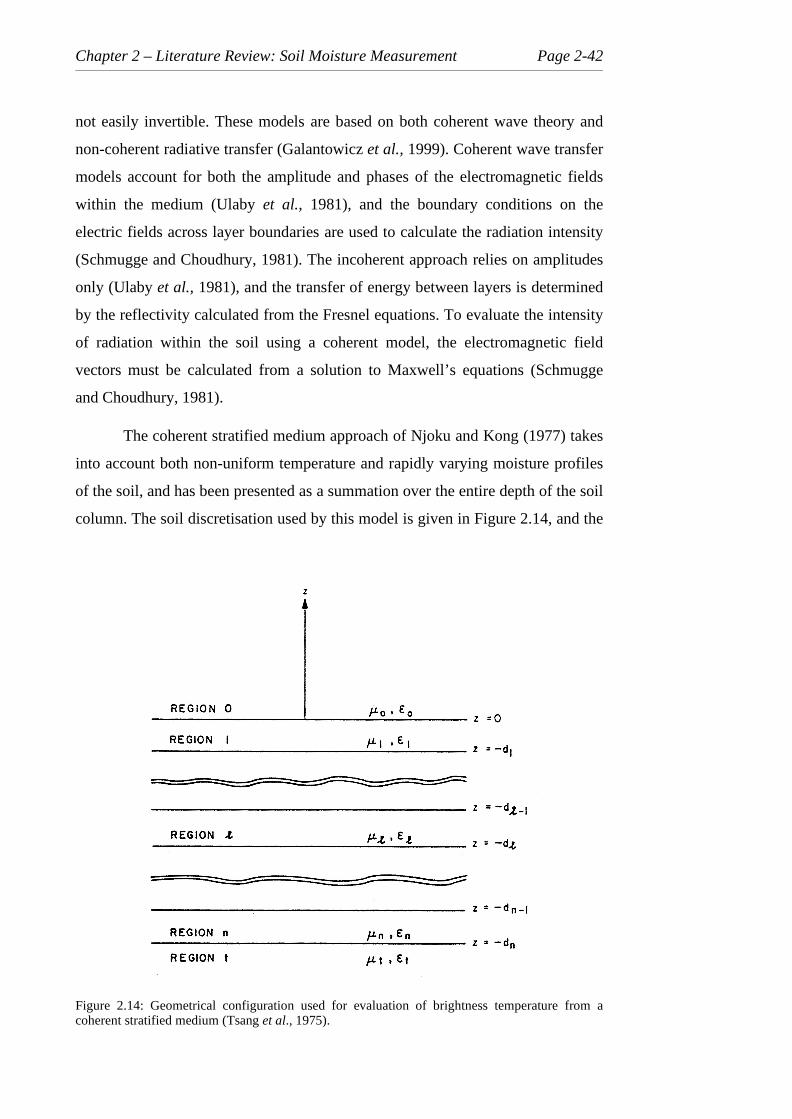
Chapter 2 – Literature Review: Soil Moisture Measurement Page 2-42
not easily invertible. These models are based on both coherent wave theory and
non-coherent radiative transfer (Galantowicz et al., 1999). Coherent wave transfer
models account for both the amplitude and phases of the electromagnetic fields
within the medium (Ulaby et al., 1981), and the boundary conditions on the
electric fields across layer boundaries are used to calculate the radiation intensity
(Schmugge and Choudhury, 1981). The incoherent approach relies on amplitudes
only (Ulaby et al., 1981), and the transfer of energy between layers is determined
by the reflectivity calculated from the Fresnel equations. To evaluate the intensity
of radiation within the soil using a coherent model, the electromagnetic field
vectors must be calculated from a solution to Maxwell ’s equations (Schmugge
and Choudhury, 1981).
The coherent stratified medium approach of Njoku and Kong (1977) takes
into account both non-uniform temperature and rapidly varying moisture profiles
of the soil , and has been presented as a summation over the entire depth of the soil
column. The soil discretisation used by this model is given in Figure 2.14, and the
Figure 2.14: Geometrical configuration used for evaluation of brightness temperature from acoherent stratified medium (Tsang et al., 1975).

Chapter 2 – Literature Review: Soil Moisture Measurement Page 2-43
equations used for evaluating brightness temperature for h and v polarisation are
given in (2.15a) and (2.15b) respectively.
{ }
{ }
{ }
{ }
∑=
−
−
−
−
′′′′−′′
+
î
−′−′
−
+−′−−′
−
−−′′−−′′
−−′′−′′
−
′′
=N
l
zt
nzth
o
tto
llzlzl
lzlllzll
llzlzl
lzlllzll
llzlzl
lzll
llzlzl
lzll
o
ll
ob
k
dkTTk
ddkiki
dikBdikA
ddkiki
dikBdikA
ddkk
dikB
ddkk
dikA
T
kT
h
1
2
1
1
1
2
1
2
2
)2exp(
cos
](2exp[12
)]exp()][exp([
](2exp[12
)]exp()][exp([
)](2exp[12
)exp(
](2exp[12
)exp(
cos
εε
ϑ
εε
ϑ
(2.15a)
( )
{ }
{ }
{ }
{ }
∑=
−
−
−
−
′′′′−+′′
+
î
−′−
×′
−−−′−−
×′
−
+
−
+−′′−−′′
−−′′−′′
−
+′′
=N
l
zt
nztv
to
txztto
llzl
zl
lzlllzll
llzl
zl
lzlllzll
xozl
xozl
llzlzl
lzll
llzl
zl
lzll
xozl
lo
ll
ob
k
dkT
k
Tkkk
ddki
ki
dikDdikC
ddki
ki
dikDdikC
kk
kk
ddkk
dikD
ddkk
dikC
kkk
T
kT
v1
2
2
22
1
1
22
22
1
2
1
2
22
2
2
)2exp()(
cos
](2exp[1
2
)]exp()][exp([
](2exp[1
2
)]exp()][exp([
)](2exp[12
)exp(
](2exp[12
)exp(
cos
ε
εϑ
εε
ϑ
(2.15b)
The subscripts l refer to the quantities in the lth layer of the medium, and
dl is the depth below the surface of the soil to the interface between the lth and
(l +1)th layer. The subscript o refers to the free space values, and the subscript t
refers to the region extending beyond the last layer, while ′ and ″ refer to the real
and imaginary parts of the variable respectively. T is the soil temperature and k is
the wave number given by k = 2π/λ = 2πf√(µε), where f is the frequency, µ is the
magnetic permeabilit y and ε = ε′ + iε″ is the dielectric constant. kx is the x
component of the wave number given by kx = ksinϑ, and kz is the z component
given by kz = kcosϑ, where ϑ is the instrument look angle. The Al, Bl, Cl, Dl, Th
and Tv are wave amplitudes and are related to one another by the propagation
matrices given in Kong (1975), which are reproduced below.

Chapter 2 – Literature Review: Soil Moisture Measurement Page 2-44
( ) ( )( ) ( )
( )( )
−⋅
−−
−−−−⋅
+=
+++++
+++++
+
+
+
−+
++
++
lzll
lzll
lllzlllzllh
lllzllhlllz
lzl
zlldik
l
dik
l
dikB
dikA
ddikddikR
ddikRddik
k
k
eB
eAllz
llz
exp
exp
)(exp)(exp
)(exp)(exp
12
1
1)1(1)1()1(
1)1()1(1)1(
)1(
1
1
1
1)1(
1)1(
µµ
(2.16a)
( ) ( )( ) ( )
( )( )
−⋅
−−
−−−−⋅
+=
+++++
+++++
+
+
+
−+
++
++
lzll
lzll
lllzlllzllv
lllzllvlllz
lzl
zlldik
l
dikl
dikD
dikC
ddikddikR
ddikRddik
k
k
eD
eCllz
llz
exp
exp
)(exp)(exp
)(exp)(exp
12
1
1)1(1)1()1(
1)1()1(1)1(
)1(
1
1
1
1)1(
1)1(
µµ
(2.16b)
+
−
−=
+
+
+
+
+
zll
lzl
zll
lzl
llh
k
k
k
k
R
1
)1(
1
)1(
)1(
1
1
µµµµ
(2.17a)
+
−
−=
+
+
+
+
+
zll
lzl
zll
lzl
llv
k
k
k
k
R
1
)1(
1
)1(
)1(
1
1
εεεε
(2.17b)
+
=
+
+
zll
lzlh
k
kT
1
)1(1
2
µµ
(2.18a)
+
=
+
+
zll
lzlv
k
kT
1
)1(1
2
εε
(2.18b)
A question surrounding the evaluation of stratified models is the layer
thickness and depth of soil that should be used. Raju et al., (1995) found that if
the layer thickness is larger than 0.1 cm in the stratified coherent model of Wilheit

Chapter 2 – Literature Review: Soil Moisture Measurement Page 2-45
(1978), the computed brightness temperature differs significantly to that computed
with very thin layers. Therefore, they suggest that the layer thickness should not
exceed 0.01 cm if the difference in simulated brightness temperature is not to
exceed 1 K. Raju et al. (1995) also found that the soil depth to be used in the
model should be between one-tenth of the wavelength and the wavelength, if the
brightness temperature is not to be affected by more than 1 K.
The stratified coherent model of Wilheit (1978) is simpler than that of
Njoku and Kong (1977) and uses a solution of the Maxwell ’s equations and the
boundary conditions at the interfaces, to calculate the electric field in each layer.
These electric field values are used to calculate the energy fluxes, and thus obtain
the fractional absorption fpl in each layer l. If Tl is the thermodynamic
temperature in the lth layer of the N dielectrically homogeneous layers in the air-
soil system, the layer radiates energy equal to the product of the fractional
absorption and the soil temperature. Applying the Rayleigh-Jeans approximation
to Plank’s law, brightness temperature for polarisation p (Tbp) is written as
skyp
N
llpb TRTfT
lp+= ∑
=2
(2.19a)
p
N
lp ef
l=∑
=2
(2.19b),
where Rp is the reflectivity for the radiation incident on the air-soil i nterface for
polarisation p and Tsky is the brightness temperature equivalent of sky and
atmospheric radiation incident on the soil (Wang et al., 1983).
As detailed information about the soil temperature profile is not generally
available for inversion of brightness temperature measurements for soil moisture
content, Choudhury et al. (1982) have proposed a method for estimating an
effective soil temperature by using only surface and deep soil temperatures.
( )∞∞ −+= TTaTT surfeff (2.20),

Chapter 2 – Literature Review: Soil Moisture Measurement Page 2-46
where Teff is the effective soil temperature, Tsurf is the soil surface temperature, T∞
is the deep soil temperature and a is an empirically determined constant; given as
0.802, 0.667, 0.480, 0.246 and 0.084 for wavelengths of 2.8, 6.0, 11.0, 21.0 and
49.0 cm respectively (Choudhury et al., 1982). Choudhury et al. (1982) suggest
that the surface temperature may be estimated from thermal infra-red
observations, or meteorological data of near-surface air temperature, while the
deep soil temperature can be modelled based on geographic location and season.
The major problem with the above brightness temperature models is that
the passive microwave response of the soil i s affected not only by the soil
moisture and temperature profile variations, but also by the surface roughness,
and vegetation cover (Njoku and Kong, 1977). Various researchers have made
attempts to quantify the effects of surface roughness and vegetation on the
brightness temperature, and have presented models to account for these effects.
However, it has been shown by Wang et al. (1987) that microwave emission is
less affected by surface roughness than by vegetation.
2.4.4.2 Roughn ess Effects
Field measurements made by Newton and Rouse (1980) and Wang et al.
(1983) have indicated that roughening of the soil surface increases soil emissivity
and decreases the sensitivity to soil moisture content, thus reducing the range of Tb
from wet to dry soils (van de Griend and Engman, 1985). This increase in
emissivity can be attributed to the increase in soil surface area that interfaces with
the air, and thus transmits the upwelli ng energy (Schmugge, 1985). Newton et al.
(1983) have noted that the effects of surface roughness decrease as the wavelength
increases.
To account for the effects of surface roughness on soil emissivity,
Choudhury et al. (1979) have presented a modification to the emissivity of a
smooth surface as
( ) ( )[ ]ϑ2cosexp11 hee pRp−−−= (2.21a)

Chapter 2 – Literature Review: Soil Moisture Measurement Page 2-47
2
2 24
≈
o
hλπσ (2.21b),
where h is an effective roughness parameter, σ is the standard deviation of surface
roughness (cm), λo is the free space wavelength (cm), ϑ is the viewing angle
(degrees), and ep and eRp are the smooth and rough surface emissivity respectively
for a given polarisation p. The parameter h has been shown to be loosely
correlated with the standard deviation of the surface heights (2.21b), although no
exact functional relationship has been established. For smoother surfaces such as
stubble, pastures and wheat, a typical value of h is 0.1, and for very rough fields
such as those recently till ed, a value of h equal to 0.5 is typical (Choudhury, et al.,
1979; Wang et al., 1983).
Wang et al. (1983) have proposed a more general variation of (2.21a), by
adding a polarisation mixing factor Q. The rough surface emissivities for
horizontal and vertical polarisations are given as
( )( ) ( )[ ] ( )[ ]ϑhGeQeQe vhRh−−+−−−= exp1111 (2.22a)
( )( ) ( )[ ] ( )[ ]ϑhGeQeQe hvRv−−+−−−= exp1111 (2.22b),
where eh and ev are the smooth surface emissivities for horizontal and vertical
polarisations respectively and h is the effective roughness parameter. Wang et al.
(1983) found that measured and calculated brightness temperatures could not be
matched with G(ϑ) = cos2ϑ, as used by Choudhury et al. (1979), but found
agreement for G(ϑ) ≅ 1.
2.4.4.3 Vegetation Effects
The influence of vegetation on the brightness temperature measured by the
radiometer is the result of absorption and re-emission (Schmugge, 1985; Engman
and Chauhan, 1985), with the effect of reducing measurement sensitivity (van de
Griend and Engman, 1985). This occurs through the vegetation absorbing some of
the radiation coming up from the soil and emitting radiation itself. Hence, for a

Chapter 2 – Literature Review: Soil Moisture Measurement Page 2-48
suff iciently thick layer of vegetation, only the radiation from the vegetation itself
is observed (Schmugge, 1985). The effects from scattering within the vegetation
canopy are most significant at frequencies higher than 5 to 10 GHz (Wigneron et
al., 1998).
Jackson et al. (1982) have shown that absorption by vegetation can be
quantified in terms of the water content of the vegetation, whilst Schmugge et al.
(1988) have demonstrated that dead vegetation can have an attenuating effect on
the microwave emission from soil . It has also been noted (Newton and Rouse,
1980; Jackson et al., 1982; Engman and Chauhan, 1995) that vegetation effects
are a function of the free space wavelength, with vegetation canopies being more
transparent for longer wavelengths than for shorter wavelengths. Newton and
Rouse (1980) suggest that dense vegetation to a height of 125 cm has littl e effect
on the measured emission at 21.4 cm wavelength for incident angles below 35°,
while at 2.8 cm wavelength the soil emission is completely masked. Furthermore,
the effect of vegetation is more significant as the vegetation water content is
increased (Jackson and Schmugge, 1991).
A vegetation canopy absorbs the emission from the soil and adds to the
total radiative flux with its own emission, assuming scattering is negligible. A
model of this process, which treats the problem as a two-layer incoherent medium,
is described by (Ulaby et al., 1986)
( )[ ]( )( ) ( )soilvegpvegvegvegpb TeTeTp
ϒ+−ϒ−ϒ−+= α1111 (2.23),
where ep is the emissivity of the smooth soil surface at polarisation p, α is the
single scattering albedo of the vegetation, ϒveg is the transmissivity of the
vegetation layer, Tveg is the physical temperature of the vegetation (K) and Tsoil is
the physical temperature of the soil (K). At microwave wavelengths the single
scattering albedo term is almost zero, varying between 0.05 and 0.10 (Jackson and
Schmugge, 1991). Chanzy et al. (1997) have shown that the single scattering
albedo can be neglected at C-Band when the amount of vegetation is low. Thus,
by assuming that α equals zero, which may be questionable at wavelengths
shorter than 5 cm (Jackson and Schmugge, 1991), and that the physical

Chapter 2 – Literature Review: Soil Moisture Measurement Page 2-49
temperature of the vegetation and the soil are the same with value Tsurf, Jackson
and Schmugge (1991) have reduced (2.23) to
( )[ ] surfvegpb TeTp
211 ϒ−−= (2.24),
where Tsurf is the surface temperature (K) estimated from thermal infra-red
observations under clear sky conditions or meteorological estimates of the air
temperature under cloudy conditions (Jackson and Schmugge, 1991), and ep is the
emissivity for polarisation p.
The transmissivity of the attenuating vegetation layer has been described
through a relationship with the one-way canopy absorption factor, otherwise
known as optical depth τ, which is dependent on the vegetation dielectric
properties, plant shape and structure, wavelength, polarisation and look angle.
This relationship for vegetation transmissivity is given by
[ ]ϑτ secexp−=ϒveg (2.25),
where ϑ is the observation angle (degrees) measured from nadir.
In order to invert (2.24) for the soil moisture content, an estimate of the
optical depth is required. Various theoretical and empirical relationships have
been proposed for the optical depth (Jackson et al., 1982). A simple theoretical
expression for the vegetation optical depth is (Njoku and Entekhabi, 1996)
ϑεθ
τcos
vegvegAf ′′= (2.26),
where A is a structure parameter related to the geometry of the vegetation, f is the
observation frequency (Hz), θveg is the water content of the vegetation (kg m-2) and
′ ′ ε veg is the imaginary part of the dielectric constant of the vegetation. The
parameter A can be obtained by modelli ng the vegetation as lossy (conducting)
dielectric cylinders or disks in different orientations, but is more commonly
estimated empirically for specific vegetation types (Njoku and Entekhabi, 1996).

Chapter 2 – Literature Review: Soil Moisture Measurement Page 2-50
Alternative relationships for estimating the optical depth have been given as
(Ulaby et al., 1986)
( )vego
vegdε
λπτ Im4
= (2.27),
and (Schmugge et al., 1988)
−
′′′
+′
= 112
42
veg
vegveg
o
vegd
εεε
λπ
τ (2.28),
where dveg is the thickness of the vegetation layer (cm), λo is the free space
wavelength (cm), and Im(εveg) is the imaginary component of the dielectric
constant of the vegetation;
An empirical relationship between optical depth and vegetation water
content has been given as (Shutko, 1986; Jackson and O’Neill , 1990)
bvegθτ = (2.29),
where b is a regression parameter unique to the type of vegetation, the free space
wavelength and polarisation. Jackson (1993) has presented a plot of b for different
wavelengths and vegetation types, as given in Figure 2.15.
An interesting observation of Figure 2.15, excluding the observations for
grass, is the small variation of the parameter b in the L-Band range (wavelength
15 to 30 cm). Based on these results, it would appear that a single value of b equal
to 0.15 is representative of most agricultural crops, with the exception of grasses
(Jackson, 1993).
These relationships for optical depth require an estimate of the vegetation
water content. However, previous research has shown that vegetation water
content can be estimated using existing sensors and algorithms (Jackson and
Schmugge, 1991).

Chapter 2 – Literature Review: Soil Moisture Measurement Page 2-51
For small values of optical depth τ, which occur for low vegetation
density, (2.23) reduces to Tbp= epTsoil , whereas for large τ, which occurs for dense
vegetation, the observed brightness temperature approaches Tbp= Tveg, resulting in
the soil being completely masked by the vegetation (Njoku and Entekhabi, 1996).
2.4.4.4 Combined Roughn ess and Vegetation Effects
As the brightness temperature models presented above only account for
vegetation and roughness effects individually, Jackson (1993) has presented an
algorithm for inferring near-surface soil moisture content that incorporates both
surface roughness and vegetation effects. In the model of Jackson (1993), the
brightness temperature of a vegetated surface is given by (2.24), with the smooth
surface emissivity ep taken as being the rough surface emissivity eRp, as given
by (2.21).
Figure 2.15: Observed values of the effects of vegetation on model parameter b as a function ofwavelength (Jackson, 1993).
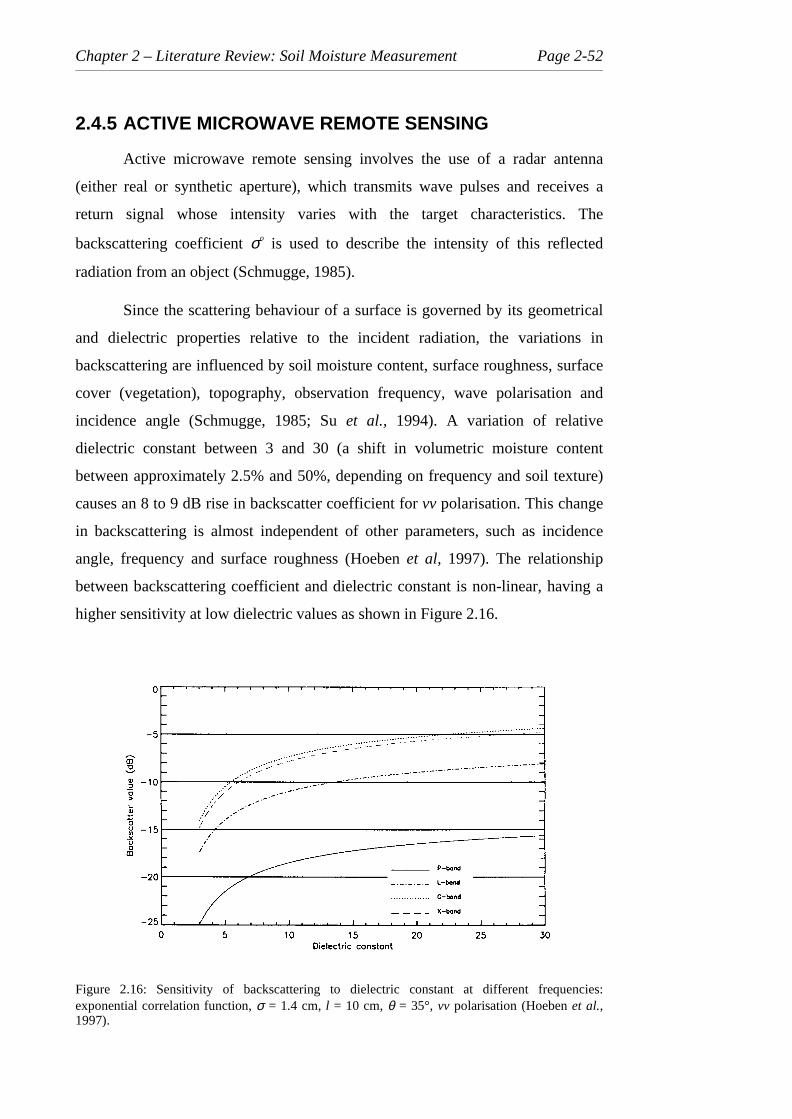
Chapter 2 – Literature Review: Soil Moisture Measurement Page 2-52
2.4.5 ACTIVE MICROWAVE REMOTE SENSING
Active microwave remote sensing involves the use of a radar antenna
(either real or synthetic aperture), which transmits wave pulses and receives a
return signal whose intensity varies with the target characteristics. The
backscattering coeff icient σo is used to describe the intensity of this reflected
radiation from an object (Schmugge, 1985).
Since the scattering behaviour of a surface is governed by its geometrical
and dielectric properties relative to the incident radiation, the variations in
backscattering are influenced by soil moisture content, surface roughness, surface
cover (vegetation), topography, observation frequency, wave polarisation and
incidence angle (Schmugge, 1985; Su et al., 1994). A variation of relative
dielectric constant between 3 and 30 (a shift in volumetric moisture content
between approximately 2.5% and 50%, depending on frequency and soil texture)
causes an 8 to 9 dB rise in backscatter coeff icient for vv polarisation. This change
in backscattering is almost independent of other parameters, such as incidence
angle, frequency and surface roughness (Hoeben et al, 1997). The relationship
between backscattering coeff icient and dielectric constant is non-linear, having a
higher sensitivity at low dielectric values as shown in Figure 2.16.
Figure 2.16: Sensitivity of backscattering to dielectric constant at different frequencies:exponential correlation function, σ = 1.4 cm, l = 10 cm, θ = 35°, vv polarisation (Hoeben et al.,1997).

Chapter 2 – Literature Review: Soil Moisture Measurement Page 2-53
Although surface roughness may not be a serious limitation for passive
microwave sensors, at least for most natural surfaces, it is a major limiti ng factor
for active microwave sensors (Wang et al., 1987; Wütherich, 1997) and simple
correction procedures are difficult to develop (Jackson et al., 1996). In many cases
the effect of roughness may be equal to or greater than the effects of soil moisture
content on the backscatter (Autret et al., 1989; Engman and Chauhan, 1995;
Altese et al., 1996; Wütherich, 1997), and in ploughed fields, the row structure
generated by ploughing presents a periodic pattern that can complicate data
interpretation (Beaudoin et al., 1990; Giacomelli et al., 1995). Furthermore, the
surface roughness of agricultural fields is not likely to remain constant between
overpasses of more than 30 days (Wütherich, 1997) due to reductive till age and
weathering (Beaudoin et al., 1990), or between overpasses on different orbit
tracks, which may have large differences in angle with respect to field direction
(Wütherich, 1997). However, in contrast to agricultural fields, the surface
roughness of natural ecosystems does not change significantly over relatively
short time periods (Sano et al., 1998). The dependence of backscatter intensity on
surface roughness is represented schematically in Figure 2.17, where an increase
of backscattering coeff icient with surface roughness is obvious, as reported in
experimental studies (eg. Beaudoin et al., 1990).
In general, smooth surfaces behave as specular reflectors and only have
strong backscattering at near-zero incidence angles, whereas rough surfaces act as
Figure 2.17: Illustration of the effect of surface roughness on backscattering intensity (Schmugge,1985).

Chapter 2 – Literature Review: Soil Moisture Measurement Page 2-54
diffuse reflectors with minimal angular variation (Schmugge, 1985). Very rough
surfaces are called lambertian reflectors and have no angular variation. As
ill ustrated in Figure 2.18, a surface appears rougher to a shorter wavelength than
to a longer wavelength (Brown et al., 1992). Furthermore, for a given wavelength
the backscattering from rougher soils is less dependent on the value of the
incidence angle (Ulaby et al., 1986).
Several relationships have been proposed for defining the roughness of a
Figure 2.18: Illustration showing the effect of wavelength and surface roughness on thebackscattering properties of a surface (Lill esand and Kiefer, 1994).

Chapter 2 – Literature Review: Soil Moisture Measurement Page 2-55
surface with respect to the wavelength. The Rayleigh criterion states that surfaces
can be considered as “ rough”, and act as diffuse reflectors if the rms (root mean
square) height of the surface variations σ exceeds one-eighth of the wavelength of
sensing divided by the cosine of the local incidence angle (σ > λo/8cosϑ).
Surfaces are considered “smooth” by the Rayleigh criterion, and act as specular
reflectors when σ < λo/8cosϑ.
As the Rayleigh criterion does not consider that there can be a category of
surface variation intermediate between rough and smooth, the Modified Rayleigh
criterion is used to define such situations. This criterion considers rough surfaces
to be those with σ > λo/4.4cosϑ and smooth where σ < λo/25cosϑ. Intermediate
values are considered to have intermediate roughness (Lill esand and Kiefer,
1994). Ulaby et al. (1982) have proposed an alternative relationship for
categorising surfaces as rough or smooth, which is independent of incidence
angle. In this relationship, smooth surfaces are defined as having koσ < 0.2 and
very rough surfaces as having koσ > 1, where ko is the free space wave number
given by ko = 2π/λo.
As with passive microwave remote sensing, the observations made with
active microwave remote sensing are affected by vegetation cover and reduce the
sensitivity of the return signal to soil moisture content (Troch et al., 1999).
However, because of the different source of electromagnetic radiation, the effect
of vegetation on the observed signal is different to that from passive microwave
observations. With active microwave remote sensing, vegetation above a soil
surface absorbs and scatters part of the microwave radiation incident on it, as well
as part of the reflected microwave radiation from the underneath soil surface. The
amount of absorption is primarily due to the water content of the vegetation
(Schmugge, 1985), whilst the scattering is influenced by the vegetation shape and
geometry (van de Griend and Engman, 1985).
Various authors (van de Griend and Engman, 1985; Schmulluis and
Furrer, 1992; Brown et al., 1992; van Zyl, 1993) have noted that the effect of
vegetation on the radar signal can generally be diminished by increasing the
wavelength. Schmulluis and Furrer (1992) have shown that L-Band (1 to 2 GHz)
measurements will still yield good results under various agricultural crops,

Chapter 2 – Literature Review: Soil Moisture Measurement Page 2-56
whereas for X- (8 to 12.5 GHz) and C-Band (4 to 8 GHz), even a thin vegetation
cover may distort the measurement. It has been shown however, that C-Band data
can penetrate the vegetation canopy better when the vegetation is drier (Brown et
al., 1992).
The effect of vegetation is also greatly dependent upon the instrument
angle of incidence and polarisation (Ulaby et al., 1986). Wang et al. (1987) have
shown that the effect of vegetation cover does not play a significant role at low
incidence angles.
Providing the vegetation cover is less than 15 cm, active microwave
remote sensing can measure the volumetric moisture content of the near-surface
soil l ayer with an rms error of 3.5% at low microwave frequencies (Ulaby et al.,
1996). However, grass covered sites often have a large volume of litter on the
surface, which can hold a significant amount of water, masking the relationship
between SAR data and the underlying soil moisture content (Sano et al., 1998).
2.4.5.1 Optimum Satelli te Configuration
Due to the sensitivity of the backscattering coeff icient to surface
roughness and vegetation cover, and the differing effect of various combinations
of frequency and incidence angle, there has been a great deal of discussion in the
literature about an “optimum” configuration for active microwave remote sensing
with satellit es. The recommendations that have been made in literature differ from
one researcher to the next, so a brief review of the recommendations that have
been made is presented below.
Soil moisture measurement using active microwave remote sensing
observations is diff icult due to the competing effects of soil moisture content and
surface roughness. It has been noted by Chen et al. (1995) that the larger the
incidence angle the larger the sensitivity to soil moisture content, but because of
the increasing influence of surface roughness, there must be a compromise. As
frequency is increased the active microwave remote sensor becomes more
sensitive to surface roughness for all soil moisture conditions and sensitivity to
soil moisture content decreases.

Chapter 2 – Literature Review: Soil Moisture Measurement Page 2-57
To minimise the roughness effects that may often dominate the active
microwave remote sensing data in agricultural fields (eg. Koolen et al., 1979;
Beaudoin et al., 1990), Ulaby et al. (1978) have suggested that the optimum
parameters are frequencies from 4 to 5 GHz with hh polarisation having an
incidence angle between 7° and 17° from nadir. This agrees closely with the
recommendation made by Ulaby and Batliva (1976) who suggested that optimum
parameters are a frequency of 4 GHz with hh or vv polarisation having an
incidence angle between 7° and 15° from nadir, for bare fields. However, Altese
et al. (1996) have shown that the effect of σ on backscattering is minimised by a
sensor configuration having an incidence angle of around 20° and observation
frequency between 4.5 and 7.5 GHz. Altese et al. (1996) also found that the effect
of roughness correlation length l on backscattering was less than for σ, with its
effect minimised at an incidence angle around 30° and observation frequency less
than 6 GHz. However, Beaudoin et al. (1990) have shown that a significant effect
on backscattering can be expected from the periodic rows of row crops at all
incidence angles except around 5°, with a maximum effect in the range of 25° to
40°. In addition, Dobson and Ulaby (1986a) have suggested that the orbital sensor
intended for soil moisture sensing should have an orbital inclination greater than
15° from polar orbit in order to minimise the effects of row direction at most
latitudes.
Although roughness effects can be minimised by using a sensor with a low
incidence angle, this configuration of look angle is very unlikely on a spacecraft
system, as the resolution decreases with decreasing incidence angle according to
1/sinϑ (Autret et al., 1989). Therefore, if a low incidence angle is not acceptable,
Autret et al. (1989) suggest that the best configuration for soil moisture
measurement requires the simultaneous use of two polarisations (hh and vv) with
an incidence angle greater than 35°.
To minimise the effect of vegetation on soil moisture sensing, Dobson and
Ulaby (1986a) have concluded that the optimum parameters should be frequencies
of less than 6 GHz and incidence angles of less than 20°. Using these observation
parameters, both direct scattering by the vegetation and the effective attenuation
loss related to the two-way transmission through the canopy are minimised. At

Chapter 2 – Literature Review: Soil Moisture Measurement Page 2-58
higher incidence angles, the backscattering contribution of the canopy increases
and is dominated by the return from vertically aligned stalks and cobs, whereas
leaves dominate the canopy loss component.
It has also been noted that the co-polarised measurements σo
vv and σo
hh, and
their linear combinations, are the best choice for estimation of soil moisture
content, as they are most sensitive to soil moisture changes and least sensitive to
calibration accuracy and vegetation cover (Shi et al., 1997). Furthermore, co-
polarised channels can be calibrated directly with passive targets li ke corner
reflectors, while cross-polarised channel calibration relies upon measurements
made on the co-polarised channels (van Zyl, 1990), and is hence less accurate.
Dubois et al. (1995a) have noted that to achieve a 4% accuracy in soil moisture
content requires a 0.5 dB accuracy of the relative calibration and 2 dB accuracy in
the absolute calibration.
It would therefore appear that by using ERS, which is characterised by an
incidence angle of 23°, vv polarisation and frequency of 5.3 GHz (C-Band), the
roughness and vegetation effects would be minimised. Thus, soil moisture
inversion from ERS data for regions with short vegetation cover (plant biomass
less than 1 kg m-2) appears more profitable than from other radar configurations
(Dobson et al., 1992).
Apart from satellit e configuration, Schmugge (1985) has demonstrated
that microwave backscattering depends more on the state of the water in the soil
than on the actual amount. Thus, by expressing soil moisture as a percentage of
field capacity rather than a volumetric value, Schmugge (1985) suggests that the
effects of soil roughness on backscattering coeff icients can be minimised.
2.4.5.2 Surface Scattering Models
The backscattering response of a surface enables important information to
be determined about that surface, namely soil moisture content. Hence, much
current research is being undertaken in the area for development of surface
scattering models. Given the variations in satellit e configuration and surface
conditions, relationships between backscattering coeff icient and soil moisture
content as a function of incidence angle, wave polarisation, wavelength, and soil

Chapter 2 – Literature Review: Soil Moisture Measurement Page 2-59
dielectric constant are required. Three different modelli ng approaches have been
presented in literature: (i) empirical, (ii ) theoretical and (iii ) semi-empirical.
The scattering coefficient, which is a unit-less quantity representing the
radar cross-section (m2) of a given pixel on the ground per unit physical area of
that pixel (m2), may exhibit a wide dynamic range, and is therefore often
presented in decibels (Ulaby et al., 1996). To convert the backscattering values
obtained to decibels, the following relationship is used.
oodB σσ 10log10= (2.30)
In the presentation of backscattering models in the following sections, the
backscattering coeff icient σo is not in decibel units, unless written as σdBo .
2.4.5.2.1 Empirical Backscattering Models
In order to establish a useful empirical relationship for inversion of soil
moisture from backscattering observations, it is necessary to have a great number
of experimental measurements in order to derive general statistical laws (Oh et al.,
1992). However, empirical backscattering models found in literature are generally
derived from specific data sets and are mostly only valid in certain regions of
roughness, frequency, incidence angle and soil moisture content. Furthermore,
empirical backscattering models may not be applicable for data sets other than
those used in their development (Chen et al., 1995; Dubois et al., 1995b). Oh et
al. (1992) have noted that the main advantage of empirical backscattering models
over theoretical backscattering models is that many natural surfaces do not fall
into the validity regions of the theoretical backscattering models, and even when
they do, the available backscattering models fail to provide results in good
agreement with experimental observations.
Much of the research to date (eg. Prevot et al., 1984; Bernard et al., 1986;
Bruckler et al., 1988; Bruckler and Witono, 1989; Ragab, 1995) has been
undertaken using simple linear regression relationships between backscattering
observations and observed soil moisture content in a given layer of soil .

Chapter 2 – Literature Review: Soil Moisture Measurement Page 2-60
Occasionally a second order regression equation (eg. Bruckler et al., 1988) has
been used. However, the form of the regression relationship commonly used is
baodB += θσ (2.31),
where θ is the volumetric soil moisture, and a and b are empirical regression
coeff icients.
Dobson and Ulaby (1986a) have found that for a given sensor combination
of frequency, wave polarisation and angle of incidence, the empirically derived
regression coeff icients were dependent on soil surface roughness and soil texture,
with a being primarily controlled by surface roughness and b primarily controlled
by soil texture.
Recently, more advanced empirical non-linear regression models for
relating backscattering observations to soil moisture have been presented, such as
Oh’s model (Oh et al., 1992) and the Dubois-van Zyl model (Dubois and van Zyl,
1994; Dubois et al., 1995a,b).
The empirical backscattering model of Oh et al. (1992) is based on L-, C-
and X-Band spectrometer data, with incidence angles varying from 10° to 70°.
The surface roughness and soil moisture content cover the ranges 0.1 < koσ < 6.0,
2.6 < kol < 19.7 and 0.09 < θ < 0.31, where ko is the free space wave number given
by ko = 2π/λo, λo is the free space wavelength (cm), σ is the rms roughness height
(cm), l is the roughness correlation length (cm) and θ is the volumetric soil
moisture content. As backscattering from smooth surfaces include a strong
contribution due to the coherent backscattering component that exists at angles
close to normal incidence, the range of applicabilit y of the backscattering model
does not include the angular range below 20° for smooth surfaces. This
backscattering model is presented as
[ ]hvovv
p
gΓ+Γ= ϑσ
3cos(2.32a)

Chapter 2 – Literature Review: Soil Moisture Measurement Page 2-61
[ ]hvohh pg Γ+Γ= ϑσ 3cos (2.32b)
ovv
ohv qσσ = (2.32c),
where
)exp(2
103
1
σπϑ
okp −
−=
Γ(2.33)
( )[ ]8.1)(65.0exp17.0 σokg −−= (2.34)
[ ])exp(123.0 0 σokq −−Γ= (2.35)
2
2
2
sincos
sincos
ϑεϑ
ϑεϑ
−+
−−=Γ
r
rh (2.36a)
2
2
2
sincos
sincos
ϑεϑε
ϑεϑε
−+
−−=Γ
rr
rrv (2.36b)
2
01
1
r
r
εε
+
−=Γ (2.36c),
and ϑ is the incidence angle (degrees), Γv and Γh are the vertical and horizontal
Fresnel reflectivities, Γ0 is the Fresnel reflectivity at nadir and εr is the dielectric
constant relative to free space.
The empirical backscattering model of Dubois et al. (1995b) was derived
from two data sets, obtained from the LCX POLARSCAT and the RASAM truck-
mounted systems. Equations were derived for both vv and hh polarisation and are

Chapter 2 – Literature Review: Soil Moisture Measurement Page 2-62
valid for frequencies between 1.5 and 11 GHz, surface roughness rms heights
from 0.3 to 3 cm and incidence angles from 30° to 65°. This backscattering model
is presented as
( ) 7.04.1tan028.0
5
5.175.2 sin10
sin
cos10 oo
ohh kr λϑσ
ϑϑσ ϑε−= (2.37a)
( ) 7.01.1tan046.0
3
335.2 sin10
sin
cos10 oo
ovv kr λϑσ
ϑϑσ ϑε−= (2.37b),
where ϑ is the incidence angle (degrees), εr is the relative dielectric constant, ko is
the free space wave number given by ko = 2π/λo, λo is the free space wavelength
(cm), and σ is the rms roughness height (cm).
Omitting the usually weaker hv polarised returns was reported to make the
algorithm less sensitive to system cross-talk and noise. Furthermore, co-polarised
observations were reported as being less sensitive to the presence of vegetation
than cross-polarised observations, thus making the algorithm more robust in the
presence of vegetation than one relying on the hv polarised terms (Dubois and van
Zyl, 1994; Dubois et al., 1995b). However, significant amounts of vegetation
were found to cause the algorithm to under-estimate soil moisture and over-
estimate rms heights, as the incident electromagnetic wave failed to reach the soil
surface. To address this problem, a simple criteria based on the hv cross-polarised
return over the vv polarised return was developed to indicate the areas where the
inversion results were more reliable, or in other words, where the vegetation was
sparse enough. By masking out the areas for which the L-Band σo
hv/σo
vv ratio was
greater than –11 dB (corresponding to the SPOT NDVI of 0.4), reliable soil
moisture estimates were obtained. Comparison with field data indicated that the
algorithm could infer soil moisture content with an accuracy of 4.2% when
applied to data not used in the model development (Dubois et al., 1995b).
2.4.5.2.2 Theoretical Backscattering Models
Theoretical backscattering models are derived from application of the
theory of electromagnetic wave scattering from a randomly rough conducting

Chapter 2 – Literature Review: Soil Moisture Measurement Page 2-63
surface (Fung et al., 1992). These backscattering models are preferable to
empirical and semi-empirical backscattering models, as they provide site
independent relationships that are valid for different sensor configurations, and
take into account the effect of different surface parameters on backscattering
(Altese et al., 1996). Using simpli fying assumptions, theoretical backscattering
models with different ranges of validity may be obtained.
The standard theoretical backscattering models are the Kirchhoff Models
(KM), which consists of the Geometrical Optics Model (GOM) and Physical
Optics Model (POM), and the Small Perturbation Model (SPM). In a broad sense,
the GOM is best suited for very rough surfaces, the POM is suited for surfaces
with intermediate roughness, and the SPM is suited for surfaces with small
roughness and short roughness correlation lengths (Engman and Chauhan, 1995).
In general, the like-polarised backscattering coeff icients consist of a
coherent (specular) term, which is important only at and near normal incidence,
and a non-coherent (scattered) term, which is important at all i ncidence angles
(Ulaby et al., 1986).
For relatively rough surfaces whose backscattering coeff icient exhibits a
slowly varying angular dependence near nadir, the KM under the stationary phase
approximation, known as the GOM, is appropriate. For such a surface the rms
height σ is usually such that koσ is of the order of unity. As a result, the coherent
component is small i n magnitude and is often much smaller than the non-coherent
component. The validity conditions for the GOM are (2koσ cosϑ)2 > 10 and
l2 > 2.76σλo, where ko is the free space wave number given by ko = 2π/λo, λo is the
free space wavelength (cm), σ is the rms roughness height (cm), l is the roughness
correlation length (cm) and ϑ is the incidence angle (degrees). Neglecting the
coherent term, the GOM can be written as (Ulaby et al., 1986)
ϑγγϑ
σ42
2
20
cos2
2tanexp
−Γ
=opp (2.38),
where

Chapter 2 – Literature Review: Soil Moisture Measurement Page 2-64
l
σγ = (2.39)
2
01
1
r
r
εε
+
−=Γ (2.40),
and σ ppo is the backscattering coeff icient when transmission and reception are at
polarisation p, Γ0 is the Fresnel reflectivity at nadir, εr is the relative dielectric
constant and γ is the surface rms slope.
The exponentially decaying angular dependence characteristic of a
relatively smooth surface can be obtained using the KM under the scalar
approximation, known as the POM. The validity conditions of the POM are such
that γ < 0.25 and kol > 6, where γ is the surface rms slope, l is the roughness
correlation length (cm), ko is the free space wave number given by ko = 2π/λo and
λo is the free space wavelength (cm). Neglecting the coherent term again, the
POM may be written as (Ulaby et al., 1986)
( )[ ]( )
( ) ( ) ξξθξξρ
ϑσ
ϑσϑσ
dkJ
n
k
kk
on
n
n
o
opoopp
sin2
!
cos4
cos2expcos2
0
0
1
222
222
∫
∑∞
∞
=
⋅
⋅
−Γ=
(2.41),
where
2
2
2
sincos
sincos
ϑεϑ
ϑεϑ
−+
−−=Γ
r
rh (2.42a)
2
2
2
sincos
sincos
ϑεϑε
ϑεϑε
−+
−−=Γ
rr
rrv (2.42b),

Chapter 2 – Literature Review: Soil Moisture Measurement Page 2-65
and σ ppo is the backscattering coeff icient when transmission and reception are at
polarisation p, ϑ is the incidence angle (degrees), Γv and Γh are the vertical and
horizontal Fresnel reflectivities, εr is the relative dielectric constant, σ is the rms
roughness height (cm), ρ(ξ) is the single parameter surface correlation function
and J0( ) is the zeroth order Bessel function of the first kind. In computing (2.41),
the error incurred in truncating the summation at n = 10 is less than 0.1 dB (Ulaby
et al., 1986).
The SPM given by (2.43) has the validity conditions of γ < 0.3 and
koσ < 0.3, whereγ is the rms surface slope, ko is the free space wave number given
by ko = 2π/λo, λo is the free space wavelength (cm) and σ is the rms roughness
height (cm) (Ulaby et al., 1986).
( )ϑϑσασ sin2cos8 4242
oopqopq kWk= (2.43),
where
ϑεϑ
ϑεϑα
2
2
sincos
sincos
−+
−−=
r
rhh (2.44a)
( ) ( )[ ]22
22
sincos
sin1sin1
θεϑε
ϑεϑεα
−+
+−−=
rr
rrvv (2.44b),
and σ pqo is the backscattering coeff icient when transmission is at polarisation p
and reception is at polarisation q, ϑ is the incidence angle (degrees) and εr is the
relative dielectric constant. W( ) is the normalised roughness spectrum, which is
the Bessel transform of the single parameter correlation function ρ(ξ), evaluated
at the surface wave number of 2kosinϑ. For the Gaussian correlation function
ρ(ξ) = exp(-ξ2/l2), the normalised roughness spectrum is given by
( ) ( )[ ]22 sinexp2
1sin2 ϑϑ lklkW oo −= (2.45).

Chapter 2 – Literature Review: Soil Moisture Measurement Page 2-66
The Integral Equation Model (IEM) was developed by Fung et al. (1992),
and is shown to unite the KM and SPM, hence making it applicable to a wider
range of roughness conditions or frequencies. In its complete version, the model
describes the backscattering behaviour of a random rough bare surface without
any limitation on the roughness scale or frequency range, and accounts for both
single and multiple surface scattering of a conducting surface. Because of its
complexity, it is not practical to use the complete version of the IEM and in
applications approximate solutions are usually considered.
Altese et al. (1996) have used an approximate version of the IEM, which
is valid for surfaces with small to moderate surface rms heights (Fung et al.,
1992). The validity expression for this model may be expressed as koσ < 3, where
ko = 2π/λo is the free space wave number, λo is the free space wavelength (cm) and
σ is the rms roughness height (cm). Altese et al. (1996) used only the single
scattering component of the IEM and made further simpli fying assumptions by
using only the real part of the relative dielectric constant and assuming that the
surface correlation function is isotropic and can be represented by either the
Gaussian or exponential models.
As most natural terrains have a small rms surface slope, it has been
suggested by Fung et al. (1992) that single scattering terms should dominate over
multiple scattering terms in most situations. The conditions under which
significant multiple scattering has been found to occur are: (i) normalised surface
height koσ > 1; and (ii ) surface rms slope γ > 0.5 (Hsieh and Fung, 1997).
The approximate version of the IEM used by Altese et al. (1996) is
presented in (2.46), with p and q representing either h or v polarisation. This
algorithm has been used successfully by Su et al. (1997) to estimate volumetric
soil moisture content in bare fields during the European Multi -sensor Airborne
Campaign 1994 (EMAC’94).
∑∞
=
−−=
1
22222
!
)0,2()2exp(
2 n
xon
npq
nzo
oopq n
kWIk
kσσσ (2.46),
where

Chapter 2 – Literature Review: Soil Moisture Measurement Page 2-67
[ ]2
)0,()0,()exp()2( 22 xopqxopq
nzo
zopqn
zonpq
kFkFkkfkI
+−+−= σ (2.47)
ϑcos
2 v
vv
Rf = (2.48a)
ϑcos
2 hhh
Rf
−= (2.48b)
−−
+
−
⋅+
=+−
ϑεϑεϑεµ
ε
ϑϑ
22
22
22
cos
cossin
11
cos
)1(sin2)0,()0,(
r
rrr
r
vxovvxovv
RkFkF
(2.49a)
−−
+
−
⋅+−
=+−
ϑµϑµϑεµ
µ
ϑϑ
22
22
22
cos
cossin
11
cos
)1(sin2)0,()0,(
r
rrr
r
hxohhxohh
RkFkF
(2.49b)
ϑεϑ
ϑεϑ2
2
sincos
sincos
−+
−−=
r
rhR (2.50a)
ϑεϑε
ϑεϑε2
2
sincos
sincos
−+
−−=
rr
rrvR (2.50b)
r
rRε
ε
+
−=
1
10 (2.50c)

Chapter 2 – Literature Review: Soil Moisture Measurement Page 2-68
∫∞+
∞−−−= ςξςξςξρ
πddiviuvuW nn )exp(),(
2
1),( (2.51),
and fpq is the Kirchhoff coeff icient, Fpq is the complementary field coeff icient, Rv
and Rh are the vertical and horizontal Fresnel reflection coefficients, R0 is the
Fresnel reflection coeff icient at nadir, εr is the relative dielectric constant, ko is the
free space wave number given by ko = 2π/λo, λo is the free space wavelength (cm),
kzo is the z component of the free space wave number given by kzo = kocosϑ, kxo is
the x component of the free space wave number given by kxo = kosinϑ, σ is the rms
surface height (cm), l is the correlation length (cm) and µr is the relative magnetic
permeabilit y, which is usually equal to unity for soil , since soil rarely contains
significant amounts of ferromagnetic components (Roth et al., 1990).
Wn is the roughness spectrum of the surface related to the nth power of the
two parameter surface correlation function ρ(ξ,ς) by the Fourier transformation,
and is usually simpli fied to a single parameter isotropic case (Fung, 1994). The
Fourier transform of the nth power of the: (i) Gaussian correlation function is
given in (2.52a); (ii ) exponential correlation function is given in (2.52b); and
(iii ) 1.5 power correlation function is given in (2.52c).
( ) ( )
−=n
Kl
n
lKW n
4exp
2
22
(2.52a)
( )5.122
1
−
+
=
n
Kl
n
lKW n (2.52b)
( ) ( )( )n
KJKlKW
n
nn
n
5.12 15.1
)15.1(15.12
Γ= −
−−−
(2.52c),
where l is the roughness correlation length (cm), Γ( ) is the gamma function, and
Jv( ) is the Bessel function of the second kind of order v with the imaginary
argument.

Chapter 2 – Literature Review: Soil Moisture Measurement Page 2-69
Fung (1994) notes that for dielectric surfaces there are two approximations
that have been made to the local angle in the Fresnel reflection coeff icients Rv and
Rh to be used in the Kirchhoff coeff icient fpq. One approximation replaces the local
angle by the incident angle and the other by the angle along the specular direction.
The local angle in the Fresnel reflection coefficients in the complementary field
coeff icients Fqp is always approximated by the incident angle. Fung (1994) has
shown that the approximation by the incident angle is good for the low to
intermediate frequency region while the other approximation is good in the high
frequency region. Thus, it has been proposed by Fung (1994) that for
koσkol < a√εr, ϑ is the incident angle, and for koσkol > a√εr, ϑ is equal to 0°, where
a is 1.2, 1.6 and 200 for Gaussian, 1.5 power, and exponential surface roughness
correlation functions respectively.
An alternative method for estimating the incidence angle in the reflection
coeff icients used in the Kirchhoff coefficient has been proposed by Wu et al.
(1997), which uses a transition function to go between Rϑ and R0 in the
intermediate frequency region. The reflection coeff icient used is given by
[ ] 20 TRRRRT ϑϑ −+= (2.53),
where
( )[ ]{ }πϑγσπ 5.03.1cos5.2tan1 222211 −−+= −−Too kkT (2.54),
and γ is the rms surface slope given by σ/l, σ is rms surface roughness (cm), l is
the correlation length (cm), R0 is the reflection coefficient at nadir, Rϑ is the
reflection coefficient at the incidence angle, and koT is the free space wave
number at transition frequency fT. It is suggested by Wu et al. (1997) that the
transition frequency used is the maximum frequency corresponding to the cross
point between IEM and GOM. In the case where there is no cross point, then it is
suggested that the transition frequency be set to the frequency corresponding to
the peak value of backscattering from the IEM with Rϑ.

Chapter 2 – Literature Review: Soil Moisture Measurement Page 2-70
Theoretical models can predict reasonably well the general trend of
backscattering coeff icient in response to changes in roughness or soil moisture
content. However, because of their complexity or the restrictive assumptions
made when deriving them, it has been reported by various researchers (Oh et al.,
1992; Dubois and van Zyl, 1994; Dubois et al., 1995b) that they can rarely be
used to invert data measured from natural surfaces, due to failure of satisfying
validity regions or in providing results in good agreement with experimental
observations.
Chen and Fung (1995) have examined the ease of applicabilit y and
accuracy of three theoretical surface scattering models when compared with exact
moment method simulations. The models examined were the IEM, the Full Wave
Model (FWM) and the Phase Perturbation Model (PPM). The most complex of
these is the FWM, which requires evaluation of a ten-fold integral (reduces to two
double integrals under certain assumptions), and the simplest is the IEM. This
study found only the IEM and PPM to accurately predict the backscattering
coeff icient over all i ncident angles, with the IEM being the fastest to evaluate, and
the PPM being significantly slower.
2.4.5.2.3 Semi-Empirical Backscattering Models
Semi-empirical backscattering models are an improvement to empirical
backscattering models in so much as they either start from a theoretical
background and then use simulated or experimental data sets to simpli fy the
theoretical backscattering model. Alternatively, they use simulated data from a
theoretical backscattering model to derive an empirical backscattering model that
describes the backscattering response for a wide range of surface conditions. The
main advantage of these backscattering models is that they are not expected to
have the site-specific problems commonly associated with empirical
backscattering models derived from a limited number of observations.
Among the first semi-empirical backscattering models is that of Oh et al.
(1994). This model is based on existing theoretical backscattering models (SPM
and KM) in conjunction with extensive experimental data, and is an extension of
their previously developed empirical model (2.32), to include both the magnitude

Chapter 2 – Literature Review: Soil Moisture Measurement Page 2-71
and phase of the backscattering. The experimental data that was used to solve for
the unknown constants of the expression chosen to represent the backscattering
response of a surface, was collected from a truck-mounted L-, C- and X-Band
polarimetric scatterometer over a range of incidence angles from 10° to 70°. The
expression chosen for the vv polarised backscattering was
( )( ) ( ) ( )
( )( )Wk
kp
k lkoho
ovv
o
6.0
05.025.322.0
cos2exp
cos1
4.1exp5.13
ϑσ
ϑσσσ
−
Γ−= −
(2.55),
where
( )σπϑ
okp −
−=
Γexp
21
0
314.0
(2.56)
( )( )
( )( )[ ]
+
−−
+=
22
2
2
2
sin6.21
sin6.23171.01
sin6.21 ϑ
ϑϑ lk
lk
lk
lkW
o
o
o
o (2.57),
and ko is the free space wave number given by ko = 2π/λo, λo is the free space
wavelength (cm), σ is the rms roughness height (cm), l is the roughness
correlation length (cm), ϑ is the incidence angle (degrees), Γh is the horizontal
Fresnel reflectivity given by (2.36a) and Γ0 is the Fresnel reflectivity at nadir
given by (2.36c). W is the roughness spectrum corresponding to a quadratic
exponential correlation function, which was found by Oh et al. (1994) to be the
form of the correlation function that best describes the roughness of natural fields.
Chen et al. (1995) have also developed a semi-empirical backscattering
model, which is based on the single scattering terms of the IEM. It is a multiple
linear regression model of simulated data using the IEM with the assumption that
surface roughness can be described by an exponential correlation function. The
ratio of vv and hh backscattering coeff icients were used to describe the
backscattering response of the surface, as simulations of backscattering coefficient
were found to be less sensitive to the effects of both surface roughness and

Chapter 2 – Literature Review: Soil Moisture Measurement Page 2-72
incidence angle uncertainty using this ratio. The data generated in the simulation
procedure had the following ranges: volumetric soil moisture 10 to 40% v/v,
roughness correlation length 1 to 15 cm, rms roughness height 0.1 to 2 cm,
incidence angle 10° to 50° and observation frequency 1 to 10 GHz. The final form
of the linear regression equation developed is given by
74678.110029238.0
00971.009544.0ln9
/
−×+
−−=− f
ovvhh dB
ϑσθ(2.58),
where θ is the volumetric soil moisture fraction, σhh/ vvdB
o is the ratio of hh to vv
polarisation backscattering in dB, ϑ is the incidence angle in degrees and f is the
observation frequency in Hz.
Another semi-empirical backscattering model is that of Shi et al. (1997),
which is also based on the single scattering terms of the IEM. The development of
this model relied on non-linear fitting of IEM based numerical simulations for a
wide range of surface roughness and soil moisture conditions at very fine
intervals. The algorithm was then applied to AIRSAR (aircraft) and SIR-C (space
shuttle) measurements over bare and sparse short vegetated surfaces for inferring
soil moisture content and surface roughness. As with the model of Chen et al.
(1995), no measured data were used in the algorithm development. The equations
derived are for surfaces with rms heights from 0.2 to 3.6 cm, roughness
correlation lengths ranging from 2.5 to 35 cm, incidence angles between 25° and
70° and moisture contents from 2 to 50% v/v. All calibration and evaluation was
undertaken with measurements at L-Band (1.25 GHz), and a power correlation
function with exponent n = 1, 1.2 and 1.4.
The base model used by Shi et al. (1997) is
( ) ( )
+
=Rpqpq
Rpq
opq Sba
S
ϑϑασ
2(2.59),
where

Chapter 2 – Literature Review: Soil Moisture Measurement Page 2-73
( ) ( )xooR kWkS 22 −= σ (2.60)
( ) ( ) ξξξξρ dKJKW 00)( ∫
∞= (2.61)
( )
−
++=
r
vvovv
RRk
εϑ
ϑα 11
2
1sincos4
222 (2.62a)
ϑα 2cos4 hohh Rk−= (2.62b)
)302.5118.3exp()( ϑϑ +−=vva (2.63a)
( ) ( )ϑϑ 8.6tan361.2013.3exp +−=vvb (2.63b)
ϑεϑ
ϑεϑ2
2
sincos
sincos
−+
−−=
r
rhR (2.64a)
ϑεϑε
ϑεϑε2
2
sincos
sincos
−+
−−=
rr
rrvR (2.64b),
and σ pqo is the backscattering coeff icient when transmission is at polarisation p
and reception is at polarisation q; SR is a roughness parameter that accounts for
rms roughness height σ (cm), correlation length l (cm) and correlation function; W
is the roughness spectrum related to a one-parameter surface correlation function
ρ(ξ); J0( ) is the Bessel function to zeroth order; ko is the free space wave number
given by ko = 2π/λo, λo is the free space wavelength (cm) and kxo is the x
component of the free space wave number given by kxo = kocosϑ; ϑ is the
incidence angle (degrees); apq and bpq are empirically derived coeff icients; αpq is an
approximation to the parameter Ipq in the IEM, which holds for koσ << 1; Rv and Rh

Chapter 2 – Literature Review: Soil Moisture Measurement Page 2-74
are the vertical and horizontal Fresnel reflection coeff icients; and εr is the relative
dielectric constant.
By using two polarisation measurements and rearranging the above
equations, Shi et al. (1997) eliminated the roughness parameter SR to obtain
( ) ( )
+=
++
ohh
ovv
hhvvvhvho
hhovv
hhvv baσσ
ααϑϑ
σσαα
10
22
10 log10log10 (2.65),
where
( )
+
−+−=
ϑϑϑ
ϑ32 sin89.18sin187.41
sin206.3737.12expvha (2.66a)
( ) ϑϑϑ 2cos306.0cos659.0649.0 −+=vhb (2.66b).
Shi et al. (1997) used (2.65) to solve for the dielectric constant of the near-
surface soil l ayer from vv and hh polarisation observations, and then used (2.59)
to solve for the surface roughness parameter.
2.4.5.3 Volume Scattering Model
If the dielectric properties of the soil are homogeneous with depth,
backscattering of the electromagnetic wave occurs solely at the soil surface, and is
known as surface scattering. However, if a soil moisture (dielectric) gradient
exists near the soil surface, the dielectric properties of the soil are inhomogeneous,
and part of the transmitted wave is also backscattered due to scattering within the
volume of the soil medium, known as volume scattering. This volume scattering is
the result of electromagnetic radiation entering the soil and then being
backscattered from a dielectric discontinuity in the soil medium (Ulaby et al.,
1982), as ill ustrated in Figure 2.19.
All of the backscattering models described in the previous section neglect
these gradients, and estimate only the surface scattering term as a function of the

Chapter 2 – Literature Review: Soil Moisture Measurement Page 2-75
dielectric constant at the air-soil i nterface. The justification for this has been that
the discontinuity in dielectric constant at the air-soil i nterface has the greatest
effect on backscattering for natural profiles, since such profiles do not usually
exhibit sharp discontinuities within the soil medium. However, small variations in
the shape of the dielectric profile can still result in significant changes in the total
backscattering coeff icient (Ulaby et al., 1978).
To account for the varying dielectric profile in the existing surface
scattering models, an equivalent soil moisture value over a fixed depth is assumed
(Boisvert et al., 1997). Several approaches have been presented in the literature
for determining this equivalent soil moisture value, and are outlined in Ulaby and
Batliva (1976). The approaches include: (i) the fixed depth soil moisture content,
which is the average moisture content in a near-surface soil l ayer; (ii ) the
equivalent skin depth soil moisture content, which is the soil moisture content of a
homogeneous medium whose skin depth at the frequency of interest is identical to
the skin depth of the soil medium under investigation; (iii ) the equivalent coherent
reflection soil moisture content; and (iv) the equivalent incoherent soil moisture
content. Boisvert et al. (1997) have shown that a mean fixed depth was sufficient
to relate σo to the dielectric constant when there was no soil moisture gradient, but
overestimated σo in the presence of a gradient.
Whilst using an equivalent soil moisture content in the existing surface
scattering models has attempted to account for the soil moisture gradients that are
common place in the natural environment, it has not accounted for the
a) b)
Figure 2.19: Illustration of a) surface scattering as modelled by the standard IEM, and b) surfaceand volume scattering as modelled by the modified IEM (Fung et al., 1996).

Chapter 2 – Literature Review: Soil Moisture Measurement Page 2-76
backscattering contribution from the soil volume. To account for the effects of
volume scattering, Fung et al. (1996) have proposed a Modified IEM, which
incorporates a physical dielectric gradient into the backscattering model. The
effect of a vertical dielectric profile was incorporated by replacing the standard
Fresnel reflection coeff icients with the modified set of reflection coeff icients
( )( )
( )( )( )( )
( )( )( )( )
−+−
+Γ
−++
−Γ
⋅
−+−
Γ
−++
−Γ
−ΓΓ=
∞
∞
∞
∞
1coscos2
1
1coscos2
1
1coscos2
1coscos2
cos
cos
2
2
2
2
r
r
r
r
h
is
is
is
is
is
isR
εϑϑ
εϑϑ
εϑϑ
εϑϑ
ϑϑ
(2.67a)
( )( )
( )
( )
( )
( )( )
−+−
+Γ
−++
−Γ
⋅
−+−
Γ
−++
−Γ
−ΓΓ=
∞
∞∞
∞
∞
∞
∞
1coscos2
1
1coscos2
1
1cos1
cos2
1cos1
cos2
cos
cos
2
23
1
2
2
r
rr
rr
rr
v
is
is
is
is
is
isR
εϑϑ
εϑϑε
εϑε
ϑ
εϑε
ϑ
θθ
(2.67b),
where Γ( ) is the gamma function, ϑ is the incidence angle (degrees), s = 2ko/m, ko
is the free space wave number given by ko = 2π/λo, λo is the free space wavelength
(cm) and m is the transition rate factor (cm-1) explained below.
In the formulation of the modified reflection coeff icients to account for a
drying profile, the transitional dielectric layer was modelled by an exponential
dielectric profile in which the dielectric constant as a function of depth z (cm) is
)exp(1
)exp()1(1)(
mz
mzz rr +
−+=∞
εε (2.68).

Chapter 2 – Literature Review: Soil Moisture Measurement Page 2-77
The inputs to this dielectric model are the transition rate factor m and the
dielectric constant at depth z = ∞ (εr∞). By (2.68) the relative dielectric constant
εr(z) starts from 1 in air and gradually changes to εr∞ at the rate m. Fung et al.
(1996) have suggested that a value for m equal to about 12 cm-1 should be
appropriate, and was shown to give an improvement in the simulation of
backscattering when compared to the standard IEM.
2.4.5.4 Evaluation o f Surface Scattering Models
Hoeben et al. (1999) have undertaken an evaluation of surface scattering
models for the smooth and very rough surface data sets measured in the European
Microwave Signature Laboratory (EMSL) experiment (Mancini et al., 1995;
discussed in Chapter 4). In this evaluation, only the vv and hh co-polarisation
responses were simulated, using the empirical models of Oh (2.32) and Dubois-
van Zyl (2.37), and the approximate version of the theoretical IEM (2.46).
Simulations were made using the measurement of the real part of the dielectric
constant at a depth of 2.5 cm, and compared with the measured backscattering
response.
The results of this evaluation indicated that for the smooth surface, the
IEM was the only model that performed well . However, for the rough surface
under drying conditions, all three models gave reasonable results. It was also
indicated that care should be taken with measurements of smooth surfaces at
incidence angles approaching 35°, as there was some doubt as to whether the
model incorrectly predicted the backscattering or if there was noise in the
measurements. It was also suggested that simpli fication of the IEM has resulted in
a significant loss in accuracy.
A study by Mancini et al. (1996), which also evaluates the IEM with
EMSL data, suggests that the IEM predicts the trend for σo well for forward
modelli ng over the whole range of frequencies, despite the fact that the observed
backscattering showed oscill ations with frequency (Figure 2.20). However, when
applying the inversion mode, the computed surface dielectric constant was found
reliably for the smooth surface, but for the rough surface, the combined effect of

Chapter 2 – Literature Review: Soil Moisture Measurement Page 2-78
relatively high dielectric constant and the oscill ations in the measured
backscattering produced large fluctuations in the retrieved dielectric constant.
2.4.5.5 Surface Roughness Effects
Surface roughness characteristics have generally been described in terms
of the rms surface height σ, roughness correlation length l, and a correlation
function. Altese et al. (1996) have shown that the behaviour of the IEM is highly
dependent on the choice of the correlation function. Furthermore, it has been
a)
b)
Figure 2.20: Comparison of IEM estimate of backscattering coeff icient with the observedbackscattering coefficient from the smooth EMSL experiment at incidence angles of 11°, 23° and35° (Mancini et al., 1996).

Chapter 2 – Literature Review: Soil Moisture Measurement Page 2-79
shown by Wegmüler et al. (1994) that the exponential correlation function usually
gives a better agreement to the observed correlation function than the Gaussian
correlation function in agricultural fields. Of the roughness parameters, Jackson et
al. (1997) suggests that rms surface height is the most important.
The method used to evaluate the roughness parameters has generally
involved physically measuring the horizontal surface profile for a 1 to 2 m length
at various locations over the site, using one of four methods. These methods have
included: (i) inserting a thin metal plate vertically into the soil and then spraying
with paint from an approximately horizontal direction; (ii ) taking a photograph of
the intersection of the ground surface with a gridded plate and digitising the
intersection; (iii ) using a panel with drop pins, and (iv) using a laser profiler
(Ulaby and Batliva, 1976; Ulaby et al., 1978; Troch et al., 1994; Wegmüler et al.,
1994). These profiles are generally taken in several directions for each location
(Troch et al., 1994). As there is no rule for choosing the spacing of roughness
measurements along the profile, the suggestion of Ulaby et al. (1986) is often
followed, using a spacing approximately equal to one-tenth of the free space
wavelength.
Lin (1994) and Wang et al. (1997) have noted that the commonly used
sampling techniques for measuring field surface roughness parameters required in
microwave backscattering models are questionable, especially for smooth fields.
This is because they have measurement scales of the order of a few metres, which
is significantly smaller than the application scale when inferring near-surface soil
moisture content from remote sensing observations. Moreover, it is questionable
whether the correlation length can be adequately estimated from surface profiles
of this length (Wang et al., 1987). Oh (1997) showed that to estimate the surface
roughness parameters with a precision of ±5%, the surface must be sampled at a
spacing of less than 0.2l and that the segment length be at least 200l, where l is the
correlation length.
From the study of Altese et al. (1996), it is clear that soil roughness
characteristics are very important for determining the surface backscattering
properties of f ields. Their study concludes that for very smooth surfaces
(σ < 1 cm), it is impossible to use SAR soil moisture inversion algorithms because

Chapter 2 – Literature Review: Soil Moisture Measurement Page 2-80
of the sensitivity of σo with respect to σ. However, as the surface becomes rougher
(σ > 1 cm) the sensitivity to roughness decreases (Altese et al., 1996; Sano et al.,
1998). Hence, as regular agricultural fields generally have σ > 1 cm, this problem
should not be relevant for routine use (Altese et al., 1996). It should also be noted
that roughness parameters are not constant, at least for bare fields, with heavy rain
causing erosion and smoothing of the soil surface (Wegmüler et al., 1994).
To overcome the surface roughness problem, Jackson et al. (1997)
suggested a procedure for developing a global roughness data set as a first order
correction in soil moisture inversion algorithms, based on land cover and use. For
agricultural fields, Jackson et al. (1997) suggest a roughness value of 1.5 cm as
being the most representative, which should be reduced by a rainfall reduction
factor, 0.89exp(-0.026P), where P is the cumulative precipitation (cm) since
till age. Unlike agricultural areas, the roughness height of rangeland and grassland
is more or less constant over time. It is further suggested by Jackson et al. (1997)
that land use be grouped into the land cover types of sod grass, bunch grass and
shrub/brush with roughness heights of 0.8, 1.4 and 1.8 cm.
Since there is no immediate hope of developing a surface roughness
measurement technique with a measurement scale comparable to the application
scale, and since it is too complex to develop a theory to bridge the gap between
measurement and application scales, Lin (1994) and Wütherich (1997) suggest an
alternative data analysis scheme that uses field roughness measurements as a
quality control measure only. This scheme involves collecting near-surface soil
moisture content data by TDR on a grid, and then solving for surface roughness
using a microwave backscattering model. Comparison of the roughness
characteristics evaluated can then be made with the field collected roughness data.
However, a small error in soil moisture content results in a large error in surface
roughness, and using such to invert soil moisture again carries large uncertainties
(Wütherich, 1997). Altese et al. (1996) have found that for σ less than 1 cm, an
error of 0.01 cm in the measurement of rms height can imply an error in the
inferred soil moisture content of up to 8% v/v, while for σ greater than 1 cm, an
error of 0.01 cm in the measurement of rms surface height can imply an error in
the retrieved soil moisture content of only about 0.3% v/v.

Chapter 2 – Literature Review: Soil Moisture Measurement Page 2-81
Due to the high level of f ield work required to determine roughness
parameters using the above methods, and the fact that roughness parameters
cannot be measured with the required degree of accuracy (Wütherich, 1997), Su et
al. (1995, 1997) have proposed an alternative solution. The method is to
simultaneously infer both surface roughness parameters and soil moisture content,
using multiple remote sensing measurements at different wavelengths or
polarisations.
Due to the sensitivity of backscattering to surface roughness parameters
(Altese et al., 1996; Lin, 1994; Su et al., 1995, 1997), Su and Troch (1996)
undertook a study to fully determine the relationship between radar backscattering
and soil surface parameters under different antenna configurations. This study
showed that as the soil becomes wetter the sensitivity of σo to εr decreases, with a
5 dB change in σo due to a change in εr from 5 to 25 (10 to 40% volumetric soil
moisture), independent of radar configuration and surface roughness conditions.
Su and Troch (1996) were able to show that an accuracy of 0.1 cm and 1 cm in
determining σ and l respectively can be considered satisfactory for determining σo
regardless of soil moisture content, given that the roughness conditions for most
agricultural fields generally lie within 0.5 to 2.0 cm in σ and from 5 to 20 cm in l.
The study also concluded that low frequencies and low incidence angle
configurations are more favourable for inferring soil moisture content, with the
sensitivity of σo to changes in σ and l decreasing.
Following on from the study by Su and Troch (1996), Hoeben et al. (1997)
have shown that an accurate knowledge about the correlation length is important
at lower incidence angles, while the rms surface roughness has to be accurately
known at higher incidence angles.
2.4.5.6 Vegetation Effects
In the presence of a vegetation canopy, there is a combination of volume
scattering and attenuation by the vegetation layer, and surface scattering by the
underlying soil surface. The relative importance of these two contributions is
dependent on several factors, including the vegetation penetration depth, the
canopy height, observation frequency, wave polarisation and the angle of

Chapter 2 – Literature Review: Soil Moisture Measurement Page 2-82
incidence. The effect of a significantly vegetated surface, is to increase the
backscatter compared to a bare surface, with the effect being relatively large for
the cross-polarised channel. The degree to which vegetation affects the
determination of soil moisture content depends on several factors: vegetation
biomass, canopy type and configuration, and crop condition (Schmugge et al.,
1980; D’Urso et al., 1994). In addition, Dobson and Ulaby (1986a) have shown
that at low soil moisture contents, the backscattering contributions from the crop
canopy itself dominate the total return.
The penetration depth in vegetation is diff icult to estimate, due to the
diff iculty in establishing the effective dielectric constant of the vegetated medium.
Indirect estimates, obtained by comparing backscattering coeff icient close to nadir
for bare soil and vegetated soil , have indicated that the penetration depth of
mature crops in the green stage is typically several metres at frequencies around
1 GHz, and decreases to one metre or less at frequencies above 10 GHz (Ulaby et
al., 1982). The main factors that influence the penetration depth are the geometry
of the canopy and the vegetation biomass of the canopy. If the plant moisture
content is low, the penetration depth can be higher than if the vegetation is moist
and lush, as the absorption by the vegetation is primarily due to the water content
in the vegetation. It has also been noted that the attenuation for horizontal
polarisation is very weak, but the vertically polarised data are attenuated to a
much greater degree because of the relationship with the canopy structure, which
consists primarily of vertical stalks (Engman and Chauhan, 1995).
In order to determine soil moisture content of heavily vegetated terrain, the
effects of the vegetation canopy must be determined. The quantitative estimation
of near-surface soil moisture content under a vegetation layer has historically been
obtained from an empirical relationship of the form given in (2.31) (eg. Dobson
and Ulaby, 1986b; Wood et al., 1993). However, these empirical relationships are
site specific and therefore have limited ranges of validity. Thus, the development
of theoretical models that account for vegetated terrains are useful for studying the
dominant factors controlli ng the backscattering process (Engman and Chauhan,
1995; Troch et al., 1999). The theoretical backscattering models that account for
vegetation generally require a large number of parameters to be measured or
estimated in the field. For example, the backscattering model used by Lin et al.

Chapter 2 – Literature Review: Soil Moisture Measurement Page 2-83
(1994b) requires more than 20 parameters, including; frequency, local incidence
angle, length of the semi-minor and semi-major axes of the leaves, leaf thickness,
type and parameter of leaf orientational distribution, density of leaves, leaf
dielectric constant, length and radius of stem, type and parameter of stem
orientational distribution, density of stems, stem dielectric constant, canopy
thickness, rms surface roughness height, fraction of sand and clay components of
soil , and soil bulk density.
The same gridded plate used for determining soil surface roughness
characteristics has also been used to estimate vegetation characteristics of non-
bare fields. In the case of row structure (ie. winter wheat or maize) photographs
are taken both along and across the rows, allowing determination of row distance,
distance in the row, plant density (number of plants per m2) and plant height. For
pasture fields, only grass height is derived from the slides.
Backscattering from a layer of vegetation has been theoretically modelled
in different ways. Attema and Ulaby (1978) have represented the vegetation layer
by a cloud of spherical water droplets, in order to compute the volume scattering
from the vegetation. This same technique has been applied by Hoekman et al.
(1982) in a multi -layer vegetation model. The approach produces a relatively
simple model with few parameters, but the parameters are not easily related to any
measurable vegetation characteristics (Troch et al., 1999).
Lang (1981) and Lang and Sidhu (1983) have modelled the backscattering
coeff icient from a vegetation canopy by a layer of discrete scatterers over a flat
lossy ground. The discrete scatterers in this case were the leaves, which were
represented by lossy circular dielectric discs that were small i n comparison to the
wavelength, having prescribed orientation statistics. The distorted Born
approximation, which is applicable when the leaves have small albedo (Lang,
1981), was then used to compute the backscattered power from the vegetation
(σvego
) by
or
odr
od
oveg σσσσ ++= (2.69).

Chapter 2 – Literature Review: Soil Moisture Measurement Page 2-84
The direct backscattering contribution σdo represents the incoming wave
that propagates into the vegetation and is scattered directly back to the observer.
The direct reflected term σdro
results from two different but similar mechanisms.
In one case, the wave is scattered and then reflected from the ground towards the
observer, whereas in the second case, the wave is first reflected from the ground
interface and then scattered towards the observer. The reflected scattering term σro
represents the sum of all waves that are first reflected from the ground, then
scattered, and finally again reflected by the ground towards the observer. A
schematic ill ustration of these backscattering mechanisms is given in
Figure 2.21. For vegetation with an above ground biomass less than 0.5 kg m-2, the
σdro
and σro are negligibly small and the transmissivity of the vegetation
approaches one. Therefore, under this condition the effect of vegetation cover may
be ignored (Ulaby et al., 1996). The full equations for this modelli ng approach are
summarised in Troch et al. (1999).
Troch et al. (1999) have presented a theoretical model for the total
backscattering coeff icient from a soil -vegetation layer (σtotalo ) , by combining the
bare soil backscattering coefficient (σbareo ) from the IEM (2.46) with the
vegetation backscattering coefficient (σvego ) from (2.69) by
Figure 2.21: Schematic ill ustration of backscattering mechanisms from a vegetated surface (Ulabyet al., 1996).

Chapter 2 – Literature Review: Soil Moisture Measurement Page 2-85
oground
oveg
ototal σσσ += (2.70),
where
obareveg
oground σσ 2Γ= (2.71)
( )( )vegvveg dkIm4exp2 −=Γ (2.72),
and σgroundo is the backscattering from the ground covered with vegetation, Γveg
represents the two-way attenuation by the vegetation, dveg is the vegetation height
(cm), Im( ) is the imaginary component, and kv is a propagation constant which
depends on the dielectric properties of the vegetation layer and the incidence
angle.
Due to the complexity of theoretical soil -vegetation backscattering
models, Lin et al. (1994b) have developed an empirical backscattering model for
grass-covered areas from a combination of experimental and simulated data. By
including only the most sensitive soil -vegetation parameters in the regression
model, the following relationships were obtained.
( ) ( ) ( )
( )100log2731618.0100
1959691.0
67739.1900009502.027952.2207.1
01.039.221.0
×−
−
−+=−
θ
εϑσ
veg
vegohh
d (2.73a)
( ) ( ) ( )( ) ( )( ) 42.0
07.139.0
73.193.211.0
1008883097.0
1002320771.03203591.0
0001202.000000157.048103.2
×−
×+−
++=−
θ
ρ
εϑσ
Sb
vegovv
(2.73b)
where ϑ is the incidence angle (degrees), dveg is the vegetation height (cm), θ is the
volumetric soil moisture fraction, S is the sand mass fraction of the soil , ρb is the
soil bulk density (g cm-3) and εveg is the vegetation dielectric constant, which can
be estimated by a relationship with volumetric water content given by Ulaby and
El-Rayes (1987).

Chapter 2 – Literature Review: Soil Moisture Measurement Page 2-86
To quantitatively estimate the effect of a vegetation layer on
backscattering under ERS and JERS satellit e configurations, Troch et al. (1999)
undertook a simulation study, which compared the backscattering coeff icient
estimated for bare soil from the IEM (2.46), with that from a vegetated soil using
(2.70). The results of this study showed that soil moisture measurement over
grass-covered areas using ERS (C-Band) should be possible without explicitl y
accounting for vegetation characteristics when the grass height is less than 25 cm
and the vegetation volumetric water content is less than 70%. It was also shown
that grassland is basically transparent when using JERS (L-Band), even at
vegetation heights greater than 60 cm. However, Sano et al. (1998) suggest that
the contribution of backscattering from vegetation may not be negligible in semi-
arid regions, because of the typically low soil moisture contents.
2.4.5.7 Topog raphic Effects
Because of the high spatial resolution of SAR data, surface topography
must often be accounted for. In addition to fore-shortening and layover effects
(Engman, 1991), topography affects the soil moisture inference from
backscattering observations in two ways. First, if the topography is not taken into
account during the SAR data calibration, this can cause large absolute and relative
calibration errors (van Zyl et al., 1993). Second, the topography causes the local
incidence angle to be different from that assumed for a flat surface (van Zyl,
1993). The cumulative effect is that the algorithm under-estimates the soil
moisture content and over-estimates the surface roughness for surfaces tilted
towards the radar, while it under-estimates the roughness and over-estimates the
soil moisture for surfaces tilted away from the radar (Dubois et al., 1995b). The
hh polarised signals appear to be most sensitive to the topographic effect (Lin et
al., 1994b).
During normal SAR processing, a flat earth is assumed when performing
radiometric corrections such as antenna pattern removal and scattering area
removal. The effect of a sloping terrain is to cause the actual scattering area to be
different from that calculated using the flat earth assumption. Van Zyl et al.
(1993) have shown that this effect, which is present for both airborne and
spaceborne SAR data, may easily cause calibration errors larger than 1 dB. The
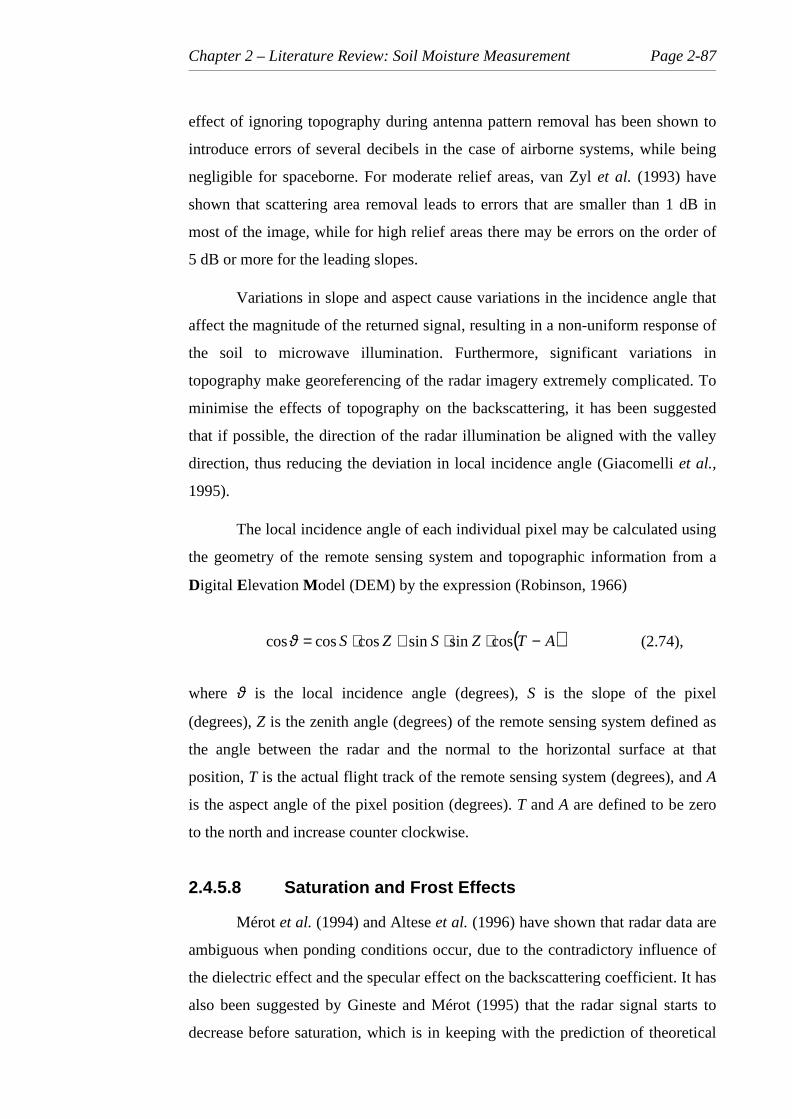
Chapter 2 – Literature Review: Soil Moisture Measurement Page 2-87
effect of ignoring topography during antenna pattern removal has been shown to
introduce errors of several decibels in the case of airborne systems, while being
negligible for spaceborne. For moderate relief areas, van Zyl et al. (1993) have
shown that scattering area removal leads to errors that are smaller than 1 dB in
most of the image, while for high relief areas there may be errors on the order of
5 dB or more for the leading slopes.
Variations in slope and aspect cause variations in the incidence angle that
affect the magnitude of the returned signal, resulting in a non-uniform response of
the soil to microwave ill umination. Furthermore, significant variations in
topography make georeferencing of the radar imagery extremely complicated. To
minimise the effects of topography on the backscattering, it has been suggested
that if possible, the direction of the radar ill umination be aligned with the valley
direction, thus reducing the deviation in local incidence angle (Giacomelli et al.,
1995).
The local incidence angle of each individual pixel may be calculated using
the geometry of the remote sensing system and topographic information from a
Digital Elevation Model (DEM) by the expression (Robinson, 1966)
( )ATZSZS −⋅⋅+⋅= cossinsincoscoscosϑ (2.74),
where ϑ is the local incidence angle (degrees), S is the slope of the pixel
(degrees), Z is the zenith angle (degrees) of the remote sensing system defined as
the angle between the radar and the normal to the horizontal surface at that
position, T is the actual flight track of the remote sensing system (degrees), and A
is the aspect angle of the pixel position (degrees). T and A are defined to be zero
to the north and increase counter clockwise.
2.4.5.8 Saturation and Frost Effects
Mérot et al. (1994) and Altese et al. (1996) have shown that radar data are
ambiguous when ponding conditions occur, due to the contradictory influence of
the dielectric effect and the specular effect on the backscattering coefficient. It has
also been suggested by Gineste and Mérot (1995) that the radar signal starts to
decrease before saturation, which is in keeping with the prediction of theoretical

Chapter 2 – Literature Review: Soil Moisture Measurement Page 2-88
models that a saturation of the signal owing to a saturation of the soil dielectric
constant occurs at high soil moisture content (Autret et al., 1989). Mérot et al.
(1994) have also found that backscattering values are significantly decreased
when frost occurs, due to the low dielectric constant of ice.
2.4.6 REMOTE SENSING OBSERVATION DEPTH
The depth of soil over which the soil moisture can be inferred from remote
sensing observations, known as the observation depth, is important for application
of these measurements. However, there is littl e quantitative research in the
literature on observation depth, particularly for visible and infra-red. It has been
reported however, that correlations have been found for soil moisture content in
the upper few millimetres of soil with visible and infra-red observations (Idso et
al., 1975; Sadeghi et al., 1984).
Estimation of the observation depth for passive microwave observations
appears to have received more attention than any other type of observation.
D’Urso et al. (1994) have described the microwave response from soil as the
result of the integration over a profile, with the importance of each depth
decreasing as one moves towards the deeper layers.
On the basis of both experimental (Newton et al., 1982; Newton et al.,
1983; Raju et al., 1995) and theoretical work (Wilheit, 1978; Schmugge and
Choudbury, 1981; Ulaby et al., 1986), it is believed that the thickness of the near-
surface soil l ayer that can effect such a response in a significant way for passive
microwave remote sensing is between one-tenth and one-quarter of a wavelength.
Although there is littl e quantitative evidence in the literature, it is believed that the
thickness of this layer is approximately the same for both active and passive
microwave remote sensing (Schmugge 1985; Engman and Chauhan, 1995; van
Oevelen, 1998). Therefore, by increasing the sensors wavelength it would appear
possible to investigate a thicker layer of soil . However, there is currently an upper
limit on the wavelength that may be used due to radio frequency interference at
wavelengths beyond L-Band (Jackson, 1980; Jackson, 1993; D’Urso et al., 1994;
Giacomelli et al., 1995).

Chapter 2 – Literature Review: Soil Moisture Measurement Page 2-89
Although observation depth is usually only discussed in relation to
wavelength, the depth of soil over which microwave instruments are sensitive is
also dependent on the soil moisture content. As the soil moisture content is
increased, the observation depth decreases (Njoku and Kong, 1977; Newton et al.,
1982; Arya et al., 1983; Bruckler et al., 1988; Engman and Chauhan, 1995; Raju
et al., 1995). Furthermore, Bruckler and Witono (1989) found that their radar
responded to a depth of approximately 1 cm for wet soils, and approximately 5 cm
for dry soils. The observation depth is also noted to be a function of incidence
angle, wave polarisation, surface roughness and vegetation cover (Arya et al.,
1983) and soil moisture profile shape (Njoku and Entekhabi, 1996).
2.5 CHAPTER SUMMARY
This chapter has reviewed the methods commonly used for measuring soil
moisture content over the soil profile at specific locations. In addition, the
measurement of near-surface soil moisture content from remote sensing
observations has been reviewed, along with the most appropriate remote sensing
instruments and satellit es currently available for soil moisture studies.
It has been found that of the remote sensing observations used for
measuring the near-surface soil moisture content, microwave observations have
the greatest utilit y, as a result of their all weather capabiliti es. Moreover, active
microwave observations have the greatest utilit y for application to agriculture and
hydrologic studies, as a result of their high spatial resolution and availabilit y of
operationally collected data.
However, active microwave data is more sensitive to surface roughness,
vegetation and topographic influences then the passive microwave data.
Furthermore, the interpretation of microwave data (passive and active), is
dependent on the relationship between dielectric constant and volumetric soil
moisture content, which has been shown to be heavily dependent on the near-
surface soil temperature. Hence, the interpretation of active microwave remote
sensing data requires knowledge of the soil temperature.


