
Pak. J. Engg. & Appl. Sci. Vol. 6, Jan., 2010 (p. 26-41)
1. Introduction
Subsoil investigation, consisting of in-situ tests either
independently or in combination with laboratory tests, has
become a prerequisite for any civil engineering project [1].
It provides cost-effective and safe design of the substructure
elements [2]. While laboratory testing forms a crucial part of
any subsoil exploration, in-situ testing has become
progressively more enviable in order to obtain various soil
parameters. Results can not be provided at the time of
subsoil investigation with laboratory methods of testing soil
samples, whether disturbed or undisturbed. Basically soils
are first sampled at the site, transported to the laboratory and
then tested for the determination of the required parameters.
Anonymous and different soil disturbance can have impact
on the soil fabric and can change the void ratio and density
of the soil. The effect on these parameters can everlastingly
change the strength and deformation properties of the soil
specimens.
The growing ranges of design and construction
problems and diversity of geological situations have led to
the development of many in-situ test techniques [3]. In order
to address these issues, geotechnical engineers have been
trying to develop new in-situ soil testing devices and data
analysis procedures around the world. These include cone
penetrometers, pressuremeters, dilatometers etc. These
devices have been developed to produce better quality soil
parameters. However, such devices are sophisticated, hence
expensive to buy or hire, making their use unaffordable on
small projects.
The first pressuremeter of full-displacement type was
developed by Withers et al. (1986) [4]. It is headed by a 15
cm2 solid cone, which is pushed into place by displacing the
ground. It measures the inflation pressure and the
circumferential strain at three locations 120 apart at the centre of the membrane. A Chinese lantern, making the
probe sophisticated, secures the membrane. The Fugro cone
pressuremeter has been further simplified by the use of a
volume change measurement system to measure the
pressuremeter membrane expansion rather than using strain gauges. The assembly and test control have also been made
easier [5] but the basic design has remained unchanged.
While many efforts have been made to make it simpler, no
effort has been made to measure the pressuremeter
membrane expansion with a single transducer till 2001.
Akbar [6] developed full-displacement pressuremeter
keeping length of test section 420 mm [7], which is nearly
the same as that of the FDPM, developed by Withers et al
(1986) [4].
The SPT equipment was developed in the 1900’s to
determine the ability of the ground to support end-bearing
piles. The blow count provides a measurement of the
strength of the ground which led to many empirical
correlations with laboratory determination of stiffness and
strength or direct predictions of settlement and bearing
capacity [8]. In Pakistan the geotechnical design parameters
are being obtained by SPT testing in the field and laboratory testing on disturbed and undisturbed soil samples collected
from the field. The SPT, though commonly used around the
world, does not provide soil parameters of high quality. The
Characterization of an Artificially Prepared Cohesive Soil Bed
Z. Rehman1, A.Akbar
2 and B.G. Clarke
3
1Ph.D. Student, Department of Civil Engineering, University of Engineering and Technology, Lahore-Pakistan 2Professor, Department of Civil Engineering, University of Engineering and Technology, Lahore-Pakistan 3 Professor, Department of Civil Engineering Department, University of Leeds,UK
Abstract A new pressuremeter has been developed at the University of Engineering and Technology, Lahore-Pakistan
with some modifications / improvements in the Newcastle full displacement pressuremeter (NFDPM), developed by
Akbar in 2001. The device is now called Akbar Pressuremeter (APMT). Tests in soils can be performed using the
APMT by full displacement as well as pre-bored techniques.
This paper describes the results of characterization of an artificially prepared cohesive soil bed comprising low
plastic lean clay (CL) to sandy silty clay (CL-ML) using the APMT. This testing was carried out by pre-bored technique. For this purpose initially borehole produced up to the desired test level using auger and then device was
inserted into the borehole to conduct the test. The pressuremeter (PMT) testing was carried out at two locations at
1.0 m intervals to 5.0 m depth. Undisturbed soil samples (UDS) were taken from nearby locations at the level of each
APMT test using Shelby tubes. These samples were subjected to various conventional laboratory tests to correlate
with the APMT test results. The standard penetration tests (SPTs) were also carried out in the near vicinity at the
level of each APMT in order to correlate PMT data with the SPT data. Undrained shear strength of each UDS was
determined by performing unconfined compression test.
The PMT parameters viz. soil strength and stiffness, determined from the corrected pressure-cavity strain curves
of each APMT test and those from laboratory methods, have been compared and correlations have been drawn. The
findings of this study are that the APMT can be used to characterize a cohesive soil bed.
Key Words: Pressuremeter; clay; SPT; shear strength; shear modulus; in-situ horizontal stress

Characterization of an Artificially Prepared Cohesive Soil Bed
27
pressuremeter is believed to provide soil parameters of
relatively better quality, particularly the stiffness of the soil
[9]. The unavailability of such devices in developing
countries like Pakistan give emphasis on the need to develop
a new generation of cost-effective in-situ testing devices having ability to produce high quality geotechnical design
parameters. The target design parameters are strength,
stiffness and in-situ stress.
The research was, therefore, carried out to develop a
relatively robust and simple version having ability to yield
higher quality soil design parameters, with certain modifications to the design of Newcastle full-displacement
pressuremeter (NFDPM) developed by Akbar in 2001. For
the development of this new testing device most of the local
resources have been used. Testing has been carried out using
this new version of NFDPM. The new version of this device
is called the Akbar pressuremeter (APMT). It is
instrumented with transducers to measure expansion of the
membrane and the pressure to expand it. The SPT blows are
recorded for 305 mm penetration of the split spoon sampler.
The length of the test section of the pressuremeter probe has
been kept 305 mm, in order to correlate the pressuremeter data with the SPT blows. This similarity was intended to
benefit from the long experience available on the SPT.
The aim of this study was to use the APMT by pre-
bored technique and to check / improve correlations
between the APMT indices, soil properties and geotechnical
design parameters by performing tests on an artificially prepared cohesive soil bed. In order to correlate the APMT
data with parameters obtained from other types of tests,
undisturbed samples (UDS) were obtained using 38 mm
diameter Shelby tubes. The UDS were retrieved from the
same depths as the APMT tests from two boreholes close to
the pressuremeter test locations. Boreholes were advanced
by augering and Shelby tubes were gently hammered into
the soil to obtain relatively undisturbed soil samples. Tests
were carried out on the UDS to determine undrained shear
strength along with water content, unit weight and
classification of soil.
2. Akbar Pressuremeter (APMT)
The main body of the probe of the APMT as shown in
Figure 1 is made of high strength stainless steel. Its diameter
is 44.4 mm with a 305 mm long test section (L). With the
membrane in place, the outer diameter of the probe (D) is
48.2 mm. The L/D ratio is therefore 6.3. Both ends of the
main body are identical. One end is connected to the
pressure hose and the electrical cable by a re-usable
hydraulic fitting. A 45 stainless steel cone having a
maximum diameter of 50.8 mm (surface area 28.5 cm2) is
screwed to the other end. The main body has a 115 mm long
and 10 mm wide slot in the middle in Figure 1a for the
expansion arms assembly (Figure 2). A longitudinal hole of
8 mm diameter is drilled from one end (the end to which the
hydraulic coupling is connected) up to the central slot. This
hole houses the transducer wires and transmits the
pressurised gas, which inflates the membrane. The radial
grooves have been machined to allow the dry nitrogen gas
(N2) pressure to reach everywhere underneath the membrane
simultaneously. This allows the whole length of the
membrane to expand uniformly under uniform soil
conditions around the probe.
Fig. 1: Full-displacement pressuremeter probe.

Pak. J. Engg. & Appl. Sci. Vol. 6, Jan., 2010
28
Figure 2 shows the assembly of the expansion arms.
The arms, made of stainless steel, move outward about a
pivot point. The hair spring activates this outward
movement. At zero expansion of the membrane, the distance
between the outer surfaces of the arms is the same as that of
the main body (i.e. 44.4 mm) as shown in Figure 2(a). The
arms can move apart radially from 44.4 mm to a maximum
of 66 mm). This limit is reached when the part of arm-1
containing magnet 2 comes in contact with the projecting
part of the seat for the linear output Hall Effect Transducer
(HET), as shown in Figure 2(b). The expansion of arms is
about 45% according to this design. The HET has been glue
mounted on its seat, positioning it between the two magnets
located in arm-1. The expansion of the arms changes the
output of the HET mounted inside the arms as shown in
Figure 3. The HET is connected to the A/D data-logger at
the surface using an electrical cable, which passes through a
pressure hose. One end of the pressure hose is permanently
fixed to the pressuremeter probe while the other end is fixed to the gas-electric separator during in-situ testing. The gas-
electric separator separates the cable and the hose and a
pressure transducer fitted to it measures the gas pressure
applied during the membrane expansion.
The pressuremeter membrane consists of two layers.
The inner layer (2.20 mm thick) is made from Nitrile and is
reinforced by encasing with a (1.10 mm thick) Nylon cover.
The inside and outside diameters of the rubber membrane
are 31.75 and 38.35 mm respectively.
66
mm
Magnet 1
Magnet 2
Arm 1
Arm 2
Hair springHall effect
transducer (HET)
Hole for pin
(pivot)
(a) At zero expansion of membrane
Seat for
HET
(b) Maximum limit of arms expansion
44
.4 m
m
Fig. 2: Expansion arms [6].

Characterization of an Artificially Prepared Cohesive Soil Bed
29
Fig. 3: A typical calibration data plot for the HET in the APMT
y = 0.5278x
R 2 = 0.9998
0
500
1000
1500
2000
2500
0 1000 2000 3000 4000
Change in pressure transducer voltage, mV
Pre
ssu
re,
kP
a
Fig.4: A typical calibration data plot for pressure transducer.
Pak. J. Engg. & Appl. Sci. Vol. 6, Jan., 2010
30
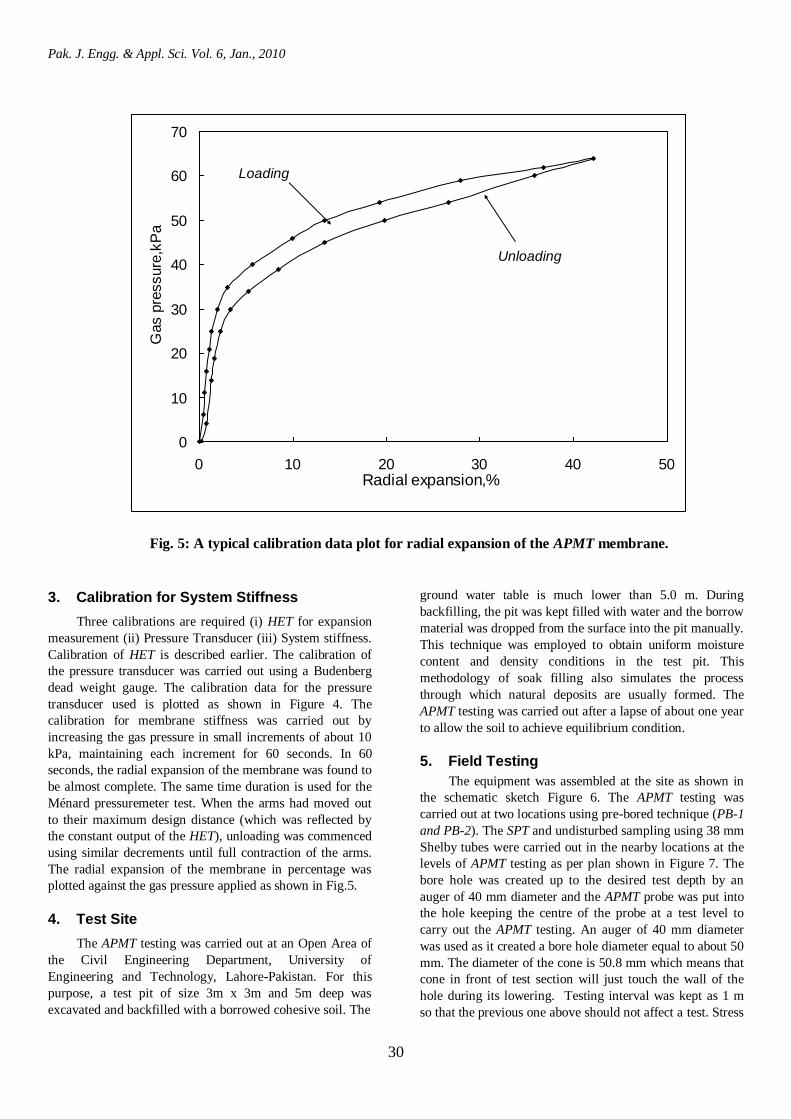
3. Calibration for System Stiffness
Three calibrations are required (i) HET for expansion
measurement (ii) Pressure Transducer (iii) System stiffness.
Calibration of HET is described earlier. The calibration of
the pressure transducer was carried out using a Budenberg
dead weight gauge. The calibration data for the pressure
transducer used is plotted as shown in Figure 4. The
calibration for membrane stiffness was carried out by
increasing the gas pressure in small increments of about 10
kPa, maintaining each increment for 60 seconds. In 60
seconds, the radial expansion of the membrane was found to
be almost complete. The same time duration is used for the
Ménard pressuremeter test. When the arms had moved out
to their maximum design distance (which was reflected by
the constant output of the HET), unloading was commenced
using similar decrements until full contraction of the arms.
The radial expansion of the membrane in percentage was
plotted against the gas pressure applied as shown in Fig.5.
4. Test Site
The APMT testing was carried out at an Open Area of
the Civil Engineering Department, University of
Engineering and Technology, Lahore-Pakistan. For this
purpose, a test pit of size 3m x 3m and 5m deep was
excavated and backfilled with a borrowed cohesive soil. The
ground water table is much lower than 5.0 m. During
backfilling, the pit was kept filled with water and the borrow
material was dropped from the surface into the pit manually.
This technique was employed to obtain uniform moisture
content and density conditions in the test pit. This
methodology of soak filling also simulates the process
through which natural deposits are usually formed. The
APMT testing was carried out after a lapse of about one year
to allow the soil to achieve equilibrium condition.
5. Field Testing
The equipment was assembled at the site as shown in
the schematic sketch Figure 6. The APMT testing was
carried out at two locations using pre-bored technique (PB-1
and PB-2). The SPT and undisturbed sampling using 38 mm
Shelby tubes were carried out in the nearby locations at the
levels of APMT testing as per plan shown in Figure 7. The
bore hole was created up to the desired test depth by an
auger of 40 mm diameter and the APMT probe was put into
the hole keeping the centre of the probe at a test level to
carry out the APMT testing. An auger of 40 mm diameter
was used as it created a bore hole diameter equal to about 50
mm. The diameter of the cone is 50.8 mm which means that
cone in front of test section will just touch the wall of the
hole during its lowering. Testing interval was kept as 1 m
so that the previous one above should not affect a test. Stress
0
10
20
30
40
50
60
70
0 10 20 30 40 50Radial expansion,%
Gas p
ressure
,kP
a
Unloading
Loading
Fig. 5: A typical calibration data plot for radial expansion of the APMT membrane.

Characterization of an Artificially Prepared Cohesive Soil Bed
31
Clamping nuts
(4)
Dummy cone (1)
Friction reducer/
adaptor (5)
Pressure regulators (13)
Jack
Pressure hose and
electric cable (7)Push rods (8)
Laptop
computer
(18)
12 V battery (16)
Ground surface
A/D convertor
(17)
12 V
HET
To data
logger
10 bars
max.
40 bars
max.
Pressure(6)
Pressuremeter
module (2)
Pressure source
(14)
Clamping
nut (3)
Electronics box (15)
(12)
Pressure transducer
(11)Gas electric
separator
(10)
(9)
Fig. 6: The APMT equipment on site assembly [6].
Fig. 7: Field testing plan.
Pak. J. Engg. & Appl. Sci. Vol. 6, Jan., 2010
32
0
50
100
150
200
250
300
350
0 5 10 15 20 25 30 35 40 45 50
Cavity strain, %
Pre
ssure
, kP
a
Field data corrected for
membrane
stiffness. Only data points
prior to a load
increment/decrement are
plotted.
Field data
pL
Fig. 8: Typical applied pressure-cavity strain curves at 2.0 m depth.
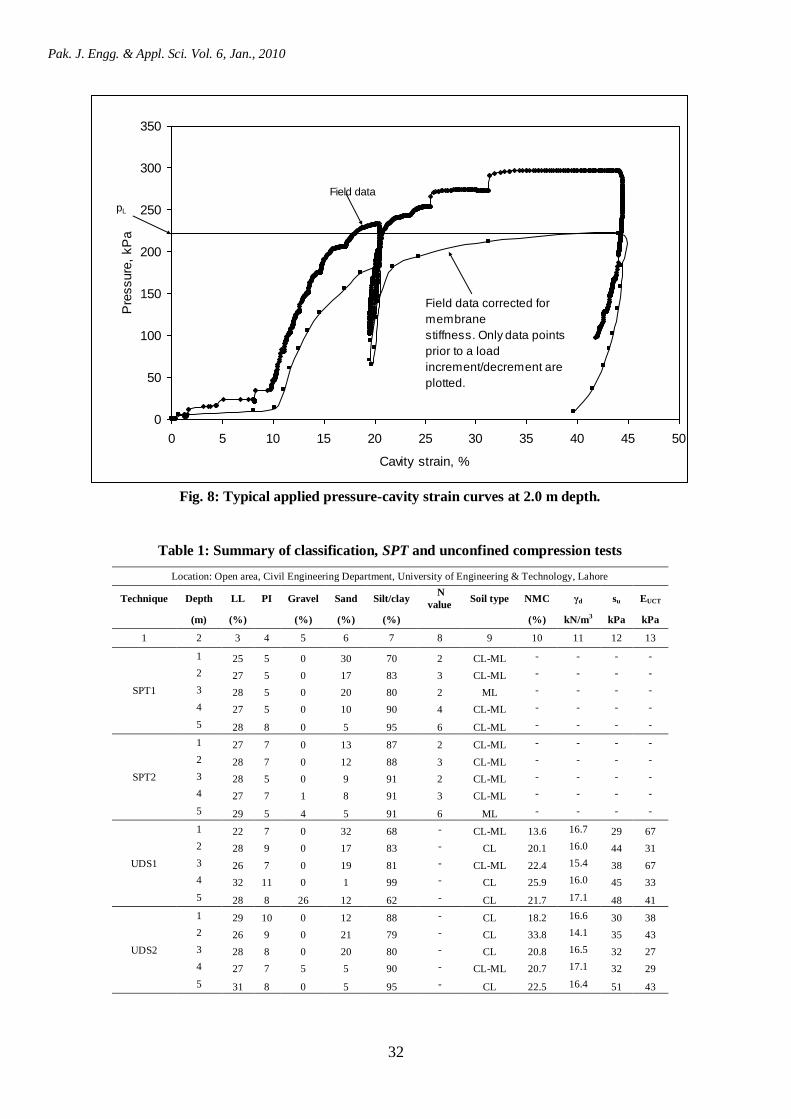
Table 1: Summary of classification, SPT and unconfined compression tests
Location: Open area, Civil Engineering Department, University of Engineering & Technology, Lahore
Technique Depth LL PI Gravel Sand Silt/clay N
value Soil type NMC γd su EUCT
(m) (%) (%) (%) (%) (%) kN/m3 kPa kPa
1 2 3 4 5 6 7 8 9 10 11 12 13
SPT1
1 25 5 0 30 70 2 CL-ML - - - -
2 27 5 0 17 83 3 CL-ML - - - -
3 28 5 0 20 80 2 ML - - - -
4 27 5 0 10 90 4 CL-ML - - - -
5 28 8 0 5 95 6 CL-ML - - - -
SPT2
1 27 7 0 13 87 2 CL-ML - - - -
2 28 7 0 12 88 3 CL-ML - - - -
3 28 5 0 9 91 2 CL-ML - - - -
4 27 7 1 8 91 3 CL-ML - - - -
5 29 5 4 5 91 6 ML - - - -
UDS1
1 22 7 0 32 68 - CL-ML 13.6 16.7 29 67
2 28 9 0 17 83 - CL 20.1 16.0 44 31
3 26 7 0 19 81 - CL-ML 22.4 15.4 38 67
4 32 11 0 1 99 - CL 25.9 16.0 45 33
5 28 8 26 12 62 - CL 21.7 17.1 48 41
UDS2
1 29 10 0 12 88 - CL 18.2 16.6 30 38
2 26 9 0 21 79 - CL 33.8 14.1 35 43
3 28 8 0 20 80 - CL 20.8 16.5 32 27
4 27 7 5 5 90 - CL-ML 20.7 17.1 32 29
5 31 8 0 5 95 - CL 22.5 16.4 51 43
Characterization of an Artificially Prepared Cohesive Soil Bed
33
increment controlled tests were carried out, which is a
common procedure for testing with self-boring
pressuremeter, full-displacement pressuremeter [10] and the
Ménard pressuremeter. The pressure increments of about 25
kPa each were maintained for 1 minute with data recorded at
every 1 second. The unloading was carried out at an
expansion of about 45% of the initial cavity size (as arms
can not move beyond this cavity strain). An unload-reload
cycle was also included during loading in each test in order
to estimate the shear modulus. Figure 8 shows a typical
applied pressure-cavity strain curves at 2.0 m depth.
6. Laboratory Testing
The following tests were carried out on undisturbed
and disturbed soil samples to determine the strength,
stiffness and classification of soil:
Unconfined Compression Testing (ASTM D2166)
Grain Size Analysis (ASTM D422)
Liquid Limit Test (ASTM D4318)
Plastic Limit Test (ASTM D4318)
Table 1 presents a summary of laboratory test results.
LL values range from 22 to 32 % and PI values from 5 to11
%. The percentages of gravel, sand and silt/clay in different
samples fall between 0 to 4 %, 1 to 32 % and 62 to 95 %
respectively. On the basis of classification tests, the soil type
ranges from low plastic lean clay (CL) to sandy silty clay
(CL-ML). The natural moisture content (NMC) values are ranging from 13.6 to 33.8 %, bulk unit weight (γb) values
from 18.8 to 20.8 kN/m3 and undrained shear strength (su)
values from 29 to 51 kPa.
7. Analysis of Pressuremeter Data
Figure 8 shows plots of the applied pressure and cavity
strain data (uncorrected) and the same corrected for the
membrane stiffness for a test at 2.0 m depth. The corrected
curve shows only the data points prior to a load
increment/decrement/
The hole diameter is created greater than the diameter
of the probe by about 2.6 mm. At the start of a test, the
membrane leaves the body of the probe at point B as shown
in Figure 9. The pressure (corrected for the stiffness of the
membrane) at point B, denoted by pA, is required to
overcome pressure around the probe due to water/mud in the
borehole. The membrane then expands from points B to C
until it is in contact with the cavity wall. The applied pressure between points C to D is insufficient to cause any
significant strain within the soil. From points D to E, it is
likely that the soil elements close to the membrane are
loaded elastically. This elastic behaviour is due to the
unloading that takes place during boring the hole. At point
E, soil elements close to the membrane reach yield and start
behaving plastically. During this stage, soil elements at
various radial distances from the probe are in different
stages. Those close to the probe are at failure and those at
some distance from the probe are at the in-situ state [11].
Between these two extreme states are the plastic and elastic
states.
The pressure at the start of the elastic yielding is
denoted by ph. Point E shows the on-set of the plastic
yielding and the corresponding pressure is written as pE. The
lift-off pressure, pF corresponds to the point on the pressure
axis where tangents to the elastic part and initial part of the
yield curve intersect.
App
lied
pres
sure
Cavity strain
pA
A
BC
ph
pE
Expansion of membrane due to
oversized cavity
Elastic
strain in soil
Plastic
strain in soilD
E
Fig. 9: An ideal stress-strain curve for the APMT.
Pak. J. Engg. & Appl. Sci. Vol. 6, Jan., 2010
34
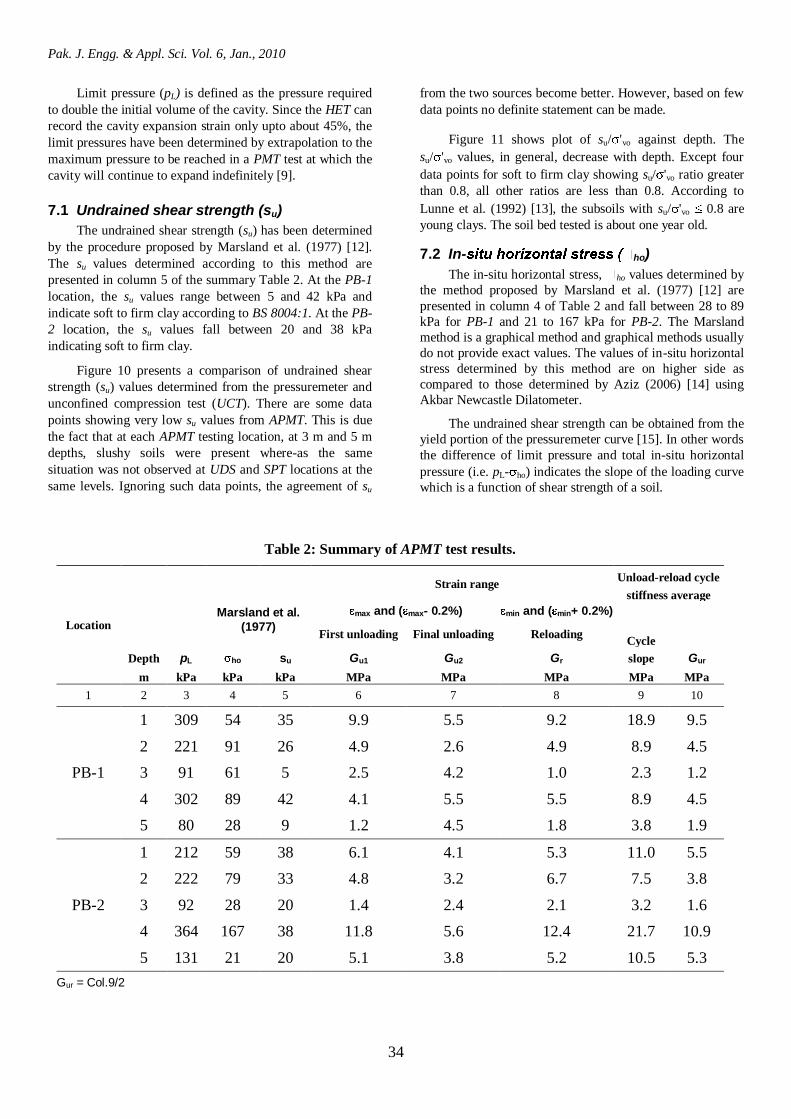
Limit pressure (pL) is defined as the pressure required
to double the initial volume of the cavity. Since the HET can
record the cavity expansion strain only upto about 45%, the
limit pressures have been determined by extrapolation to the
maximum pressure to be reached in a PMT test at which the
cavity will continue to expand indefinitely [9].
7.1 Undrained shear strength (su)
The undrained shear strength (su) has been determined
by the procedure proposed by Marsland et al. (1977) [12].
The su values determined according to this method are
presented in column 5 of the summary Table 2. At the PB-1
location, the su values range between 5 and 42 kPa and
indicate soft to firm clay according to BS 8004:1. At the PB-
2 location, the su values fall between 20 and 38 kPa
indicating soft to firm clay.
Figure 10 presents a comparison of undrained shear
strength (su) values determined from the pressuremeter and
unconfined compression test (UCT). There are some data
points showing very low su values from APMT. This is due
the fact that at each APMT testing location, at 3 m and 5 m
depths, slushy soils were present where-as the same
situation was not observed at UDS and SPT locations at the
same levels. Ignoring such data points, the agreement of su
from the two sources become better. However, based on few
data points no definite statement can be made.
Figure 11 shows plot of su/ 'vo against depth. The
su/ 'vo values, in general, decrease with depth. Except four
data points for soft to firm clay showing su/ 'vo ratio greater
than 0.8, all other ratios are less than 0.8. According to
Lunne et al. (1992) [13], the subsoils with su/ 'vo 0.8 are
young clays. The soil bed tested is about one year old.
7.2 In- ho)
The in-situ horizontal stress, ho values determined by
the method proposed by Marsland et al. (1977) [12] are
presented in column 4 of Table 2 and fall between 28 to 89
kPa for PB-1 and 21 to 167 kPa for PB-2. The Marsland
method is a graphical method and graphical methods usually
do not provide exact values. The values of in-situ horizontal
stress determined by this method are on higher side as
compared to those determined by Aziz (2006) [14] using
Akbar Newcastle Dilatometer.
The undrained shear strength can be obtained from the
yield portion of the pressuremeter curve [15]. In other words
the difference of limit pressure and total in-situ horizontal
pressure (i.e. pL- ho) indicates the slope of the loading curve
which is a function of shear strength of a soil.
Table 2: Summary of APMT test results.
Location
Strain range
Unload-reload cycle
stiffness average
Marsland et al. max and ( max- 0.2%) min and ( min+ 0.2%)
(1977)
First unloading Final unloading Reloading
Cycle
Depth pL ho su Gu1 Gu2 Gr slope Gur
m kPa kPa kPa MPa MPa MPa MPa MPa
1 2 3 4 5 6 7 8 9 10
1 309 54 35 9.9 5.5 9.2 18.9 9.5
2 221 91 26 4.9 2.6 4.9 8.9 4.5
PB-1 3 91 61 5 2.5 4.2 1.0 2.3 1.2
4 302 89 42 4.1 5.5 5.5 8.9 4.5
5 80 28 9 1.2 4.5 1.8 3.8 1.9
1 212 59 38 6.1 4.1 5.3 11.0 5.5
2 222 79 33 4.8 3.2 6.7 7.5 3.8
PB-2 3 92 28 20 1.4 2.4 2.1 3.2 1.6
4 364 167 38 11.8 5.6 12.4 21.7 10.9
5 131 21 20 5.1 3.8 5.2 10.5 5.3
Gur = Col.9/2

Characterization of an Artificially Prepared Cohesive Soil Bed
35
0
10
20
30
40
50
60
0 10 20 30 40 50 60
Undrained shear strength (UCT ), kPa
Un
dra
ine
d s
hea
r st
ren
gth
(AP
MT), K
Pa
UDS1-PB1
UDS2-PB2
Fig. 10: Comparison of undrained shear strength from PMT and laboratory.
0
1
2
3
4
5
6
0 0.5 1 1.5 2 2.5
su / σ'v o
De
pth
, m
PMT
UCT
Power
(PMT)
Fig,11: Profiles of su / σ'vo vs depth.

Pak. J. Engg. & Appl. Sci. Vol. 6, Jan., 2010
36
Figure 12 shows a good agreement of undrained shear
strength values against (pL- ho). The general trend of the
plot, represented by the following equation, is increase in
strength with increase in the difference of pressures:
hoLu ps 2037.0 (1)
Amar and Jézéquel (1972) [16] have reported
coefficient 0.1818 on the right hand side of equation (1) for
soft to firm clays.
7.3 Shear modulus (G)
Shear modulus (G) was determined in a number of
ways from the stress-strain curve. The secant shear modulus
values calculated from the two unloading curves over a
strain range of 0.2% (denoted by Gu1 and Gu2) are given in
columns 6 and 7 of Table 2. The reloading moduli values
(Gr) for the same strain range are given in column 8 of Table
2 .The average shear modulus values [17] determined from
the slope of the chord of an unloading-reloading cycle
(written as Gur) are shown in column 10 of the summary
Table 2. The average shear modulus represents stiffness of a
number of elements radiating from the probe, all being at
different strain.
The profiles of shear moduli values determined from
different methods are shown in Figure 13. The shear moduli
values determined from different methods at the same level
are different as expected, however, an increasing trend of the
shear moduli values with depth can be seen from the figure.
In general, the values lie between the lower bound and upper
bound as shown in Figure 13. The values in the lower and
upper bound vary from 1.8 MPa to 6.2 MPa. An average
trend of shear modulus values is shown by the following
equation:
34.0 DG (2)
where D is the depth in m and G is in MPa.
If the Poisson’s ratio, is known the modulus of
elasticity, E can be determined using the following relation:
GE )1(2 (3)
Figure 14 shows the variation of the elemental secant
shear modulus (final unloading) normalised with respect to
the horizontal effective stress against the current cavity
strain (elemental) for the PMT data. The effective horizontal
stress is taken as the effective applied pressure at the start of
unloading since this represents the maximum pressure to
which the soil is loaded prior to unloading. The current
cavity strain, curr, in Figure 14 is defined as:
m
mscurr
1 (4)
where s is the elemental cavity strain at any point of the
y = 0.2037x
R 2 = 0.9484
0
10
20
30
40
50
0 50 100 150 200 250 300
p L- σ ho, kPa
su, kP
a
Fig. 12: Comparison between su and (pL - ho).

Characterization of an Artificially Prepared Cohesive Soil Bed
37
cycle and m is the maximum cavity strain during unloading for Gu.
The results in Figure 14 show that the stiffness
responses show more scatter at small strains (below about
0.3%). The scatter is reduced with strain. The early scatter
may be due to consolidation taking place at the start of
unloading. The large scatter in the small strain secant
moduli values has also been reported by Muir Wood (1990)
[17]. According to him, as it is difficult to identify precisely
the start of an unloading or reloading phase, these effects
may tend to obscure the small strain behaviour of the soil.
Figure 15 shows a plot of the strain amplitude against
the cycle shear modulus (Gur) normalised by the applied
pressure, (p) at the start of unloading. The plot shows that
the normalized moduli are a function of the strain amplitude
as expected, with a slight lower normalised modulus at
higher strain amplitude. Houlsby and Nutt (1993) [18] report
similar observations for the unload-reload shear modulus.
0
1
2
3
4
5
6
0 5 10 15 20
Shear modulus, G, MPa
Depth
, m
First unloading (PB-1)
First unloading (PB-2)
Final unloading (PB-1)
Final unloading (PB-2)
Reloading (PB-1)
Reloading (PB-2)
Unload-reload cycle PB-1)
Unload-reload cycle (PB-2)
Upper bound
Lower bound
Average
Equation of average line
G = 0.4 D + 3
Fig. 13: Shear moduli profiles.
0
5
10
15
20
25
30
35
40
45
0.10 1.00 10.00
Current cavity strain, %
G/p
'
p' = total horizontal stress at the start of unloading
Fig. 14: Variation in elemental shear modulus with strain.

Pak. J. Engg. & Appl. Sci. Vol. 6, Jan., 2010
38
8. Correlations between Different Parameters
Using the available data correlations between different
parameters have been developed by using the least square
method. The developed correlations along with possible
comments are given below:
PMT shear modulus vs. SPT N values
The PMT interpreted shear moduli values, GPMT, and N
values of SPT for the same depth have been plotted in
Figure 16. The general trend of the data is a linear increase
in shear modulus with increase in N. The variation between
these parameters can be represented by the following
equation:
y = 4.7487x-0.3688
R2 = 0.3928
0
10
20
30
40
50
0.001 0.010 0.100
G/p
'
Fig. 15: Normalised shear modulus plotted against strain amplitude.
y = 0.9281x
R2 = 0.9127
0
1
2
3
4
5
6
0 1 2 3 4 5 6 7
SPT N value
PM
T s
he
ar
mo
du
lus, M
Pa
Fig. 16: Correlation between PMT shear modulus and SPT N value.

Characterization of an Artificially Prepared Cohesive Soil Bed
39
y = 3.7542x + 26.686
R2 = 0.8355
Ajayi relationship
y = 1.39x + 74.2
0
10
20
30
40
50
60
70
80
90
0 1 2 3 4 5 6 7
SPT N value
su,
kP
a
Fig. 17: Correlation between undrained shear strength and SPT N value.
y = 77.552x + 18.203
R2 = 0.3945
0
100
200
300
400
500
600
0 1 2 3 4 5 6 7
SPT N value
pL, kP
a
Fig. 18: Correlation between PMT limit pressure and SPT N value.
Pak. J. Engg. & Appl. Sci. Vol. 6, Jan., 2010
40
NGPMT 9281.0 (5)
where PMTG is in MPa.
For most clay soils υ = 0.4-0.5 [2]. Taking υ = 0.45,
equation 3 yields GE 9.2 . By substituting the proposed
value of shear modulus given by equation 5, this relation
reduces to the following equation:
NE 69.2 (6)
where E is in MPa.
For the given values of N, the value of E ranges from
5.38-16.14 MPa for soft to firm clays. Bowles (1996) [2]
suggests a range of 5-25 MPa for soft clays.
Undrained shear strength vs. SPT N values
Figure 17 presents plots of undrained shear strength
against SPT N values. The general trend is linear increase in
undrained shear strength with increase in SPT N values. A
regression analysis yields the following equation:
686.267542.3 Nsu (7)
where su is in kPa.
A comparison of the proposed relationship given by
equation 7, and that by Ajayi et al. (1988) [19] is provided
in Figure 17. The data points plot on or near straight line
whose slope is different from that of Ajayi et al. The
difference in slope may be due to the fact that Ajayi’s
relationship is for soils ranging from CL to CH and the
proposed relationship is for CL to CL-ML
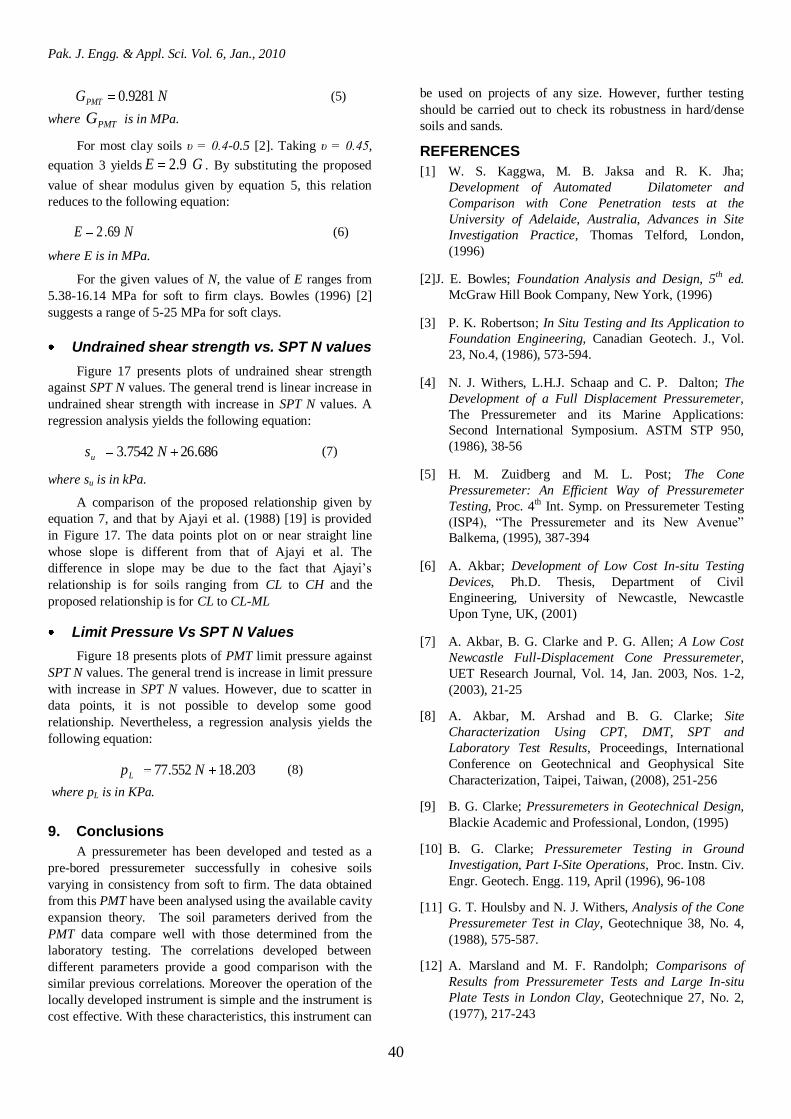
Limit Pressure Vs SPT N Values
Figure 18 presents plots of PMT limit pressure against
SPT N values. The general trend is increase in limit pressure
with increase in SPT N values. However, due to scatter in
data points, it is not possible to develop some good
relationship. Nevertheless, a regression analysis yields the
following equation:
203.18552.77 NpL (8)
where pL is in KPa.
9. Conclusions
A pressuremeter has been developed and tested as a
pre-bored pressuremeter successfully in cohesive soils
varying in consistency from soft to firm. The data obtained
from this PMT have been analysed using the available cavity
expansion theory. The soil parameters derived from the
PMT data compare well with those determined from the
laboratory testing. The correlations developed between
different parameters provide a good comparison with the
similar previous correlations. Moreover the operation of the
locally developed instrument is simple and the instrument is
cost effective. With these characteristics, this instrument can
be used on projects of any size. However, further testing
should be carried out to check its robustness in hard/dense
soils and sands.
REFERENCES
[1] W. S. Kaggwa, M. B. Jaksa and R. K. Jha;
Development of Automated Dilatometer and
Comparison with Cone Penetration tests at the
University of Adelaide, Australia, Advances in Site
Investigation Practice, Thomas Telford, London,
(1996)
[2]J. E. Bowles; Foundation Analysis and Design, 5th ed.
McGraw Hill Book Company, New York, (1996)
[3] P. K. Robertson; In Situ Testing and Its Application to
Foundation Engineering, Canadian Geotech. J., Vol.
23, No.4, (1986), 573-594.
[4] N. J. Withers, L.H.J. Schaap and C. P. Dalton; The
Development of a Full Displacement Pressuremeter,
The Pressuremeter and its Marine Applications:
Second International Symposium. ASTM STP 950,
(1986), 38-56
[5] H. M. Zuidberg and M. L. Post; The Cone
Pressuremeter: An Efficient Way of Pressuremeter
Testing, Proc. 4th Int. Symp. on Pressuremeter Testing
(ISP4), “The Pressuremeter and its New Avenue”
Balkema, (1995), 387-394
[6] A. Akbar; Development of Low Cost In-situ Testing
Devices, Ph.D. Thesis, Department of Civil
Engineering, University of Newcastle, Newcastle
Upon Tyne, UK, (2001)
[7] A. Akbar, B. G. Clarke and P. G. Allen; A Low Cost
Newcastle Full-Displacement Cone Pressuremeter,
UET Research Journal, Vol. 14, Jan. 2003, Nos. 1-2,
(2003), 21-25
[8] A. Akbar, M. Arshad and B. G. Clarke; Site
Characterization Using CPT, DMT, SPT and
Laboratory Test Results, Proceedings, International
Conference on Geotechnical and Geophysical Site
Characterization, Taipei, Taiwan, (2008), 251-256
[9] B. G. Clarke; Pressuremeters in Geotechnical Design,
Blackie Academic and Professional, London, (1995)
[10] B. G. Clarke; Pressuremeter Testing in Ground
Investigation, Part I-Site Operations, Proc. Instn. Civ.
Engr. Geotech. Engg. 119, April (1996), 96-108
[11] G. T. Houlsby and N. J. Withers, Analysis of the Cone
Pressuremeter Test in Clay, Geotechnique 38, No. 4,
(1988), 575-587.
[12] A. Marsland and M. F. Randolph; Comparisons of
Results from Pressuremeter Tests and Large In-situ
Plate Tests in London Clay, Geotechnique 27, No. 2,
(1977), 217-243

Characterization of an Artificially Prepared Cohesive Soil Bed
41
[13] T. Lunne, S. Lacasse and N. S. Rad; General Report:
SPT, CPT, Pressuremeter Testing and Recent
Developments in In-Situ Testing, Proceedings, 12th
International Conference on Soil Mechanics and
Foundation Engineering, Vol. 4, Rio de Janeiro,
(1992), 2339-2403
[14] M. Aziz; Calibration of Newcastle Dilatometer in
Cohesive Soil, M.Sc. Thesis, Department of Civil
Engineering, University of Engineering and
Technology, Lahore, Pakistan, (2006)
[15] G. E. Bauer and A. Tanaka; Penetration Testing of a
Desiccated Clay Crust, Penetration Testing, ISOPT-
1, De Ruiter (ed.) Balkema, Rotterdam, (1988), 477-
488
[16] S. Amar, and J. F. Jéséquel; Essais en place et en
laboratoire sur sols cohérent comparaison des
résultats, Bull.de Liaison de LCPC, Paris, No. 58,
(1972), 97-108
[17] D.Muir-Wood; Strain Dependent Moduli and
Pressuremeter Tests, Geotechnique, 40(26), (1990),
509-512
[18] G. T. Houlsby and N. R. F. Nutt; Development of the
Cone Pressuremeter, Predictive Soil Mechanics, Proc.
Wroth Memorial Symp., Oxford, (1993), 254-271
[19] L. A. Ajayi et al.; Penetration Testing in Tropical
Lateritic and Residual Soils- Nigerian Experience,
Penetration Testing, ISOPT-1, De Ruiter (ed.),
Balkema, Rotterdam (1988), 315-328


