
77 Chapter 3
3.
Chapter 3
Characterization of PVC/PMMA Blends
Chapter 3
Abstract
This chapter gives an account of the characteristics of PVC/PMMA blend in
different weight proportion (70/30, 50/50 and 30/70) which is prepared by solution
cast technique. These blends are investigated by spectroscopic techniques like
FTIR, UV-Vis and RAMAN. Mechanical, Thermal and Morphological properties
are investigated. The results obtained from different characterization techniques
show the blending effect of different properties. These properties of PVC/PMMA
blends are correlated with spectroscopic investigation.

78 Introduction
3.1. Introduction
PVC is one of the most important and widely used thermoplastic polymers because of its well-
known performance and properties like low cost, good processability, chemical resistance and
low flammability. The modification of polyvinyl chloride (PVC) to obtain different PVC
copolymers and blends is of great significance to the plastics industry. The aim for modifying
PVC by blending is to manufacture new PVC polymers that combine desired physical properties
at low cost. Blending technique has gained a lot of commercial as well as academic importance.
In addition to blending, we can also improve stiffness by adding inorganic dopant materials
whereas using rubbery phase improves toughness of the polymers.
Polymers and their blends are often processed in the melt, which makes them thermally stable.
Several studies show that blending can alter the decomposition of individual polymers [1-4].PVC
has low thermal stability which is its major drawbacks. Several polymers are mixed with PVC as
plasticizers or processing aids. PMMA is used as processing aids for PVC [5]. I. C. Mc Neil et.
al. [6] studied PVC/PMMA mixtures and showed that methacrylate (MMA) monomer formed at
a much lower temperature than that of PMMA depolymerization when heated alone. D. Braun et
al [7, 8] studied the thermal degradation of PVC with PMMA have shown that at higher
concentrations of PMMA exhibit some stabilization of PVC, while lower concentrations leads to
destabilization. Naima Belhaeche- Bensemra et. al. [9] showed that PMMA exerted a stabilizing
effect on the thermal degradation of PVC by reducing de-hydro chlorination.
Miscibility and phase behavior of polymer blends is essential for controlling the properties of
polymer blends. PVC/ PMMA blends has been studied by different approaches by different
workers, it was well described by Chao Zhoul et.al.[10], Schurer [11] reported that PVC/ PMMA
are miscible only in blends having PVC contents greater than 60%. Rupa Chakrabarti et. al. [12]

79 Introduction
studied physical and mechanical properties of PVC/PMMA blend and suggested that a
substantial increase in toughness accompanied with unusual increase in modulus and ultimate
tensile strength occurred after initial stages of PMMA incorporation compared to pure PVC.
Wlochowicz and Janicki [13] concluded that PVC / PMMA blends at all compositions are
wholly amorphous two-phase system. Varada [14] investigated the miscibility of PVC with
PMMA by ultrasonic and refractive index method. They pointed out that PVC and PMMA are
miscible in all compositions. Kamira Aouachria and Naima Belhaneche-Bensemra [15] studied
about miscibility of PVC/PMMA blend. Shen and Torkelson [16] observed that PVC/ PMMA
blends are miscible at all compositions, if they are prepared between Tg and their lower critical
solution temperature. This discrepancy in the miscibility may be due to the different methods
used for sample preparation and polymers used are having different molecular weights.
In the past recent years, the importance of using PVC/PMMA blend polymer electrolytes was
used by many researchers. S. Ramesh et.al. [17] studied PVC/PMMA blend based polymer
electrolytes and reported about interaction of PVC/PMMA blend with lithium triflate salt,
ethylene carbonate (EC), dibutyl phthalate (DBP) plasticizers and also with silica. Vijay V.
Soman and Deepali S. Kelkar [18] have suggested about the interaction among Camphor
Sulphonic Acid (CSA), PVC, PMMA and PVC/PMMA blend in different weight percentage.
PMMA might be expected to counter balance the fall in mechanical properties of PVC is
attributed to the disruption in molecular packing of stiff and rigid chains of PVC[18].
The PVC and PMMA blend is a well known system in which hydrogen bonding type of specific
interaction involving α-hydrogen of PVC and the carbonyl group of PMMA is expected [19].

80 Introduction
The matrix structure of the blend is different than pure polymers which in turn affects the
physical properties of the blend including the mechanical properties. Infrared spectroscopy is a
tool to find out the possible interaction between the polymer matrixes. Several researchers have
used this technique to study such interactions between polymers [20, 21].
Several research groups have reported the interaction by the study of shift of the peaks,
developments of new peaks, changes in shapes like changes in peak intensity, development of
shoulders in the existing peaks in the FTIR spectrum [22, 23]. In recent years, studies on optical
and electrical characteristics of polymers have fascinated much consideration in their application
in optical and electronic devices [24, 25]. Electrical and optical properties of polyvinyl alcohol
thin films doped with metal salts have been investigated by Abd et al. [26]. Refractive index is
an important optical parameter for the design of prisms, windows and optical fiber [27]. The
absorbance process plays an important role in the optical properties of polymers. From the
absorption spectra, it is possible to understand variation of molecular formation of polymer
structures.
In the present chapter we studied different properties of PVC/PMMA blends in different weight
percentage by different characterization techniques. We report evidence from Fourier Transform
Infrared (FTIR) Spectroscopy for hydrogen bonding type interaction between α-hydrogen of
PVC and carbonyl group of PMMA which supports earlier studies done by several researchers.
We have also studied some optical properties such as absorption coefficient, optical
(direct/indirect) energy band gap, Refractive Index, optical dielectric constant and constant B. In
addition, Mechanical Properties of Blends, Thermal Characteristics by Thermal Gravimetric
Analysis (TGA), and surface morphology by Scanning Electron Microscopy (SEM) are reported.

81 Results and Discussion
The effects of different blending weight percentage on these properties have been discussed and
behaviors of all properties are investigated.
3.2. Results and Discussion
3.2.1. FTIR Analysis
Infrared spectroscopy is a tool to find out the possible interaction between the two polymer
matrixes. The interaction can be studied by shift of the peaks, developments of new peaks,
changes in shapes like changes in peak intensity, development of shoulders in the existing peaks
in the FTIR spectrum. Complexation may shift the polymer peak frequencies. FTIR would be
sensitive both in situations where complexation has occurred in crystalline or amorphous phase
[28]. Figure 3.1 (a, b) shows the FTIR spectrum of Pure PVC, Pure PMMA and other polymer
Blends. FTIR-ATR spectrum reveals molecular interactions between PVC and PMMA. Different
Vibrational modes of Pure PVC, Pure PMMA and their Blends are described in Table 3.1. The
following characteristic frequencies, C- Cl stretching (834 cm-1
), Trans C-H wagging (957 cm-1
),
C-O stretching (1141 cm-1
), C-O-C stretching (1190 cm-1
), C-H anti symmetric stretching (1481
cm-1
), C=O stretching (1723 cm-1
) and -CH stretching(2911 cm-1
) shows a shift in the frequency
towards the higher frequency side. While the following characteristic frequencies, -CH2
deformation (1331 cm-1
), C-H rocking (1236 cm-1
) remains unchanged and the cis C-H wagging
(613 cm-1
), C-H symmetric stretching (1385 cm-1
) and -CH3 stretching + –CH2 Symmetric
Stretching (2951 cm-1
) shows a decrease in trend.
Rupa Chakrabarti et. al. [12] studied physical and mechanical properties of PVC/PMMA blend
and suggested, hydrogen bond interaction between C-Cl group of PVC and C=O group of
PMMA. So here also peak shifting are observed for C-Cl stretching group (834 cm-1
to 844 cm-1
)
towards higher wave number side and for C=O stretching group (1723 cm-1
to 1732 cm-1
)

82 Results and Discussion
Table 3.1 Assignment of different vibrational modes of PVC, PMMA and various Blends.
Vibrational Modes Peak
No.
Pure
Sample
Wave number (cm-1
)
Sample (wt %) 90/10 80/20 60/40 40/60
-CH stretching 1
PV
C
2911 2915 2920 2915 2911
-CH2 deformation 2 1331 1328 1331 1332 1332
C-H rocking 3 1236 1233 1236 1236 1237
Trans C-H wagging 4 957 957 960 962 964
C-Cl stretching 5 834 832 844 841 841
cis C-H wagging 6 613 605 608 616 618
-CH3 stretching 7
PM
MA
2996 3004 2993 2992 2994
-CH3 stretching + –CH2
Symmetric Stretching 8 2951 2961 2946 2950 2950
–CH2 Anti Symmetric
Stretching 9 2851 2852 2852 2842 2841
C=O stretching 10 1723 1737 1732 1727 1726
C-H anti symmetric stretching 11 1481 1495 1495 1483 1483
C-H deformation 12 1434 1426 1434 1434 1434
C-H symmetric stretching 13 1385 1371 1371 1384 1385
-CH2 twist 14 1238 1233 1236 1237 1237
C-O-C stretching 15 1190 1195 1194 1191 1191
C-O stretching 16 1141 1150 1149 1146 1145
C-C stretching 17 985 985 960 986 986

83 Results and Discussion
Figure 3.1 FTIR Spectra of pure PVC, pure PMMA and Their blends (a) in the range 600 –
2000 cm-1
(b) in the range 2500 – 3300 cm-1

84 Results and Discussion
towards higher wave number side, which clearly indicate the hydrogen bonding intermolecular
interaction between PVC and PMMA polymer chains. These peaks are shifted towards higher
wave number side which reveals increase in the strength of the bonds. S. Ramesh [17] has
reported the shift in the carbonyl absorption peak to higher wave number side from 1721 cm-1
to
1732 cm-1
. Our results also verify these results.
3.2.2. UV-Vis Analysis
The absorbance process plays an important role in the optical properties of polymers. From the
absorption spectra, it is possible to understand variation of molecular formation of polymer
structures. From the absorption spectra, (Figure 3.2 (a)), a sharp increase in absorption below 220
nm, which corresponds to π π* transitions of carbonyl groups in macromolecules is observed
[29]. The absorption edges were observed around 250 to 300 nm (Figure 3.2 (b)). A shift in band
edges toward the higher wavelengths with different absorption intensity for PVC doped PMMA
was observed. These shifts indicate the formation of inter/ intra bond between PVC and PMMA.
The direct optical energy gap, can be obtained from the plot of (αһν)2 versus һν (photon energy)
(Figure 3.2(c)), while indirect energy gap obtained from the plot of (αһν)1/2 versus һν (Figure
3.2(d)), is believed to be appropriate for the higher energy absorption (Eq. 2). The intercept on the
energy axis on extrapolating the linear portion of the curves to zero absorption value may be
interpreted as the value of the band gap. The various optical properties obtained for different
samples are listed in Table 3.2. These results are in consistence with FTIR results. Also, the shift
in absorption edge reflects the variation in the optical energy band gap. Absorption edge shifted
towards higher wavelength side as the PMMA content in PVC increases. It is clear that the
indirect optical energy band gap increases with increasing PMMA content. The existence and

85 Results and Discussion
variation of optical energy gap may be explained by invoking the occurrence of local cross
linking within the amorphous phase of PMMA and PVC.
Table 3.2 Variation of absorption edge and direct/indirect band gap with different blend
percentage
PVC/PMMA
blend percentage
Absorption edge
(ΔE) (eV)
Direct band
gap (Eg(Dir))
Indirect band
gap (Eg(Indir))
Pure PVC 3.91 4.09 3.65
80/20 4.05 4.21 3.92
60/40 4.11 4.24 4.05
40/60 4.19 4.30 4.15
Pure PMMA 4.42 4.46 4.31
Figure 3.2 Plot of a A sorptio oeffi ie t α vs Wavele gth λ , A sorptio oeffi ie t α vs Photon Energy ( , (c) ( )
2 vs , (d) ( )
1/2 vs
86 Results and Discussion
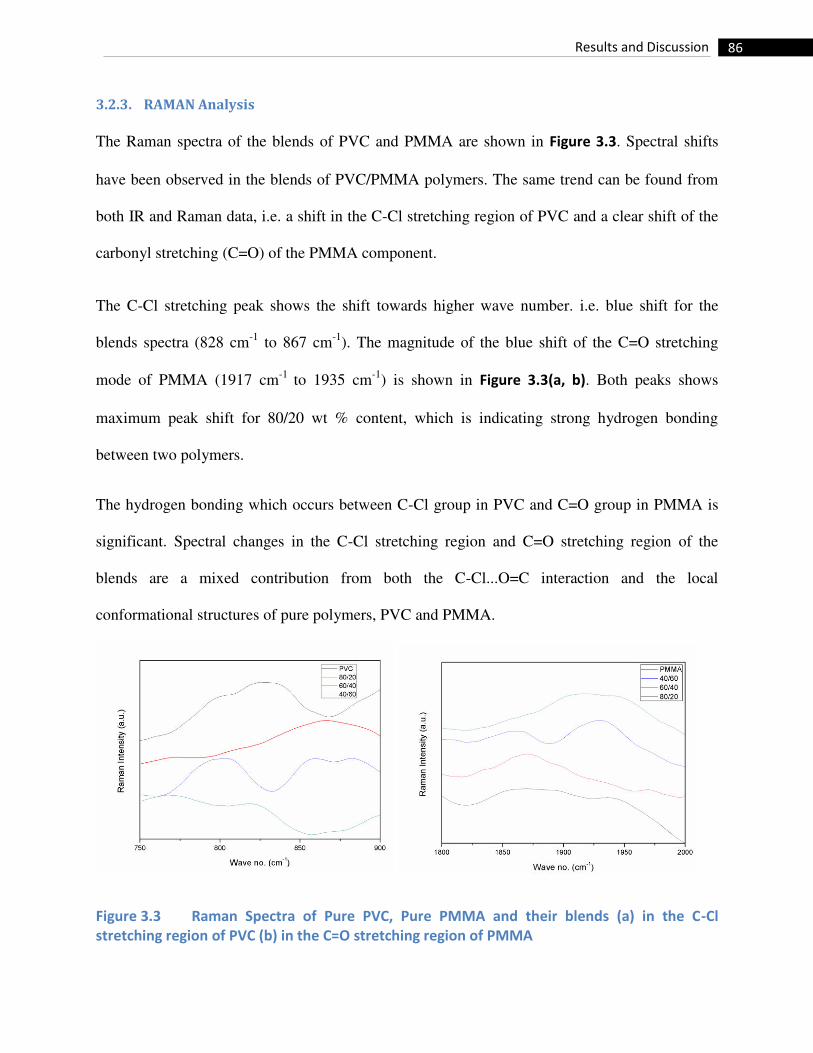
3.2.3. RAMAN Analysis
The Raman spectra of the blends of PVC and PMMA are shown in Figure 3.3. Spectral shifts
have been observed in the blends of PVC/PMMA polymers. The same trend can be found from
both IR and Raman data, i.e. a shift in the C-Cl stretching region of PVC and a clear shift of the
carbonyl stretching (C=O) of the PMMA component.
The C-Cl stretching peak shows the shift towards higher wave number. i.e. blue shift for the
blends spectra (828 cm-1
to 867 cm-1
). The magnitude of the blue shift of the C=O stretching
mode of PMMA (1917 cm-1
to 1935 cm-1
) is shown in Figure 3.3(a, b). Both peaks shows
maximum peak shift for 80/20 wt % content, which is indicating strong hydrogen bonding
between two polymers.
The hydrogen bonding which occurs between C-Cl group in PVC and C=O group in PMMA is
significant. Spectral changes in the C-Cl stretching region and C=O stretching region of the
blends are a mixed contribution from both the C-Cl...O=C interaction and the local
conformational structures of pure polymers, PVC and PMMA.
Figure 3.3 Raman Spectra of Pure PVC, Pure PMMA and their blends (a) in the C-Cl
stretching region of PVC (b) in the C=O stretching region of PMMA

87 Results and Discussion
3.2.4. Mechanical Analysis
Mechanical properties of PVC-PMMA polymer blend were carried out to study the Young’s
modulus (YM), Ultimate Tensile Strength (UTS), Stress at Peak load and Elongation at Break
(EB). The values of all mechanical parameters obtained for PVC/PMMA blends are higher than
the values of the Pure PVC except the blend of 10% of PMMA.
Young’s Modulus (YM) values corresponding to PMMA % is shown in Figure 3.4. The Figure 3.4
shows that PVC/PMMA blends exhibit lower YM to the extent of 10% of PMMA, beyond which
there is sudden increase in YM and it reaches maximum value for 20% of PMMA and after that
it again exhibits a decreasing trend. The values of Ultimate Tensile Strength (UTS) and Stress at
Peak load for PVC/PMMA blends are shown in Figure 3.4 corresponding to PMMA %. All these
values also exhibit minimum value at 10% of PMMA and then give maximum value at 20% of
PMMA. After 20% of PMMA, blend exhibit decreasing trend but their corresponding values of
such properties for different blends are quite high in comparison to pure PVC.
The breaking elongation of various blends of PVC/PMMA is shown in Figure 3.4, confirmed our
expectation. In this case there is a sudden jump in its values initially up to a level of 10%
PMMA. Beyond which there is a steady decrease in its values which also confirmed by a
decrease in Young’s Modulus (YM), Ultimate tensile strength (UTS) etc. The introduction of
PMMA into PVC increases the Mechanical properties such as Young’s Modulus (YM), Ultimate
Tensile Strength (UTS) and Stress at Peak load. The different Young’s Modulus (YM) values in
PVC blends are due to the difference in cross linking density provided by PMMA with different
weight fraction values.

88 Results and Discussion
Figure 3.4 Variation in Ultimate tensile strength, Stiffness, Young’s Modulus, stress at peak, Elongation at break, as a function of PMMA content
In general polymers having either a high degree of crystallinity, cross linking or rigid chain
exhibit a high strength and low extendibility, thereby giving a high Young’s Modulus (YM)
values, high stress at peak value and low elongation value [30]. PVC is a hard and strong
materials and it shows the dipole-dipole type attraction as a result of electrostatic interaction
between the chlorine atom of one chain and hydrogen atom of another. When PMMA is blended
with PVC these interaction are weakened by the presence of PMMA up to 10% of PVC. Beyond
10% of PMMA, we observed reversal behavior of PMMA affecting on PVC. So the mechanical
properties increase beyond 10% of PMMA and exhibit higher values at 20% of PMMA. Because

89 Results and Discussion
at 20% of PMMA, the interaction between PVC and PMMA molecules is higher and the dipole-
dipole attraction is also reaches at maximum value.
3.2.5. Thermal gravimetric Analysis
The thermo grams, Figure 3.5 (a) of PVC, PMMA, and its various blends with PMMA clearly
point out general increase in thermal stability of the blends. The increase in the onset temperature
of degradation for the blends in both the stages of degradations is a leading feature of the thermal
characteristics of such blends, which further increase with increasing proportion of PMMA. The
initial weight loss was observed for all samples due to moisture evaporation. The major weight
losses occurred in the range of 240 – 360 C for all the blend samples. The difference in the
thermal decomposition was observed clearly from derivative TG (DrTG) curve as shown in
Figure 3.5 (b).
The thermo gravimetric data for pure PVC, pure PMMA and their blend films are given in Table
3.3. From thermographs, initial weight loss occurs, which is attributed due to the presence of
moisture and impurities at the time of loading the samples [31]. After complete dehydration,
above 100 C, no further weight loss is observed for PVC, until irreversible decomposition
commenced at approximately around 253 C. and it shows a weight loss of 59.95%. The loss
may be due to the decomposition of PVC occurred [32]. When the temperature rose to 383C,
the samples exhibit a gradual weight loss of about 78.14%. This shows that the occurrence of
another irreversible decomposition. For PMMA, single decomposition peak around 378 C is
observed which start at 325 C and end at 426 C with almost weight loss 99.37%. PMMA
showed one main decomposition weight loss in this region.

90 Results and Discussion
Figure 3.5 (a) TG of pure PVC, pure PMMA and their blends (b) Derivative TG of pure PVC,
pure PMMA and their blends

91 Results and Discussion
For the 80/20 wt % PVC/PMMA blend film, the first decomposition took place at 266 C which
induced 46.66% weight loss and second decomposition occurred at 357 C which showed weight
loss of 78.35 %. This indicates that the film is stable up to 266 C. Since the first decomposition
of 80/20 wt % blend film occurred at higher temperature and bore a lower weight loss, this
proves that the thermal stability increased with addition of PMMA. Polymers of higher PVC
content and lower PMMA amount are proven to have a relatively good stability as they have the
first decomposition at higher temperature bearing a lower weight loss. From the table we
conclude that 80/20 wt % have maximum thermal stability. For 60/40 wt % and 40/60 wt %, the
first decomposition occurred at 248 C and 265 C with 47.83 % and 31.12 % weight loss
respectively and second decomposition took place at 356 C and 353 C with 95.13 % and 93.58
% weight loss.
Tp (peak temperature) of DrTG was a function of blend weight percentage. Tp was used as a
measure of thermal stability. The shift in Tp toward higher temperature showed thermal stability
of the blend was higher than the pure PVC. Tp was maximum for 80/20 wt%, so this blend was
more stable. This higher thermal stability was observed for 80/20 blend sample by TGA and
DrTG which was due to the intermolecular cross-linking reaction giving highly compatible
impact blend system [33]. TGA curves indicated the possibility of a strong hydrogen bond
intermolecular interaction between PVC and PMMA due to –CHCl groups of PVC and C=O
group of PMMA [34].

92 Results and Discussion
Table 3.3 TG and DrTG data of Pure PVC, PMMA and their blended samples
PVC/PMMA Temperature(C) Weight
loss
(%) Starting
Endin
g Tp
100/0 253 352 300 59.95
383 479 432 78.14
80/20 266 353 316 46.66
357 446 397 78.35
60/40 248 349 312 47.83
356 462 388 95.13
40/60 265 343 313 31.12
353 451 388 93.58
0/100 325 426 378 99.37
3.2.6. Scanning Electron Microscopy
SEM micrographs of pure PVC and Pure PMMA are shown in Figure 3.6 (a, b). The SEM
micrographs of brittle fractured surface of blends with various amount of PVC in PMMA are
shown in Figure 3.6 (c – d). These micrographs show almost discrete phases and clearly indicate
changed surface morphologies of the various blends compared to that of pure PVC. As the
amount of PMMA increases, the morphology of blends shows a uniform dispersion of PVC
particles in the blends. But for other than 80/20 wt% SEM micrograph shows agglomeration in
blend system, while 80/20 wt% have good homogeneity (Figure 3.6(c)). From this image one can
show, the blend exhibit uniform morphological feature without any phase separation. In phase
mixing homogeneity occurs at the lower level of PMMA (for 20% of PMMA), however, it is
absent in higher concentration of PMMA in PVC polymer matrix. This may probably be

93 Conclusions
recognized to the increase in mechanical and thermal properties as it shows the regularity in stiff
chain structure of PVC.
3.3. Conclusions
From the FTIR and Raman spectra, it is observed that strong hydrogen bond interaction between
C-Cl group of PVC and C=O group of PMMA occurs. For 80/20 wt% has maximum peak
shifting on higher wave number side is observed. Mechanical properties, mainly ultimate tensile
strength and young’s modulus, increase beyond 10% of PMMA and exhibit maximum value for
80/20 wt% of PVC/PMMA blend. From TGA, we observed that 80/20 wt% have maximum
thermal stability than pure polymers. SEM analysis showed that other than 80/20 wt%, all others
Figure 3.6 Scanning Electron Micrograph of (a) Pure PVC (b) Pure PMMA (c) 80/20
(d) 60/40 (e) 40/60

94 Conclusions
have agglomeration in blends system, while 80/20 wt% has good homogeneity. So from above
conclusion, In 80/20 wt% of PVC/PMMA exhibit good and enhanced properties than pure
constituents.

95 References
3.4. References
1. A. Kaminska, H. Kaczmarek, J. Thermal Anal., 29, 1017, 1984.
2. L. Goulet, R. E. Prud’homme, Eur. Polym. J., 22, 529, 1986.
3. E. J. Moskala, D. W. Lee, polym. Degr. Stab., 25, 11, 1984.
4. K. Kuzelova, Z. Vymazal, Eur. Polym. J., 35, 361, 1999.
5. M. Reyne, ― Les plastiques: Polymeres, transformations et applications‖, Edition
HERMES, Paris, P.96, 1992.
6. I. C. McNeil, D. Neil, Eur. Polym. J., 1970, 6, 143. [] I. C. McNeil, D. Neil, Eur. Polym.
J., 6, 569, 1970.
7. D. Braun, B. Böhringer, W. Knoll, N. Fisher, S. Kömmerling, Die Angew, Makromol.
Chem., 181, 23, 1990.
8. D. Braun, B. Böhringer, N. Eidam, N. Fisher, S. Kömmerling, Die Angew, Makromol.
Chem., 216, 1, 1994.
9. Naima Belhaeche- Bensemra, Belkacem Belabed, Abdelmalik Bedda, Macromol. Symp.,
180, 203-215, 2002.
10. Chao Zhoul et.al, Polymer Bulletin., 58, 979–988, 2007.
11. J. W. Schurer, A. de Boer and G. Challa, Polymer.,16 201, 1975.
12. Rupa Chakrabarti, Molay Das and Debabrata Chakraborty, Inc. J Appl Polym Sci., 93,
2721-2730, 2004.
13. A. Wlochowicz and J. Janicki, J. App. Poly. Sci., 38, 1469, 1989.
14. A. Varada Rajulu, R. Lakshminarayna Reddy and S. M. Raghavendra, Eur. Polym. J., 35,
1183, 1999.

96 References
15. Aouachria Kamira and Belhaneche-Bensemera Naima, Polymer Testing., 25, 1101–
1108, 2006.
16. S. Shen and M. Torkelson, Macromolecules., 25, 721, 1992.
17. S. Ramesh, K. H. Leen, K. Kumutha and A. K. Arof, Spectrochemica Acta., Part A, 66
1237–1242, 2007.
18. Vijay V. Soman and Deeplai S. Kelkar, Macromol. Symp., 277 152-161, 2009.
19. H. Jager, E. J. Vorenkamp, G. Challa, Polymer commun., ,24, 290, 1983.
20. Naima Belhaeche- Bensemra, Belkacem Belabed, Abdelmalik Bedda, Macromol. Symp.,
180, 203-215, 2002.
21. Kamira Aouachriaa, Naima Belhaneche-Bensemra, Polymer Testing, 25, 1101-1108,
2006.
22. A. P. Rhode, R. Frech, Solid State Ionics, 121, 91, 1999.
23. S. York, R. Frech, A. Snow, D. Glatzhofer, Electrochim Acta, 46, 1533, 2001.
24. Acosta JL, Morales E, Solid State Ion 85:85, 1996.
25. Kim JY, Kim SH, Solid State Ion 124(1–2):91, 1999.
26. Abd E l, Kader F H, Osman W H, Ragab H S, Sheap A M, Rizk M S &Basha M A F, J
polym Matter, 21, 49, 2004.
27. Ma H L, Zhang X H & Lucas J, j Non-cryst solids, 101, 128, 1993.
28. S. Rajendran, T. Uma, Mater. Lett. 44, 208, 2000.
29. M. Hammama, M.K. El-Mansyb, S.M. El-Bashirb M.G. El-Shaarawyb, Desalination,
209, 244-250 ,2007.
30. S. Kim Chi and M. Oh Seung, Electrochim Acta., 46 , 1323-31, 2001.

97 References
31. T. Shodai, B.B. Owens, H. Ohtsuka and J. Yamaki, J. Electrochem. Soc. 141, 2978-2981,
1994.
32. Stephan A M, Saito Y, Muniyandi N, Renganathan N G, Kalyanasundaram S, Elizabeth
R N Solid State Ionics 148: 467–473, 2002.
33. El-Kader FH, Gafer SA, Basha AF, Bannan SI, Basha MAF , Thermal and optical
properties of gelatin/poly(vinyl alcohol) blends. J Appl Polym Sci 118:413–420, 2010.
34. Vijay V. Soman, Deepali S. Kelkar, FTIR Studies of Doped PMMA - PVC Blend
System, Macromol. Symp., 277, 152–161. DOI: 10.1002/masy.200950319, 2009.


