Download - Charge–potential and capacitance–potential curves corresponding to reversible redox monolayers

Charge�/potential and capacitance�/potential curves corresponding toreversible redox monolayers
Joaquin Gonzalez *, Angela Molina
Facultad de Quımica, Departamento de Quımica Fısica, Universidad de Murcia, Espinardo, Murcia 30100, Spain
Received 26 November 2002; received in revised form 8 May 2003; accepted 22 May 2003
Journal of Electroanalytical Chemistry 557 (2003) 157�/165
www.elsevier.com/locate/jelechem
Abstract
General expressions for the charge�/potential (Q /E ) and capacitance�/potential (C /E ) curves corresponding to reversible redox
monolayers are deduced. These responses present time-independent and universal behaviour, which does not depend on the
voltammetric or chronopotentiometric technique employed to obtain them. This holds even in the more complex case in which non-
faradaic effects are taken into account. The simultaneous availability of both Q /E and C /E curves allows the total characterisation
of the reversible electroactive monolayer. The initial presence of both species in the monolayer can be detected only from the Q /E
curves which present a cross potential from which the ratio of initial excesses can be obtained. Experimental C /E data are easily
available from chronopotentiometric or voltammetric measurements. Nevertheless, to obtain the experimental Q /E curve,
chronopotentiometric data results are more suitable.
# 2003 Elsevier B.V. All rights reserved.
Keywords: Redox monolayers; Reversible processes; Interfacial charge; Interfacial capacitance; Derivative chronopotentiometry; Voltammetry
1. Introduction
The electrochemical literature reflects a growing
interest in the study of the redox behaviour of electro-
active monolayers such as those formed by thiols,
anthraquinone derivatives, bioactive peptides or nucleic
acids strongly adsorbed at mercury or carbon electrodes
[1�/7]. The study of the electrochemical behaviour of
surface bound molecules continues to be decisive for
their characterisation. A large number of electrochemi-
cal methods are currently employed, among which the
most used are cyclic voltammetry (CV), in the case of
the study of the kinetic behaviour [1,4,6,8�/12], and
potentiometric stripping analysis (PSA) also called
stripping chronopotentiometry with constant current,
in the case of analytical determination of surface
excesses [13�/18].Recent publications have also been devoted to the
development of the theory corresponding to the applica-
tion of other electrochemical methods for the study of
these processes. These include alternating current linear
sweep voltammetry (LSV) [19,20] and derivative chron-
opotentiometry with programmed currents of the form
I (t )�/I0 evt and I(t)�/I0tu [21�/23].
In this work, we will analyse the theoretical behaviour
of the charge�/potential responses (Q /E curves, with Q
being the total interfacial charge and E the potential
applied or measured, according to the electrochemical
method employed), and also that of the capacitance�/
potential responses (C /E curves, with C being the total
interfacial capacitance) obtained for surface bound
molecules. When the redox reaction is reversible, the
above Q /E and C /E curves present behaviour which is
independent of the electrochemical technique from
which they have been obtained. In other words, from
the I /E data obtained in voltammetric techniques (such
as LSV, CV, or alternating current LSV), or from the
E /t data obtained in chronopotentiometric techniques
(such as PSA, chronopotentiometry and derivative
chronopotentiometry with programmed currents), we
can obtain time-independent and universal sigmoidal Q /
E and peak-shaped (sigmoidal derivative) C /E curves.
* Corresponding author. Tel.: �/34-968-36-74-33; fax: �/34-968-36-
41-48.
E-mail address: [email protected] (J. Gonzalez).
0022-0728/03/$ - see front matter # 2003 Elsevier B.V. All rights reserved.
doi:10.1016/S0022-0728(03)00368-1
As far as we know, this behaviour has not been
previously pointed out in the electrochemistry literature
related to electroactive monolayers. However, it repre-
sents an interesting and particular characteristic, whichis exhibited only by reversible redox monolayers, even in
the more complex case in which non-faradaic effects are
taken into account [21,24]. Hence, the use of Q /E and
C /E curves by following the procedures indicated in this
work is of great interest in the total characterisation of a
reversible redox monolayer.
When the surface charge transfer reaction does not
present reversible behaviour, the temporal dependence,introduced by the form of the electric perturbation used,
cannot be eliminated in the charge�/potential and
capacitance�/potential responses, which will exhibit
different behaviour depending on which electrochemical
method has been used.
Firstly, we will show the theoretical behaviour of a
reversible redox monolayer in order to show that from
the E /t chronopotentiometric curve we can deduce theQ /E and C /E responses, which in the absence (Qa/E and
Ca/E curves, see Section 2.1) or in the presence (Qs/E
and Cs/E curves, see Section 2.2) of non-faradaic effects
are not dependent on the form of the perturbation
(current�/time function applied). Subsequently, in Sec-
tion 3, we will generalise the above results to the
electrochemical techniques most usually employed in
the analysis of molecular films.
2. Theoretical study of the electrochemical behaviour of
redox monolayers under the application of any
programmed current I (t )�/9/I0f(t)
We will consider the following surface electrode
process taking place in a reversible redox monolayer
A(adsorbed)�n e� ?kred
kox
B(adsorbed) (I)
in order to obtain the equations for the response
corresponding to the application of several successive
programmed currents of the form I(t)�/9/I0f(t), with I0
being the current amplitude of the programmed currentsapplied and f (t ) being any function of time. We assume
for the adsorbate monolayer that the Langmuir iso-
therm is obeyed. The redox couple is not present in the
solution and the adsorption is very strong to the extent
that the desorption is negligible in the time scale of the
experiment. Thus, the total excess GT is constant during
the whole experiment and it is fulfilled that [6]
GT�GA;0�GB;0�GA(t)�GB(t) (1)
with Gi ,0 and Gi (t ), i�/A or B, being the initial surfaceexcesses and the surface excesses corresponding to a
time t of i species, respectively. Moreover, the adsorp-
tion coefficients of both electroactive species and the
maximum surface coverage are independent of the
potential.
Since electron transfer reversibility is assumed, the
cathodic and anodic curves are the mirror images ofeach other. We will show the treatment for the cathodic
curve only and we will generalise the response obtained
for any number of programmed currents applied.
We will consider firstly that all the current is used in
the faradaic process given by Eq. (I) and then, secondly,
introduce the influence of non-faradaic effects by
considering the existence of an interfacial potential
distribution (IPD), according to the model proposedby Smith and White [24].
2.1. Application of current�/time functions of the form
I(t)�/I0f(t) in the absence of non-faradaic effects:
charge�/potential and capacitance�/potential curves
We will consider in this section that the appliedcurrent I (t ) is employed only on the surface charge
transfer process given by Eq. (I). Under these conditions
the following is fulfilled [6]:
I(t)
nFA��
dGA(t)
dt(2)
By integrating Eq. (2) between t�/0 and t�/t we
obtain the following expression for the surface excess of
oxidised species A:
GA(t)�GA;0�Qa(t)
nFA(3)
with Qa(t ) being given by
Qa(t)�gt
0
I(t?) dt? (4)
Qa(t ) is the charge at a time t corresponding to the
application of the programmed current I(t), equivalent
in this case to the faradaic reduction charge of the
surface bound molecules. The expression of Qa(t)
depends, following Eq. (4), on the particular form ofthe programmed current applied. As an example we will
show the expressions of Qa(t) for three different
current�/time functions which have been analysed pre-
viously in Refs. [21�/23,25,26]:
Constant current: I(t)�I0; Qa(t)�I0t (5a)
Power current: I(t)�I0tu; Qa(t)�I0tu�1
u � 1(5b)
Exponential current: I(t)�I0 evt;
Qa(t)�I0(evt � 1)
v
(5c)
The general current�/potential relationship for the
charge transfer reaction of the surface bound molecules
is given by [6]:
J. Gonzalez, A. Molina / Journal of Electroanalytical Chemistry 557 (2003) 157�/165158

I(t) eah
nFAk?0�GA(t)�eh(GT�GA(t)) (6)
with
h�nF
RT(E(t)�E?0) (7)
with k ?0 and a being the rate constant of the surface
electrochemical reaction, in s�1, and the charge transfer
coefficient of the cathodic surface reaction, respectively.
E ?0 is the standard potential of the surface process for
the Langmuir isotherm.Under reversible conditions for the surface charge
transfer process the Nernst equation is fulfilled. Thus,
Eq. (6) is simplified to:
eh�GA(t)
GT � GA(t)(8)
By taking into account Eq. (3) we can re-write Eq. (8)
in the following way:
Qa(E)�nFAGT
1 �V eh
(1 �V)(1 � eh)(9)
where V is given by:
V�GB;0
GA;0
(10)
Note that, in order to obtain this charge�/potentialresponse when both species are initially present, it is also
necessary to apply an anodic programmed current I(t).
Eq. (9) gives us the charge�/potential response (i.e. the
Qa/E curve) obtained when any programmed current
I (t) is applied to an electrode coated with a redox
monolayer of an electroactive reversible redox couple,
and non-faradaic effects are not present. This equation
indicates that the relationship between the reductioncharge Qa and the potential E has the same functional
dependence, independently of the type of programmed
current used.
By making Eq. (9) equal to zero we deduce the
adsorption cross potential, Eacp, which is given by:
Eacp�E?0�RT
nFln V (11)
which can exist only when both A and B species are
initially adsorbed. Therefore, when V"/0, the Qa/E
curve presents an intercept point with the potential axis
which corresponds to Eacp, according to Eq. (11).
Note that for reversible surface electrode processes,the Qa/E dependence given by Eq. (9) is identical to the
I /E one corresponding to reversible processes when
both electroactive species are soluble in the solution and
a constant potential is applied (see Ref. [2]).
It is interesting to obtain the derivative of this
response with respect to the potential, i.e. the (dQa/
dE)/E curve, which in line with Eq. (9) is also a general
relationship independent of the form of the appliedcurrent.
Thus, by differentiating Eq. (9) with respect to the
potential we obtain
j dQa
dE j�Ca(E)�n2F 2AGT
RT
eh
(1 � eh)2(12)
where Qa(E ) is given by Eqs. (4), (5a), (5b) and (5c) and
Ca(E) is the adsorption faradaic capacitance of thesurface bound molecules.
Observe that Eq. (12) corresponds to the
capacitance�/potential Ca(E )/E response of a reversible
electroactive monolayer.
The Ca(E )/E curve given by Eq. (12) presents a peak
whose potential is equal to the standard potential of the
surface process (Epeak�/E ?0) and whose capacitance is
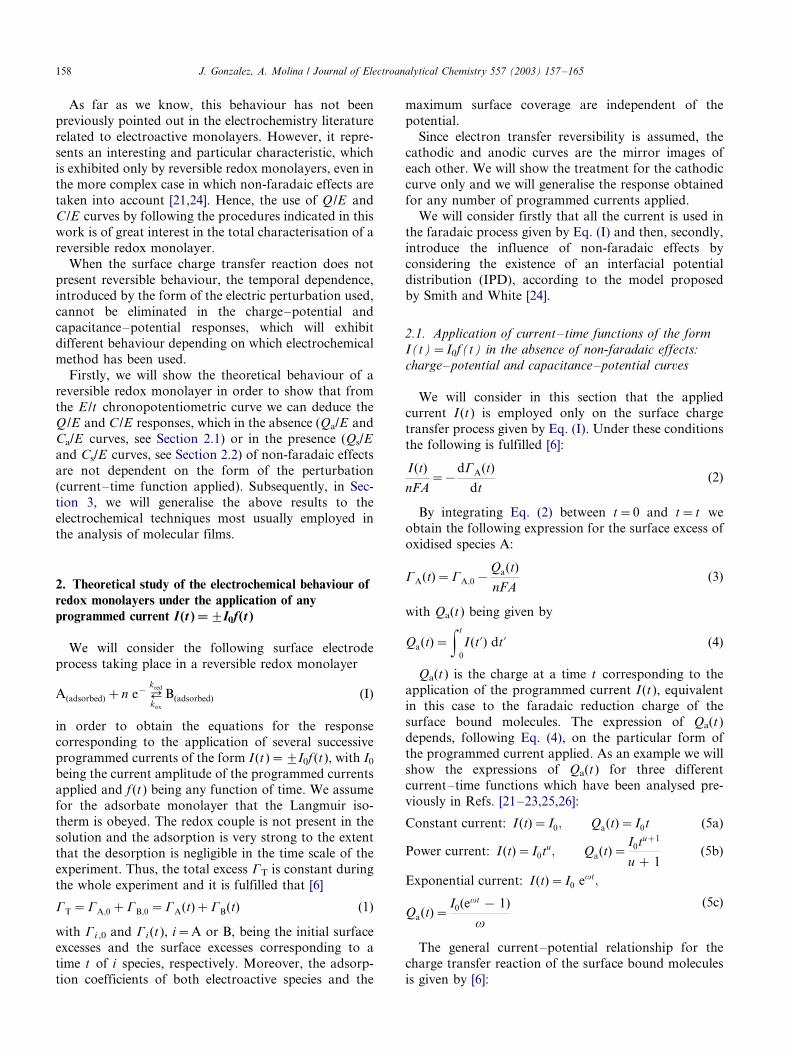
equal to (Ca)peak�/n2F2AGT/4RT .In order to demonstrate the general behaviour of the
Qa/E and Ca/E curves, we show in Fig. 1a the potential�/
time response corresponding to the application of three
types of programmed currents (current step: I (t )�/I0,
current which varies with a power of time: I(t)�/I0tu ,
and current that varies exponentially with time: I(t)�/
I0 evt). We also show in Fig. 1b the relationship between
the charge Qa and the application time of the current. Ascan be seen in these figures, both E /t and the Qa/t curves
depend on the type of current employed, while the Qa/E
and Ca/E responses shown in Figs. 1c and d, respec-
tively, present general behaviour independent of the
form of the applied current I (t), according to Eqs. (9)
and (12).
2.2. Consideration of non-faradaic effects based on the
IPD model of Smith and White for any programmed
current applied: charge�/potential and capacitance�/
potential curves
In this section we will consider the Smith and White
model for IPD, which takes into account the distortion
due to non-faradaic effects [21,24]. Thus, in this case the
applied current I(t) is employed both with the surface
charge transfer process given by Eq. (I) and with the
charging process. This condition can be expressed in
terms of the total interfacial charge, Qs, correspondingto the application of a programmed current I(t)
I(t) dt�dQs��nFA dGA(t)�Cdl(E) dE (13)
with Cdl(E ) being the non-faradaic capacitance given by
[24]:
J. Gonzalez, A. Molina / Journal of Electroanalytical Chemistry 557 (2003) 157�/165 159
Cdl(E)�1�C�11 �
�o0oSkD cosh(ze(fP � fS))
2kT
��1
��
1�n2F 2GT
RTC1
f (1�f )
�(14a)
C1�o0o1
d1
(14b)
with
f �GA(t)
GT
(15)
and o0 being the permittivity of the free space, o1 and oSthe dielectric constant of the surface bound molecules
and of the solvent, respectively, d1 the thickness of the
monolayer, kD the inverse Debye length, fP and fS the
electrostatic potential at the electron transfer plane and
in the bulk solution, respectively, z the ion charge of the
supporting electrolyte, k the Boltzmann constant, and e
the electron charge.
The Nernst equation takes the following expression inthese conditions:
ehP �f
1 � f(16)
with
hP�nF
RT(E�E?0�(fP�fS)) (17)
By combining Eqs. (13) and (16) it is possible to
obtain an explicit expression for the coverage of
Fig. 1. (a) (E�/E ?0)/t curves (see Eq. (8)), (b) Qa/t curves (see Eq. (4)), (c) Qa/(E�/E ?0) curves (see Eq. (9)) and (d) Ca/(E�/E ?0) curves (see Eq. (12))
for a reversible redox Langmuir monolayer corresponding to the application of the following programmed currents: I (t )�/I0 (dashed and dotted
line), I (t )�/I0tu (solid line), and I (t )�/I0 evt (dashed line). I0�/1 mA, GT�/10�10 mol cm�2, A�/0.031 cm2, n�/1, u�/0.1, v�/0.75 s�1, T�/298.15
K.
J. Gonzalez, A. Molina / Journal of Electroanalytical Chemistry 557 (2003) 157�/165160

oxidised species, f , as a function of the charge. Thus, by
following the procedure indicated in Ref. [21] we obtain
f �C1RT
n2F 2GT
ln
�f
1 � f
�
�f0�C1RT
n2F 2GT
ln
�f0
1 � f0
��
Qs
nFAGT
(18)
with Qs being the total interfacial charge and
f0�GA;0
GT
(19)
The Qs/E response corresponding to the application
of any programmed current I (t) can be obtained by
taking into account Eqs. (16) and (18)
Qs(E)�nFAGT
�1 �V ehP
(1 �V)(1 � ehP )�
C1RT
n2F 2AGT
� (ln V�hP)
�(20)
According to Eq. (20) the total interfacial charge Qs
can be expressed as the sum of two terms, the first of
which is related to the faradaic process given by Eq. (I) (/
Qa�nFAGT(1�V ehP )=(1�V)(1�ehP )); while the sec-
ond is linked to non-faradaic effects (/
Qdl��C1RT(ln V�hP)=nF ):/Eq. (20) corresponds to the general charge�/potential
response obtained when any programmed current is
applied to an electrode coated with a reversible electro-active monolayer when IPD is taken into account.
Eq. (20) is greatly simplified when the condition
@fP=@E�1 is fulfilled (i.e. the non-faradaic capacitance
is practically independent of the electrode potential
during the reduction/oxidation of the film, Cdl(E )$/
C1). According to Smith and White [24] this condition
is governed by the following requirements:
FGT
(2000o0osRTcs)1=2
�1
C1
(2000o0oscs=RT)1=2�1
�(21)
with cs being the molar concentration of the supporting
electrolyte.
In this case, the charge�/potential response corre-
sponding to the application of any programmed current
I (t) is simplified to:
Qs(E)�nFAGT
�1 �V eh
(1 �V)(1 � eh)�
C1RT
n2F 2AGT
��
ln V�nF
RT(E�E?0)
��(22)
with h given by Eq. (7).
The Cs/E curve can be easily deduced by differentiat-
ing Eq. (20) with respect to the potential. Thus, we
obtain
j dQs
dE j�Cs(E)
��
n2F 2AGT
RT
ehP
(1 � ehP )2�C1
��1�
@fP
@E
�(23)
Eq. (23) corresponds to the capacitance�/potential
response, with Cs(E ) being the total interfacial capaci-
tance which, therefore, is also independent of the form
of the programmed current applied.
In the case in which the non-faradaic capacitance ispractically independent of the electrode potential during
the reduction/oxidation of the film (Cdl(E )$/C1), we
obtain from Eq. (23) the following expression for the
capacitance�/potential curve
Cs(E)�n2F 2AGT
RT
eh
(1 � eh)2�C1�Ca(E)�C1 (24)
with Ca(E ) given by Eq. (12).
It can be observed from Eq. (24) that, in this
simplified case, the total interfacial capacitance Cs(E )
is the summation of the capacitance Ca(E ) related to the
surface charge transfer given by Eq. (I), and a constant
non-faradaic contribution, C1, which does not affect the
peak potential. The peak capacitance in this case is
Cs(E)peak��
n2F 2AGT
4RT�C1
�� (Ca)peak�C1 (25)
Under these conditions, the non-faradaic contribution
to Cs/E is a constant value C1. This is analogous to that
observed under the same conditions in CV, a technique
for which the capacitative contribution of the ICV/E
curve is a constant which constitutes the so-called‘‘baseline’’ of the voltammogram [2,24].
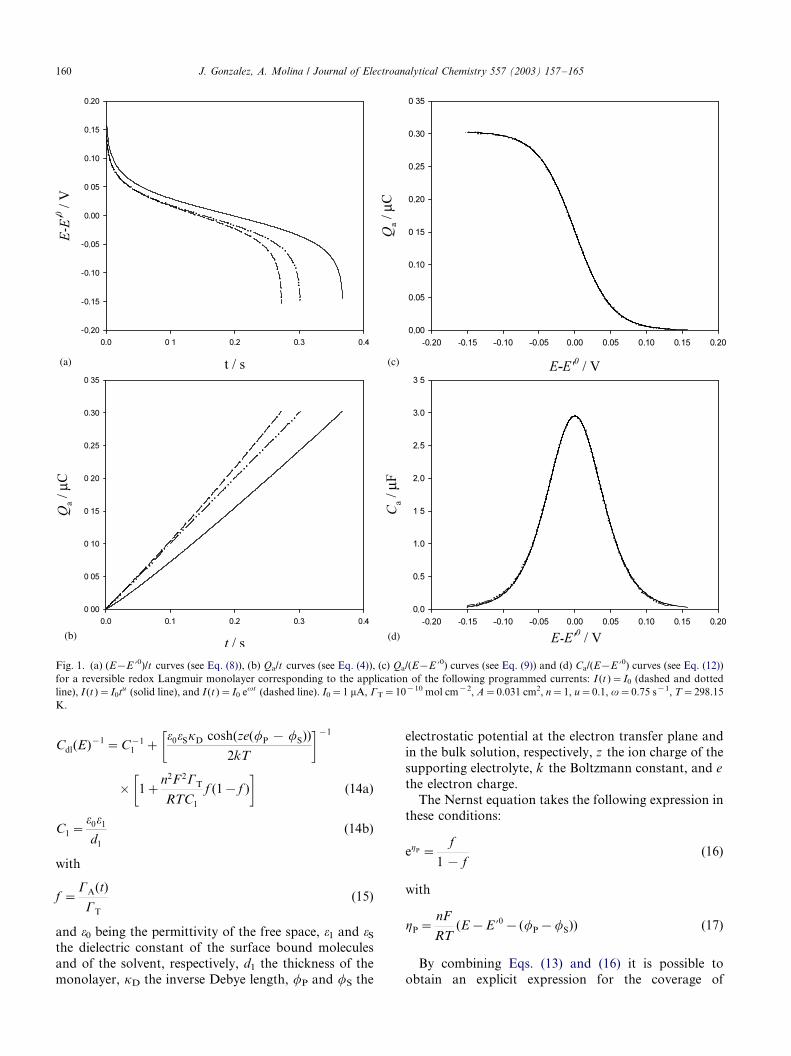
In Fig. 2 we have plotted the charge�/potential (Qs/E ,
Qa/E and Qdl/E curves, Figs. 2a and b) and
capacitance�/potential responses (Cs/E , Ca/E and Cdl/E
curves, Fig. 2c) calculated from Eqs. (20) and (23),
respectively, corresponding to a reversible redox mono-
layer for two different values of the ratio of initial
excesses of both species V . By comparing Figs. 2a and bit can be observed that when both species are initially
adsorbed (Fig. 2b), the Qs/E curve presents an intersect
with the potential axis which coincides with the adsorp-
tion cross potential, Eacp, when non-faradaic effects are
not present. However, the Cs/E curve shown in Fig. 2c is
not affected by the ratio GB,0/GA,0 and the capacitance
peak is dependent only on the total excess GT (see Eqs.
(23)�/(25)).Moreover, from these figures it can be also observed
that the non-faradaic effects on the Qs/E curve are
practically linear with the potential (see curves for Qdl/E
J. Gonzalez, A. Molina / Journal of Electroanalytical Chemistry 557 (2003) 157�/165 161

in Figs. 2a and b), and are practically constant in the Cs/
E curves (see dotted line in Fig. 2c). Thus, in order to
obtain the total excess GT we must subtract that
constant contribution of the capacitance�/potential
response.
3. Results and discussion
3.1. Equivalence between voltammetric and
chronopotentiometric techniques with any programmed
current in the treatment of reversible redox monolayers:
charge�/potential and capacitance�/potential curves
In previous sections and in previous Refs.
[21,23,26,27], we have pointed out that in the case of
electroactive reversible monolayers, both the chronopo-
tentiometric (E /t curve) and the reciprocal derivativechronopotentiometric ((dt /dE )/E curve) responses pos-
sess different features when different current�/time
functions are applied (i.e. constant current I (t )�/I0,
exponential current I(t)�/I0 evt , power time current
I (t )�/I0tu ). Taking as our basis the above mentioned
results, we have demonstrated in this paper that the
charge�/potential (Qs/E curve) and the capacitance�/
potential (Cs/E curve) responses are both independentof the type of programmed current used I(t) (see Eqs.
(9), (12), (20) and (23)).
In this section we will show that the Qs/E and Cs/E
curves corresponding to reversible redox monolayers are
independent of whether the electrochemical technique
employed was under controlled potential conditions or
under controlled current conditions and that, therefore,
they show a universal behaviour. In other words, thetemporal independence of the Qs/E and Cs/E curves
yield to unique responses independently of their having
been obtained from voltammetric, I /E , or from chron-
opotentiometric, E /t , techniques.
Moreover, we must highlight the fact that the above
mentioned universal character of the Qs/E and Cs/E
curves for reversible redox monolayers is maintained
even when non-faradaic contributions are considered inthese responses through IPD model of Smith and White
[24] (see Eqs. (20) and (23)).
We will demonstrate below how both the voltam-
metric I /E and the chronopotentiometric E /t responses
Fig. 2
Fig. 2. (a, b) Charge�/potential and (c) capacitance�/potential curves
corresponding to a reversible redox Langmuir monolayer which
undergoes the reaction A��e�?B; for two values of the ratio of
initial excesses V . In (a, b), Qs (solid line), Qa�nFAGT(1�V ehP )=(1�V)(1�ehP ) (dashed line) and Qdl��C1RT(ln V�hP)=nF
(dotted line) have been calculated from Eq. (20). In (c), Cs (solid line),
Ca�n2F 2AGT(ehP=(1�ehP )2)Cdl(E)=RTC1 (dashed line) and Cdl
(dotted line) have been calculated from Eq. (23). o1�/5, o3�/78, d1�/
1 nm, kD�/3.3�/109 mV�1, z�/1, GT�/5�/10�11 mol cm�2, n�/1,
E ?0�/0.20 V, T�/298.15 K. In order to calculate (fP�/fS) we have
used Eqs. (10)�/(13) in Ref. [24]. The values of V are: 0 (a, c) and 1 (b,
c). Both E and E ?0 are referred to Epzc (zero charge potential, see Ref.
[24]).
J. Gonzalez, A. Molina / Journal of Electroanalytical Chemistry 557 (2003) 157�/165162

do indeed convert into Qs/E and Cs/E curves which are
independent of the electrochemical technique employed,
according to Eqs. (9), (12), (22) and (23). At this point,
we must take into account that the charge Qs can bedetermined experimentally by integrating the measured
current for a given value of the potential E in the case of
voltammetric techniques, or by integrating the applied
current in the case of chronopotentiometric ones.
Therefore, to obtain the experimental Q /E data, chron-
opotentiometric techniques are more suitable than
voltammetric ones (see Refs. [13,15�/18,21�/23,27]).
The total interfacial capacitance as a function of thepotential can be determined by using Eqs. (Ia)�/(Va)
shown in Table 1, depending on the electrochemical
technique used.
In the following discussion C and Q are equal to the
adsorption faradaic capacitance and charge, Ca and Qa,
respectively, when non-faradaic effects are not present,
whereas they refer to the total interfacial capacitance
and charge, Cs and Qs, respectively, when the IPDmodel is considered.
3.2. Potentiometric stripping analysis
PSA is a frequently used technique in the study of the
electrochemical behaviour of redox monolayers [13�/18].
It was developed by Jagner and coworkers [28,29] and itconsists of the plotting of the (dt /dE )/E response when a
constant current I(t)�/I0 is applied to the electrode. For
this technique, the following response is obtained for a
reversible redox monolayer (see Eq. (18) in Ref. [30]):
dt
dE�
n2F 2AGT
RTI0
eh
(1 � eh)2(26)
If we take into account that for this type of current
applied C�(dQ=dE)I(t)�I0�I0(dt=dE) (see Eq. (5a),
and Eq. (Ia) in Table 1), with Q given by Eq. (Ib) in
Table 1, then it is evident that in PSA the (dt /dE )
response is the interfacial capacitance divided by the
current amplitude I0.
3.3. LSV and CV
CV is frequently used as the first technique in the
study of the behaviour of redox monolayers [1,6,8�/12].The voltammetric response corresponding to a reversi-
ble monolayer (ICV/E curve) was deduced by Laviron
(see for example, Ref. [31]), and is given by the following
equation:
ICV�n2F 2AGTv
RT
eh
(1 � eh)2(27)
By taking into account that v is the voltammetric
sweep rate, which is given by v�/jdE /dt j in CV, it is
fulfilled that (see Eqs. (IIa) and (IIb) in Table 1)
C(E)�ICV
v
Q(E)�gE
Ei
ICV
vdE
�(28)
with Ei and E being the initial and the variable
potentials of the voltammetric sweep.
Eq. (28) clearly shows that the ratio between the
voltammetric current ICV and the sweep rate is equal to
the interfacial capacitance [5]. The integral of the
(ICV/v )/E curve for a given value of E correspond to
the interfacial charge Q (E ), whose potential dependenceis given by Eq. (9) or Eq. (23).
3.4. a.c. voltammetry
In a sinusoidal a.c. linear sweep voltammetric experi-
ment the potential applied to the electrode at any time is
given by [2,19,20]:
E(t)�Ed:c:�Ea:c:
Ed:c:�Ei�vd:c:t
Ea:c:�DE sin(vt)
�(29)
with Ei being the initial potential, vd.c. the constant
Table 1
Expressions for the Charge (Q ) and Capacitance (C ) corresponding to a reversible electroactive Langmuir monolayer for different electrochemical
techniques: PSA, CV, cyclic staircase voltammetry (CSV), a.c. LSV, derivative chronopotentiometry with exponential current I (t )�/I0 evt (DCE)
and derivative chronopotentiometry with a power time current I (t )�/I0tu (DCP)
Electrochemical techniques
PSA CV and CSV ACV DCE DCP
C�/dQ /dE I0(dt /dE ) (Ia) ICV/v (IIa) Ia.c./vTotal (IIIa) (I0/v )(d(evt�/1)/dE ) (IVa) (I0/(u�/1))(dtu�1/dE ) (Va)
Q I0t (Ib) /fE
Ei(ICV=v) dE (IIb) /f
E
Ei(Ia:c:=vTotal) dE (IIIb) (I0/v )(evt�/1) (IVb) (I0/(u�/1))tu�1 (Vb)
C and Q are equal to the adsorption faradaic capacitance and charge, Ca and Qa, respectively, when non-faradaic effects are not present (see Eqs.
(9) and (12)), or are equal to the total interfacial capacitance and charge, Cs and Qs, respectively, when the IPD model is considered (see Eqs. (18) and
(19)). v is the constant sweep rate in CV, vTotal is the total sweep rate in ACV given by Eq. (31). In Eqs. (IIb) and (IIIb) Ei and E are the initial and
variable potentials of the voltammetric sweeps. I0 is the current amplitude of the different programmed currents considered.
J. Gonzalez, A. Molina / Journal of Electroanalytical Chemistry 557 (2003) 157�/165 163
sweep rate (vd.c.�/jdEd.c./dt j), DE the a.c. peak ampli-
tude and v the angular frequency. For small values of
DE , the a.c. total current can be written as the sum of a
d.c. current Id.c. and a current corresponding to the firstharmonic of the a.c. current Iv (see Eqs. (16)�/(24) in
Ref. [20])
Ia:c:�Id:c:�Iv
� [vd:c:�vDE cos(vt)]n2F 2AGT
RT
eh
(1 � eh)2(30)
The term in brackets in the right hand side of Eq. (30)
is the time derivative of the potential applied to the
electrode (see Eq. (29)), and it can be considered as the
‘‘total sweep rate’’ for a.c. voltammetry, vTotal,
vTotal�dE(t)
dt�
dEd:c:
dt�
dEa:c:
dt
�vd:c:�vDE cos(vt) (31)
Thus, according to Eq. (31), the interfacial capaci-
tance and the interfacial charge are given by (see Eqs.
(IIIa) and (IIIb) in Table 1)
C(E)�Ia:c:
vTotal
Q(E)�gE
Ei
Ia:c:
vTotal
dE
�(32)
From Eq. (32) we can conclude that, as in the case
corresponding to CV and SCV, the ratio between the
current Ia.c. and the total sweep rate vTotal is equal to the
interfacial capacitance, and the integral of the (Ia.c./
vTotal)/E curve for a given value of E corresponds to theinterfacial charge Q (E ), which is given as a function of
the potential by Eq. (9) or Eq. (23).
3.5. Derivative chronopotentiometry with an exponential
current of the form I(t)�/I0 evt
In Refs. [21,22] we study the application of an
exponential current of the form I (t )�/I0 evt to deriva-
tive chronopotentiometry with a programmed currents
technique for studying reversible and irreversible elec-
troactive monolayers. In these references we plotted the
(devt /dE )/E response, which for the case of a reversible
redox monolayer is given by (see Eq. (18) in Ref. [21])
devt
dE�
n2F 2AGTv
RTI0
eh
(1 � eh)2(33)
If we take into account that for this type of current
applied it is fulfilled that C�(dQ=dE)½I(t)�I0 evt �(I0=v)(d(evt�1)=dE)�(I0=v)(devt=dE) (see Eq. (5b),and Eq. (IVa) in Table 1), with Q given by Eq. (IVb) in
Table 1, then it is evident that in derivative chronopo-
tentiometry with exponential currents the devt /dE curve
(or d(evt�/1)/dE ) is equivalent to the interfacial capa-
citance divided by the factor (I0/v).
3.6. Derivative chronopotentiometry with power current
of the form I(t)�/I0tu
In Refs. [21,23] we also study the application of a
power current of the form I (t)�/I0tu to derivative
chronopotentiometry technique in order to study rever-
sible and irreversible electroactive monolayers. In this
case, we used the (dtu�1/dE )/E derivative, which for the
case of a reversible redox monolayer is given by (see Eq.
(9) in Ref. [21])
dtu�1
dE�
n2F 2AGT(u � 1)
RTI0
eh
(1 � eh)2(34)
As in the previous case, we must take into account
that for this programmed current it is fulfilled that
C(E)�(dQ=dE)½I(t)�I0tu �(I0=(u�1))(dtu�1=dE) (seeEq. (5c), and Eq. (Va) in Table 1), with Q given by
Eq. (Vb) in Table 1. Thus, we can conclude that in
derivative chronopotentiometry with power time cur-
rents, the dtu�1/dE curve is equivalent to the interfacial
capacitance divided by the factor (I0/(u�/1)).
Hence, according to Eqs. (26)�/(34) obtained in
different electrochemical techniques for a redox mono-
layer which exhibits a reversible behaviour, we obtainthe expressions given in Eqs. (9) and (12) for the Qa/E
and Ca/E responses, respectively, when non-faradaic
effects are not present, whereas when IPD is taken into
account, Qs and Cs are given by Eqs. (20) and (23),
respectively, whatever be the electrochemical technique
used.
Note that when non-faradaic effects are taken into
account, the Qs/E curve given by Eq. (20) presents agreat sensitivity to the initial conditions through the
term ln V (with ln V��(nF=RT)(Einitial�E?0�(fP�fS)) and Einitial being the initial applied or measured
potential in the voltammetric or chronopotentiometric
technique used, respectively).
When the charge transfer reaction is not reversible,
both the Q /E and the C /E curves are time-dependent
and, therefore, the charge�/potential and thecapacitance�/potential responses depend on the tem-
poral sequence in which a specific perturbation has been
applied to the system, and hence different expressions
for the Q /E and C /E curves are found for different
electrochemical techniques.
4. Conclusions
Eqs. (9), (11), (20) and (23) show that the Qs/E and
the Cs/E responses are independent of the electroche-
mical technique (voltammetric or chronopotentio-
J. Gonzalez, A. Molina / Journal of Electroanalytical Chemistry 557 (2003) 157�/165164

metric), from which these curves have been obtained, i.e.
they present an identical variation with E , the double
layer parameters C1, hP and @fP/@E , the total surface
excess GT and the ratio of initial excesses V . Therefore,
the charge�/potential and capacitance�/potential curves
in Fig. 1 (without non-faradaic effects) and in Fig. 2
(with non-faradaic effects) are universal curves for
reversible redox monolayers.The simultaneous availability of both Qs/E and Cs/E
curves allows the total characterisation of a reversible
surface process. Thus, the standard potential of the
surface process E ?0 and the total excess GT can be easily
determined from the peak potential of the Cs/E curve
(see Figs. 1 and 2). The Qs/E curves allow us to
determine whether only one or both of the redox species
are initially adsorbed by means of a simple visual
inspection of the sigmoidal curves when both cathodic
and anodic currents are applied, because in the second
case the sigmoid shows an intersect with the potential
axis. When non-faradaic effects are not present, this
intersect corresponds to the adsorption cross potential,
Eacp, in agreement with Eq. (11), from which we can
calculate the initial surface excesses of A and B species,
GA,0 and GB,0, respectively. Experimental Cs/E data are
easily available from chronopotentiometric or voltam-
metric measurements. Nevertheless, for the obtention of
the experimental Qs/E data, chronopotentiometric tech-
niques are more adequate.
Acknowledgements
The authors greatly appreciate the financial support
provided by the Direccion General de Investigacion
Cientıfica y Tecnica (Project number BQU2000-0231)
and the Fundacion SENECA (Expedient number 00696/
CV/99).
References
[1] H.O. Finklea, in: A.J. Bard, I. Rubinstein (Eds.), Electroanaly-
tical Chemistry, vol. 19, Marcel Dekker, New York, 1996.
[2] A.J. Bard, L.R. Faulkner, Electrochemical Methods, 2nd ed.
(Chapters 5 and 14), Wiley, New York, 2001 (Chapters 5 and 14).
[3] Z. Galus, Fundamentals of Electrochemical Analysis, 2nd ed.,
Ellis Horwood, New York, 1994.
[4] F.A. Armstrong, H.A. Heering, J. Hirst, Chem. Soc. Rev. 22
(1997) 169.
[5] E. Gileadi, Electrode Kinetics for Chemists, Chemical Engineers
and Material Scientists (Chapter 20), VCH, New York, 1993
(Chapter 20).
[6] E. Laviron, in: A.J. Bard (Ed.), Electroanalytical Chemistry, vol.
12, Dekker, New York, 1982.
[7] V. Mirceski, M. Lovric, R. Gulaboski, J. Electroanal. Chem. 515
(2001) 91.
[8] K. Weber, S.E. Creager, Anal. Chem. 66 (1994) 3164.
[9] R. Forster, L.R. Faulkner, J. Am. Chem. Soc. 116 (1994) 5444.
[10] H.O. Finklea, D.D. Manshew, J. Am. Chem. Soc. 114 (1992)
3173.
[11] M. Ohtani, Electrochem. Commun. 1 (1999) 488.
[12] A.P. Brown, F.C. Anson, Anal. Chem. 71 (1991) 174.
[13] R. Kalvoda, Electroanalysis 12 (2000) 1207.
[14] A. Fogg, J. Wang, Pure Appl. Chem. 71 (1999) 891.
[15] M. Tomschik, L. Havran, M. Fojta, E. Palecek, Electroanalyis 10
(1998) 403.
[16] J. Wang, P. Grundler, G-H. Flechsig, M. Jasinski, G. Rivas, E.
Sahlin, J.L. Lopez-Paz, Anal. Chem. 72 (2000) 3752.
[17] J. Wang, X. Cai, J. Wang, C. Jonsson, Anal. Chem. 67 (1995)
4065.
[18] R. Kizek, L. Trnkova, E. Palecek, Anal. Chem. 73 (2001) 4801.
[19] E. Laviron, J. Electroanal. Chem. 97 (1979) 135.
[20] M.J. Honeychurch, A.M. Bond, J. Electroanal. Chem. 529 (2002)
3.
[21] A. Molina, J. Gonzalez, J. Electroanal. Chem. 499 (2000) 117.
[22] J. Gonzalez, A. Molina, Langmuir 17 (2000) 5526.
[23] A. Molina, J. Gonzalez, Langmuir 19 (2003) 406.
[24] C.P. Smith, H.S. White, Anal. Chem. 64 (1992) 2398.
[25] L.M. Abrantes, A. Molina, J. Gonzalez, F. Saavedra, Electro-
chim. Acta 45 (1999) 457.
[26] A. Molina, J. Gonzalez, F. Saavedra, L.M. Abrantes, Electro-
chim. Acta 45 (1999) 761.
[27] J. Wang, B. Tian, Anal. Chem. 72 (2000) 3241.
[28] L. Anderson, D. Jagner, M. Josefson, Anal. Chem. 54 (1982)
1371.
[29] D. Jagner, Trends Anal. Chem. 2 (1983) 53.
[30] W. Jin, J. Wang, J. Electroanal. Chem. 306 (1991) 31.
[31] E. Laviron, J. Electroanal. Chem. 19 (1979) 101.
J. Gonzalez, A. Molina / Journal of Electroanalytical Chemistry 557 (2003) 157�/165 165


