Download - Charter Schools and Labor Market Outcomes

Charter Schools and Labor Market Outcomes∗
Will DobbiePrinceton University and NBER
Roland G. FryerHarvard University and NBER
Original Draft: July 2016This Version: November 2017
Abstract
We estimate the impact of charter schools on early-life labor market outcomes using admin-istrative data from Texas. We find that, at the mean, charter schools have no impact on testscores and a negative impact on earnings. No Excuses charter schools increase test scores andfour-year college enrollment, but, due to imprecision, have a statistically insignificant impacton earnings. The coefficient is almost identical to what we would expect given the correlationbetween test scores and wages. Other types of charter schools decrease test scores, four-yearcollege enrollment, and earnings, and, surprisingly, the decrease in wages is more negative thanone would anticipate. Using school-level estimates, we find that charter schools that decreaseaverage test scores also tend to decrease earnings, while charter schools that increase averagetest scores have no discernible impact on earnings. In contrast, high school graduation effectsand four-year college enrollment are predictive of earnings effects throughout the distributionof school quality. The paper concludes with a speculative discussion of what might explain ourset of facts.
∗We thank the Texas Education Research Center at the University of Texas at Austin’s Ray Marshall Center forproviding the data used in our analysis. We also thank David Card, Raj Chetty, Matt Davis, Hank Farber, EdwardGlaeser, Hilary Hoynes, Lawrence Katz, Patrick Kline, Michal Kolesar, Alan Krueger, Alexandre Mas, Parag Pathak,Jesse Rothstein, Adam Sacarny, Jesse Shapiro, Doug Staiger, Chris Walters, Danny Yagan, Seth Zimmerman, andnumerous seminar participants for helpful comments and suggestions. Elijah de la Campa, Tanaya Devi, Matt Farber,Adriano Fernandes, Samsun Knight, William Murdock III, Namrata Narain, Rucha Vankudre, Dan Van Deusen,Jessica Wagner, and Brecia Young provided exceptional research assistance. Correspondence can be addressed tothe authors by e-mail at [email protected] [Dobbie] or [email protected] [Fryer]. The research presentedhere utilizes confidential data from the State of Texas supplied by the Education Research Center (ERC) at TheUniversity of Texas at Austin. The views expressed are those of the authors and should not be attributed to theERC or any of the supporting organizations mentioned herein, including The University of Texas at Austin or theState of Texas. Any errors are attributable to the authors.
I. Introduction
Charter schools are publicly funded, but privately managed, educational institutions that have
grown in popularity across the United States and the United Kingdom over the past 20 years.
Currently, five percent of all U.S. public students attend charter schools, and school districts such
as New Orleans, Detroit, Camden, and District of Columbia are now majority charter. The National
Alliance for Public Charter Schools estimates that there are over 1 million children on charter wait
lists across America.
There is a burgeoning literature that certain charter schools – particularly those that implement
the “No Excuses” approach – increase test scores (Abdulkadiroglu et al. 2011, Dobbie and Fryer
2011, Angrist, Pathak, and Walters 2013, Tuttle et al. 2013) and college enrollment (Dobbie and
Fryer 2015, Angrist et al. 2016). Both test scores and college enrollment are correlated with labor
market outcomes such as employment and earnings (e.g. Griliches and Mason 1972, O’Neill 1990,
Neal and Johnson 1996, Currie and Thomas 2001, Chetty et al. 2011, Chetty, Friedman, and Rockoff
2014). As a result, charter schools seem likely to increase employment and earnings and potentially
reduce intergenerational poverty. Consistent with this argument, Dobbie and Fryer (2015) estimate
that students who were admitted by lottery into the Promise Academy Charter School in the Harlem
Children’s Zone have lower rates of female teen pregnancy and male incarceration.1
In this paper, we estimate the impact of charter schools on early-life labor market outcomes
using administrative data from the State of Texas. The Texas charter sector is one of the largest in
the nation, with approximately 3.5 percent of Texas public students now enrolled in a charter school.
Texas also boasts several of the most successful charter school networks. The Knowledge is Power
Program (KIPP) and YES Prep schools – both winners of the Broad prize for most effective charter
networks – have flagship schools in Houston, and the IDEA Public Schools – another exemplar of
the charter community – opened its first school in the lower Rio Grande Valley in 2000. Conversely,
there are a relatively large number of charter schools in Texas that have been closed due to under
enrollment, low student achievement, or fiscal mismanagement (Baude et al. 2014).
Ideally, one would use admission lotteries to identify the effect of charter schools on earnings.
Unfortunately, Texas charter schools are only required to retain admissions lottery records for two
years, and none of the schools that we were able to successfully contact had admissions lottery data
for the relevant cohorts.2
1The effects of the Promise Academy on these medium-run outcomes is larger than would have been expectedfrom the test score increases alone, suggesting that charter schools may develop non-tested forms of intelligenceor change students’ social networks which independently impact longer-term outcomes (Heckman and Rubinstein2001, Heckman, Stixrud, and Urzua 2006, Segal 2008, Whitman 2008, Chetty et al. 2011, Jackson 2012). Thereis also evidence that students assigned to high test score value-add teachers are more likely to attend college, earnhigher salaries as adults, and are less likely to become pregnant as teenagers (Chetty, Friedman, and Rockoff 2014).Additionally, attending a high-quality public school can reduce crime and increase college enrollment even when thereis little impact on state test scores (Cullen, Jacob, and Levitt 2006, Deming 2011, Deming et al. 2014).
2We also attempted to validate the observational versus lottery design on short-run test scores using oversub-scribed lotteries. We successfully contacted 28 of the 57 schools in our analysis sample. Only 2 of the 28 schoolsinitially reported that they had lottery data available. Unfortunately, both schools discovered that the data did notactually extend to our sample period when they were preparing the lottery data for the research team. The other
1
We therefore use a combination of matching and regression to adjust for baseline differences
between charter and non-charter students. Our primary specification controls for 4th grade school
x cohort x race x gender fixed effects and for a rich set of background characteristics including
third-order polynomials in baseline math and reading test scores. We identify school-specific effects
by comparing the outcomes of students who attended the same non-charter elementary school, but
different middle or high schools. This specification yields relatively precise earnings estimates while
controlling for any observable differences between charter and non-charter students.
The key identifying assumption of our empirical design is that school x cohort x race x gender
effects and baseline controls account for all observed and unobserved differences between charter
and non-charter students. Put differently, we assume unobserved determinants of students’ labor
market outcomes are orthogonal to our school value-added measures. Abdulkadiroglu et al. (2011)
and Dobbie and Fryer (2013) find that this empirical design yields similar test score estimates as
lottery-based designs for oversubscribed charter schools in Boston and New York City, respectively.
Deming (2014) demonstrates similar results using a less restrictive set of controls for regular public
schools in Charlotte-Mecklenburg that have oversubscribed choice lotteries. Abdulkadiroglu et al.
(2017) show that this empirical approach works less well in Denver, with observational estimates
yielding treatment effects of 0.3 standard deviations (hereafter σ) and lottery based estimates
yielding effects closer to 0.5σ.
In Section V and Online Appendix D, we provide a partial test of our identifying assumption in
our setting, showing that selection into Texas charter schools is remarkably similar to selection in
settings in which lottery and observational strategies yield similar point estimates. Nevertheless,
our estimates should be interpreted with this important identifying assumption in mind.
We begin our analysis by estimating the mean impact of charter schools in our sample on test
scores, educational attainment, and labor market outcomes. We find that, at the mean, charter
schools in Texas are only slightly more effective at increasing test scores or educational attainment
than regular public schools. This is a recurring theme in the charter literature (e.g. Gleason
et al. 2010, Baude et al. 2014). We estimate that attending a Texas charter school for one
year increases state test scores by 0.023σ (se=0.003). Similarly, charter attendance increases high
school graduation by 1.4 (se=0.1) percentage points, two-year college enrollment by 0.8 (se=0.2)
percentage points, and four-year college enrollment by 0.7 (se=0.2) percentage points.
Turning to labor market outcomes, the focus of our analysis, we find that charter attendance
is associated with a $139.16 (se=54.66) decrease in annual earnings in the state of Texas, with no
detectable impact on employment in Texas. Taken together, these results suggest negative impacts
of the average charter school in Texas.
However, investigating charter effects at the mean masks potential heterogeneity by charter
type. No Excuses charter schools – schools that tend to have higher behavioral expectations, stricter
disciplinary codes, uniform requirements, and an extended school day and year – are effective at
26 schools we were able to contact reported not having lottery data for more than a few years or not having bindinglotteries during our sample period.
2

increasing human capital on almost every dimension we are able to measure in our data. State
test scores increase by 0.093σ (se=0.004) per year of attendance, high school graduation increases
by 2.3 (se=0.2) percentage points, and enrollment in four-year colleges increases by 2.8 (se=0.3)
percentage points.
At first glance, our estimates may seem small relative to some empirical estimates in Abdulka-
diroglu et al. (2011) and Dobbie and Fryer (2013). Recall, these estimates are for oversubscribed
schools. Similar estimates on all charters are significantly smaller. For example, in Abdulka-
diroglu et al. (2011), observational estimates for middle school reading (respectively, math) effects
are 0.174σ (respectively, 0.316σ) for charters with lotteries, but 0.098σ (respectively, 0.148σ) for
charters without lotteries. In the same work, the observational estimates for high school reading
(respectively, math) effects are 0.258σ (respectively, 0.269σ) for charters with lotteries, but 0.169σ
(respectively, 0.122σ) for charters without lotteries. Any comparison of our test score effects with
lottery-based estimates for oversubscribed charters should take this caveat into account.
We also find that attending a No Excuses charter school increases persistence in four-year
colleges. Yet, despite these short-run human capital benefits, the impact of attending a No Excuses
charter school on earnings in Texas is a statistically insignificant $54.35 (se=85.58) per year of
attendance, in line with the cross-sectional correlation between test scores and average earnings
observed in Texas. Given the academic impacts on math (respectively, reading) scores, one would
expect a $254.48 increase (respectively, $123.57) based on the cross-sectional relationship between
test scores and average earnings.
Regular charters (defined as charters not implementing the No Excuses approach) decrease state
test scores by 0.034σ (se=0.003) per year of attendance, increase high school graduation by only 0.7
(se=0.2) percentage points, and decrease four-year college enrollment by 1.0 (se=0.2) percentage
points. Two-year college enrollment increases by 1.8 (se=0.2) percentage points, suggesting regular
charters may move students from four- to two-year colleges. Moreover, the impact of enrollment
in regular charter schools on earnings in Texas is -$299.44 (se=69.62) per year of attendance.
Surprisingly, this is $173.41 (respectively, $275.03) less than anticipated given the cross-sectional
correlations between math (respectively, reading) scores and average earnings.
Subsample estimates by race yield similar results. No Excuses charter schools are particularly
effective at increasing the human capital of minority students. No Excuses charter schools increase
the test scores of black and Hispanic students by 0.122σ (se=0.004), similar to the treatment effects
estimated by observational research designs from No Excuses charter schools in other districts
(Abdulkadiroglu et al. 2011, Dobbie and Fryer 2011, Angrist, Pathak, and Walters 2013). Black
and Hispanic children in No Excuses charter schools are also significantly more likely to graduate
from high school or enroll in a four-year college. The impact on earnings in Texas is $105.46
(se=91.59) for minority students, about what we expect. In other words, there are economically and
statistically significant effects of attending a No Excuses school on the test scores and educational
attainment of minority students, and this is reflected in the earnings effect, but measured with
3
considerable noise.3
In the second part of the paper, we examine the correlation between school-level education
effects and school-level labor market effects. These estimates provide information on the effect of
charter schools on labor market outcomes at other points in the distribution, not just the mean.
We also allow the correlation between the school-level effects to differ for schools with above and
below median effects to examine trends in both the left and right tails of the distribution.
Separately estimating the school-level correlation between pooled test scores and earnings effects
above and below the median test score effect yields another set of surprising results. Below median,
a 0.1σ increase in a school’s state pooled test score effect is associated with a $1,162.62 (se=186.78)
increase in the school’s earnings effect. Above median, however, a 0.1σ increase in a school’s
pooled test score effect is associated with a statistically insignificant $460.30 (se=273.33) increase
in earnings, with the p-value on the difference in the below and above median associations ($702.32)
equaling 0.09. Similar to the test score results, schools that have above median impacts on two-
year college enrollment have small or no impact on earnings, while schools that have below median
effects on two-year college enrollment tend to have negative effects on earnings. Four-year college
enrollment effects, however, are predictive of earnings effects throughout the distribution.
There is also a robust positive correlation of high school graduation effects with labor market
outcomes throughout the distribution. Below median, a ten percentage point increase in a school’s
high school graduation effect is associated with a $1,436.41 (se=393.85) increase in the school’s
earnings effect. Similarly, above median, a ten percentage point increase in a school’s high school
graduation effect is associated with a $2,049.51 (se=$478.60) increase in the school’s earnings effect.
These results are consistent with the seminal work in Heckman, Lochner, and Todd (2008), who
argue that the internal rate of return on high school completion is between 33 percent and 52
percent for white men and between 38 percent and 56 percent for black men between 1960 and
2000.4 These estimates also suggest that high school graduation may be an additional short-run
3To put these results into perspective, we estimate how much our No Excuses effects would have to be to closethe earnings gap between Blacks and whites in Texas. Using CPS data for individuals aged 24-26 living in Texasbetween 2008-2015 (6-8 years after our cohorts leave high school), we find a raw gap in average personal income of$2,734.81, out of a sample mean of $26,031.61. Assuming 7 years of charter attendance (middle and high school),the yearly No Excuses effect on earnings would have to be $390.68 to close this gap. Based on the cross-sectionalcorrelations between test scores and earnings in our sample, the math (respectively, reading) test score effects wouldhave to be 0.161σ (respectively, 0.256σ). Note that these are lower bounds on the required effect sizes. The averagenumber of years spent in a No Excuses charters is 3.3 years in our estimation sample. The required earnings effectsize to close the gap would then be $828.73, and the required math (respectively, reading) effects would be 0.342σ(respectively, 0.543σ). We obtain similar conclusions when (i) using only wage income instead of total income, and(ii) estimating the wage gap controlling for education, sex, marital and armed forces statuses, and fixed effects forsurvey year, respondent age, and metropolitan area.
4These results are related to an important literature estimating the impact of school quality on labor marketearnings. Changes in school inputs, such as pupil teacher ratios, annual teacher pay, and term length, help explaindifferences in state-specific returns to education (Card and Krueger 1992a) and the narrowing of the black-whiteearnings gap between 1960 and 1980 (Card and Krueger 1992b). There is also evidence of large gains of Catholicschool attendance for urban minorities that would have otherwise attended poor public schools (Neal 1997, Groggerand Neal 2000). Recent work suggests students assigned to high-quality kindergarten classrooms or high test scorevalue-add teachers in grades 4-8 are also less likely to become pregnant as teenagers, more likely to attend college,and earn higher salaries as adults (Chetty et al. 2011, Chetty, Friedman, and Rockoff 2014). There is also evidencethat smaller class sizes increase educational attainment and earnings in Sweden (Fredriksson, Ockert, and Oosterbeek
4
instrument along with state test scores to evaluate the efficacy of charter schools, particularly in
the right tail of the test score distribution.
We explore three threats to the internal validity of our estimates: selective enrollment into
charters, selective attrition from our earnings data, and alternative clustering of standard errors.
We explore the extent to which selection bias into charters may threaten our results by examining
whether baseline characteristics differ by charter type, and conducting falsification tests using out-
comes that we do not directly control for. We find economically small but statistically significant
differences between charter and non-charter students. We repeat these exercises in the Dobbie and
Fryer (2013) data. We find more selection on charter attendance in NYC – where observational
and lottery estimates closely mirror each other – than in Texas. Together, we take these results
as suggesting that there is modest selection into charters based on observables, but that our esti-
mates are unlikely to be significantly biased. Or, at least, less biased than other analyses which
demonstrate the similarity between observational and lottery-based estimates.
A second caveat is that we are only able to observe earnings outcomes for individuals employed
in the state of Texas. For the approximately 26 percent of students in our sample with missing
earnings outcomes, we do not know if they are unemployed or employed in another state. We
consider the extent to which out-of-state migration may threaten our estimates by (1) examining the
characteristics of individuals with missing earnings outcomes, (2) estimating results leaving these
observations as missing, and (3) imputing missing earnings data using several different approaches.
None of these results suggest that selective out-of-state migration significantly biases our main
results. Last, we find that our main results are robust to alternative ways of clustering our standard
errors.
In parallel work, Sass et al. (2016) estimate the impact of attending a charter high school on
college persistence and age 23-25 earnings in Florida. Their empirical design compares students
who attended both a charter middle and high school to students who attended a charter middle
school but non-charter high school. Using this empirical design, they find that attending a charter
high school increases maximum annual earnings by over $2,000. In the specification most similar to
ours where both charter and non-charter middle school students are included, the effect of attending
a charter high school is $493.15 (se=987.30), and is statistically insignificant. Beyond the impact
of charter schools on mean earnings, there is not much overlap between Sass et al. (2016) and our
approach.5
We conclude with a more speculative discussion designed to help better interpret our set of
facts, although we are admittedly quite limited in the breadth of hypotheses we can test due to
data constraints. First, we show that neither the age of the sample nor returns to work experience
for non-college students are likely to be driving the reported results. Estimates using only a subset
2013).5Unfortunately, it is not possible to replicate their research design in our data. During our sample period, there
are only 31 students who graduate from a charter middle school and attend a non-charter high school. This result isdue, at least in part, to the fact that the majority of charter schools in our sample serve both middle and high schoolstudents. See Appendix Table 1 for additional details on the charter schools in our sample.
5

of older cohorts are, if anything, stronger than the main results. Moreover, our estimates are
remarkably stable over the time horizons we are able to examine, indicating that our results are
not driven by returns to early work experience among non-college goers. Second, we show that our
results do not appear to be driven by the negative effects of high dropout rates observed among
some charter schools. Estimates on program completers suggest the same qualitative conclusions.
Finally, we discuss the extent to which multitasking may explain our results.
The remainder of the paper is structured as follows. Section II discusses the charter sector in
Texas. Section III describes our data. Section IV discusses our research design and its potential
limitations. Section V presents student-level results on human capital and earnings and discusses
potential threats to the validity of our estimates. Section VI estimates the correlation between
a school’s human capital effects and its labor market outcomes. Section VII discusses potential
interpretations of our results, and Section VIII concludes. There are four online appendices. Online
Appendix A provides additional results. Online Appendix B is a data appendix that details our
sample and variable construction. Online Appendix C provides additional details on the empirical
Bayes procedure we use to adjust our estimated school effects for estimation error. Online Appendix
D provides additional tests of our identifying assumptions.
II. The Texas Charter School Sector
Texas enacted legislation allowing for the establishment of charter schools in 1995. The Texas
charter sector has subsequently grown into one of the largest in the nation. Today, there are more
than 600 charter schools in Texas educating approximately 3.5 percent of public school students.
The vast majority of charter schools in Texas are open-enrollment charters granted by the
Texas State Board of Education.6 Open-enrollment charter schools receive public funding but are
not subject to the regulatory restrictions of traditional public schools. For example, charter schools
have almost no restrictions on hiring and firing teachers outside of the requirements for teachers in
core areas imposed by the No Child Left Behind legislation. In practice, open-enrollment charters
often hire teachers who currently lack certification or bring skills and experiences that may not
be rewarded in conventional public schools (Baude et al. 2014). Open-enrollment charters are
subject to the same accountability and testing requirements as regular public schools. However,
these schools are accountable to the Texas State Board of Education, not the school district in
which the school is located.
From 1995 to 2000, there was no statutory limit on the number of open-enrollment charters
as long as 75 percent of enrolled students were classified as at-risk of dropping out. Following
reports of poor performance and mismanagement at some open-enrollment schools, the legislature
relaxed the constraint on the number of at-risk students and put a cap on the number of open-
6There are four types of charter schools operating in Texas: open-enrollment charters, university/college campuscharters, independent school district charters, and home-rule district charters. University charters operate similarlyto open-enrollment charters. Independent district charters are established by and accountable to the school districtsin which they reside. Texas also allows for home-rule district charters, although none of them were established as of2015.
6

enrollment charters in 2001. Consistent with these reports, Baude et al. (2014) find that the
test score value-added of Texas charter schools in the early 2000s was highly variable and, on
average, lower than the regular public schools. However, by 2011 the test score value-added of
Texas charter schools was roughly equal to regular public schools due to the closure of ineffective
charters, improvements among existing charters, and the opening of new charters by successful
charter management organizations such as the Knowledge is Power Program (KIPP), YES Prep,
and IDEA Public Schools.
We make three sample restrictions to the charter schools examined in our analysis. First,
we restrict our analysis to open-enrollment charter schools that target the general population of
public school students but are not run by the regular public school system. We exclude both district
charters that are operated by the public school districts and alternative charter schools that typically
work with non-traditional students, such as high-school dropouts, and who operate under different
accountability standards. We also exclude charter schools for abused and autistic students; schools
housed in shelters, residential treatment centers, and juvenile detention centers; juvenile justice
alternative education programs; virtual charter schools; and sports academies. Second, we restrict
our analysis to charter schools whose oldest cohort graduated high school in or before 2008-2009.
This restriction ensures that students in our sample are approximately 25 years old or older in the
most recent earnings data. Third, we drop schools who have fewer than ten students enrolled during
our sample period. These sample restrictions leave us with 262 school x cohort observations from
57 different charter schools. Appendix Table 1 provides additional details on our sample charter
schools.
Throughout the text, we present results for three categories of charter schools: all charter
schools, No Excuses charter schools, and regular charter schools. All charters refers to the com-
plete set of charter schools in our estimation sample. No Excuses charters have higher behavioral
expectations, stricter disciplinary codes, are more likely to have uniform requirements, and are more
likely to have an extended school day and year (e.g. Thernstrom and Thernstrom 2003). Regular
charters are defined as all charters in Texas that are not No Excuses schools. These partitions are
motivated by the literature which demonstrates small, if any, gains in student achievement from
attending average charter schools but a large achievement effect of attending schools that adopt the
No Excuses approach. Cheng et al. (2017) conduct a meta analysis of seven studies and report that
No Excuses charters improve math scores by 0.25σ and literacy achievement by 0.16σ. They also
conclude that students who attend No Excuses charter schools have 0.15σ higher math achievement
and 0.07σ higher reading achievement than students attending a more general sample of random
assignment charter schools. We classify No Excuses charter schools using information from school
mission statements, charter applications, and public statements. Appendix Table 1 provides a com-
plete list of the No Excuses and regular charter schools in our sample, and Appendix B contains
additional information on how we coded No Excuses and regular charter schools.
7

III. Data
We use administrative data from the Texas Education Research Center (ERC) that allows us to
follow all Texas public school students from kindergarten to college through to the labor market.
The data include information on student demographics and outcomes from the Texas Education
Agency, college enrollment records from the Texas Higher Education Coordinating Board, and ad-
ministrative earnings records from the Texas Workforce Commission. Online Appendix B contains
all relevant information on the data and coding of variables. This section summarizes the most
relevant information from the appendix.
A. Data Sources
The Texas Education Agency (TEA) data include information on student gender, a mutually exclu-
sive and collectively exhaustive set of race dummies, and indicators for whether a student is eligible
for free or reduced-price lunch or other forms of federal assistance, receives accommodations for
limited English proficiency, is categorized as “at-risk”, or receives special education accommoda-
tions. The TEA data also include information on each student’s grade, school, state math and
reading test scores in each year, and graduation year. These data are available for all Texas public
school students for the 1994-1995 to 2012-2013 school years.
Information on college outcomes comes from the Texas Higher Education Coordinating Board
(THECB). The THECB collects and centralizes data for students attending Texas public univer-
sities, private universities, community colleges, and health related institutions. The data includes
information on each student’s enrollment, graduation, and grade in each year. All students missing
from these files are assumed to have not enrolled in or graduated from college. The THECB data
are available for the 2004-2005 to 2012-2013 school years.
An important limitation of the THECB data is that it only contains students who attend
Texas colleges or universities. If charter schools increase the probability that a student attends
out-of-state four-year universities, for instance, our estimates using the THECB will be biased. To
explore the robustness of our college results and measure the effect of charters on out-of-state college
attendance, we supplement our analysis with data from the National Student Clearinghouse (NSC)
that contain information on student enrollment for over 90 percent of all colleges and universities
in the United States. The NSC data is only available for the 2008-2009 and 2009-2010 academic
years. In practice, the estimated effects of charter school attendance on college-going are almost
identical in the NSC and THECB data in the years where we have both datasets. This provides
some confidence that differential out-of-state migration to attend college is not driving our results.
Employment and earnings outcomes are measured using data from the Texas Workforce Com-
mission (TWC). The TWC data record quarterly earnings for all Texas employees, with information
on approximately 12 million individuals each year. The data include information on each individ-
ual’s earning, number of employers, and size of each employer. The TWC data are available from
2002 to 2016.
8

We assume that individuals with no reported earnings in a given year are unemployed in Texas.
In Section V, we report results showing that our results are robust to excluding all zero earnings
outcomes, imputing zero earnings outcomes using baseline covariates, and imputing zero earnings
outcomes using both baseline covariates and realized educational outcomes.
The TEA, THECB, NSC, and TWC data are housed at the Texas ERC. Using a unique identifier
based on an individual’s social security number to link the data from these four sources, these data
allow us to follow each Texas student from kindergarten to college to the job market as long as this
individual resides in Texas. These data are not publicly available, but interested researchers can
apply to the Texas Education Research Center.
B. Sample Restrictions
We make six sample restrictions to the student data with the overarching goal of having a valid
comparison sample. Table 1 provides details on the number of students dropped by each sample
restriction. With no restrictions, there are 2,305,979 students in regular public schools, 3,300
students in No Excuses charter schools, and 12,324 students in regular charter schools. Column
2 omits students who did not attend a public elementary school in 4th grade. This decreases the
sample by 13,412 students in non-charters, but only by 178 students in No Excuses Charters and
1,586 in regular charters. Column 3 leaves out students with missing baseline covariates such as
gender or race. Column 4 drops students with no middle or high school test scores. Column 5
drops students who transferred to an out-of-state primary or secondary school. Column 6 drops
charter schools with a cohort size fewer than ten. In our final estimation sample – which includes
all students for which there is a match cell on 4th grade school, cohort, gender, and race – there are
376,208 students in non-charters, 2,550 in No Excuses charters, and 8,537 students in regular charter
schools. The majority of the non-charter sample was dropped due to not matching individuals in
the charter sample, primarily because these students attend schools in districts without a charter
school.
C. Summary Statistics
Table 2 presents summary statistics for non-charter students, students enrolled in No Excuses
charter schools, and students enrolled in regular charter schools – for both the full sample (columns
1-3) and the estimation sample (columns 4-6). In the full sample, relative to the non-charter sample,
regular charter schools are overwhelmingly minority, more likely to enroll students who are free or
reduced-price lunch eligible, and have students with lower baseline test scores in reading and math.
No Excuses charters have a higher fraction of Hispanic students, which might be driven by the
IDEA charter schools in the lower Rio Grande Valley, are less likely to enroll special education
students, and have students with higher baseline test scores.
The summary statistics for the full sample and the estimation sample are strikingly similar on
most dimensions. In the estimation sample, students enrolled in No Excuses charter schools are
more likely to be female, more likely to be free lunch, and have higher baseline test scores than
9

students in non-charters. The average number of years in a Texas charter school is three years
for No Excuses charter schools and two years for regular charter schools. Students enrolled in any
charter school are more likely to be labeled at-risk of dropping out. Hispanics are more represented
in charter schools than non-charter schools. Black students in Texas are less likely to attend No
Excuses charter schools relative to regular charters or non-charter schools.
Putting these pieces together, the summary statistics are consistent with previous work de-
scribing the characteristics of charter school enrollees. Students enrolled in charter schools are
more likely to be minority, more likely to be eligible for free or reduced-price lunch (a measure of
poverty), and more likely to be labeled at-risk of dropping out. Students enrolled in No Excuses
charter schools also have somewhat higher baseline test scores than students enrolled in either reg-
ular charter schools or non-charter schools. Consistent with these descriptive statistics, Allen and
Consoletti (2007, 2008), for example, find that students enrolled in charter schools are more likely
to be a minority and more likely to receive free lunch and be considered at-risk.
IV. Research Design
Our empirical analysis has two objectives: (1) to estimate the effect of attending charter schools
on labor market outcomes such as earnings and employment, and (2) to estimate the correlation
between a school’s effect on labor market outcomes and its effect on human capital outcomes such
as test scores. This section discusses our empirical strategy for each objective.
A. Estimating the Effect of Charter Schools on Labor Market Outcomes
We model the effect of a charter school on student outcomes as a linear function of the number of
years spent at the school:
yit = γXi +∑s
βsCharterits + εit (1)
where yit is the outcome of interest for student i in year t, Xi is a vector of baseline demographic
controls such as baseline test scores, gender, race, special education status, free and reduced-price
lunch eligibility, limited English proficiency, gifted designation, at-risk designation, and the number
of years spent at charter schools not included in our analysis sample, and εit is noise. Charterits
is the number of years student i has attended school s by year t.
The effect of attending charter school s is βs. Prior research has provided a set of causal
estimates of this parameter for short and medium run outcomes using admissions lottery data (e.g.
Abdulkadiroglu et al. 2011, Dobbie and Fryer 2011, Angrist, Pathak, and Walters 2013, Dobbie
and Fryer 2015, Angrist et al. 2016). Unfortunately, Texas charter schools are only required to
retain admissions lottery records for two years. As a result of this requirement, none of the charter
schools in our sample have admissions lottery data for cohorts in our sample period.
We therefore identify the effect of each charter school using a combination of matching and
regression analysis to partially control for selection into schools in our sample. Specifically, we follow
10

Angrist, Pathak, and Walters (2013) and Dobbie and Fryer (2013) and match students attending
sample charters to a control sample of regular public school students using “cells” consisting of the
4th grade school, gender, race, and cohort. Charter students are included in the estimates if they
are matched to a cell with at least one regular public school student. Traditional school students
are included if they are matched to a cell with at least one charter student.
We then include these “matched cell” fixed effects when estimating Equation (1). We also con-
trol for third-order polynomials in 4th grade math and reading scores, 4th grade special education
status, 4th grade free and reduced-price lunch eligibility, 4th grade limited English proficiency, 4th
grade gifted designation, 4th grade at-risk designation, and the number of years spent at charter
schools not included in our analysis sample. Standard errors are clustered at the 4th grade school
x cohort level when outcomes are observed only once in a student’s career. In test score regressions
where we observe multiple outcomes per student, we cluster at the student level.
Our matching and regression approach semi-parametrically controls for any differences between
school x cohort x race x gender cells that may bias our estimates by comparing the outcomes of
observationally similar students who attended the same elementary school, but attended different
middle or high schools. Any differences in human capital or labor market outcomes are attributed
to differences in the number of years spent at each charter school. The key identifying assumption
of our approach is that our school x cohort x race x gender effects and baseline controls account for
all observed and unobserved differences between charter and non-charter students. We therefore
assume that unobserved determinants of students’ labor market outcomes are orthogonal to our
school value-added measures. In Section V.D. and Appendix D, we discuss threats to validity and
provide support for this identifying assumption in our data.
B. Correlation of School Effects on Earnings and Academic Outcomes
We estimate the correlation between a school’s effect on labor market outcomes and its effect on
short-run outcomes such as test scores using the following specification:
βycs = λβtcs + εcs (2)
where βycs is a school’s effect for cohort c on labor market outcomes y, and βtcs is a school’s predicted
effect on short-run outcomes such as test scores. We report results using a simple linear relationship,
and a linear spline with a change in slope when the short-run effect is equal to its median. The
linear spline results will help us understand whether low- and high-performing schools (as measured
by short-run test score or attainment outcomes) have different effects on long-run outcomes. We
estimate Equation (2) at the school x cohort level and cluster standard errors at the school level.
Following Chetty, Friedman, and Rockoff (2014), we estimate Equation (2) using a leave-cohort-
out design that eliminates any mechanical correlation between βycs and βtcs. Specifically, we calculate
βtcs for cohort c using the short-run outcomes from all other cohorts, excluding the outcomes from
cohort c itself. For example, when estimating a school’s effects on the labor market outcomes of
11

students graduating in 2002-2003, we estimate βtcs based on short-run outcomes from students in
all cohorts of the sample except 2002-2003. We maximize precision by calculating these leave-
cohort-out estimates using data from all cohorts graduating high school, not just the subset of
older cohorts for which we observe earnings outcomes.
We adjust for estimation error in βtcs using an empirical Bayes procedure when estimating
Equation (2) (e.g. Morris 1983, Jacob and Rothstein 2016). The stochastic nature of our outcomes
combined with the relatively small number of students in some schools means that some of our
school effects will be estimated with considerable error, leading to attenuation bias when using
unadjusted estimates as right hand side variables.7 The empirical Bayes procedure is based on the
idea that there is likely to be positive (respectively, negative) estimation error if a school’s estimated
effect is above (respectively, below) the mean school effect. The expected school effect is therefore
a convex combination of the estimated school effect and the mean of the underlying distribution of
school effects. The relative weight on the estimated school effect is proportional to the precision of
the estimate, which is based on the standard error of the coefficient estimate. Online Appendix C
provides a detailed description of this procedure in our context.
V. The Impact of Charter Schools on Human Capital and Labor Market
Outcomes
Below, we provide a series of estimates of the impact of charter schools on human capital out-
comes such as test scores and college enrollment, and labor market outcomes such as earnings and
employment in Texas.
A. Human Capital Outcomes
Table 3 presents estimates of Equation (1) for math scores, reading scores, and both math and
reading scores together. The odd numbered columns control for the baseline characteristics in
Table 2, third-order polynomials in 4th grade math and reading state test scores, number of years
spent at charter schools not included in our analysis sample, and 4th grade school x cohort fixed
effects. The even numbered columns replace 4th grade school x cohort fixed effects with 4th
grade school x cohort x race x gender fixed effects – the specification that aligns with the lottery
estimates in Abdulkadiroglu et al. (2011), Angrist, Pathak, and Walters (2013), and Dobbie and
Fryer (2013). We report the coefficient on the number of years attended at the indicated charter
school and standard errors clustered at the student level (test scores) or 4th grade school x cohort
level (all other outcomes).8
7This may be an issue theoretically, but empirically it does not make a difference to our results (see AppendixFigures 4-5 in comparison to Figures 1-2).
8Appendix Tables 2-4 report results using an indicator for having ever attended the indicated charter school as analternative. The significant test score and educational attainment effects by charter type are robust to this alternativedesign, except for the high school graduation effect for regular charters. The same holds for regular charter effects onaverage earnings. No Excuses effects on earnings become negative, but insignificant, whereas effects on employmentin Texas remain negative and become significant.
12

Consistent with the prior literature, the mean impact of charter schools on test scores is rel-
atively small in economic terms (e.g. Gleason et al. 2010, Baude et al. 2014). In our preferred
specification with 4th grade school x cohort x race x gender fixed effects, we find that the impact of
attending a charter school for one year is 0.019σ (se=0.003) on math scores and 0.028σ (se=0.003)
on reading scores. Stacking both math and reading test scores, we find that attending a char-
ter school for one year increases test scores by 0.023σ (se=0.003). None of the estimates suggest
economically large impacts of charter attendance on test scores at the mean.
However, and again consistent with the prior literature (e.g. Abdulkadiroglu et al. 2011,
Angrist, Pathak, and Walters 2013, Dobbie and Fryer 2013), the test score estimates differ markedly
for No Excuses and non-No Excuses charter schools. In our preferred specification, the impact of
attending a No Excuses charter school for one year is 0.105σ (se=0.005) in math and 0.081σ
(se=0.004) in reading. This test score effect is 78% as large in math and 61% as large in reading
as the average observational estimates of middle and high school charters in Abdulkadiroglu et al.
(2011). In contrast, the impact of attending a regular (non-No Excuses) charter school is -0.052σ
(se=0.004) in math and -0.016σ (se=0.004) in reading.9
Table 4 presents similar estimates for high school graduation, two-year college enrollment, and
four-year college enrollment.10 At the mean, the effect of attending a charter school is 1.4 (se=0.1)
percentage points for high school graduation, 0.8 (se=0.2) percentage points for two-year college
enrollment, and 0.7 (se=0.2) percentage points for four-year college enrollment. Consistent with the
test score results from Table 3, the effects differ by charter type, particularly for four-year college
enrollment. No Excuses charters increase four-year college enrollment by 2.8 (se=0.3) percentage
points, compared to -1.0 (se=0.2) percentage points for regular charters.11 High school graduation
effects are also larger for No Excuses and regular charters, while two-year college enrollment effects
are approximately zero for No Excuses charter and positive for regular charters. These results
are consistent with No Excuses charters only increasing the number of students attending four-year
9Appendix Figure 1 plots school-specific estimates of the test score effects for both No Excuses and regular charterschools. We estimate the school-specific estimates using Equation (1) and adjust the coefficients for estimation errorusing the procedure outlined in Online Appendix C. The reported means are weighted by the number of studentsat each school in the earnings effects estimation sample. The distribution of regular charter school effectiveness issimilar to the distribution of charter school effectiveness in Gleason et al. (2010), providing more evidence that theTexas charter sector is not an outlier. Another interesting feature of Appendix Figure 1 is the consistency of the NoExcuses school test score effects, with almost all of the point estimates concentrated between zero and 0.25σ. Animportant caveat to these results is that the distribution adjusted for estimation error has lower variance than thetrue distribution of school-specific estimates. See Jacob and Rothstein (2016) for additional discussion of this issue.
10Deming et al. (2016) estimate that less than nine percent of the graduating students in the Texas ERC dataattend out of state colleges or universities and their test scores are drawn from the top deciles of the academicdistribution – even conditional on college enrollment. In Appendix Tables 5-6 we use data from the National StudentClearinghouse to demonstrate the robustness of the college enrollment results to out-of-state migration.
11Appendix Table 7 presents analogous results for the number of years enrolled at two- and four-year colleges.These results are consistent with the ever enrolled results. No Excuses charters decrease years enrolled in two-yearcolleges and increase years enrolled in four-year colleges, while regular charters increase years enrolled in two-yearcolleges and decrease years enrolled in four-year colleges. While we do not observe reliable measures of collegegraduation, Appendix Table 8 presents results for being enrolled two or more years in a two-year college and fouror more years in a four-year college. We find the same patterns as in our ever enrolled and years enrolled models.Taking these outcomes as proxies for graduation, these results suggest that No Excuses charters may also be effectiveat increasing four-year college graduation rates.
13

colleges, while regular charters shift students who otherwise would have attended a four-year school
to a two-year school.12
The consistency between our results and the previous literature – much of which employs a
lottery-based design – for the test scores and attainment results provides a bit of confidence that
our matched cell research design is valid in our setting. If anything, our test score effects for No
Excuses charters are smaller than those found in much of the literature. This is also a similar feature
of analyses that have employed both lottery-based and matched-cell designs. In Dobbie and Fryer
(2013), the matched cell specification estimates are biased downwards and the correlation between
lottery based estimates and observational estimates is 0.946 for math test scores and 0.842 for
reading test scores.
B. Labor Market Outcomes
Table 5 presents estimates of Equation (1) for average earnings and employment in the state of
Texas for ages 24-26.13 Columns 1-2 present earnings results using our baseline set of controls and
with matched cell fixed effects, respectively, mirroring the specifications used in Tables 3-4. At the
mean, the effect of attending a charter school for one year is -$139.16 (se=54.66). Thus, if a student
attended a charter school for 5 years, expected annual earnings in the state of Texas would be about
$700 lower. Consistent with our test score and attainment results, No Excuses charters have less
negative outcomes. The impact of attending a No Excuses charter for one year is a statistically
insignificant $54.35 (se=85.58), in line with the cross-sectional correlation between test scores and
average earnings observed in Texas. Given the academic impacts on math (respectively, reading)
scores, one would expect a $254.48 increase (respectively, $123.57) based on the cross-sectional
relationship between test scores and average earnings in Appendix Table 10. Regular charters have
a surprisingly negative impact on earnings of -$299.44 (se=69.62).14 This is $173.41 (respectively,
$275.03) less than anticipated given the cross-sectional correlations between math (respectively,
reading) scores and average earnings.
Results for employment in the state of Texas are less precise and not statistically distinguishable
from zero for both No Excuses charters or regular charters.15
12Following our test score results from Appendix Figure 1, Appendix Figure 2 plots school-specific estimates of theattainment effects for both No Excuses and regular charter schools. There is significant variation in the school-specificestimates. For regular charters, the effects are centered just below zero for high school graduation, above zero fortwo-year college enrollment, and below zero for four-year college enrollment. For No Excuses charters, the effectsare centered above zero for high school graduation and four-year college enrollment, and just below zero for two-yearcollege enrollment.
13Appendix Table 9 presents results for the maximum observed earnings for ages 24-26. The results are nearlyidentical to the average earnings presented in Table 5.
14Regular charters can be further subdivided into three categories: college preparatory charters, special missioncharter schools (e.g. religious or STEM education), and the remaining we categorize as miscellaneous. In resultsavailable upon request, we find that the negative earnings effects are driven almost entirely by special mission andmiscellaneous charter schools.
15Appendix Figure 3 plots school-specific estimates of the earnings and employment effects for both No Excusesand regular charter schools. There is significant variation in the school-specific estimates, with the effects centeredat or below zero for regular charters and just below zero for No Excuses charters.
14

C. Subsample Results
Appendix Tables 11A-11C report estimates by gender, baseline test scores, and race, respectively.
At the mean, charter schools are equally effective at educating male and female students. No Ex-
cuses schools have slightly larger effects on high school graduation and four-year college enrollment
for male students, however, but smaller effects for earnings in Texas. For baseline test scores,
low-skill students are also more likely to experience gains across educational outcomes. Earnings
effects are also larger for low-skill students, but the difference is not statistically significant.
More interesting results emerge when we divide the sample by ethnicity. Of the four education
outcomes we consider, three are statistically larger for black and Hispanic students. For the average
charter school, the impact on test scores is 0.042σ (se=0.003) for blacks and Hispanics and -0.039σ
(se=0.005) for whites and Asians. The difference, 0.081σ, is statistically significant at conventional
levels. Treatment effects on the attainment outcomes are similar. The only academic outcome for
which charter schools do not produce better results for blacks and Hispanics is two-year college
enrollment. Consistent with these markedly different test score and attainment results, the impact
on average earnings in Texas is $15.72 (se=58.67) for blacks and Hispanics and -$548.51 (se=123.53)
for whites and Asians.16
No Excuses charter schools display a similar pattern for educational outcomes, though the effect
sizes are larger. For example, the impact of No Excuses charter schools on test scores is 0.122σ
(se=0.004) for black and Hispanic students and -0.007σ (se=0.007) for white and Asian students.
Our estimates imply that if a black or Hispanic student spends 5 years in a No Excuses charter
school, she or he would have 0.610σ higher test scores. These effects are similar in size to estimates
of No Excuses charter schools in urban environments (e.g. Angrist, Pathak, and Walters 2013) and
efforts to transport the best practices from these schools (Fryer 2014).
However, the positive human capital benefits of No Excuses charter schools do not translate into
measurable improvements in earnings or employment for blacks or Hispanics, though the effects are
estimated with considerable error. For blacks and Hispanics, the coefficient on earnings in Texas
from No Excuses charters is $105.46 (se=91.59). For whites and Asians, the earnings effect from
No Excuses charters is -$121.50 (se=203.95). The p-value on this difference is 0.310 for No Excuses
charters.
D. Threats to Validity
In this section, we discuss three potential threats to the internal validity of our estimates: (1) selec-
tive enrollment in charter schools, (2) selective attrition from our earnings data, and (3) alternative
clustering of standard errors.
Selective Charter Enrollment:
16We also find that, for educational outcomes, Hispanics perform better than blacks in No Excuses charters, butworse in regular charters [results not shown in tabular form]. The earnings effects are insignificant for both groups.
15

As discussed above, the key identifying assumption of our approach is that our school x cohort
x race x gender effects and baseline controls account for all observed and unobserved differences
between charter and non-charter students. We therefore assume that unobserved determinants of
students’ labor market outcomes are orthogonal to our school value-added measures.
Consistent with this identifying assumption, Abdulkadiroglu et al. (2011), Angrist, Pathak, and
Walters (2013) and Dobbie and Fryer (2013) find that this type of observational empirical design
yields similar test score estimates as lottery-based designs for oversubscribed charter schools in
Boston and New York City, respectively. Deming (2014) finds similar results using a less restrictive
set of controls for regular public schools in Charlotte-Mecklenburg that have oversubscribed choice
lotteries. However, it is possible that the selection processes are different for Texas charter schools
than for charter schools in Boston or New York City or for regular public schools in Charlotte-
Mecklenburg.
It is also possible that the selection processes for test scores and labor market outcomes may be
different. For example, Chetty, Friedman, and Rockoff (2014) find that while controlling for lagged
test scores effectively absorbs most unobserved determinants of student achievement, these lagged
scores do not account for unobserved determinants of earnings. Specifically, Chetty, Friedman,
and Rockoff (2014) show substantial “effects” of earnings value-added estimates on baseline parent
income and family characteristics, indicating that lagged test scores are unable to fully account
for sorting when estimating earnings value-added. Unfortunately we do not have information on
parent income or family characteristics, and are therefore unable to replicate the Chetty, Friedman,
and Rockoff (2014) tests in our context.
In Online Appendix D, we discuss three partial tests for selection bias on observable charac-
teristics in our data. First, we regress each baseline characteristic on the number of years at the
indicated charter school type, school x cohort x race x gender effects, and all other baseline con-
trols. Second, we conduct a number of falsification tests using outcomes that we do not directly
control for: 3rd grade math and reading scores, and an indicator for having been held back before
3rd grade. Finally, we conduct a similar exercise using predicted earnings and employment for
ages 24-26. We predict earnings using the relationship between actual earnings and employment
with the baseline controls used in Equation (1). In all three tests, we find economically small but
statistically significant differences between charter and non-charter students.
To better understand how to interpret these results, we also conduct an identical exercise
in an environment where we believe both lottery-based and observational estimates of charter
effectiveness have been shown to be highly correlated. Specifically, we replicate our specifications
from Online Appendix D using information from NYC charter schools where Dobbie and Fryer
(2013) have shown that lottery-based and observational estimates are highly correlated. If anything,
these falsification tests reveal more selection on charter attendance in NYC than in Texas. We
interpret these results as suggesting that there is some modest selection into charter schools based on
observable characteristics, but that our estimates from Equation (1) are unlikely to be significantly
biased. Or, at least, less biased than other analyses which demonstrate the similarity between
16

observational and lottery-based estimates.
Selective Attrition from the Earnings Data:
Another concern is that charter students may be either more or less likely to leave the state, and
hence more or less likely to be missing from our earnings data. Missing earnings is a well-known
problem for labor economists (see Blundell and MaCurdy 1999 for a review). If charter students
are more or less likely to migrate out of Texas, or the types of charter students that migrate out of
Texas are different than the types of non-charter students who migrate, estimates of Equation (1)
may be biased.17
Unfortunately we are unable to directly observe out-of-state migration in our data. We therefore
explore attrition from of our sample in three ways. First, we examine the characteristics of charter
and non-charter students with no observed earnings outcomes. While far from an ideal test, these
results help us understand the types of individuals for whom we do not observe earnings, and
whether selective attrition is likely to be a serious concern in our setting. Similar to the test of
selective attrition into charter schools, there are small differences in six out of seventeen variables
that are statistically significant but economically small.18 Second, we test whether charter students
are more likely to attend an out-of-state college in the two cohorts where NSC data – which include
college enrollment outcomes from all states – is available. At the mean, charter students are no
more likely to attend two-year schools in or outside of Texas. They are, however, 0.5 (respectively,
0.8) percentage points more likely to attend a four-year college in Texas (respectively, outside
of Texas). Third, using data on the same NSC cohorts, we test whether the average earnings
of students that attend out-of-state colleges and return to Texas are meaningfully different from
students that attend colleges in Texas. At the mean, out-of-state two-year (respectively, four-year)
college attendees earn $1,471.46 (respectively, $2,227.30) less than in-state two-year (respectively,
four-year) college attendees.
With these caveats in mind, columns 3-5 of Table 5 explore the robustness of our earnings results
to various assumptions about missing earnings observations. Column 3 presents results dropping
all zero earnings observations. In this scenario, the effect that is being estimated is the impact of
charters on earnings, conditional on employment in Texas. Column 4 imputes the missing earnings
observations using the baseline characteristics in Table 2, third-order polynomials in 4th grade
math and reading state test scores, the number of years spent at charter schools not included in
17More generally, one can compare the types of attrition observed in our data with other well-known datasets. Forinstance, in the Current Population Survey (CPS), we find that 8.4 percent of 23-26 year olds had migrated out ofTexas sometime during the five years prior to taking the CPS. Individuals that attended at least some college, servedin the armed forces, and were 23-26 in 2005 (as compared to 2015) were more likely to migrate out of Texas. Wealso find that the employment rate among 23-26 year olds in Texas is 70.8 percent in the CPS. For minority youthin Texas, the rate is 65.5 percent. In comparison, we observe non-zero earnings for 64.1 percent of individuals in ourTexas data. This is strikingly consistent with our data.
18A related concern is that undocumented students may be particularly likely to leave our earnings sample. Whilewe do not observe whether or not a student is undocumented in our data, other data sources suggest that the numberof undocumented students in our sample is likely to be small. Data from the Migration Policy Institute for 2014suggests that there are roughly 88,000 undocumented Latino students aged 11-17 in the Texas school system. Incontrast, the Texas Education Agency shows that there are about 1,326,000 enrolled Latino students for roughly thesame ages. These numbers suggest that only about 6.6% of Latino students are undocumented in Texas.
17
our analysis sample, and 4th grade school x cohort x race x gender fixed effects. Column 5 imputes
the missing earnings observations using the same baseline characteristics and the observed test score
and academic attainment outcomes from Tables 3-4. Specifically, for both imputation procedures,
we regress non-missing earnings on all characteristics. We then take the median predicted earnings
in each 4th grade school x cohort x race x gender x free lunch status cell in column (4); and the
median predicted earnings in each 4th grade school x cohort x race x gender x free lunch status x
educational attainment cell in column (5). Our educational attainment variables groups students
that either (i) have less than a high school degree, (ii) completed a high school degree, (iii) had
some college attendance, or (iv) spent over four years in college. Results are similar using the 25th
or 75th percentile of each cell instead.
Our earnings results are broadly similar regardless of how we deal with missing earnings, though
some of the estimates are now significant. The estimated effect of No Excuses charters is mod-
estly more positive when dropping missing earnings observations or imputing outcomes, while
the estimated effects of regular charters is somewhat more negative. The largest estimates (in
absolute value) suggest that No Excuses charters increase earnings by a statistically significant
$172.61 (se=104.54) and that regular charters decrease earnings by a statistically significant $421.44
(se=81.16). We find nearly identical results if we impute earnings at different percentiles of the pre-
dicted earnings distribution or if we estimate results using a grouped Heckit procedure (e.g. Gronau
1974, Heckman 1979) [not shown in tabular form].19 We interpret these results as suggesting that
any selective out-of-state migration is likely to be modest in our sample. Taken together, our results
consistently show that the earnings effect of regular charters is negative while the earnings effect
of No Excuses charters are weakly positive.
Alternative Clustering:
In the specifications above, we cluster standard errors at the student level in the test score
regressions, and at the 4th grade school x cohort level in all other regressions. These standard
errors do not allow for heterogeneity of errors within the two groups of charters. To account for
this potential issue, we cluster our standard errors at alternative levels. For test scores, we cluster
(1) at the school x year level, and (2) at the student and 4th grade school levels. All our test score
results are robust to these two alternative ways of clustering [results not shown in tabular form].
For all other specifications, we cluster (1) at the last school attended level, and (2) at the
last school x 4th grade cohort level. Most educational attainment effects are robust to these
two alternative ways of clustering [results not shown in tabular form]. The only exception is the
No Excuses effect on high school graduation, which becomes insignificant when clustering at the
last school level. A similar pattern holds for the earnings results. Regular charter (respectively,
No Excuses) effects remain significant (respectively, insignificant) when clustering standard errors
at either of those two levels. Effects on average earnings for all charters are insignificant when
19Specifically, for each 4th grade school x cohort we compute the fraction with valid earnings data. We theninclude the implied control function for each group as a control variable to re-center the residuals in our sample.Using this approach, we find nearly identical results as those reported in Table 5.
18
clustering at the last school level, but significant when clustering at the last school x 4th grade
cohort level. We take these results as suggesting that our effects are robust to alternative ways of
clustering that allow for errors to vary within charter types.
E. Comparing our Results with Sass et al. (2016)
In parallel work, Sass et al. (2016) estimate the impact of attending a charter high school on
college persistence and age 23-25 earnings in Florida. Their empirical design compares students
who attended both a charter middle and high school to students who attended a charter middle
school but non-charter high school. Using this empirical design, they find that attending a charter
high school increases maximum annual earnings by over $2,000.
At first glance, these results may seem strikingly different from our findings. However, in the
specification most similar to ours where both charter and non-charter middle school students are
included, the effect of attending a charter high school decreases to $493.15 (se=987.30), and is
statistically insignificant. Given these standard errors, the range of possible earnings effects in Sass
et al. (2016) would be much larger than the range of earnings effects we observe for the average
charter in our sample.
Beyond the impact of charter schools on mean earnings, there is not much overlap between Sass
et al. (2016) and our approach. Unfortunately, it is not possible to replicate their research design
in our data. During our sample period, there are only 31 students who graduate from a charter
middle school and attend a non-charter high school. This result is due, at least in part, to the fact
that the majority of charter schools in our sample serve both middle and high school students.
VI. Correlation of School Effects and Labor Market Outcomes
Our results thus far have used individual-level data to estimate the relationship between charter
school attendance at the mean and human capital and labor market outcomes. In this section,
we generalize this approach by exploring the correlation between school-specific effects on human
capital and labor market measures.
Figure 1 plots school-specific estimates for labor market outcomes in Texas and test scores. Each
point represents the mean effect (across all available cohorts) for a school adjusted for estimation
error as described in Online Appendix C. Figure 1 also presents estimates of Equation (2) where
we allow the relationship between labor market effects and test score effects to differ above and
below the median of the school valued-added distribution. Equation (2) is estimated at the school x
cohort level using the leave-cohort-out procedure described in Section IV. School effects being used
as right hand side variables are adjusted for estimation error using the empirical Bayes procedure
described in Section IV. Standard errors are clustered at the school level.
Estimating the correlation between test scores effects and earnings effects yields different results
above and below the median. For schools with below median value-added on average test scores,
a 0.1σ increase in the school’s test score effect is associated with a $1,162.62 (se=186.78) increase
19

in the school’s earnings effect. For schools with above median value-added on average test scores,
however, the correlation between a school’s test score effect and earnings effect is statistically
zero. Specifically, a 0.1σ increase in a school’s test score effect, above zero, is associated with
a statistically insignificant $460.30 (se=273.34) increase in earnings. The same pattern holds for
math and reading effects when estimated separately. Figure 1B suggests a similar but more muted
pattern for employment effects. Taken at face value, these results suggest that negative test score
effects are a strong indicator of school failure, but positive test score effects are less indicative of
school success.
Figure 2 presents analogous results for high school graduation and two- and four-year college
enrollment. For two-year college enrollment, the patterns are identical to those for test scores.
Schools that have below median impacts tend to have negative impacts on earnings and employment,
but schools with above median impacts do not show a statistically significant correlation between
two-year enrollment and earnings effects. In stark contrast, four-year college enrollment effects are
predictive of earnings effects throughout the distribution. For schools with below median value-
added in four-year college enrollment, a ten percentage point increase in a school’s four-year college
enrollment effect is associated with a $2,499.13 (se=333.78) increase in the school’s earnings effect.
For schools with positive value-added on four year-college enrollment, however, a ten percentage
point increase in a school’s four-year college enrollment is associated with a significant $654.74
(se=211.35) increase in the earnings effect.
Similar to four-year college enrollment, high school graduation exhibits an economically and
statistically significant correlation with earnings both above and below median. Below median,
a ten percentage point increase in a school’s high school graduation effect is associated with a
$1,436.41 (se=393.85) increase in the earnings effect. Above median, a ten percentage point increase
in a school’s graduation effect is associated with a $2,049.51 (se=478.60) increase in the earnings
effect.20 These results are consistent with Heckman, Lochner, and Todd (2008), who argue that
the internal rate of return on high school effect is between 33 percent and 52 percent for white men
and between 38 percent and 56 percent for black men between 1960 and 2000. Moreover, taken at
face value, our results suggest that high school graduation may be a better short-run instrument,
at least as compared to state test scores, to evaluate the efficacy of charter schools, particularly in
the right tail of the achievement distribution.21
20The empirical Bayes adjustment shrink estimates uniformly towards the average school effect, and could theo-retically mask nonlinearities in the relationship between effects on labor market and effects on educational outcomes.In Appendix Figures 4-5, we present results using unadjusted effects. Our results are robust to using unadjustedestimates, and the scatterplots do not suggest nonlinear relationships.
21In results available upon request, we conduct a series of permutation tests to test the statistical significanceof the mean No Excuses and regular charter effects. Specifically, we regress school x cohort level effects (adjustedusing our empirical Bayes procedure) on indicators for the No Excuses and regular charter labels that are randomlyre-labeled 10,000 times. This procedure gives us a simulated distribution of No Excuses and regular charter effects.The results from the permutation test are consistent with our main results. The mean effect for regular chartersis statistically significant for test scores, two- and four-year college enrollment, and average earnings, but not highschool graduation and employment. The mean No Excuses charter effect in our sample is statistically significant forpooled scores, reading scores, and four-year college enrollment, but not math scores, high school college graduation,two-year college enrollment and labor market outcomes.
20

One potential source of the heterogeneity in school effects is the quality of the counterfactual
schools that students would attend if not enrolled in a charter school (Neal 1997, Chabrier et al.
2016). Holding charter school quality constant, a low quality counterfactual school will increase
the estimated effect of a charter school. Following Chabrier et al. (2016), we explore heterogeneity
in counterfactual school quality by plotting our school level effects against counterfactual school
quality. We measure counterfactual school quality for each charter school cohort using a two-step
calculation. First, we find the average math and reading test score for grades 5-11 of all non-charter
students in a matched cell. We then find the average test score across all matched cells for a charter
school cohort, using the number of charter students in each cell as weights.
Appendix Figure 6 presents our school-level effects versus these counterfactual school measures.
We also present estimates of the correlation between our charter school effects and counterfactual
quality at the school x cohort level. We find a negative correlation between the charter school
effects and counterfactual school quality for all outcomes except two-year college enrollment. For
example, we find that a 0.1 increase in counterfactual school quality measure is associated with a
$44.23 (se=23.13) lower school earnings effect. Appendix Figure 6 also shows that most No Excuses
effects are clustered in the left tail of the distribution of counterfactual quality, together with most
of the regular charter effects. These results suggest that the larger No Excuses effects are not due
to worse quality of the fallback options relative to regular charters.
VII. Interpretation
Our analysis has established six facts. First, at the mean, charter schools in Texas have little
impact on test scores, educational attainment, or earnings. Second, No Excuses charter schools
increase test scores and educational attainment but have a small and statistically insignificant
effect on earnings, though we are underpowered to detect modest but meaningful effects. Third,
regular charters increase two-year college enrollment but decrease test scores, four-year college
enrollment, and earnings. Fourth, the impact of charter schools on employment in Texas is small
and statistically insignificant throughout. Fifth, at the school level, charter schools with below
median test scores or two-year college enrollment effects tend to decrease earnings and employment,
while charter schools with above median test scores or two-year college enrollment demonstrate no
measurable earnings or employment benefits. Sixth, there is a robust positive correlation of school-
level high school graduation and four-year college enrollment effects with school-level labor market
effects throughout the distribution.
In this section, we provide a speculative discussion of the potential mechanisms that could
explain these six facts. Unfortunately, data limitations prevent us from directly testing a large
set of potential mechanisms. For instance, it is plausible – though not testable in our data – that
charter schools do not increase networks, and networks are important for increasing test scores.
These data limitations mean that we are more confident with our set of facts than our ability to
credibly identify the mechanisms that generated them. Many intuitive theories conflict with these
results, allowing us to make at least some progress in identifying potential mechanisms.
21
Thus, any potential mechanism must have different predictions for schools that increase and
decrease test scores. Below, we explore three such potential explanations: (1) the relatively young
age of our sample, (2) the negative effects of high dropout rates at high-performing charter schools,
and (3) multitasking. Another theory potentially consistent with the data is that Texas labor
markets do not reward high test scores. However, this theory is inconsistent with our estimates of
the return to test scores calculated with Texas data that are strikingly close to those calculated in
Chetty, Friedman, and Rockoff (2014).
A. Age of the Sample and Returns to Early Work Experience
One potential explanation for our results is that the individuals in our sample are too young for us
to accurately measure their earnings, particularly if non-charter students accumulated significant
work experience while charter students were in college. It is possible that students who attended
charter schools with high test score value-added will eventually earn more, but we observe them too
soon after schooling to capture these increased earnings. This concern is particularly reasonable
given the fact that earning trajectories are typically increasing in years of education, and that No
Excuses charters increase both two- and four-year college enrollment. If No Excuses students are
on an upward trajectory relative to the comparison group, then we may underestimate the charter
effect on earnings.
We explore the robustness of our results to this concern in three ways. First, we explore
the typical earnings trajectories of students in our sample. Figure 3 plots average earnings by
educational attainment for students in our estimation sample. We plot results both with and
without zero earnings observations included. Not surprisingly, earnings for individuals with at
least four years of college are relatively low for ages 19-22 when these individuals are likely still
enrolled in school. Earnings for these individuals sharply increase for ages 22-26, leveling off for
ages 26-30. In contrast, earnings trajectories are relatively stable over all ages for individuals with
some college, only a high school diploma, or less than a high school diploma. Average earnings for
college educated students also exceed the average earnings of other students by age 23, providing
some assurance that our sample is not too young. In results available upon request, we repeat this
analysis by school type, finding nearly identical results.
These results suggest that since students at No Excuses and other high test score value-added
charter schools are more likely to enroll in a four-year college, their earnings schedule is likely to
be flatter than regular charter students through age 22. Their earnings are then likely to increase
sharply until about age 26. All else equal, this suggests that measuring earnings outcomes for ages
24-26, as we do in our analysis, is likely to modestly understate the earnings benefits of attending
a high test score value-added charter school. We also find that the correlation of age 26 earnings
with age 30 earnings is 0.675 if zeros are included and 0.620 if zeros are not included (see Appendix
Table 12). These results are again consistent with our main earnings measure accurately measuring
labor market outcomes.
Appendix Table 13 presents additional evidence on this issue by presenting results for earnings at
22

ages 28-30 when observed earnings are more indicative of lifetime earnings (Neal and Johnson 1996,
Chetty et al. 2014). Columns 1-2 present results using true earnings for the subset of individuals
we observe at ages 28-30. Columns 3-6 present results for our full sample using predicted earnings
at ages 28-30. In columns 3-4, we calculate predicted earnings using indicators for high school
graduation, two-year college enrollment, and four-year college enrollment; cubic polynomials in
grades 5-11 math and reading scores, years of two-year college, and years of four-year college;
and the baseline controls used in all other specifications. Columns 5-6 add cubic polynomials on
earnings from ages 24-26, and on median industry earnings from ages 24-26 to the prediction. If
anything, the results are exacerbated when estimating our earnings effects on older cohorts.
The coefficient on any charter is twice as large as the full sample, driven by large negative results
from attendance in regular charter schools. The impact of attending a regular charter school for one
year for age 28-30 earnings is -$364.28 (se=108.93). The coefficient on No Excuses attendance is
positive but measured with considerable noise at $130.88 (se=193.62). Appendix Figure 7 presents
results separately for each year relative to high school graduation. Consistent with the results
from Appendix Table 13, earnings and employment effects are constant for No Excuses charter
schools from years 5 to 10. The effect of regular charters on earnings is, if anything, becoming
more negative from years 5 to 10. None of the results suggest that our main results understate the
effects of No Excuses charters.
Finally, we investigate whether charter school students are more likely to be employed in high
growth industries that may not be reflected in their early-life earnings. Appendix Table 14 presents
estimates of the effect of charter school attendance on industry earnings measured at the 25th, 50th,
and 75th percentiles. Of the eighteen coefficients estimated in the table, none are both positive and
statistically significant. If anything, charter students seem to be working in lower paying industries.
B. High Dropout Rates Among High-Performing Charter Schools
A second potential explanation for our results is that high-performing charter schools only help
the select subset of students that are able to endure a more rigorous education program. In this
scenario, our estimates combine the positive effects of “completing” a charter education with the
negative effects of dropping out early. While our empirical design accounts for the number of years
at each charter school, it is possible that students do particularly poorly after leaving a particular
charter school, and that this masks the true potential of these schools.
We provide evidence on this potential mechanism in Appendix Table 15. For each human capital
and earnings outcome, we estimate the effects separately for students who completed a charter (i.e.,
those who enrolled in the highest grade offered by a particular charter school) and those that failed
to complete (i.e., those who never enrolled in the highest grade offered by a particular charter
school). On almost every dimension of human capital, students who complete No Excuses charter
schools have better results than those who did not complete the charter program through the last
grade offered. Students who complete No Excuses charter schools also have considerably higher
earnings results than those who did not complete. In contrast, there are no significant differences
23
in the earnings or employment effects for regular charter students.
C. Multitasking
It is also plausible that the positive value-added charter schools improve test scores by, either
intentionally or unintentionally, substituting away from other non-tested skills that have value in
the labor market (e.g. creativity or adaptation to language). Unfortunately, we cannot directly test
the multitasking theory with our data as it relies on important, but subtle, changes in curriculum
or the management of schools. For instance, one might want to compare the scope and content of
lessons in high-test-score schools versus low-test-score schools. In low-test-score schools, under this
theory, one would expect more lessons that were not correlated with the content on the state test
but which one could argue might be correlated with labor market success.
In an effort to make modest progress on this theory, we explore detailed data on the inner
workings of charter schools in New York City, described in Dobbie and Fryer (2013). An enor-
mous amount of information was collected from each school. Principal interviews asked about
teacher development, instructional time, data-driven instruction, parent outreach, and school cul-
ture. Teacher interviews asked about professional development, school policies, school culture, and
student assessment. Student interviews asked about school environment, school disciplinary pol-
icy, and future aspirations. Lesson plans were used to measure curricular rigor and the scope and
sequence of instruction. Importantly for this paper, the instruction time variables in the principal
interview gleaned the amount of time that each school spends per week on both tested (e.g. math
and reading) and non-tested subjects (e.g. art, history, foreign language).
Appendix Table 16 investigates differences across a wide set of variables that might be consistent
with multitasking using the NYC charter data from Dobbie and Fryer (2013). At the mean,
charters that increase test scores spend a statistically insignificant 4.5 percent more time on math
and reading relative to charters that decrease test scores. Moreover, they spend a statistically
insignificant 6.3 percent more time on non-tested subjects with a p-value of 0.413. These data do
not seem consistent with multitasking. There are, however, some differences between achievement-
increasing and achievement-decreasing charter schools in New York City that may be applicable to
our earnings results for charters in Texas. For instance, consistent with Jacob (2005) achievement-
increasing charter schools spend significantly less time on foreign languages and history.
Whether these input changes are important for labor market earnings is unknown, but these
results provide some evidence of differences in time focus for schools that increase versus decrease
short-run test scores. Some argue that familiarity with a foreign language, adeptness with social
studies, and immersion in the arts are important elements of a liberal arts education that instill
creativity, problem-solving skills, grit, and other non-cognitive skills that are important for labor
market success (Bialystok and Martin 2004, Mindes 2005, Elpus 2013, Elpus 2014, Catterall 2009,
Catterall, Dumais, and Hampden-Thompson 2012, Bradley, Bonbright, and Dooling 2013). Others
believe that these skills are essentially a “luxury good” and students (particularly those who are
low-income) would be better served by focusing on basic math and reading.
24
Settling this debate is beyond the scope of this paper. In the end, there is some evidence that
schools that increase math and reading achievement do so at the expense of other subjects such as
foreign language and history. Whether that can explain the patterns in our data is unknown.
VIII. Conclusion
In this paper, we estimate the impact of charter schools on early-life labor market outcomes using
administrative data from Texas. We find that, at the mean, charter schools have no impact on
test scores and a negative impact on earnings in Texas. No Excuses charter schools increase test
scores and four-year college enrollment, but have a small and statistically insignificant impact on
earnings – about what we would expect given the size of the test score effects – while regular
charter schools decrease test scores, four-year college enrollment, and earnings. Using school-level
estimates, we find that charter schools with below median value-added in test scores also tend
to decrease earnings, while charter schools with above median value-added in test scores have no
discernible impact on earnings. In contrast, high school graduation effects and four-year college
enrollment effects are predictive of earnings effects for both low and high value-added schools.
The underlying mechanism that drives these results remains unclear. We test four hypotheses.
Students in our main specifications are in their mid-twenties, but investigating older cohorts of
students only strengthens the results. The high attrition rates of achievement-increasing charters
also fails to explain the results. The final two mechanisms are, at least, generally consistent with the
data. Some – though not all – of the estimates reported are consistent with the impact on earnings
one might expect given the cross-sectional correlation between test scores and earnings documented
in the literature. Finally, there is some evidence that schools increase math and reading scores at
the expensive of subjects such as art and history, although the exact effects of this practice on labor
market outcomes is unknown.
References
[1] Abdulkadiroglu, Atila, Joshua D. Angrist, Susan M. Dynarski, Thomas J. Kane, and Parag
A. Pathak. 2011. “Accountability in Public Schools: Evidence from Boston’s Charters and
Pilots.” Quarterly Journal of Economics, 126(2): 699-748.
[2] Abdulkadiroglu, Atila, Joshua D. Angrist, Yusuke Narita, and Parag A. Pathak. 2017. “Re-
search Design Meets Market Design: Using Centralized Assignment for Impact Evaluation.”
Econometrica, 85(5): 1373-1432.
[3] Allen, Jeanne, and Alison Consoletti. 2007. “Annual Survey of America’s Charter Schools.”
Washington, DC: Center for Education Reform.
[4] Allen, Jeanne, and Alison Consoletti. 2008. “Annual Survey of America’s Charter Schools.”
Washington, DC: Center for Education Reform.
25

[5] Angrist, Joshua D., Sarah Cohodes, Susan Dynarski, Parag A. Pathak, and Christopher Wal-
ters. 2016. “Stand and Deliver: Effects of Boston’s Charter High Schools on College Prepara-
tion, Entry, and Choice.” Journal of Labor Economics, 34(2): 275-318.
[6] Angrist, Joshua D., Parag A. Pathak and Christopher R. Walters. 2013. “Explaining Charter
School Effectiveness.” American Economic Journal: Applied Economics, 5(4): 1-27.
[7] Baude, Patrick L., Marcus Casey, Eric A. Hanushek, and Steven G. Rivkin. 2014. “The Evo-
lution of Charter School Quality.” NBER Working Paper No. 20645.
[8] Bialystok, Ellen, and Michelle M. Martin. 2004. “Attention and Inhibition in Bilingual Chil-
dren: Evidence from the Dimensional Change Card Sort Task.” Developmental Sciences, 7(3):
325-339.
[9] Blundell, Richard, and Thomas MaCurdy. 1999. “Labor Supply: A Review of Alternative
Approaches.” Handbook of Labor Economics, Volume 3(A): 1559-1695.
[10] Bradley, Karen, Jane Bonbright, and Shannon Dooling. 2013. “Evidence: A Report on the
Impact of Dance in the K-12 Setting.” National Dance Education Organization.
[11] Card, David, and Alan B. Krueger. 1992a. “Does School Quality Matter? Returns to Education
and the Characteristics of Public Schools in the United States.” Journal of Political Economy,
100(1): 1-40.
[12] Card, David, and Alan B. Krueger. 1992b. “School Quality and Black-White Relative Earnings:
A Direct Assessment.” Quarterly Journal of Economics, 107(1): 151-200.
[13] Catterall, James S. 2009. Doing Well and Doing Good by Doing Art: The Effects of Education
in the Visual and Performing Arts on the Achievements and Values of Young Adults. Los
Angeles/London: Imagination Group/IGroup Books.
[14] Catterall, James S., Susan A. Dumais, and Gillian Hampden-Thompson. 2012. The Arts and
Achievement in At-Risk Youth: Findings from Four Longitudinal Studies. Washington, DC:
National Endowment for the Arts.
[15] Chabrier, Julia, Sarah Cohodes, and Philip Oreopoulos. 2016. “What Can We Learn from
Charter School Lotteries?” The Journal of Economic Perspectives, 30(3): 57-84.
[16] Cheng, Albert, Collin Hitt, Brian Kisida, and Jonathan N. Mills. 2017. “No Excuses Charter
Schools: A Meta-Analysis of the Experimental Evidence on Student Achievement.” Journal of
School Choice, 11(2): 209-238.
[17] Chetty, Raj, John N. Friedman, Nathaniel Hilger, Emmanuel Saez, Diane Whitmore Schanzen-
bach, and Danny Yagan. 2011. “How Does Your Kindergarten Classroom Affect Your Earnings?
Evidence from Project STAR.” Quarterly Journal of Economics, 126(4): 1593-1660.
26
[18] Chetty, Raj, John N. Friedman, and Jonah E. Rockoff. 2014. “Measuring the Impacts of
Teachers II: Teacher Value-Added and Student Outcomes in Adulthood.” American Economic
Review, 104(9): 2633-2679.
[19] Chetty, Raj, Nathaniel Hendren, Patrick Kline, and Emmanuel Saez. 2014. “Where is the
Land of Opportunity? The Geography of Intergenerational Mobility in the United States.”
Quarterly Journal of Economics, 129(4): 1553-1623.
[20] Cullen, Julie Berry, Brian A. Jacob, and Steven Levitt. 2006. “The Effect of School Choice on
Participants: Evidence from Randomized Lotteries.” Econometrica, 74(5): 1191-1230.
[21] Currie, Janet, and Duncan Thomas. 2001. “Early Test Scores, School Quality and SES: Long
Run Effects on Wage and Employment Outcomes.” Worker Wellbeing in a Changing Labor
Market, Volume 20, 103-132.
[22] Deming, David J. 2011. “Better Schools, Less Crime?” Quarterly Journal of Economics, 126(4):
2062-2115.
[23] Deming, David J. 2014. “Using School Choice Lotteries to Test Measures of School Effective-
ness.” American Economic Review Papers and Proceedings, 104(5): 406-411.
[24] Deming, David J., Justine S. Hastings, Thomas J. Kane, and Douglas S. Staiger. 2014. “School
Choice, School Quality, and Postsecondary Attainment.” American Economic Review 104(3):
991-1013.
[25] Deming, David J., Sarah Cohodes, Jennifer Jennings, and Christopher Jencks. 2016. “School
Accountability, Postsecondary Attainment and Earnings.” Review of Economics and Statistics
98(5): 848-862.
[26] Dobbie, Will, and Roland G. Fryer. 2011. “Are High-Quality Schools Enough to Increase
Achievement among the Poor? Evidence from the Harlem Children’s Zone.” American Eco-
nomic Journal: Applied Economics, 3(3): 158-187.
[27] Dobbie, Will, and Roland G. Fryer. 2013. “Getting Beneath the Veil of Effective Schools:
Evidence from New York City.” American Economic Journal: Applied Economics, 5(4): 28-
60.
[28] Dobbie, Will, and Roland G. Fryer. 2015. “The Medium-Term Impacts of High-Achieving
Charter Schools.” Journal of Political Economy, 123(5): 985-1037.
[29] Elpus, Kenneth. 2013. “Arts Education and Positive Youth Development: Cognitive, Behav-
ioral, and Social Outcomes of Adolescents Who Study the Arts.” National Endowment for the
Arts.
[30] Elpus, Kenneth. 2014. “Arts Education as a Pathway to College: College Admittance, Selec-
tivity, and Completion by Arts and Non-Arts Students.” National Endowment for the Arts.
27

[31] Fredriksson, Peter, Bjorn Ockert, and Hessel Oosterbeek. 2013. “Long-Term Effects of Class
Size.” Quarterly Journal of Economics, 128(1): 249-285.
[32] Fryer, Roland G. 2014. “Injecting Successful Charter School Strategies into Traditional Public
Schools: Early Results from an Experiment in Houston.” Quarterly Journal of Economics,
129(3): 1355-1407.
[33] Gleason, Philip, Melissa Clark, Christina Clark Tuttle, Emily Dwoyer, and Marsha Silver-
berg. 2010. “The Evaluation of Charter School Impacts: Final Report.” National Center for
Education and Evaluation and Regional Assistance, 2010-4030.
[34] Griliches, Zvi, and William M. Mason. 1972. “Education, Income, and Ability.” Journal of
Political Economy, 80(3): 74-103.
[35] Grogger, Jeff, and Derek Neal. 2000. “Further Evidence on the Effects of Catholic Secondary
Schooling.” Brookings-Wharton Papers on Urban Affairs, 151-193.
[36] Gronau, Reuben. 1974. “Wage Comparisons-A Selectivity Bias.” Journal of Political Economy,
82(6): 1119-1143.
[37] Heckman, James J. 1979. “Sample Selection Bias as a Specification Error.” Econometrica,
47(1): 153-161.
[38] Heckman, James J., and Yona Rubinstein. 2001. “The Importance of Noncognitive Skills:
Lessons from the GED Testing Program.” American Economic Review, 91(2): 145-149.
[39] Heckman, James. J., Jora Stixrud, and Sergio Urzua. 2006. “The Effects of Cognitive and
Noncognitive Abilities on Labor Market Outcomes and Social Behavior.” Journal of Labor
Economics, 24(3): 411-482.
[40] Heckman, James J., Lance J. Lochner, and Petra E. Todd. 2008. “Earnings Functions and
Rates of Return.” IZA Discussion Paper No. 3310.
[41] Jackson, C. Kirabo. 2012. “School Competition and Teacher Labor Markets: Evidence from
Charter School Entry in North Carolina.” Journal of Public Economics, 96(5): 431-448.
[42] Jacob, Brian A. 2005. “Accountability, Incentives and Behavior: The Impact of High-Stakes
Testing in the Chicago Public Schools.” Journal of Public Economics, 89(5-6): 761-796.
[43] Jacob, Brian A., and Jesse Rothstein. 2016. “The Measurement of Student Ability in Modern
Assessment Systems.” Journal of Economic Perspectives, 30(3): 85-108.
[44] Mindes, Gayle. 2005. “Social Studies in Today’s Early Childhood Curricula.” Young Children,
60(5): 12-18.
[45] Morris, Carl N. 1983. “Parametric Empirical Bayes Inference: Theory and Applications.”
Journal of the American Statistical Association, 78(381): 47-55.
28

[46] Neal, Derek A., and William R. Johnson. 1996. “The Role of Pre-Market Factors in Black-
White Wage Differences.” Journal of Political Economy, 104(5): 869-895.
[47] Neal, Derek. 1997. “The Effects of Catholic Secondary Schooling on Educational Achievement.”
Journal of Labor Economics, 15(1): 98-123.
[48] O’Neill, June. 1990. “The Role of Human Capital in Earnings Differences between Black and
White Men.” Journal of Economic Perspectives, 4(4): 25-45.
[49] Sass, Tim R., Ronald W. Zimmer, Brian Gill, and Kevin Booker. 2016. “Charter High Schools’
Effects on Long Term Attainment and Earnings.” Journal of Policy Analysis and Management,
35: 683-706.
[50] Segal, Carmit. 2008. “Classroom Behavior.” Journal of Human Resources, 43(4): 783-814.
[51] Thernstrom, Abigail, and Stephan Thernstrom. 2003. No Excuses: Closing the Racial Gap in
Learning. New York: Simon and Schuster.
[52] Tuttle, Christina Clark, Brian Gill, Philip Gleason, Virginia Knechtel, Ira Nichols-Barrer, and
Alexandra Resch. 2013. “KIPP Middle Schools: Impacts on Achievement and Other Out-
comes.” Mathematica Policy Research, Princeton, NJ.
[53] Whitman, David. 2008. Sweating the Small Stuff: Inner-City Schools and the New Paternalism.
Washington, D.C.: Thomas B. Fordham Foundation and Institute.
29

Table 1: Students in Estimation Sample
Full Trad. Baseline Test In Cohort MatchedSample Elem. Covars Scores Texas Size Cell
(1) (2) (3) (4) (5) (6) (7)Non-Charters 2305979 2292567 2145143 1993841 1880024 1880024 376208No Excuses Charters 3300 3122 2826 2779 2569 2550 2550Regular Charters 12324 10738 10260 9685 9083 8537 8537
Notes: This table details the number of students in our estimation sample. All rows are restricted toTexas public school students expected to graduate high school in or before 2008-2009. Column 1 is thetotal number of students with no additional restrictions. Column 2 drops students who did not attend atraditional elementary school in 4th grade. Column 3 drops students with missing gender and race. Column4 drops students with no middle or high school test scores. Column 5 drops students who transferred toan out-of-state school. Column 6 drops charter school cohorts of fewer than 10 students. Column 7 dropsstudents who are not in a matched cell of 4th grade school, cohort, gender, and race.
30

Table 2: Summary Statistics
Full Sample Estimation SampleNon- No Regular Non- No Regular
Charters Excuses Charters Charters Excuses ChartersBaseline Characteristics (1) (2) (3) (4) (5) (6)
Female 0.489 0.528 0.505 0.515 0.532 0.516Black 0.140 0.165 0.374 0.234 0.167 0.363Hispanic 0.375 0.597 0.334 0.325 0.573 0.339Asian 0.023 0.060 0.012 0.007 0.065 0.012Free Lunch 0.524 0.655 0.636 0.506 0.637 0.6504th On Time 0.826 0.864 0.806 0.847 0.876 0.8214th Grade Spec. Ed 0.137 0.060 0.140 0.095 0.060 0.1194th Grade Gifted 0.092 0.131 0.065 0.106 0.145 0.0744th Grade LEP 0.143 0.320 0.136 0.126 0.288 0.1354th Grade At Risk 0.405 0.496 0.457 0.386 0.477 0.4824th Grade Math 0.014 0.111 -0.498 -0.006 0.139 -0.3834th Grade Reading 0.011 0.112 -0.352 0.021 0.141 -0.277Missing 4th Math 0.209 0.286 0.259 0.162 0.266 0.227Missing 4th Reading 0.219 0.295 0.272 0.172 0.278 0.239
TreatmentYears Any Charter 0.000 3.371 2.091 0.000 3.404 1.993Years No Excuses 0.000 3.291 0.000 0.000 3.325 0.000Years Regular Charters 0.000 0.080 2.091 0.000 0.079 1.993
Outcomes5th-11th Grade Math -0.077 0.213 -0.534 -0.086 0.214 -0.5175th-11th Grade Reading -0.075 0.171 -0.399 -0.058 0.183 -0.384High School Graduation 0.716 0.779 0.638 0.762 0.836 0.666Any Two-Year College 0.315 0.279 0.277 0.327 0.320 0.305Years Two-Year College 0.909 0.822 0.806 0.941 0.941 0.901Any Four-Year College 0.236 0.293 0.150 0.283 0.338 0.160Years Four-Year College 0.897 1.040 0.494 1.064 1.199 0.526Avg. Earnings (24-26) 14429.99 13084.88 10734.81 15786.07 15015.09 11961.47Avg. Employment (24-26) 0.609 0.581 0.606 0.676 0.642 0.643
N Schools 9983 8 49 7290 8 49N Students 2305979 3300 12324 376208 2550 8537
Notes: This table reports descriptive statistics for Texas public school students in our data graduating highschool by 2008-2009. Columns 1-3 report means for all Texas public school students in the indicated schools.Columns 4-6 report means for students who are in the final estimation sample described in Table 1. SeeOnline Appendix B for additional details on the variable definitions and sample.
31

Table 3: Charter School Attendance and Test Scores
Math Scores Reading Scores Pooled ScoresPanel A: Pooled Results (1) (2) (3) (4) (5) (6)
Any Charter 0.018∗∗∗ 0.019∗∗∗ 0.028∗∗∗ 0.028∗∗∗ 0.023∗∗∗ 0.023∗∗∗
(0.003) (0.003) (0.003) (0.003) (0.003) (0.003)Panel B: By Charter Type
No Excuses 0.103∗∗∗ 0.105∗∗∗ 0.080∗∗∗ 0.081∗∗∗ 0.092∗∗∗ 0.093∗∗∗
(0.005) (0.005) (0.004) (0.004) (0.004) (0.004)Regular Charter −0.052∗∗∗ −0.052∗∗∗ −0.016∗∗∗ −0.016∗∗∗ −0.034∗∗∗ −0.034∗∗∗
(0.004) (0.004) (0.004) (0.004) (0.003) (0.003)Baseline Controls Yes Yes Yes Yes Yes YesMatched Cell FE No Yes No Yes No YesN Students x Years 2076898 2076898 2077867 2077867 4154765 4154765Dep. Variable Mean -0.017 -0.017 0.011 0.011 -0.003 -0.003
Notes: This table reports OLS estimates of the effect of charter attendance on test scores. We report thecoefficient and standard error on the number of years spent at the indicated charter school type. Odd columnscontrol for the number of years spent at charter schools not in our main sample, the baseline controls listed inTable 2, cubic polynomials in grade 4 math and reading scores, and 4th grade school x cohort effects. Evencolumns replace 4th grade school x cohort effects with 4th grade school x cohort x race x gender effects. Allspecifications stack 5th-11th grade test score outcomes and cluster standard errors by student. *** = significantat 1 percent level, ** = significant at 5 percent level, * = significant at 10 percent level. See Online AppendixB for additional details on the variable definitions and sample.
32

Table 4: Charter School Attendance and Academic Attainment
High School Grad. Two-Year Enrollment Four-Year EnrollmentPanel A: Pooled Results (1) (2) (3) (4) (5) (6)
Any Charter 0.014∗∗∗ 0.014∗∗∗ 0.008∗∗∗ 0.008∗∗∗ 0.007∗∗∗ 0.007∗∗∗
(0.001) (0.001) (0.002) (0.002) (0.002) (0.002)Panel B: By Charter Type
No Excuses 0.022∗∗∗ 0.023∗∗∗ −0.003 −0.003 0.027∗∗∗ 0.028∗∗∗
(0.002) (0.002) (0.003) (0.003) (0.003) (0.003)Regular Charter 0.007∗∗∗ 0.007∗∗∗ 0.018∗∗∗ 0.018∗∗∗ −0.010∗∗∗ −0.010∗∗∗
(0.002) (0.002) (0.002) (0.002) (0.002) (0.002)Baseline Controls Yes Yes Yes Yes Yes YesMatched Cell FE No Yes No Yes No YesN Students 387295 387295 387295 387295 387295 387295Dep. Variable Mean 0.761 0.761 0.326 0.326 0.281 0.281
Notes: This table reports OLS estimates of the effect of charter attendance on academic attainment. We reportthe coefficient and standard error on the number of years spent at the indicated charter school type. Odd columnscontrol for the number of years spent at charter schools not in our main sample, the baseline controls listed inTable 2, cubic polynomials in grade 4 math and reading scores, and 4th grade school x cohort effects. Evencolumns replace 4th grade school x cohort effects with 4th grade school x cohort x race x gender effects. Allspecifications include one observation per student and cluster standard errors at the 4th grade school x cohortlevel. *** = significant at 1 percent level, ** = significant at 5 percent level, * = significant at 10 percent level.See Online Appendix B for additional details on the variable definitions and sample.
33

Tab
le5:
Ch
arte
rS
chool
Att
end
ance
and
Lab
orM
arke
tO
utc
omes
atA
ges
24-2
6
Ave
rage
Earn
ings
Earn
ings>
0Panel
A:PooledResults
(1)
(2)
(3)
(4)
(5)
(6)
(7)
Any
Char
ter
−13
6.932∗∗
−139.1
61∗∗
−156.4
24∗∗
−118.4
60∗∗
−80.
368∗
−0.
001
−0.
001
(53.
930)
(54.
662)
(65.
839)
(47.
052)
(47.4
05)
(0.0
01)
(0.0
01)
Panel
B:ByCharter
Type
No
Excu
ses
51.7
88
54.
346
172.
607∗
113.4
15
167.
942∗∗
−0.
002
−0.
002
(84.
186)
(85.5
83)
(104.5
44)
(72.2
44)
(72.8
43)
(0.0
02)
(0.0
02)
Reg
ula
rC
har
ter
−29
3.7
64∗∗
∗−
299.4
37∗∗
∗−
421.4
39∗∗
∗−
310.5
15∗∗
∗−
286.0
40∗∗
∗−
0.001
−0.
001
(68.
859)
(69.6
22)
(81.1
55)
(58.7
44)
(59.2
29)
(0.0
02)
(0.0
02)
Bas
elin
eC
ontr
ols
Yes
Yes
Yes
Yes
Yes
Yes
Yes
Mat
ched
Cel
lF
EN
oY
esY
esY
esY
esN
oY
esN
on-Z
ero
earn
ings
On
lyN
oN
oY
esN
oN
oN
oN
oB
asel
ine
Imp
ut.
No
No
No
Yes
No
No
No
Ou
tpu
tIm
pu
t.N
oN
oN
oN
oY
esN
oN
oN
Stu
den
ts38
7295
387295
285304
387295
387295
387295
387295
Dep
.V
aria
ble
Mea
n15
696.6
915696.6
921307.9
719998.9
720104.6
00.6
75
0.6
75
Note
s:T
his
table
rep
ort
sO
LS
esti
mate
sof
the
effec
tof
chart
eratt
endance
on
earn
ings
eight
yea
rsaft
erhig
hsc
hool
gra
duati
on.
We
rep
ort
the
coeffi
cien
tand
standard
erro
ron
the
num
ber
of
yea
rssp
ent
at
the
indic
ate
dch
art
ersc
hool
typ
e.A
llco
lum
ns
contr
ol
for
the
num
ber
of
yea
rssp
ent
at
chart
ersc
hools
not
inour
main
sam
ple
,th
ebase
line
contr
ols
list
edin
Table
2,
cubic
poly
nom
ials
ingra
de
4m
ath
and
readin
gsc
ore
s,and
4th
gra
de
school
xco
hort
effec
ts.
Colu
mns
2-5
and
7re
pla
ce4th
gra
de
school
xco
hort
effec
tsw
ith
4th
gra
de
school
xco
hort
xra
cex
gen
der
effec
ts.
All
spec
ifica
tions
incl
ude
one
obse
rvati
on
per
studen
tand
clust
erst
andard
erro
rsat
the
4th
gra
de
school
xco
hort
level
.***
=si
gnifi
cant
at
1p
erce
nt
level
,**
=si
gnifi
cant
at
5p
erce
nt
level
,*
=si
gnifi
cant
at
10
per
cent
level
.See
Online
App
endix
Bfo
raddit
ional
det
ails
on
the
vari
able
defi
nit
ions
and
sam
ple
.See
the
text
for
addit
ional
det
ails
on
the
imputa
tion
pro
cedure
s.
34

Figure 1: Correlation of Labor Market and Test Score Effects
(A) Earnings and Test Scores (B) Employment and Test Scores
βx<-0.024 = 11626.195 (1867.816)
βx>-0.024 = 4602.952 (2733.338)
p-value = 0.090
-500
0-2
500
025
0050
00Ea
rnin
gs E
ffect
-.2 -.1 0 .1 .2Pooled Test Effect
Regular Charters No Excuses
βx<-0.024 = 0.142 (0.068)
βx>-0.024 = -0.050 (0.053)
p-value = 0.062
-.15
0.1
5Em
ploy
men
t Effe
ct
-.2 -.1 0 .1 .2Pooled Test Effect
Regular Charters No Excuses
(C) Earnings and Reading (D) Employment and Reading
βx<-0.006 = 9737.272 (2520.054)
βx>-0.006 = 6212.485 (3551.185)
p-value = 0.513
-500
0-2
500
025
0050
00Ea
rnin
gs E
ffect
-.2 -.1 0 .1 .2Reading Effect
Regular Charters No Excuses
βx<-0.006 = 0.101 (0.113)
βx>-0.006 = -0.024 (0.084)
p-value = 0.482-.1
50
.15
Empl
oym
ent E
ffect
-.2 -.1 0 .1 .2Reading Effect
Regular Charters No Excuses
(E) Earnings and Math (F) Employment and Math
βx<-0.030 = 12131.673 (1665.749)
βx>-0.030 = 2885.596 (1908.152)
p-value = 0.003
-500
0-2
500
025
0050
00Ea
rnin
gs E
ffect
-.2 -.1 0 .1 .2Math Effect
Regular Charters No Excuses
βx<-0.030 = 0.168 (0.041)
βx>-0.030 = -0.077 (0.034)
p-value = 0.000
-.15
0.1
5Em
ploy
men
t Effe
ct
-.2 -.1 0 .1 .2Math Effect
Regular Charters No Excuses
Notes: These figures plot the correlation between school-level labor market effects and school-level empirical Bayesadjusted test score effects. We allow the correlation between effects to vary below and above the median school-leveltest score effect. Observations are weighted by the number of students at each school in the earnings estimationsample. The solid line is estimated at the school x cohort level, with standard errors clustered at the school level. SeeTable 2 notes for details on the sample and variable construction and Online Appendix C for details on estimationof the school effects.
35

Figure 2: Correlation of School Labor Market and Academic Attainment Effects
(A) Earnings and High School Graduation (B) Employment and High School Graduation
βx<0.004 = 14364.147 (3938.499)
βx>0.004 = 20495.087 (4786.047)
p-value = 0.392
-500
0-2
500
025
0050
00Ea
rnin
gs E
ffect
-.2 -.1 0 .1High School Graduation Effect
Regular Charters No Excuses
βx<0.004 = 0.303 (0.070)
βx>0.004 = 0.182 (0.140)
p-value = 0.502
-.15
0.1
5Em
ploy
men
t Effe
ct
-.2 -.1 0 .1High School Graduation Effect
Regular Charters No Excuses
(C) Earnings and 2-Year College Enrollment (D) Employment and 2-Year College Enrollment
βx<0.005 = 22430.050 (10838.592)
βx>0.005 = 2447.936 (1576.210)
p-value = 0.079
-500
0-2
500
025
0050
00Ea
rnin
gs E
ffect
-.1 0 .1Any Two-Year College EffectRegular Charters No Excuses
βx<0.005 = 0.584 (0.152)
βx>0.005 = -0.042 (0.027)
p-value = 0.000
-.15
0.1
5Em
ploy
men
t Effe
ct
-.1 0 .1Any Two-Year College EffectRegular Charters No Excuses
(E) Earnings and 4-Year College Enrollment (F) Employment and 4-Year College Enrollment
βx<-0.007 = 24991.308 (3337.780)
βx>-0.007 = 6547.405 (2113.488)
p-value = 0.000
-500
0-2
500
025
0050
00Ea
rnin
gs E
ffect
-.1 0 .1Any Four-Year College EffectRegular Charters No Excuses
βx<-0.007 = 0.323 (0.083)
βx>-0.007 = -0.058 (0.049)
p-value = 0.001
-.15
0.1
5Em
ploy
men
t Effe
ct
-.1 0 .1Any Four-Year College EffectRegular Charters No Excuses
Notes: These figures plot the correlation between school labor market effects and school-level empirical Bayes adjustedacademic attainment effects. We allow the correlation between effects to vary below and above the median school-levelattainment effect. Observations are weighted by the number of students at each school in the earnings estimationsample. The solid line is estimated at the school x cohort level, with standard errors clustered at the school level.See Online Appendix B for details on the sample and variable construction and Online Appendix C for details onestimation of the school effects.
36
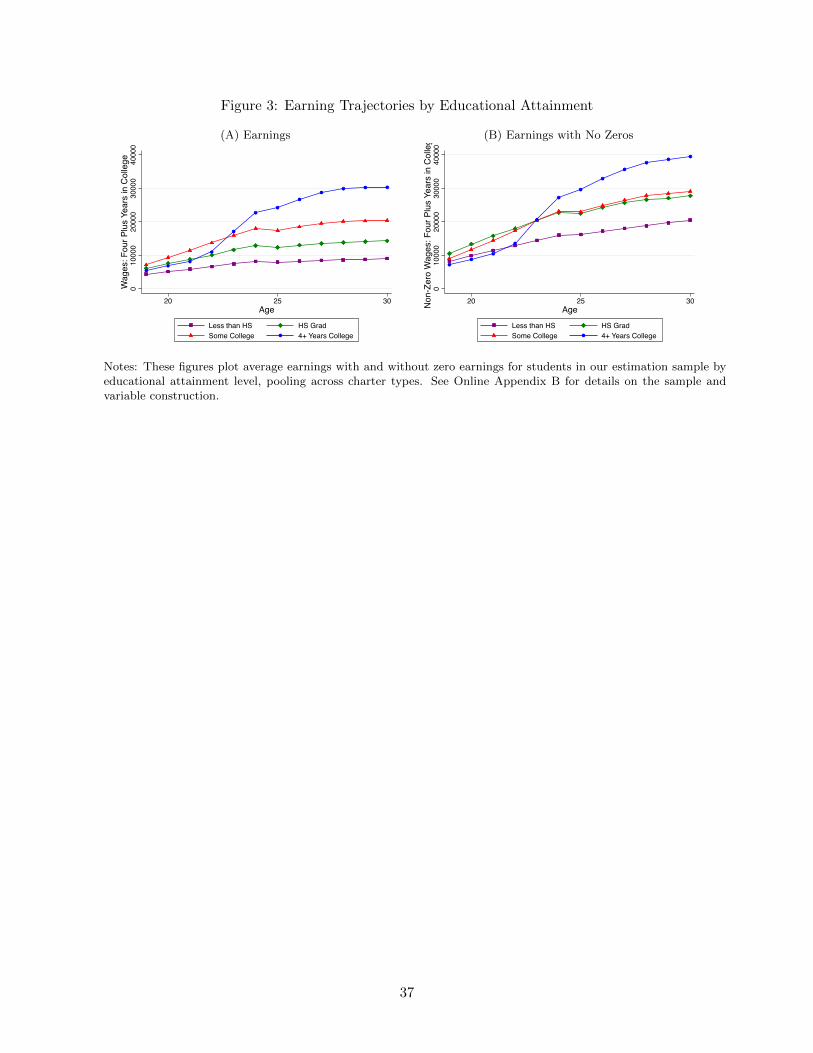
Figure 3: Earning Trajectories by Educational Attainment
(A) Earnings (B) Earnings with No Zeros0
1000
020
000
3000
040
000
Wag
es: F
our P
lus
Year
s in
Col
lege
20 25 30Age
Less than HS HS GradSome College 4+ Years College
010
000
2000
030
000
4000
0N
on-Z
ero
Wag
es: F
our P
lus
Year
s in
Col
lege
20 25 30Age
Less than HS HS GradSome College 4+ Years College
Notes: These figures plot average earnings with and without zero earnings for students in our estimation sample byeducational attainment level, pooling across charter types. See Online Appendix B for details on the sample andvariable construction.
37


